
Abstract
This study developed a series of strategies to reassess the service level of winter road maintenance (WRM) operations on the road network in Perth County, Ontario, Canada. These strategies include rearranging plow routes by sharing the material storage yards and optimizing their numbers and locations while considering operational and legislative constraints such as total circuit time, operating speeds, and the number of available trucks. A methodological framework was then formulated and solved by tackling four practical, yet challenging, tasks in a sequential manner. The first task was to identify existing plow routes and construct a detailed GIS database that was later used for benchmarking the current WRM operations. The second task involved the optimization of existing plow routes, while the third task focused on the optimization of plow routes and depot locations by amalgamating WRM operations of different municipalities within Perth County. The final task was to conduct a clean slate optimization to see the benefits of combining depots and route sharing. The optimization models developed were implemented to transform the existing maintenance operations networks to an optimized, integrated, and unified network of routes, with improved land use utilization for road maintenance yards. The framework then captured the impact of the service order of maintenance routes and arranged routing priority efficiently using the tabu search algorithm. The findings also revealed that, by sharing depots, the county could retire three depots and eight trucks while still meeting legislative requirements, thereby suggesting the potential for substantial monetary savings.
Typical snow and ice control strategies focus on removing snow and ice from the roadway and spreading materials such as chemicals or abrasives over a given service area to increase the road friction via a hub-and-spoke system whereby multiple trucks work from a central hub. Properly utilized and efficiently executed snow plowing operations can dramatically alleviate the disruptive impact of snowstorms, and improve overall traffic safety and mobility during winter months ( 1 ). A study conducted by Usman et al. showed that the average number of accidents was reduced by 31.2% after winter maintenance work, such as plowing, was carried out, in contrast to when little maintenance work was done ( 2 ). Common winter road maintenance (WRM) activities include snowplowing, salting, sanding, de-icing, and anti-icing operations that combat unsafe road conditions caused by inclement winter weather events ( 3 – 5 ).
Municipalities cannot ensure the highest level of service on all road segments because of limited resources and required respond times. To objectively measure the performance of snow removal routes, the municipalities set minimum maintenance standards (MMS) restricting the allowed service time limit allotted to different road classes. MMS can be defined as the maximum allowable time for addressing snow accumulation on roadways after the end of the significant weather event ( 6 ). For example, the Alberta and Ontario governments have set 2 h and 3 h, respectively, as the maximum response time for their highest class of highways, which means the snow-covered roads need to be serviced within those time frames. These operations are expensive and take time, thus transportation agencies have long been looking for ways to optimize their resource allocation and routing strategies to efficiently promote safer winter trips.
Sullivan et al. proposed an iterative heuristic algorithm to deal with the snow and ice control system concerning network clustering, vehicle allocation, and capacitated vehicle routing ( 7 ). Their findings show that vehicle reallocation, in addition to increasing the truck fleet size, can result in a more effective snow and ice control strategy. While previous research contributes to the snow removal routes optimization within each municipality, it is still unknown how snow removal activities could be improved through cooperation between nearby municipalities. Liu et al. gained insight into the effect of fleet size by analyzing the different number of routes performed by the trucks ( 8 ). The level of benefit for the various numbers of trucks in the system was measured, and it revealed that adding trucks will not always result in an increase of benefit, and that the optimal fleet size could instead be achieved by enumerating a list of truck numbers. Despite many efforts to optimize snow removal strategies, most of these papers do not consider the feasibility of the designed snow removal routes and ignore operational rules and legislative restrictions, such as turning restrictions and road priority. On the other hand, it is still unknown how snow removal activities can be improved through cooperation between nearby municipalities.
To fill both the research and practical gaps mentioned above, this study aims to examine the potential benefits of inter-municipal cooperation using winter maintenance data from Perth County, Ontario, Canada, where there is a total of six municipalities. Each municipality has developed their own independent WRM strategy based on their delineated service area, available maintenance resources, and crew resources. While the optimizations achieved within each independent municipality help mitigate the detrimental effect caused by adverse weather, these individual strategies may fail to see the full picture across the entirety of Perth County. Therefore, agencies from these municipalities want to see the potential benefits of eliminating unbalanced snow removal strategies through a globally optimized holistic WRM strategy. This study considers the entirety of Perth County as a single study area and examines how the collaboration between municipalities can help reduce maintenance costs or improve service levels of snow removing via optimizing snow removal routes under different strategic scenarios. Specifically, this study focuses on answering the following three questions.
How efficient is the current snow and ice control strategy compared with a theoretical optimal one?
What are the potential benefits of sharing the existing depots and combining their resources, compared with the current WRM operations?
How does the performance of having shared depots compare with an all-new, and optimized, depot location setup?
The remaining paper is organized as follows: the next section provides the mathematical formulation of the proposed problem, solution algorithm, and basic information about the case study. The section after that presents the research results and discussion, followed by the final section that summarizes conclusions and recommendations for future research.
Methodology
Designing optimal routes for snow and ice control trucks is a core problem in the field of WRM. For any given road network, any combination of constraints, such as road priority, turning restrictions, route length, loading capacity, truck type, and other constraints, presents a challenge to finding a feasible route ( 9 , 10 ). Therefore, it is crucial to develop an efficient methodological framework targeted at solving routing problems by taking into account many legislative and operational constraints (e.g., MMS, turning restrictions, material usage, distance traveled) by employing heuristic search algorithms in an attempt to determine the optimal solutions.
Optimizing Winter Road Maintenance (WRM) Operations—the Idea
The proposed framework can be used to fulfill research objectives thereby further demonstrating its usefulness in practical applications. It is broken down into four tasks as shown in Figure 1.
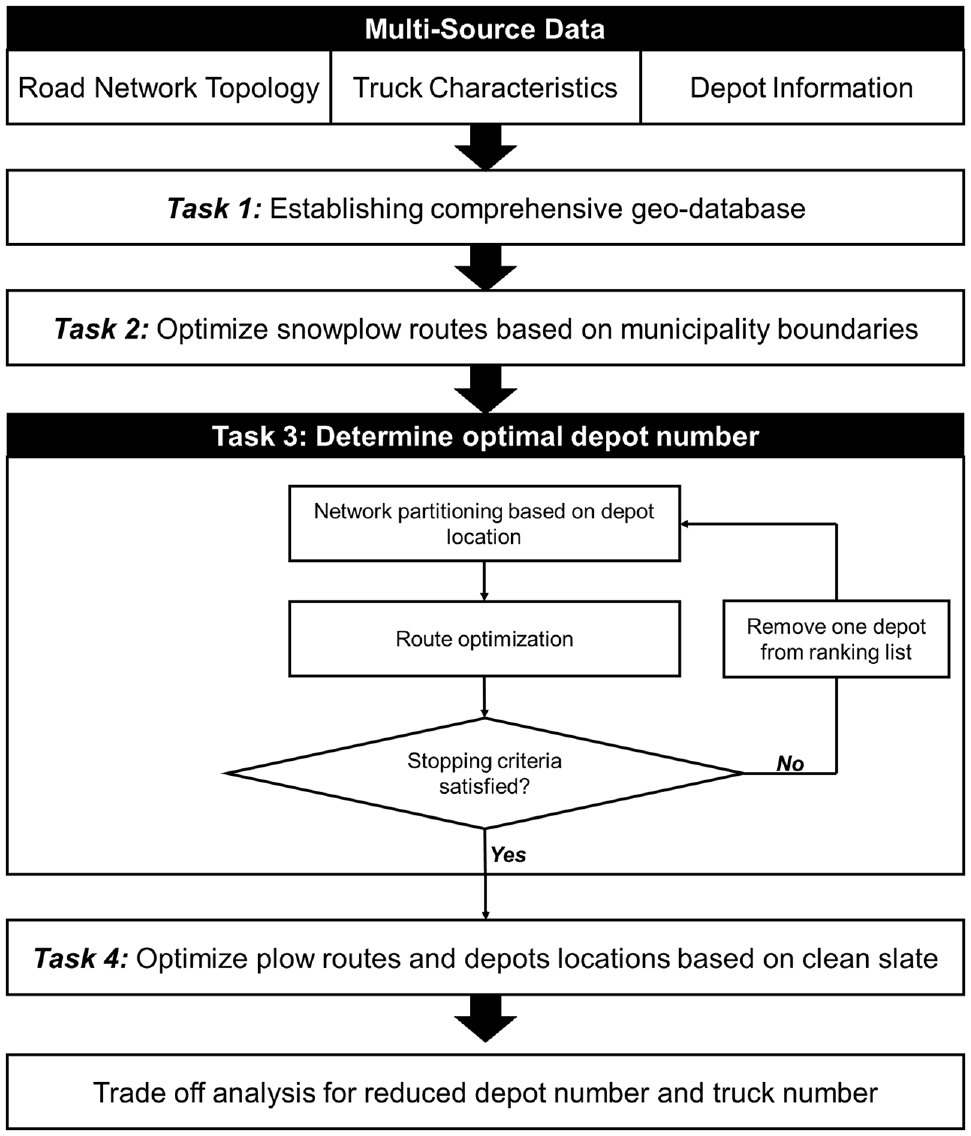
The proposed framework for optimizing winter road maintenance (WRM) operations.
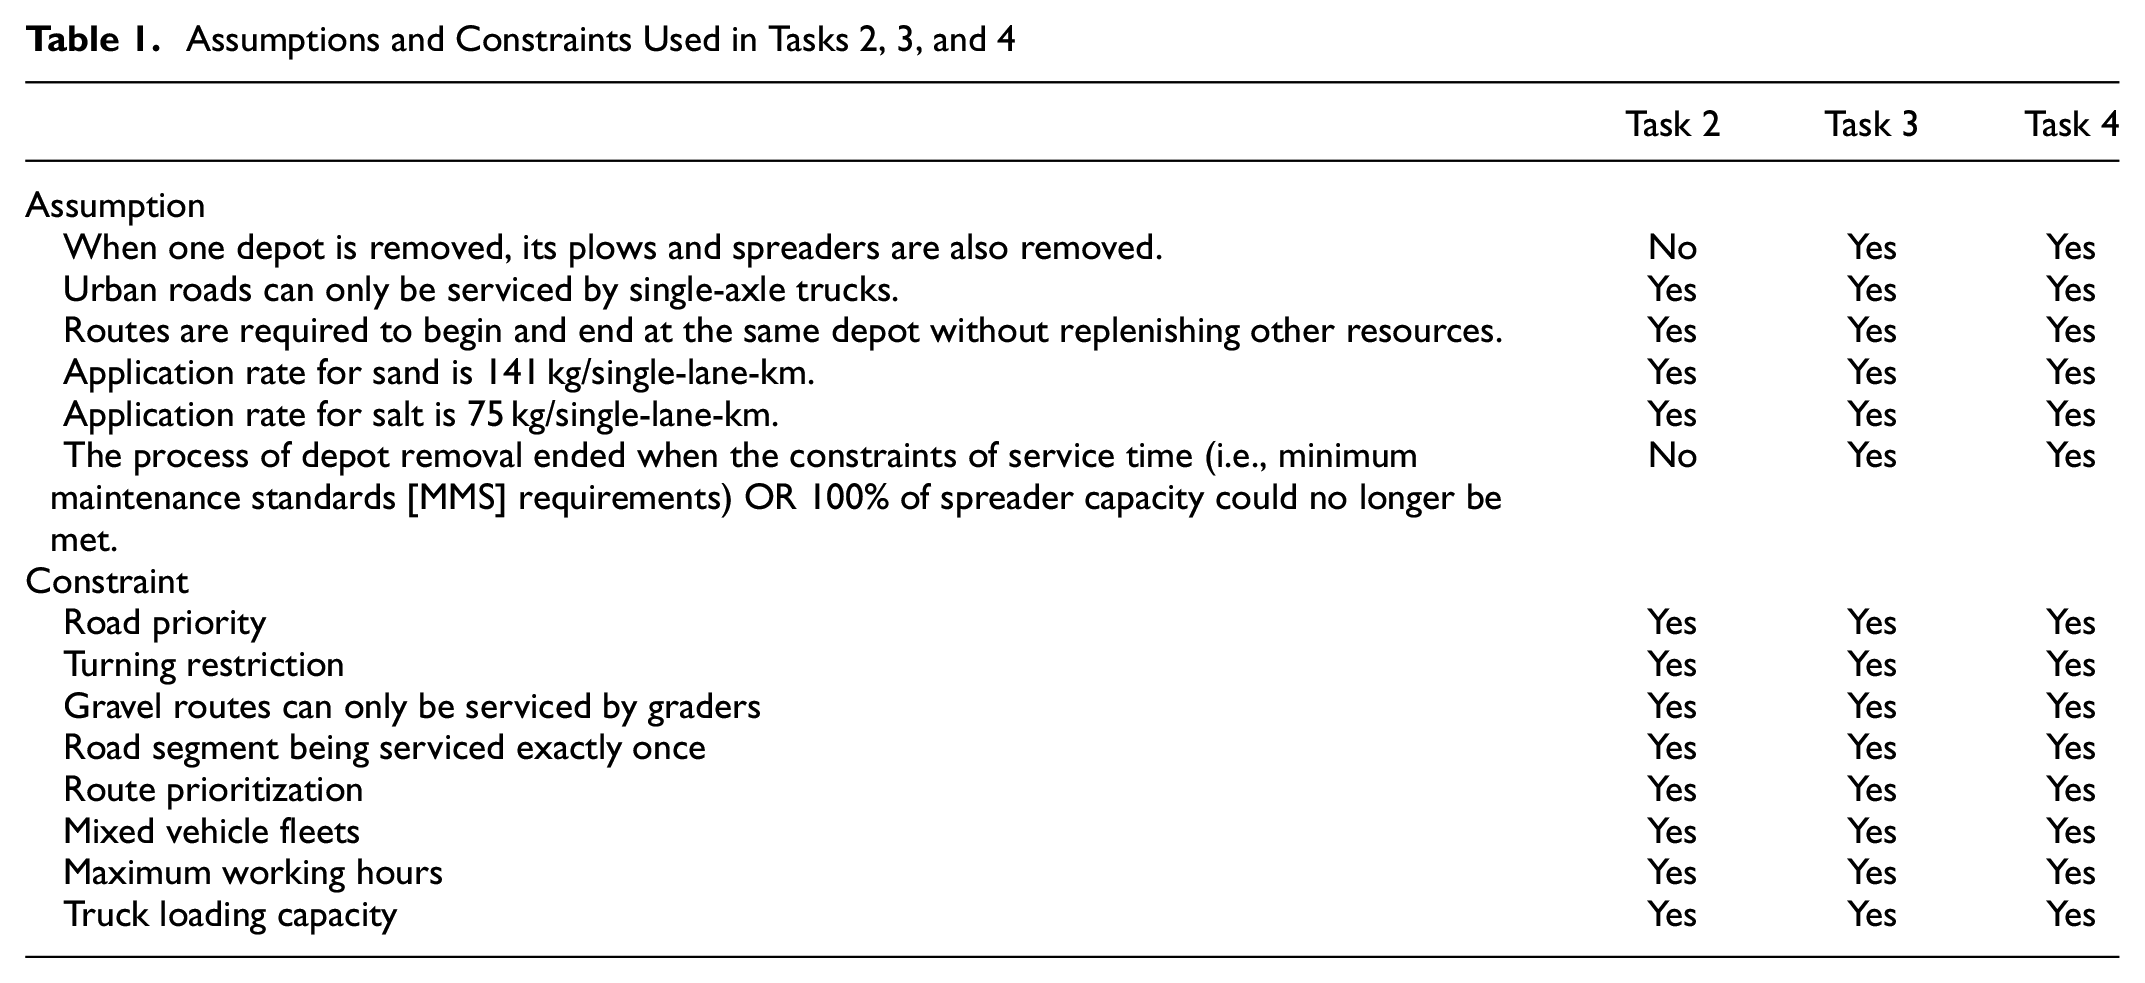
The first task (Task 1) is data collection and management. The data came in a multitude of files in different formats and it required additional work to combine all the separate information from each municipality. Once combined, it was then used to construct a comprehensive GIS database by integrating road topology data, depot information, and truck characteristics as was shared by the six independent municipalities. The established GIS database includes detailed records of current snow removal operations thus allowing it to establish a performance baseline (i.e., benchmark) using existing routes and available resources. Based on the constructed geo-database, Task 2 establishes the current level of efficiency with respect to the theoretical optimized routes. This is done by optimizing routes with the objective of minimizing the total deadhead distance while simultaneously satisfying a set of specific operational constraints within the existing municipal boundaries as listed in Table 1.
Assumptions and Constraints Used in Tasks 2, 3, and 4
A comparison is then made between the current snow removal strategy and the results of Task 2 to determine the level of efficiency of the current snow removal operations. This will also provide a benchmark which can be used to assess the optimized snow removal routes generated when municipal boundaries are no longer considered in Task 3. Task 2 could be regarded as the optimal snow removal routes achievable based on the current boundary restrictions and depot setup.
Task 3 explores the potential benefits of inter-municipality cooperation if the restrictive municipal boundaries were removed, instituting shared routes and joint operations, while utilizing existing depots. The cooperation between municipalities (sharing maintenance resources) allows the retirement of some depots to reduce fixed costs. When optimizing depot locations, selected existing maintenance depots were removed one-by-one consecutively in the priority order provided. For each configuration of remaining depots, plows routes were re-optimized to service the entire network. To reduce the complexity associated with route optimizations and to overcome the potential issues that can arise from combining operations, the following decision rules, as shown in Table 1, have been added.
Finally, Task 4 evaluates the shared depot result by conducting a clean slate optimization of plow routes and depot locations. By using the determined optimal number of depots found in Task 3, Task 4 will hypothetically relocate those depots at optimal locations, as if they were all brand new. Based on this new optimal configuration, all trucks were reallocated while regenerating optimal snow removal routes. This is known as the all-new optimal routing scenario, which provides a measure of how optimal the current setup is, compared with the theoretical optimal strategy.
Data Preparation (Task 1)
The winter maintenance operation geo-database for the agencies contains six municipalities with 2,972 intersections, 8,750 roads, and 46 maintenance routes totaling over 4,000 km. The six municipalities are named Perth County, Perth East, Perth South, North Perth, West Perth, and St. Marys. A total of 13 depots and 45 trucks are operated to provide winter maintenance services for the entire road network.
Road Network Topology
GIS layers were extracted from data files provided by the Government of Ontario (https://geohub.lio.gov.on.ca/datasets), including administrative boundaries and road networks. Figure 2 shows the service boundaries for each municipality and existing depots. The roadway in Perth County consists of highways, county roads, and municipal roads. There are five road classes in the system to distinguish their level of priority, with each road class having a specific service time window. The MMS can be seen as a service time limit for treatment of snow or ice, and it varies based on different road classes. The vicinity of hotspot areas (e.g., hospitals, schools) has been integrated into the highest class to ensure they receive timely service. According to City of Toronto Act, the MMS for highway class 1–5 are 4 h, 6 h, 12 h, 16 h, and 24 h, respectively ( 6 ). Since highway class 1 is not included in this study scope, this class is excluded in the following analysis.
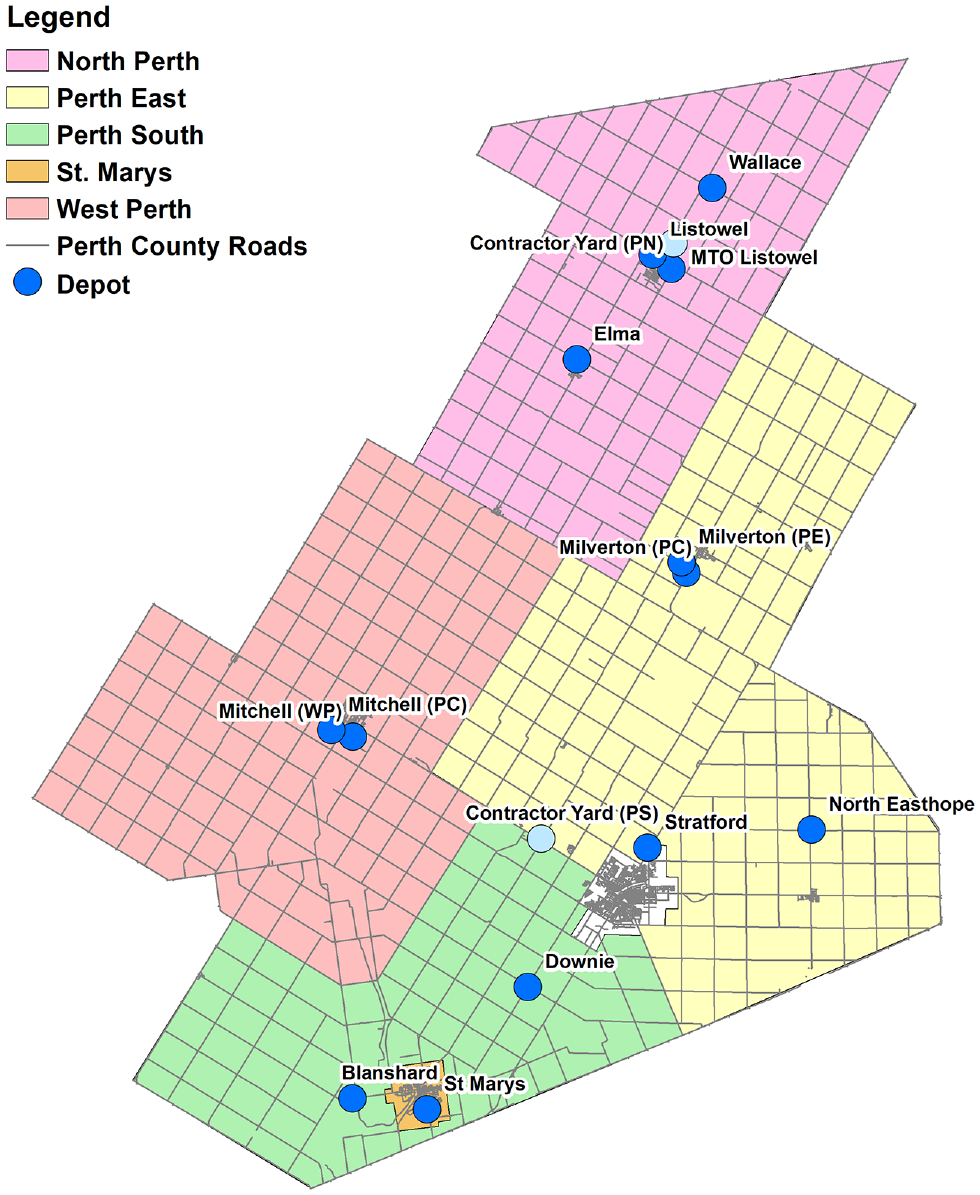
Service boundary for each municipality.
Depots Information
In its current setup, there is a total of 13 depots that are responsible for supplying the 45 trucks and materials for servicing the entire road network, and each depot varies in its WRM capacity. Each depot underwent a comprehensive utility assessment and was ranked according to their storage capacity, land use, environmental sensitivity, and accessibility of services, as shown in Table 2.
Ranked Depots for Perth County
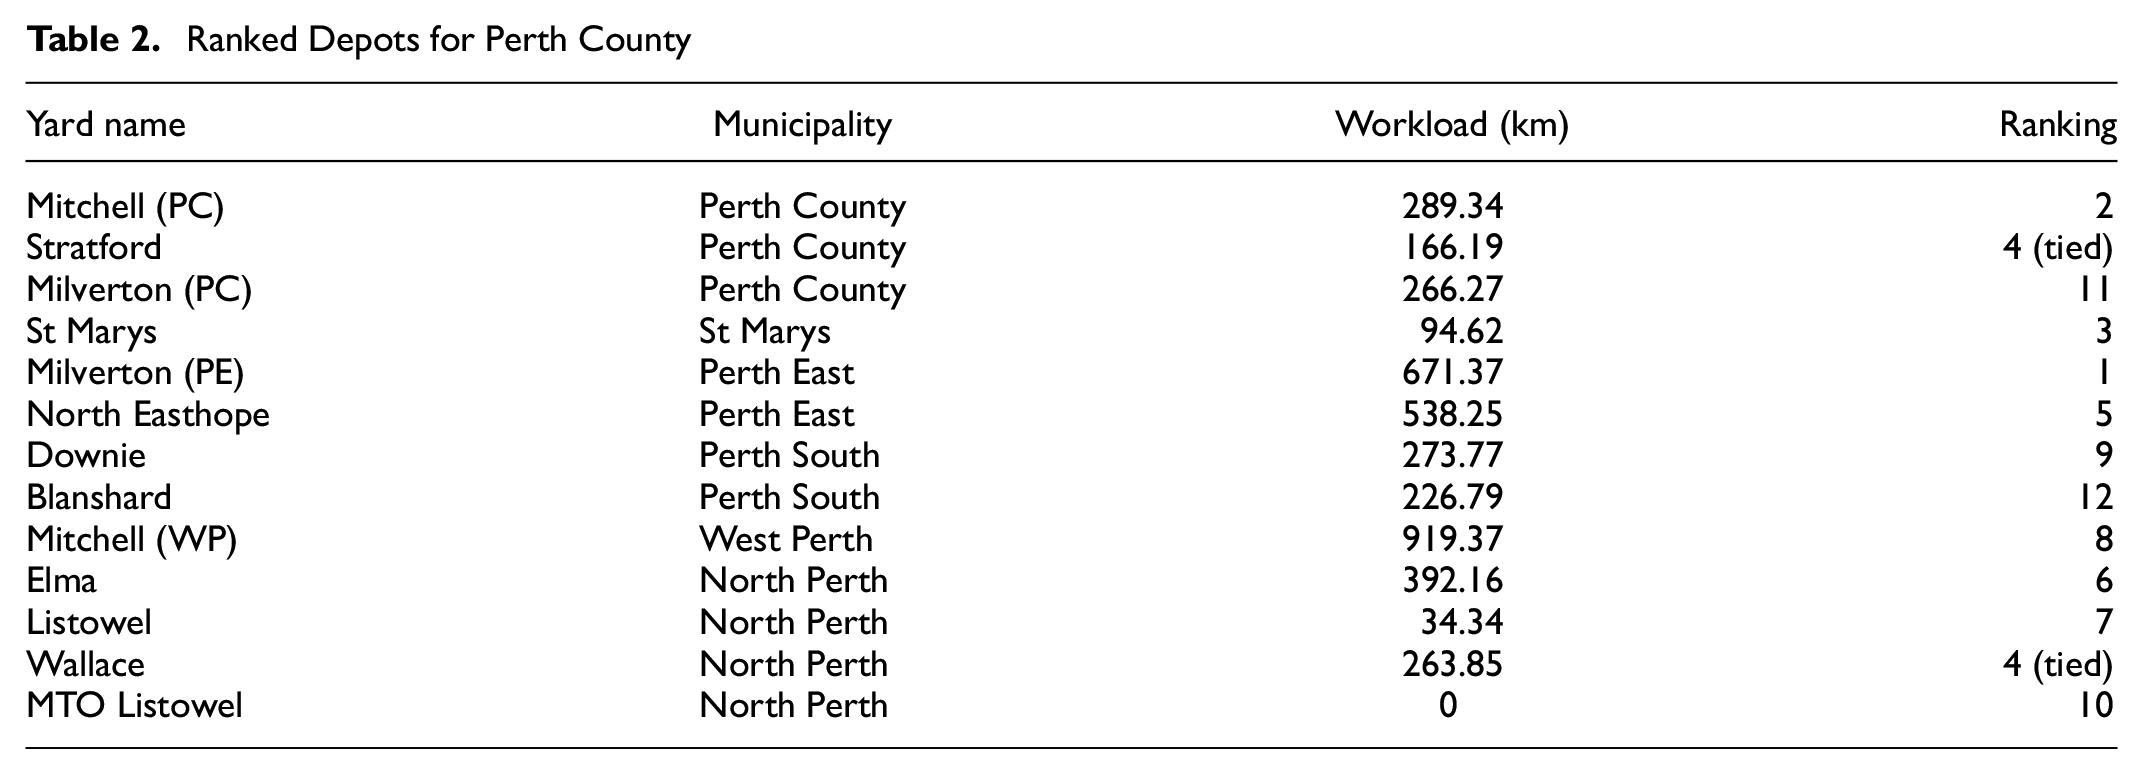
A depot’s workload is defined as the total length of roads that trucks need to cover when assigned to that depot. For example, Mitchell has an assigned workload of 919.37 km, meaning that trucks in Mitchell need to service this road length. Looking at the current workload for each depot in Table 2, it is clear that the workload varies considerably from one depot to another, with Mitchell having a disproportionately larger workload compared with other depots. Alternatively, MTO Listowel appears to have a 0 workload because this depot serves as a material restock depot for trucks requiring refills during ongoing maintenance operations. The assignment of service trucks to each depot varies by workload, road class configuration, and other factors.
Truck Characteristics
The client agencies within Perth County have a fleet of 45 trucks that are assigned with specific routes based on their serviceability and serviced road surface type. There are two types of equipment adopted in snow removal service, namely graders and combo units. Graders are primarily used to service gravel roads and can only perform snow removal. Combo units are trucks that come equipped with a combination of snowplowing attachments and material hauling/spreading capabilities. These units are used on paved roads to perform both snow removal and spreading activities, sometimes simultaneously.
In the modeling exercise, representative rates of 75 kg/single-lane-km for road salt and 140 kg/single-lane-km for friction sand advised by Perth County were used in planning snow removal routes. The combo-unit trucks are further sub-classified as either a single-axle, tandem, or tri-axle truck, which is indicative of the truck’s physical size and weight and used as a criterion to limit where they can operate. Single-axle trucks are used to remove snow on urban roads that are narrower and have smaller radii in their road geometry. Tandem and tri-axle trucks are much larger units which limits their usability in an urban environment because of geometry and weight restrictions, thus they are primarily used to service rural or county roads and larger highways. The route optimization process should also ensure that the appropriate trucks are assigned to their corresponding road type, and a violation of this would result in an impractical route assignment.
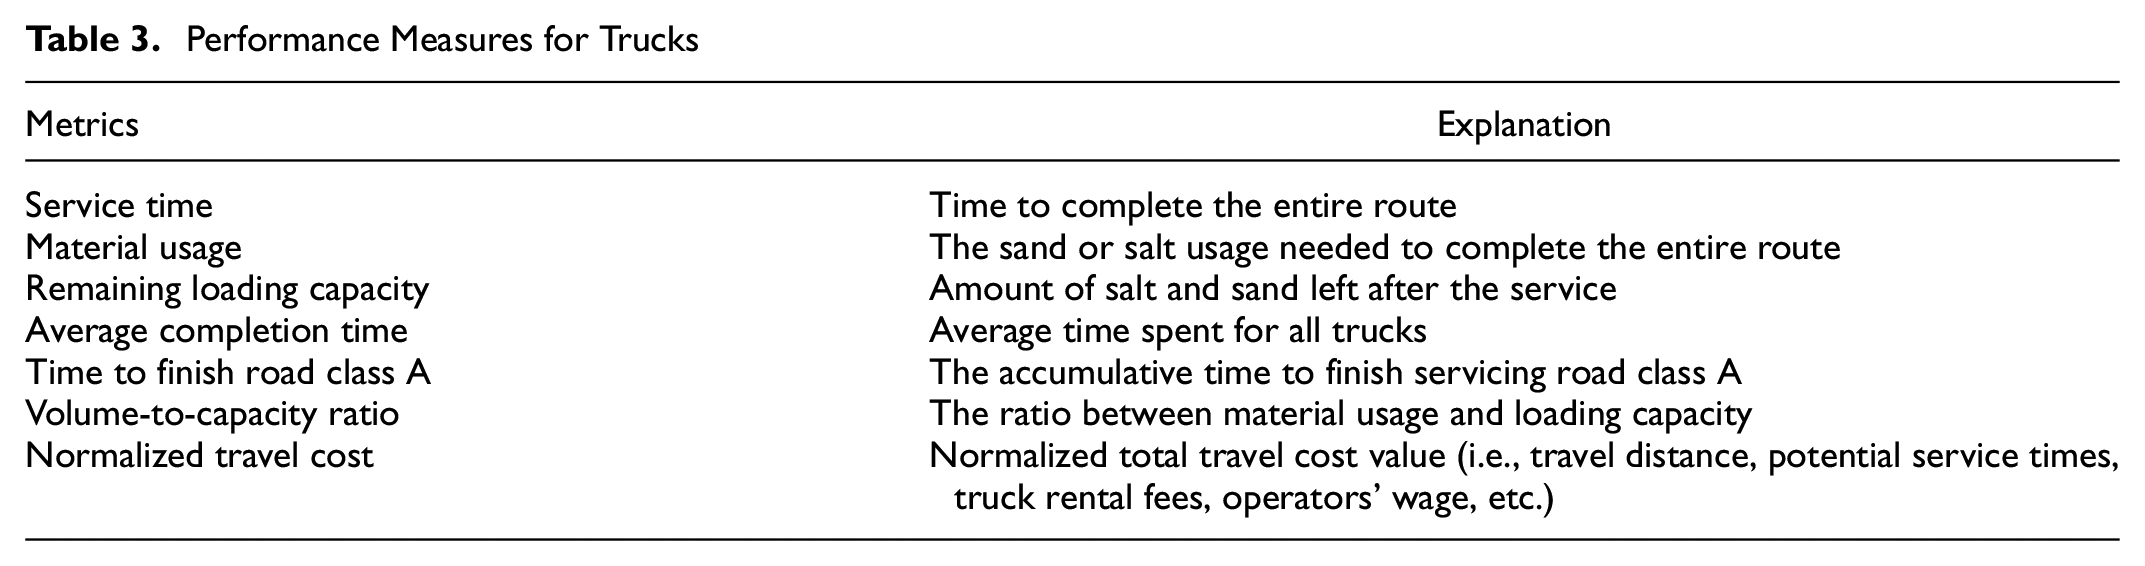
To account for differences in truck size/type and operational limitations, three constraints were instituted during the performance-level testing of the generated maintenance strategy. First, higher-classed roads are given priority to be serviced than the lower-classed roads. Second, U-turns and left turns should be eliminated, but if they are unavoidable, then they have to be conducted at designated locations. Finally, the completion times for the routes need to satisfy the prescribed MMS while ensuring that the material usage does not exceed the trucks’ material capacity. Table 3 summarizes other metrics that were used to compare the performance of the designed routes under different depot removal scenarios.
Performance Measures for Trucks
Mathematical Formulation (Tasks 2–4)
Consider a road network where k number of trucks are stationed at one maintenance depot. The strategic planning basis of this study assumes that all segments are snow-covered. The goal is to service all the road segments exactly once while satisfying all operational constraints imposed. As the objective function for the maintenance operation is set to correlate with service precedence, this problem is defined as the k-truck plow with precedence problem (K-PPP).
K-PPP differs from traditional routing problems in that the objective function is not only affected by the coverage of routes but also by their precedence. The formulated K-PPP is used to consider the optimization of route precedence. The original optimization formulation constructed in the authors’ recent efforts only took into account one depot with multiple trucks ( 11 ). However, this would run into several challenges, as the goal of this study is to determine feasible routes that can be used in the real world.
The first challenge arises because, instead of solving the routing problem for one depot, it now needs to account for multiple depots which complicates the arc routing problem. Particularly, in this study, the snow removal routes need to be optimized for multiple depots while ignoring all municipal boundaries. As a result, this change expands the search space and increases the complexity of the problem. The second challenge faced is a result of several practical requirements imposed by district officials during the route optimization process for snow removal and material spreading activities. These requirements could be minor, such as instituting turning restrictions and road prioritization, or strict, such as service time limits by road class or different equipment where salt or sand are used.
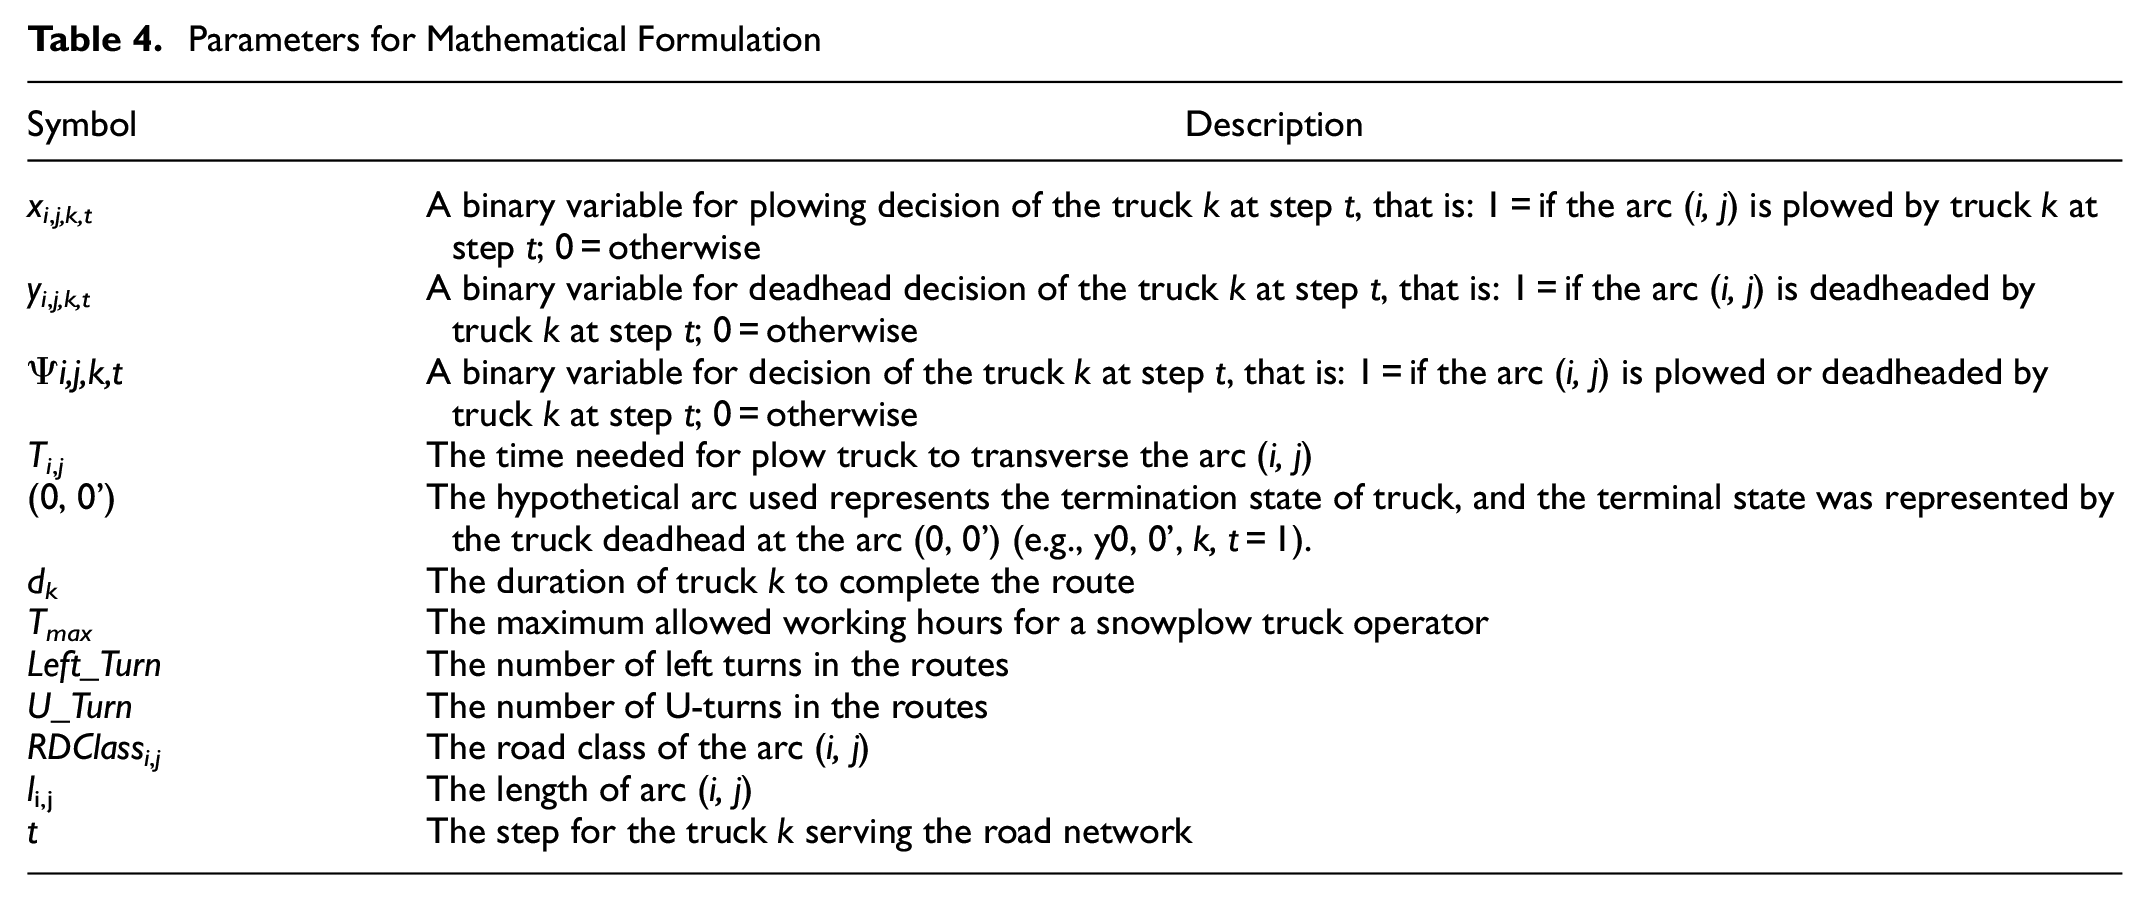
Therefore, the objective function and constraints listed below have been extensively revised to reflect the need for and efforts to meet both the operational and legislative requirements as set forth by Perth County. The parameter and decision variables for the proposed mathematical formulations are summarized in Table 4.
Parameters for Mathematical Formulation
Subject to the following constraints:


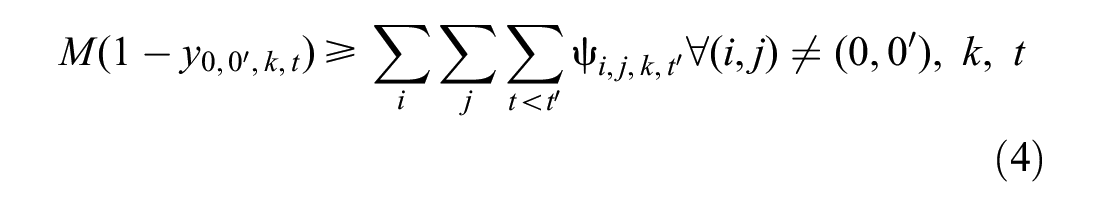


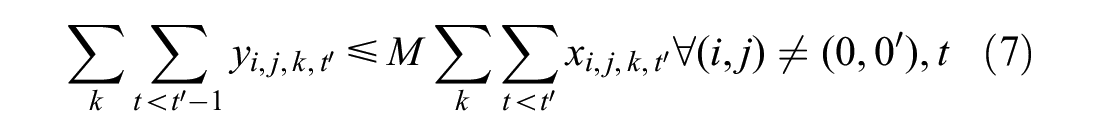


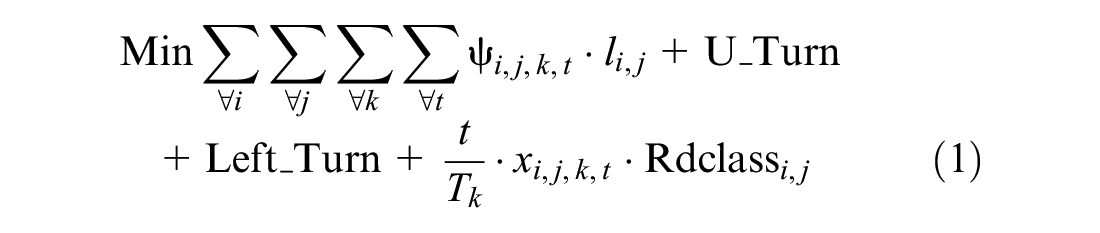
The overall process seeks to minimize the overall distance while reducing the number of undesired turning movements, and giving route priority to the selected roads. Here, the objective function value (1) would be affected by route precedence. The proposed model can generate various optimal routes for any variation of the objective function based on any desired criteria, which can be adjusted by maintenance authorities with excellent generalizability. Constraint (2) ensures that every arc in the graph is serviced exactly once. Constraint (3) states that all the trucks should start at the depot, while constraint (4) ensures that the vehicle ends at the depot by traversing the hypothetical arc (0,0'). The deadhead on the hypothetical arc is used to represent the final arc of the route (e.g.,
Turning Restriction
Turning movements can be dangerous as they often create movement conflict points that could result in a collision. For winter maintenance vehicles, the risks are compounded because they are quite heavy and large, meaning that the slow-moving vehicles require a lot of space to maneuver. In addition, left turns while plowing to the right side can create a windrow of snow blocking the intersection. Therefore, turning restrictions are put in place to mitigate the risks to the general public and the operators. To model turning movements in a computer-aided system, the turning angle is used to determine the various types of turning behavior (left turn, right turn, go straight, and U-turn) during operations. The turning angle can be understood as the angle from the truck’s oncoming direction to the route’s outgoing path. Figure 3 illustrates the turning angle for the route sequence 207→224→295.
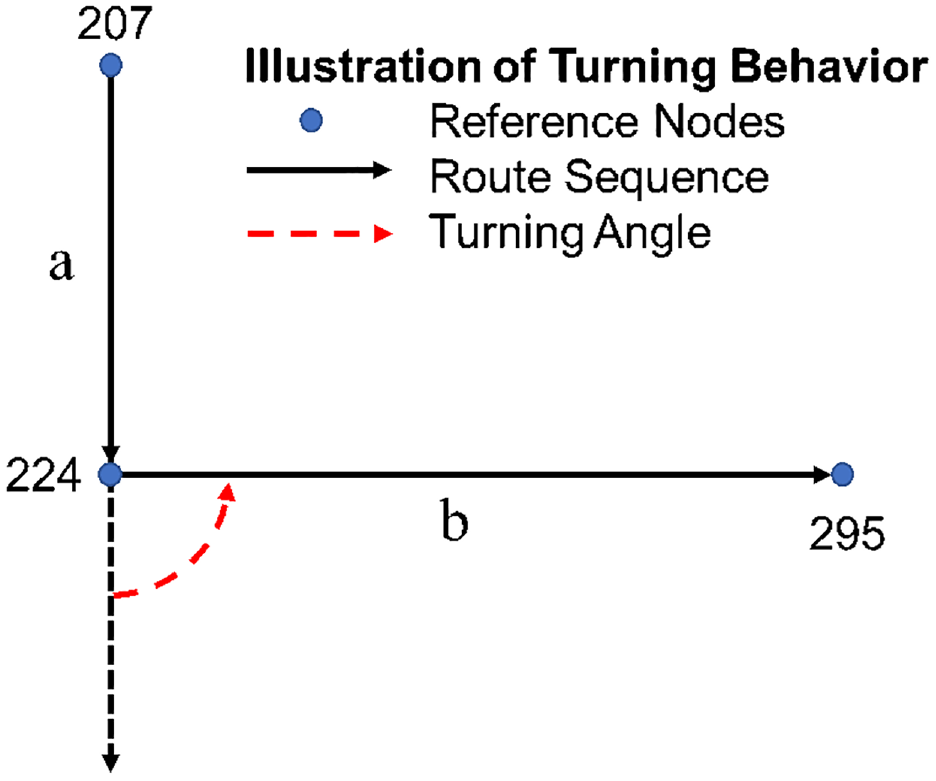
Illustration of turning angle calculation.
Assume

Let

If


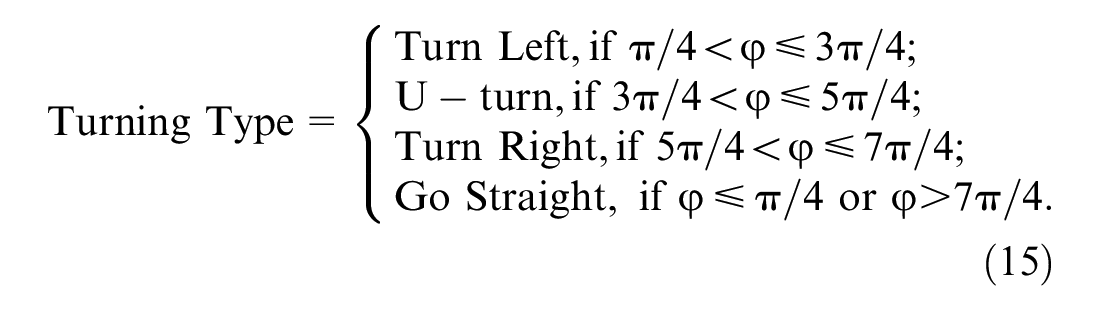
After determining the turning angle, the next step is to convert that turning angle into a rotation angle which is then used to detect if the movement is a possible turning behavior. Then, the following equation is:

Various thresholds were defined for different rotation angles to differentiate between left turn, right turn, and U-turn behaviors. The thresholds are as follows:
Road Prioritization Restriction
Road prioritization means prioritizing service on roads with a high traffic over roads with a low count. This ensures that the best level of service is met for all road segments while meeting self-imposed client constraints. Equation 16 sets the precedence constraint to ensure that higher-classed roads are completely serviced first:
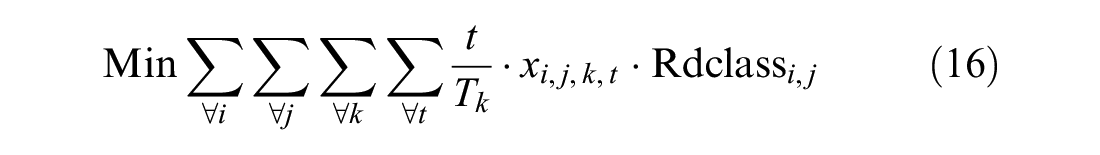
Equation 16 will rank the different routes generated from the heuristic algorithm according to their road prioritization performance.
Solution Algorithm (Tasks 2–4)
Snow removal and ice control routes optimization strategies consist of network partitioning and optimal route assignments. The network partitioning process partitions the entire network into a manageable size for computer manipulations and calculations. The road network is partitioned by considering the total maximum distance based on the availability of trucks at each depot. Once the routes are partitioned, the optimal route assignments or optimizations were conducted through thousands of iterations to find an optimal solution by minimizing the total deadhead distance for all trucks while satisfying the operational constraints and decision rules listed in the following section.
Network Partitioning
In practice, the road network may have multiple depots. To reduce the computational complexity, the whole road network was first partitioned into a set of independent sub-networks with only one depot. The multi-depot network is then converted into several single-depot networks, and the proposed framework of K-PPP could be formulated to solve the issue raised here. Furthermore, the divided sub-network helped reduce the solution space into manageable sizes for saving computational time. As network partitioning is not the major focus of this study, the detailed procedures involved in this step can be found in Xu ( 12 ).
Optimal Route Assignment
After network partitioning, the modified tabu search algorithm developed in the authors’ previous work was used to obtain the optimal snow removal routes for each single-depot road network ( 11 ). The tabu search algorithm is known for being one of the most widely adopted metaheuristic algorithms which are able to generate near-optimal solutions within a reasonable time period for problems that are analytically intractable or very difficult to solve in polynomial time because of large-scale instances ( 13 – 15 ). Similar to other metaheuristics, tabu search starts with a set of initial solutions and progresses iteratively by searching for alternative solutions. During the search process, it uses a set of predefined local search schemes and unique memory structures, allowing solutions to escape from a local optimum (maxima/minima) without being stuck in those suboptimal traps.
Depot allocation (Task 4)
Depot allocation analysis begins by hypothetically removing all existing maintenance yards and then generates an optimal configuration sequentially for a given number of yards (1–13) by applying the classic location modeling method, the p-median method ( 16 ). P-median is set to locate p number of facilities such that it minimizes the distance between the demand nodes and the nearest service facility. The algorithm iteratively searches for optimal locations that will minimize the overlapped routes, or, in other words, maximize the route coverage of the road network. In this case, the facilities are the maintenance depots and the demand nodes are the mid-points of the arcs representing the road network.
Results and Discussions
To complete all the tasks as outlined in Figure 1, the python-coded algorithm made use of the supercomputer “beluga” managed by Calcul Québec and Compute Canada. With a 2.4 GHz CPU and 16 GB of memory, it took around 5 h for the proposed algorithm to run its course for each optimization case. The results are presented as follows.
Optimization of Plow Routes with Existing Municipal Boundaries (Tasks 1 and 2)
In Task 1, the established geo-database contained four categories of data that required preparation from their various sources. These included the truck characteristic data, maintenance route data, and depot information from district officials, and the road network layer data from the Ontario Road Network (ORN). The base layer was set using the road network map from ORN by including the number of lanes, road segment length, one-way/two-way information, and speed limit information. The crew information and maintenance data were provided in pdf and excel file formats that needed to be converted into a geo-database format before they could be incorporated into the working geo-database in ArcGIS. The depots were on their own database layer where detailed depot information, such as the number of available trucks and resource storage, was embedded into the layer. After establishing the geo-database, the next step is to optimize the snow removal routes within the existing municipal boundaries. In this study, the road network was first divided into multiple independent sub-networks using the above-introduced network partitioning method. The optimal route is then generated by assigning routing sequences. Figure 4 describes the cumulative operating hours within each route versus the MMS. The result suggests that the truck will finish the service for each road class well before the MMS requirement.
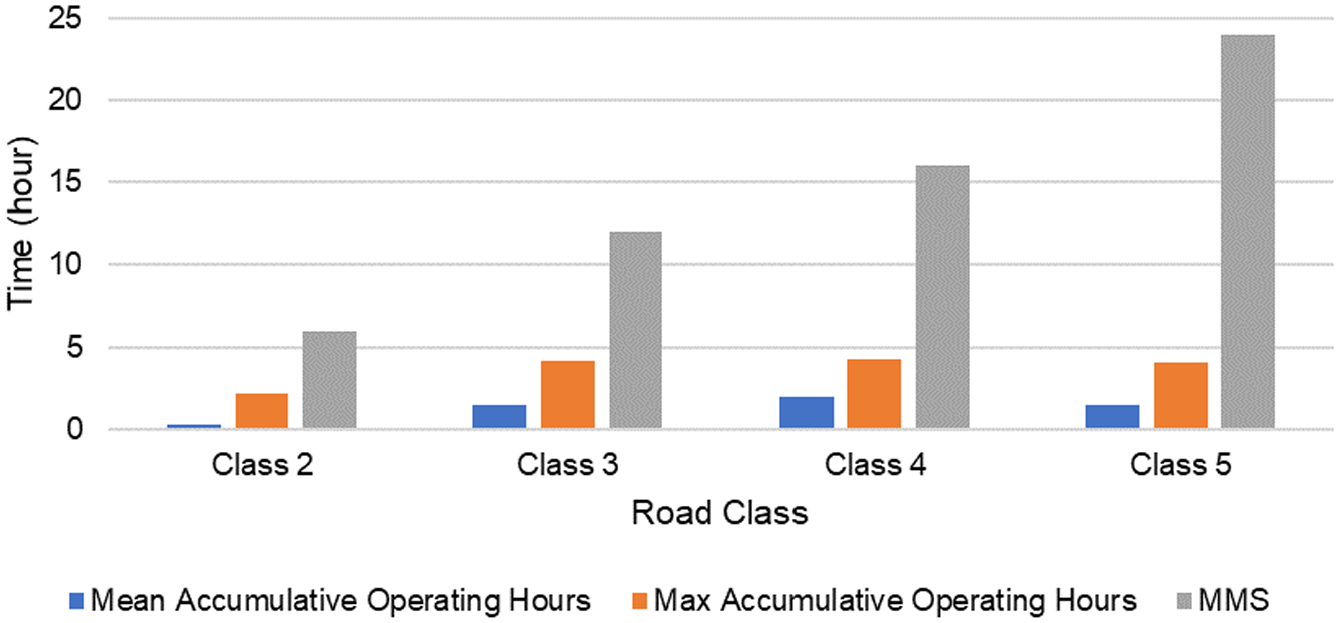
Accumulative operating hours by road classes (Task 2).
The results from Task 2 provide a benchmark to assess the optimized routes while also providing Perth County with a measure of efficiency for their current routing scheme. If maintaining the current municipal boundary and depots, the total route lengths could be decreased by 3.2% by changing the routes for each truck while meeting the requirement of material usage and other operational rules.
Optimization of Plow Routes by Inter-Municipality Collaboration (Task 3)
In Task 3, the maximum possible benefits achievable under the hypothetical situation where municipalities collaborated with each other while keeping the current fleet characteristics were found. The collaboration between municipalities is defined as the sharing of the service area and maintenance resources. In doing so, the resources could be reallocated or removed. The methods for collaboration are investigated using the following scheme: As the maintenance resources are shared amongst agencies, some depots can possibly be retired to reduce the maintenance cost, as long as the new maintenance strategies are feasible and service levels are maintained.
Therefore, the maintenance yard removal scenario retired yards from service according to the yards’ weighted function rank as shown in Table 5, and the snow removal routes will be generated for each depot removal condition. Before the optimization, the MTO Listowel and Contractor’s yards were eliminated first, because no service truck was mobilized in these depots.
Yard Removal Process
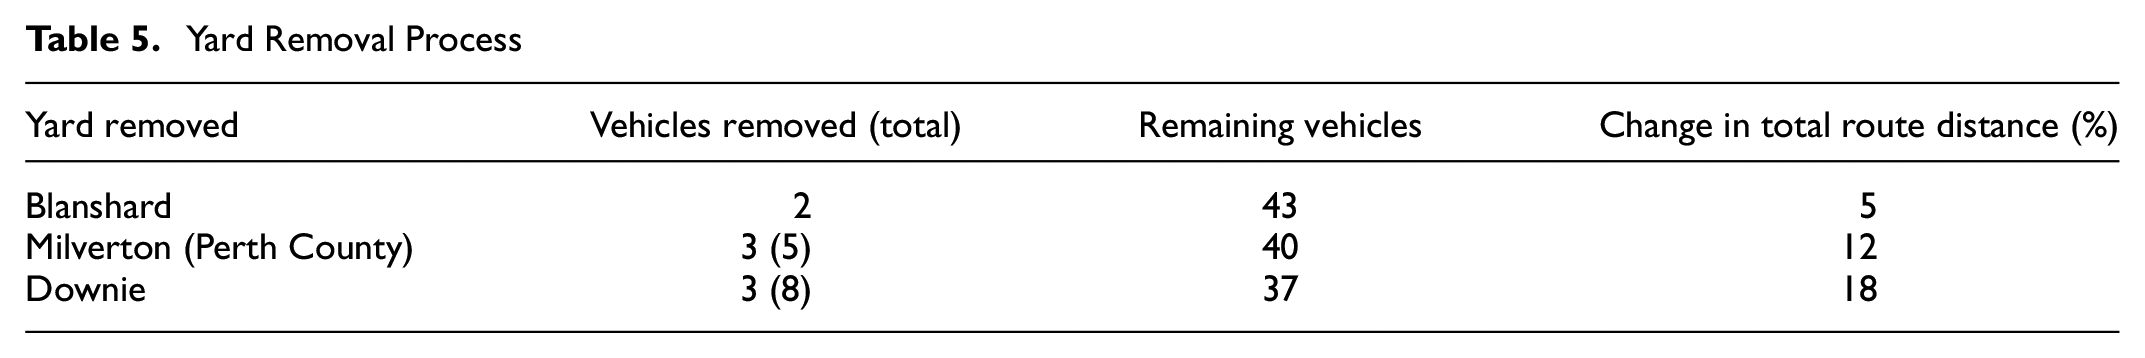
Every time a maintenance yard was removed from service, its assigned spreaders or plows were also removed, and its routes were assigned to the nearest remaining yards. The process was repeated until the optimized routes no longer met the constraints of the MMS service time or the spreaders’ material capacity to complete the route. The optimized result suggests that removing the boundary could result in a 2% reduction in overall traveling distance. This result suggests that ten depots with a total of 37 vehicles is the least viable solution for depot removal. Table 5 also shows that, on average, the route lengths will increase by 5%, 12%, and 18% if removing one, two, or three depots, respectively. Intuitively, the decrease in fleet size and depot numbers would result in longer average route lengths and an increase in the chance of violating the service standards. If the maintenance standard cannot meet the requirement of local government, the deteriorated road surface will impose a detrimental threat to the safety and mobility of trip makers.
Figure 5 lists the average remaining loading capacity for sand and salt for each depot removal scenario. For the three-depot removal scenario, the material usage for salt will exceed the truck loading capacity because of the limited capability of the salt spreading truck. The results suggest that the stopping criteria is met when four depots are retired, as the average sand usage would exceed the available truck capacity. Also, the service time for each road class met the minimum maintenance standard for each depot removal scenario.
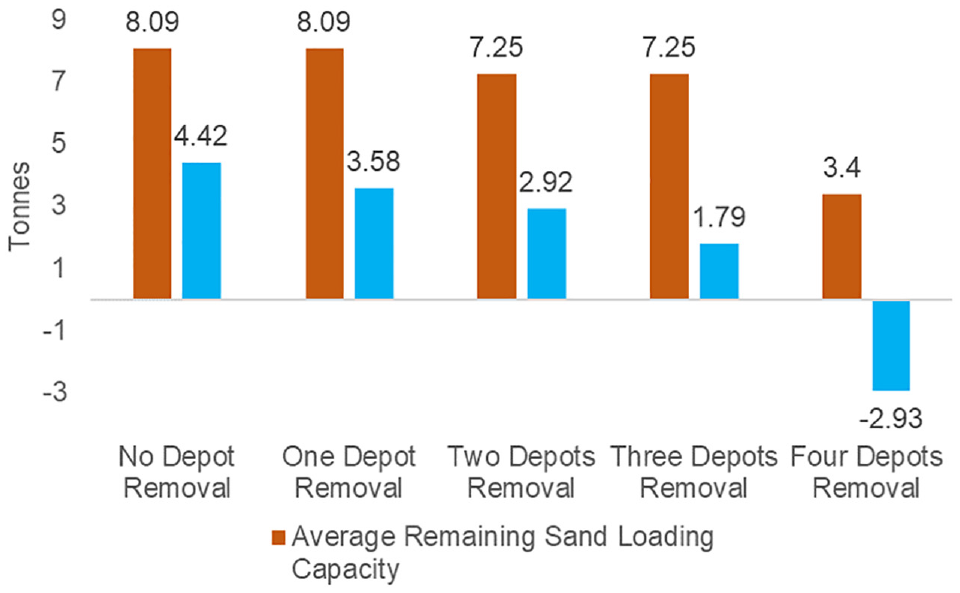
Remaining sand/salt loading capacity with yard removal (Task 3).
Clean Slate Optimizations of Plow Routes and Depot Locations (Task 4)
Task 4 is an exercise of optimal depot location-allocation that measures how optimal the current layout is compared with the theoretical optimal depot location-allocations. The location optimization model was iteratively implemented to determine the recommended number of depots (density) and their spatial configuration. The constrained optimization algorithm started with one depot and then the number was incrementally increased to 13 depots. To make a comparison between depot densities, a total travel cost value (i.e., travel distance, potential service times, truck rental fees, operators’ wage, etc.) for each configuration was calculated and normalized. The result shows the travel cost decreases as the number of depots increases, but also reveals that travel cost savings experiences diminishing returns. Given how the gain in marginal benefits tapers off so quickly, as shown in Figure 6, it stands to reason that the optimum number of depots is between five and eight, so long as all depots are positioned in their optimum location as opposed to their current locations. Therefore, from the results of Task 4, the density of six optimally located depots was chosen to be used as a basis for route optimizations for individual trucks.
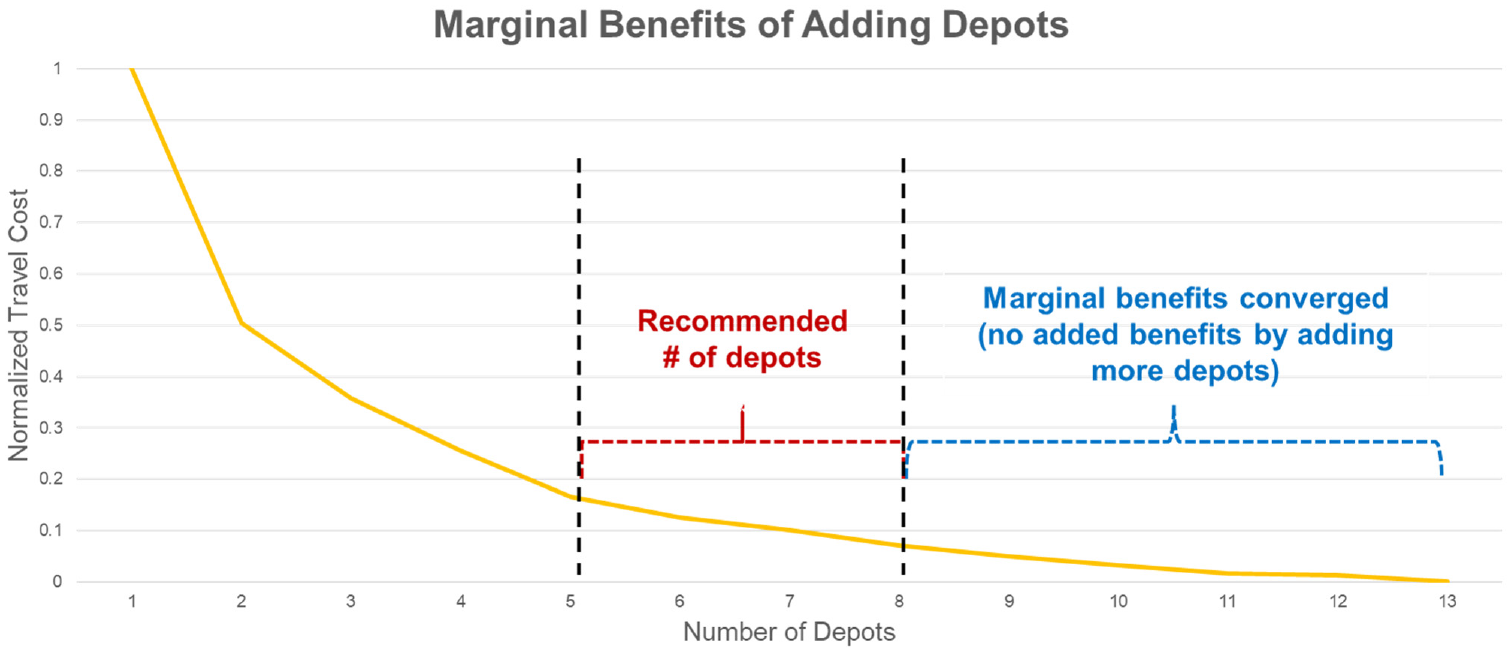
Marginal benefits of incrementally adding depots.
Figure 7 shows the existing depot locations, and six depots generated from the optimal location model. The truck resources for six depots were estimated by considering the spatial similarity to the current depot resource allocation for each depot. The number of trucks available for Task 4 is 37 trucks, which is the minimum number of trucks needed to service the entire road network in Task 3 while meeting service time and spreader capacity requirements as closely as possible. In doing so, the same constraints used in Tasks 2–3 are applied to Task 4 with an added assumption that a single spreader capacity be used for route optimizations.

Current depot locations and optimized locations existing 13 depots and optimal 6 depots
The same optimization process was used to generate the optimal routes. To demonstrate the performance of the optimization model developed for Task 4 and its superiority over Task 3, the level of service for Task 3 (ten depots) and Task 4 (six all-new depots) are respectively compared as shown in Figure 8. The findings suggest that optimizing the location for six all-new depots will result in nearly identical level of service as selecting the nearest existing depot, with selected depot retirements.
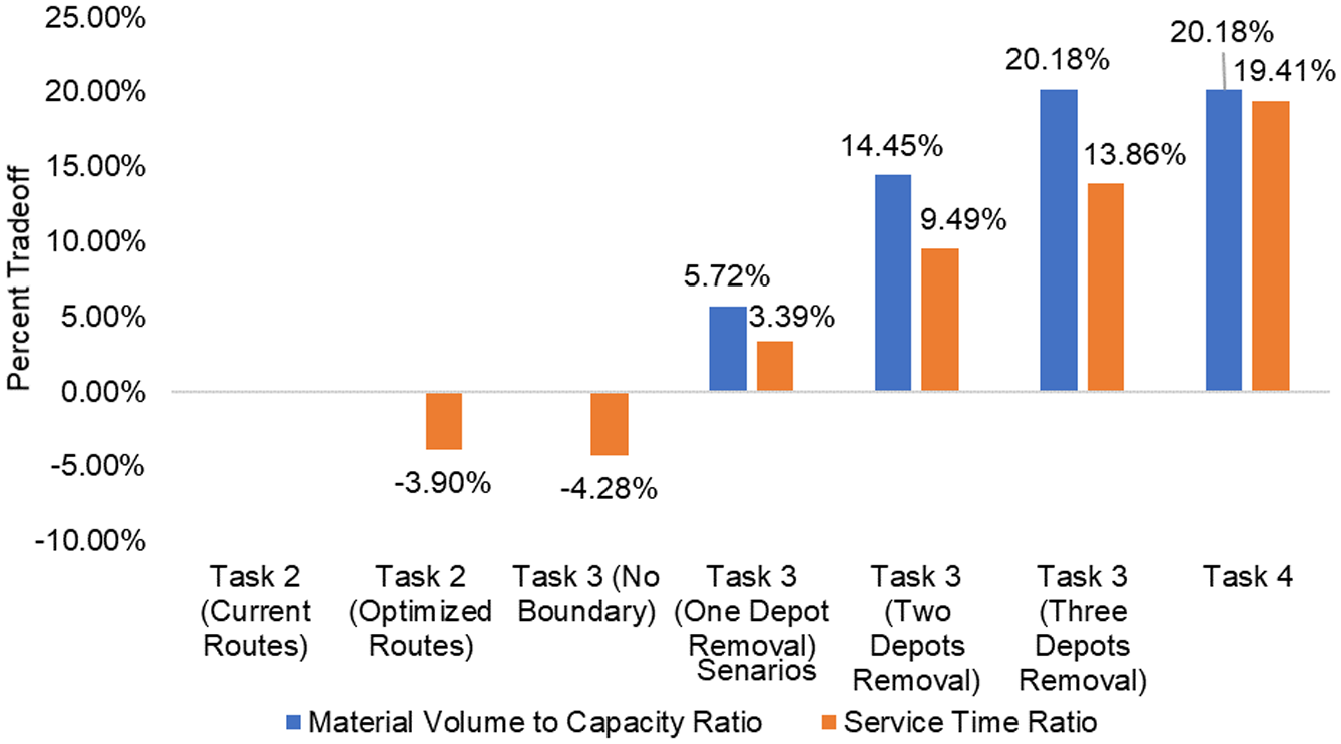
Trade off analysis using Task 2 current routes as a basis.
Trade-off Analysis for Reduced Depot and Truck Numbers
When investigating the prospect of retiring a depot, potential costs and trade-offs associated with it must be considered. Every depot removed/retired will have a direct effect on the service levels, total distance traveled per truck, and material usage. As such, Figure 8 is provided to summarize the service time ratio and the material volume-to-capacity ratio under different optimization scenarios. The material volume-to-capacity ratio shows an increasing trend when a depot is retired, suggesting that the average truckload will increase. The results of the service time ratio from Tasks 2 and 3 showed a decreased trade-off, suggesting that the optimized routes will lower the service time. One possible explanation could be the reduction in deadhead movements for the optimized routes, thus decreasing the total distance traveled, and in turn increasing the level of service. However, when a depot is retired, so too are its assigned trucks. The resulting reduction in truck numbers leads to longer route lengths, as each remaining truck will need to make up the difference. This naturally results in a reduced level of service as service time and expenditures increase. It is interesting to note that in Task 4, where the total number of trucks is maintained while the number of depots was reduced from ten to six, there was a reduction rate of approximately 7% in the service ratio, while the material volume-to-capacity ratio remained the same. This shows that, compared with the current winter maintenance operations, the all-new depot allocation and resource allocation scheme can provide a better service level.
Conclusions
Recognizing current research gaps in optimizing snow and ice control routing, this study uses a novel K-PPP approach to address limitations in current route optimization approaches. This study then measures the feasibility of the routes by penalizing improper turning behavior and road priority in the objective functions. On the basis of ensuring the feasibility of designed routes, this paper explores a future scenario where the routes are optimized within current or eliminated municipal boundaries and reduced road maintenance equipment resources.
To understand the efficiency of current routes, plow routes were optimized based on the current boundary configuration, available trucks, and depot distribution, which provided a baseline for the highest possible benefit achievable under the current, individualistic municipal setup. The result of Task 2 (optimized versus current) suggests that the average route length cannot be significantly reduced without changing the service boundary or sharing resources. Next, this study investigated the possible benefits from cooperation between municipalities (Task 3). Two types of cooperation were used to reduce maintenance costs; the elimination of boundaries and the sharing of maintenance depots. Eliminating boundaries created more room for route optimization, and shared depots allows for the removal of redundant depots (Task 4). The result suggests that eliminating boundaries could result in a 2% reduction in the total travel distance when compared with the optimized results within boundaries, and the sharing of depots could allow for the retirement of three depots and eight trucks without violating their practical requirements. Thirty-seven trucks were assigned to six depots based on the spatial similarity of the new truck assignment condition to the existing resource configuration. The reduction rates from Task 2, Task 3, and Task 4 indicate that the existing routes are efficient and can be further improved if the municipalities sharemunicipal boundaries or optimize depot numbers or locations. In addition, the results suggest that six optimally located depots can achieve a level of service comparable to that often non-optimally located depots, through agency partnerships.
Finally, as the reduction in depot numbers and fleet sizes could negatively affect the level of service of WRM operations, a trade-off analysis for the depot removal plan was conducted to evaluate the relationship between the level of service and the number of depots removed in an objective manner. Service times were predicted to increase as the number of depots and WRM trucks decreases, while the average material volume-to-capacity ratio stayed the same as the number of depots decreases. In addition, in Task 4, a sensitivity analysis can be conducted to investigate how the fleet size and its distribution would change as per the varying number of depots, and help municipalities gain a quantitative understanding of the benefits of such alterations. These results can be used to analyze changes in service level, defined as service time and truck capacity ratios, that are associated with reduced numbers of depots and equipment and their associated operating costs, in planning a future maintenance network. For example, managers can be provided with the optimal number of depots based on the level of service they would like to retain.
Recommendations for further research in this direction include a sensitivity analysis aimed at investigating how the resulting optimal routes could change with respect to external factors pertaining to stricter turning restrictions or road priority constraints, and so forth. This can be achieved by changing the weights of the factors for the turn and road priority penalties. Also, in the process of eliminating depots, the study focused on situations where work transfers from closed depots to open depots were not allowed. It is worth noting that these trucks also have the potential to be reallocated while taking away unnecessary facilities from different municipalities’ requirements. Furthermore, weather events should be modeled in a stochastic way since the weather varies over space and time. This analysis did not consider indirect costs of changes to the service network, such as those associated with labor contracts, and building decommissioning or improvement. In the end, since some constraints, such as spreading rate, are simplified in the modeling process, the theoretical optimized route needs to be localized to satisfy the local constraints before application.
Footnotes
Acknowledgements
The authors would like to thank the County of Perth and member municipalities for funding a Winter Maintenance Modernization study of which this research is a component, and providing project data and sharing key practical knowledge on winter maintenance operations, equipment and materials. In particular, the authors are grateful for assistance from John McClelland (Perth County), Bill Wilson (Perth County), Ken Bettles (Perth South), Mike Kraemer (West Perth), Wes Kuepfer (Perth East), Jed Kelly (Town of St. Marys), Lyndon Kowch (North Perth), Tasnia Nowrin (University of Alberta), Andy Wong (University of Alberta), Murray Dinning (Murray Dinning Associates), Reza Omrani (CIMA+), and Joshua Yu (CIMA+).
Author Contributions
The authors confirm contribution to the paper as follows: study conception and design: S. Xu, T. J. Kwon, M. Wu; data collection: S. Xu; analysis and interpretation of results: S. Xu, T. Kwon, M. Wu; draft manuscript preparation: S. Xu, M. Wu, T. Kwon, M. Perchanok. All authors reviewed the results and approved the manuscript.
Declaration of Conflicting Interests
The author(s) declared no potential conflicts of interest with respect to the research, authorship, and/or publication of this article.
Funding
The author(s) disclosed receipt of the following financial support for the research, authorship, and/or publication of this article: This research was funded by CIMA+, and was partially funded by the Natural Sciences and Engineering Research Council of Canada (NSERC). Also, the County of Perth and member municipalities funded a Winter Maintenance Modernization study of which this research is a component.