
Abstract
Train dwell time is a complicated component and depends on many factors. One of the dominant factors is passenger volume. This study used actual train movement data and passenger demand data from London Underground, UK, to estimate the number of passengers and train dwell times at each station, and then evaluated train dwell times from a different perspective. Considering the various characteristics of stations, it is complicated to evaluate dwell time. Therefore, data envelopment analysis (DEA) was introduced to evaluate the dwell time at each station in relation to passenger volume at that station. The study investigated whether the dwell time spent at stations is efficient when considering the number of passengers that the stations can serve. The results showed that, in low-passenger-volume stations, the dwell time efficiency score is low and increases relative to the increase in passenger volume. For high-passenger-volume stations, interactions between passengers are more relevant and have a strong influence on dwell time. Passenger movement direction is a key factor to classify stations. This research proposes that stations should be classified according to their characteristics, and points out the challenge at any station with the same characteristics as Victoria station which has high passenger volume with bi-directional flow, and where trains arriving are crowded. This characteristic would result in high interactions between passengers, thus making a long dwell time. The station has to handle high passenger volume and also has to keep the dwell time within the threshold.
Keywords
Dwell time is a critical variable which determines peak hour service frequency in many metro systems. Transport for London (TfL)’s own research investigated interactions between passengers, platforms, and train service reliability, and reported that there are many stations in the system confronted with train service disruptions because of high levels of interaction between passengers on platforms ( 1 ). In addition, other research carried out by TfL (McKenna’s report) concluded that dwell time takes 20%–25% of passengers’ in-vehicle time ( 2 ). This research was published 30 years ago, and signaling technology has since improved to enable trains to run closer. However, the issue that dwell time limits service frequency still exists and tends to be more critical as time progresses because of the increase in passenger volume. Much research has addressed this problem ( 3 – 5 ).
Dwell time is a complicated component. It has almost 50 relevant factors of various aspects and affects several metrics ( 1 , 6 ). Interactions between passengers and infrastructures or trains, and interactions between passengers themselves, make dwell time one of the most complicated components in the metro operation field. Much effort has been put into the development of dwell time prediction models; however, dwell time cannot be represented well with one equation. Different dwell time models should be used in different conditions. This research classifies the conditions in relation to passenger volume.
In general, dwell time could be considered from different perspectives such as efficiency and reliability. These two aspects are not totally aligned, and the conclusions drawn from each perspective could vary. A station which has long dwell times and delays in service might be considered as underperforming if it has a low level of reliability. However, it might perform well in relation to efficiency. Even if it has a long dwell time, it can contribute to many outputs (for example, many passengers alighting and boarding at the station). The efficiency of dwell time in this study is evaluated by considering the number of passengers at stations compared with the amount of dwell time spent at these stations.
This research aims to evaluate train dwell time from a different viewpoint and introduce a data envelopment analysis (DEA) approach to benchmark dwell time between stations, and to classify station characteristics which can support the accurate application of dwell time models.
Train Dwell Time and Passenger-Related Factors
Train dwell time is known as one of the most complicated components in the metro operation field as it is determined by many factors and also by passenger behavior, which is very difficult to predict. The definition of dwell time in London Underground’s Train Service Model (TSM) is the time between wheel stop to wheel start. It is not only the time for passengers to board and alight from the train, but also the technical time for the door opening and closing process ( 7 ). Dwell time can be divided into five components: door opening time, passenger boarding and alighting time (BAT), signal delay time, door closure time, and departure time. The analysis in McKenna’s report presented that BAT, door closure time, and departure time take up most of the overall dwell time ( 2 ). Door closure time and departure time normally take around 10 s, however they could take up to 35 s if there is a repeated door closure caused by “late runners” (passengers who get on the train while the doors are nearly closed). Since late runner situations occur randomly, they are mostly excluded from the dwell time model ( 2 ). Therefore, BAT becomes the most significant part of the dwell time model and the dwell time analysis in this research refers to BAT. The factors affecting BAT have been classified into three groups: passenger-related, platform/station-related, and train-related ( 1 ). This piece of literature focuses on passenger-related factors.
Fujiyama et al. conducted an experiment in University College London’s Pedestrian Accessibility and Movement Environment Laboratory (PAMELA) to investigate whether 50 passengers could board and alight at the door of a mock-up of a London Underground train within 27 s. The experiment was conducted in three scenarios with different boarding and alighting ratios (B/A ratios) (45 alighters/5 boarders, 45 boarders/5 alighters, 25 alighters/25 boarders). Results showed that the highest number of movements within 27 s was achieved by the group of 45 alighters/5 boarders, followed by 45 boarders/5 alighters and 25 alighters/25 boarders, respectively. The case of 25 alighters/25 boarders got the lowest achievement because of the highest number of interactions between passengers. Moreover, the experiment found that if a boarding process continues after the density of the vestibule reaches four passengers per m2, the passenger boarding rate will begin to drop. The passenger boarding and alighting flow rate always changes during the door opening time with non-linear distribution. Therefore, using a constant average flow rate to determine the boarding and alighting rate may not be accurate ( 8 ).
Before this study, there had been other research conducted in PAMELA ( 9 – 13 ). Seriani explored the effect of the B/A ratio with regard to the following aspects: average boarding and alighting rate, sequence of movement, formation of lanes, and the density inside the train. This research found that passenger behavior can vary when the level of passenger volume is different, even when the boarding/alighting ratio is similar. Thus, the numbers of passengers boarding and alighting are crucial factors in the dwell time analysis. In a crowded situation, if boarders are dominant (ratio = 4), a small group of alighters has to interact with many boarders, causing alighters to spend more time per passenger than boarders, and vice versa in an alighter-dominant situation (ratio = 0.25). Concerning the sequence of movement, passengers will always alight from trains first, followed by passengers boarding; however, in a boarder-dominant situation (ratio = 4) the boarding process starts earlier, namely around 10 s after the alighting process starts. This research also provided evidence that the boarding flow rate will drop when the density of the vestibule reaches four passengers per m2. The experiment tried closing the train doors when the density of the vestibule reached four passengers per m2 and found that this could reduce the total dwell time by 26%, which is about 11 s. The authors suggested future work to identify the ideal time to close the doors in a crowded situation ( 12 ).
Harris experimented on a mock-up of South West Train rolling stock in the U.K. His research divided BAT into three elements: boarding time, alighting time, and interaction time, and stated that interaction time is the most complicated part as it cannot be calculated straightforwardly. The passengers remaining on the train also have an effect on interaction time. For example, if most passengers alight from the train, more spaces on the train will lead to fewer conflicts, thus passengers can board easily. Interaction time is an aspect which this research demonstrated to be overestimated at high level passenger flow by London Underground’s equation. The study also showed that the increase in the number of passengers leads to a higher BAT but the correlation is in a nonlinear function with a power function between 0 and 1 (which aligns with London Underground’s model). Concerning the sequence of movement, this research also supported findings that alighting and boarding rates are not constant across alighting and boarding processes. The fastest movement for alighters is right after the doors open as passengers near the doors can get off without obstruction, while the fastest movement for boarders is at the middle of the process as early boarders might be impeded by alighters and late boarders might be obstructed because of the train being nearly full ( 3 ).
In the meanwhile, Suazo-Vecino et al. found that the passenger density inside the train is the most significant variable in this subject ( 14 ). Their research developed a dwell time model for one of the most congested subway stations in Santiago, Chile. This model found that the passenger density inside the train explains 73.6% of the whole dwell time. In addition, the term “number of alighters multiplied by the platform occupancy level” accounts for 11.55% of the dwell time. The research focused on this term as they considered that it is controllable by limiting passenger accessibility to the platform, resulting in fewer interactions between alighters and passengers on the platform.
In summary, the following passenger volume factors are the most relevant:
The number of passengers boarding: the more boarders, the longer BAT is needed to accommodate the passengers ( 2 , 4 , 15 – 20 )
The number of passengers alighting: the more alighters, the more time is also accumulated on BAT ( 2 , 4 , 15 – 20 )
Boarding/alighting ratio: the ratio of boarders and alighters also influences the duration of BAT. In the situation when either alighters or boarders are dominant, it makes a shorter BAT as there are fewer interactions between passengers compared with the situation when the numbers of boarders and alighters are almost the same ( 2 , 8 , 12 , 13 , 17 , 18 )
Crowding inside the train: the crowding area could increase the interactions between passengers and obstruct passenger movement. Crowding inside the train obstructs passengers alighting, and crowding after alighting also obstructs passengers boarding ( 3 , 14 , 17 )
The Case Study on the Victoria Line
This research takes the morning peak hours of the northbound service of the Victoria line, London Underground, as a case study. The Victoria northbound line runs from Brixton to Walthamstow Central station and passes through many busy stations (“busy stations” are here defined by high passenger volume for boarding and alighting at these stations) such as King’s Cross, Oxford Circus, and Victoria. The line has adapted an automatic train operation system to achieve a shorter headway. Technically, the line is scheduled to run 36 trains per hour in peak time; however, it is sometimes unable to achieve this in practice because most stations require longer times than the threshold (Figure 1). Train delays have become one of the critical problems in the London Underground system as it is a challenging task to manage passenger congestion on the small platforms to avoid accidents and handle passenger flow efficiently. One important issue raised by Oberlander is that Victoria station, which is the most critical station, becomes the station that determines the line capacity because of the long dwell time at the platform ( 21 ). This is because Victoria station is a high-passenger-volume station and the trains arriving at Victoria station are often full causing high interactions between passengers. Dwell time delay at Victoria station is the motivation of this research to evaluate whether the dwell times at high-passenger-volume stations are efficient when considering the number of passengers that the stations can serve.
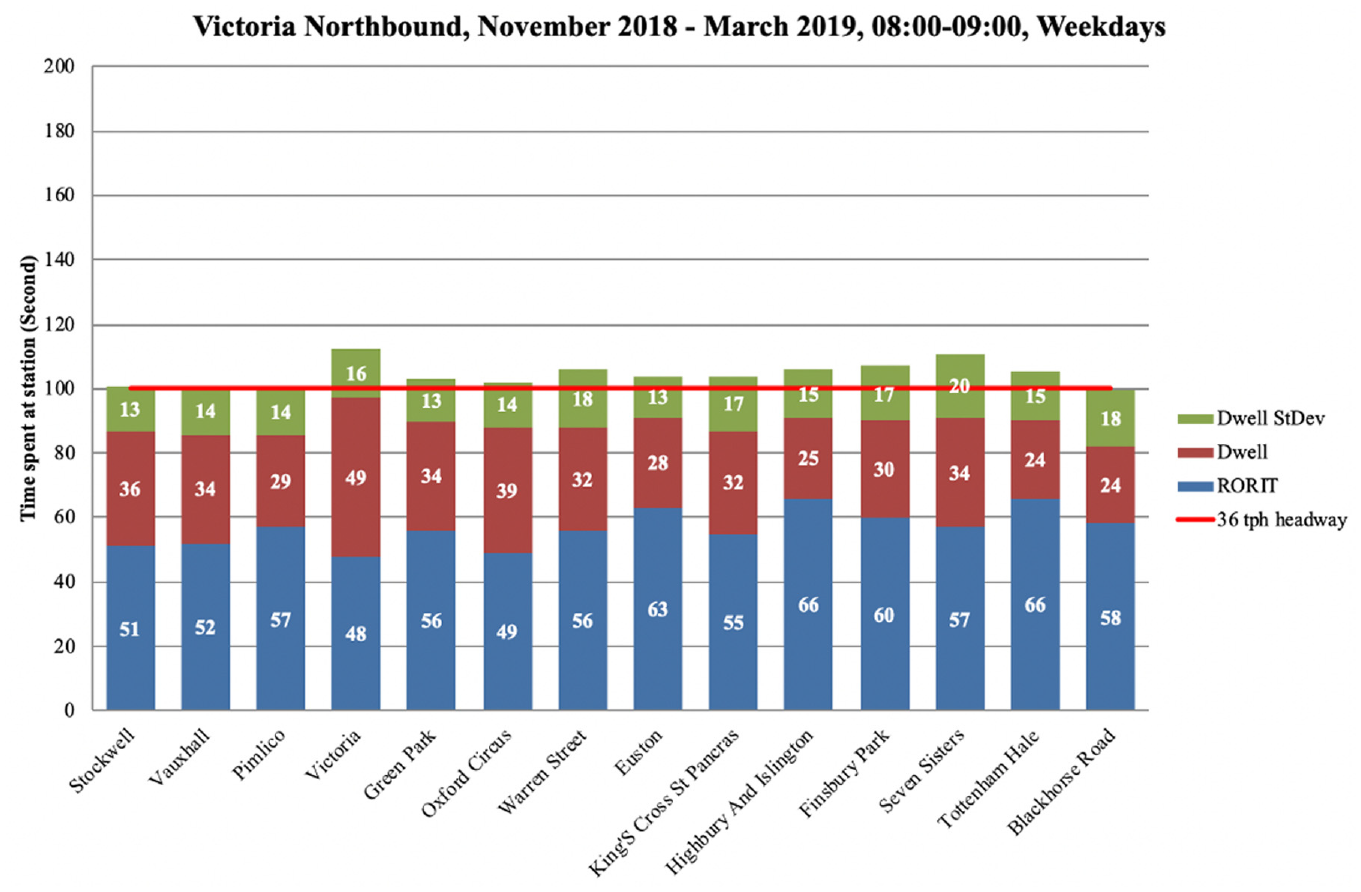
The breakdown of time at each station on the northbound Victoria line (Transport for London [TfL–> 2019).
Figure 1 presents the average time spent at the stations on the northbound service of the Victoria line at the busiest morning peak time (8:00–9:00 a.m.), which is the time when passenger volume is at its highest and trains are often delayed. The main components of the time are composed of:
Average run out run in time (RORIT) or the train reoccupation time, which mostly depends on signaling and train performance (blue boxes)
Average dwell time, which is the train stop time at the platform (red boxes)
Dwell time’s standard deviation, which is mostly from the inconsistency of BAT (green boxes)
For lines with automatic train operation, a standard deviation of RORIT is disregarded.
In high-passenger-volume stations, the interactions between passengers have a strong influence on dwell time ( 1 , 8 ). Two important passenger interactions in boarding and alighting processes are involved. Passenger interactions are illustrated in Figure 2. The first interaction is between passengers alighting from the train and the density on the platform (the density on the platform includes the number of passengers attempting to board the train). The effect of the number of passengers alighting would depend on the density level on the platform which is the area to which the alighting flow is heading. The second interaction is between passenger boarding and the density on the train. When the train is crowded and some people would like to alight, combined with several passengers attempting to board the crowded train, these interactions could lead to a long dwell time and further train delay.
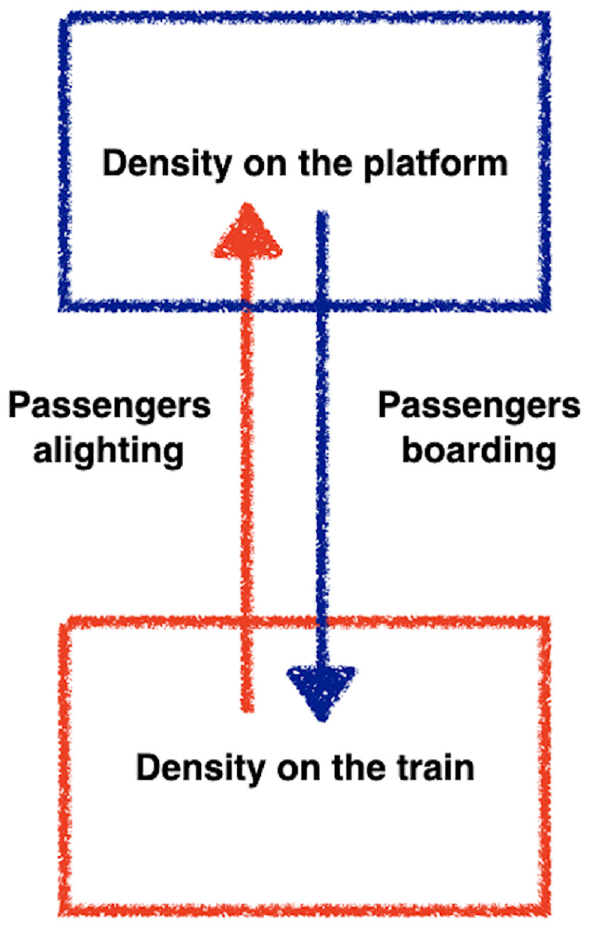
Interactions between passengers boarding and alighting trains.
Methodology
Previous studies about dwell time have developed an understanding of the impacts of passenger-related factors on the train dwell time and have developed dwell time prediction models. However, dwell time is complicated and cannot be represented well with one equation, especially in situations of crowding. Different dwell time models should be used based on different station characteristics (i.e., different demand profiles, different crowding levels on trains, different boarding/alighting ratios). When the stations on the line have different characteristics and different lengths of dwell time, it is difficult to benchmark their dwell time efficiency (i.e., some stations have more passengers boarding while other stations have more passengers alighting, or some stations have passengers boarding and alighting equally). Thus, this research introduces the DEA approach, which makes it possible to benchmark stations by including multiple input factors which have complex interrelationships.
The analysis in this research was based on two essential data sources from TfL, namely NETMIS and NUMBAT. NETMIS is the actual operation data from London Underground’s train movement database, which consists of the data of each train’s movement through stations. The arrival/departure times whenever a train leaves a station are recorded, thus dwell time for trains at each station can be calculated. NUMBAT presents the number of passengers who travel on any specific line to each origin-destination pair every 15 min, and therefore allows an estimation of the numbers of boarders, alighters, and passengers on trains within each 15 min interval. The train data of the northbound service of the Victoria line in the morning peak period from November 2018 to March 2019 was extracted. Python 3 was used as a tool in the data preparation process as it is a convenient and fast way to process the data extracted from NETMIS, which has approximately 200,000 rows per month of the dataset.
NETMIS and NUMBAT data sources provide the average volume of passengers boarding and alighting, and the average dwell time at different stations, which are the major variables used in this study. Loadweights on trains (showing the crowding level of trains) and boarding/alighting ratios (showing passenger movement direction) are additionally taken from the datasets, as they are related factors which could determine train dwell time. There is no dataset that could directly provide numerical data about the density on the platform; however, it might be possible to infer this from passenger demand (from NUMBAT data sources). There are some limitations concerning the data used in this study:
This research focuses on the case of the morning peak time (which is the most crowded period on the northbound line) from a macroscopic point of view. The approach is deterministic (it uses the average values of the number of passengers and the average value of dwell times). However, further analysis may consider the stochastic approach if random factors are relevant.
This analysis only considers passenger volume factors, which are one aspect of the factors that determine train dwell time.
Dwell time could be evaluated by various indicators. It might also be possible to use other indicators for the analysis. This research focuses on the number of passengers boarding and alighting at the station to evaluate the dwell time.
Data Envelopment Analysis (DEA)
DEA, or frontier analysis, is a non-parametric approach to compare the relative efficiency of units (decision making units [DMUs]). It is a performance benchmarking method which allows multiple inputs and multiple outputs in the analysis and identifies a best practice frontier from a set of the units that have the highest efficiency compared with others. The approach focuses on best practice frontiers rather than central tendencies of the data. DEA allows comparison between units without requiring a formulated model ( 22 – 24 ). The original DEA model was presented in Charnes et al. and is called the Charnes, Cooper, and Rhodes (CCR) DEA model ( 25 ). The ratio of outputs to inputs is used to evaluate the relative efficiency of any DMUs, thus the model is formulated in ratio form and converted into linear programming form, which is easier to solve. The modified linear programming model will set the denominator of the objective function equal to one and add it as a constraint.
In addition, the denominator of the efficiency function will be multiplied by a scale factor. This model can be transformed with this approach, as it has a single degree of freedom. (The approach to convert the problem into the modified linear programming form is demonstrated in Beasley’s OR-Notes [ 23 ].) This research used the Solver add-in in Microsoft Excel to solve the linear programming model.
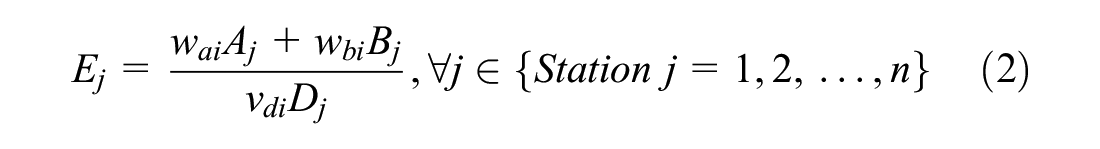
The current research applies the CCR DEA model to compare the efficiency of the dwell time at each station on the Victoria line. The dwell time efficiency in this analysis is measured by the number of passengers demanding to alight and board trains at individual stations (considered as outputs in this analysis) and the dwell time spent at these stations (considered as an input in this analysis). If the station has a shorter dwell time or higher passenger volume, the efficiency score evaluated with DEA could be high. To evaluate the dwell time efficiency of station i, the model can be formulated as shown in Equations 1–4.

subject to


where
i = the station being evaluated,
j = all stations being compared relatively with station i,
wai = the weight assigned to alighting passengers when evaluating efficiency of station i,
wbi = the weight assigned to boarding passengers when evaluating efficiency of station i,
vdi = the weight assigned to dwell time when evaluating efficiency of station i,
Aj = the number of passengers demanding to alight at station j,
Bj = the number of passengers demanding to board at station j,
Dj = dwell time being spent at station j.
The concept of the DEA model is to maximize the efficiency of the station being evaluated by deciding the weights for each input and output. The optimization has to be repeated by changing the station being evaluated (the maximum function in Equation 1) to find the optimum efficiency for all stations. Equation 2 defines the efficiency of each station as a weighted sum of outputs divided by a weighted sum of inputs. The weights (wai, wbi,vdi), which are the decision variables, are allocated to find the best efficiency of the station being evaluated, thereby presenting the particular station in the best possible practice. For example, if the model is aimed at evaluating Victoria station efficiency, the weights are chosen to maximize Victoria’s efficiency (EVictoria) and the same weights will be applied to other stations so that their efficiency can be compared relatively. The constraint in Equation 3 is set to make all station efficiency scores fall between 0 and 1, therefore the best possible efficiency is 1. If applying the same weights makes the efficiency of any station above 1, the allocated weights will be adjusted according to the constraint of Equation 3, resulting in a lower efficiency at Victoria station (the station being evaluated) compared relative to other stations. Equation 4 sets the weights to be positive. There is no weights restriction added in the model’s constraint which means that all factors are equally significant. The model will apply the higher weight to the associated factor in which the station being evaluated performs better to maximize its efficiency. Therefore, it could be interpreted that, if the weight assigned to any factor is high, it implies that this factor is outstanding at the station being evaluated.
With the DEA approach, stations with different characteristics or different demand profiles can be evaluated from their best potential. When stations that are being evaluated obtain the highest efficiency score (E = 1), these stations will form the efficient frontier. The stations with lower efficiency will be evaluated by being compared relative to the frontier.
Station Demand Profile
This study used London Underground’s actual train movement data to calculate the dwell times and trains’ loadweight as a percentage at each station (which shows how crowded the trains are). Passenger demand data of London Underground is used to estimate the numbers of passengers wanting to alight and board at each station (the data is taken as number of passengers per minute).
Table 1 shows passenger volume and dwell time at each station on the northbound service of the Victoria line during the morning peak hour. The passenger volume shown in the table covers passengers boarding, passengers alighting, and on-board passengers before arriving at the stations (preload). The B/A ratio presents the direction of passenger movements. If the B/A ratio is further from 1, it represents that either alighters or boarders are dominant at that station.
Dwell Time and Passenger Volume on the Northbound Service of Victoria Line at 8:00–9:00 a.m.
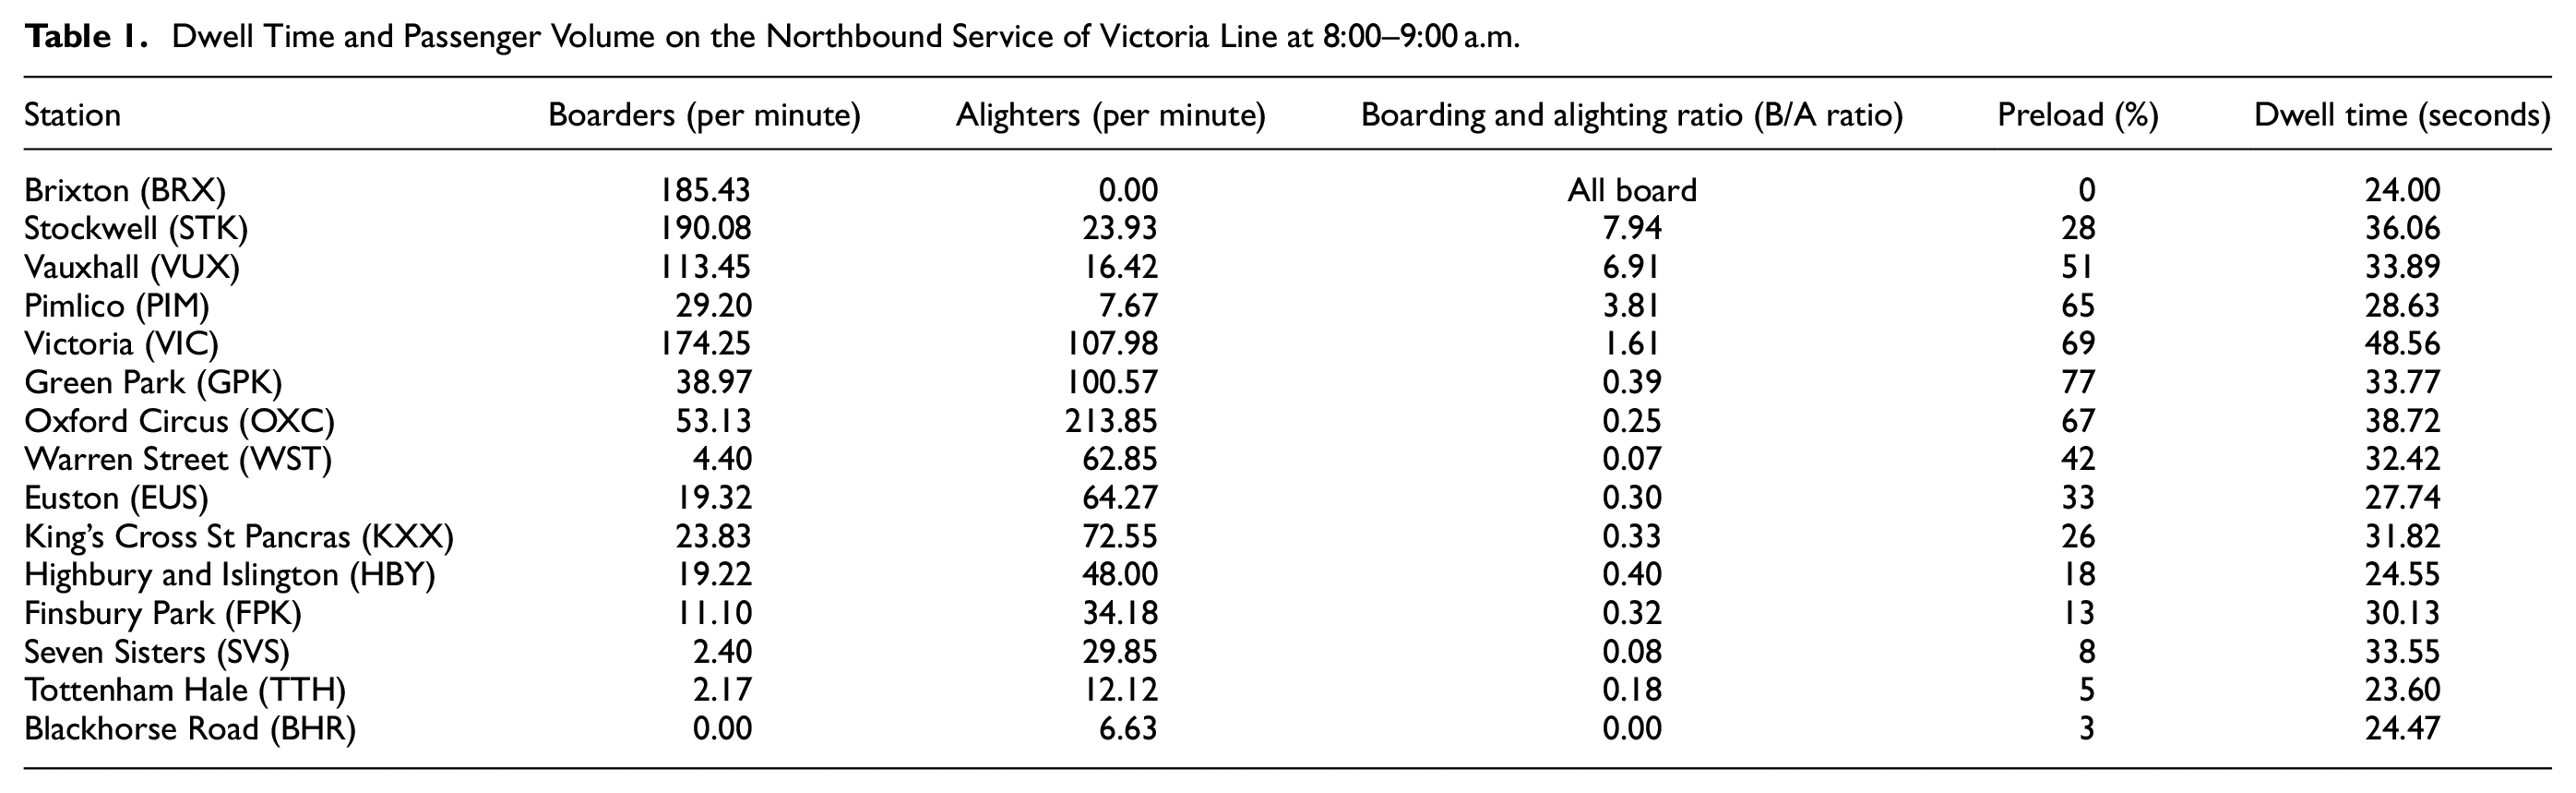
Figure 3 illustrates the demand profiles and the dwell times at each station. The information noted above each data point gives the station abbreviation and the average dwell time spent at that station. The slope of the line demonstrates the B/A ratio. The stations located on the upper area of the line, where the slope equals 1, are the stations with more boarding passengers. A total of 11 out of 16 stations on the northbound service of the Victoria line are stations with more alighting passengers, and most of them have low numbers of passengers. The marks in red represent the stations with the load on trains before arriving the stations (preload) over 60% (the 60% loadweight is roughly four passengers per m2) which is the level of density where passenger movements in and out of trains begin to be restricted ( 8 , 12 ).
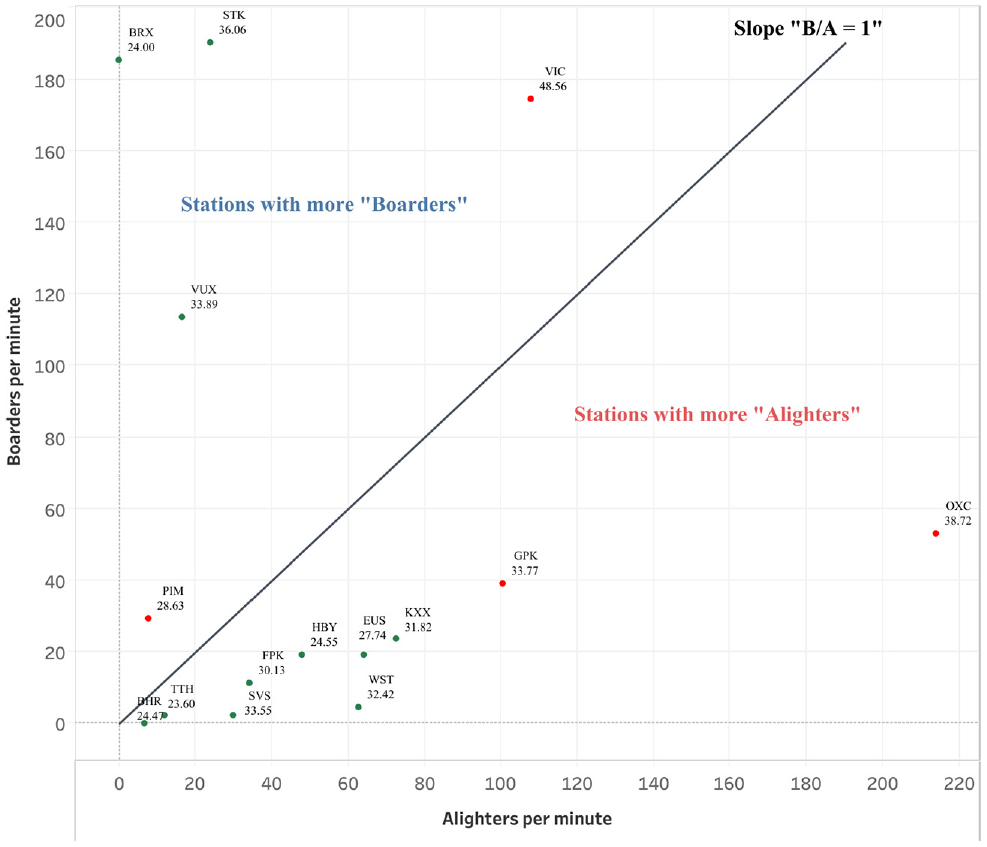
Demand profile of the stations on the line.
One question raised by this research is how to benchmark train dwell time performance among stations which have different characteristics. One idea to measure a station’s performance is to compare the dwell time spent at the station with the contribution of the station (passenger volume at the station being considered as a contribution in this research).
The term “passenger volume” in this research differentiates between the number of passengers boarding and the number of passengers alighting. This is because these two factors are opposite vectors which have a great influence on the dwell time in a crowding situation. The following three cases could clarify this point. If the passenger volume of these three cases is considered as the sum of the passengers, they would all equal 200 passengers per minute. However, these three cases affect dwell time differently.
Case 1: Boarders = 150 passengers per minute, Alighters = 50 passengers per minute
Case 2: Boarders = 50 passengers per minute, Alighters = 150 passengers per minute
Case 3: Boarders = 100 passengers per minute, Alighters = 100 passengers per minute
When stations on the line show different characteristics, it could influence the duration of the dwell time differently. Some stations with alighter dominance or boarder dominance may have lower passenger interactions. Some stations at which passengers move in a bi-directional flow in and out of trains may deal with higher passenger interactions. However, the level of interactions also depends on the passenger volume and the density on trains. Considering the various characteristics of stations, it is complicated to evaluate the dwell time performance. The DEA is applied to benchmark the performance of the dwell time among stations.
Train Dwell Time Evaluation
This section aims to evaluate train dwell time of the stations with different demand profiles by applying the DEA approach. DEA benchmarks the efficiency of the dwell time spent at each station by considering the number of passengers the stations can service, especially in the case when the stations have different demand profiles as mentioned in the previous section. DEA makes it possible to evaluate the dwell time at each station when the different types of passenger are not comparable.
Passenger volume is first considered in relation to two factors, which are the number of passengers wanting to alight and the number of passengers wanting to board the train at individual stations. The DEA approach examines the two factors individually. Table 2 shows the results of the dwell time efficiency scores derived from the DEA approach. The efficiency scores and related values are calculated by a DEA-Solver on Microsoft Excel provided in Beasley’s OR-notes ( 23 ). The method used in this DEA-Solver is referred in Equations 1–4 as shown in the previous methodology section.
Data Envelopment Analysis (DEA) Benchmarking Results
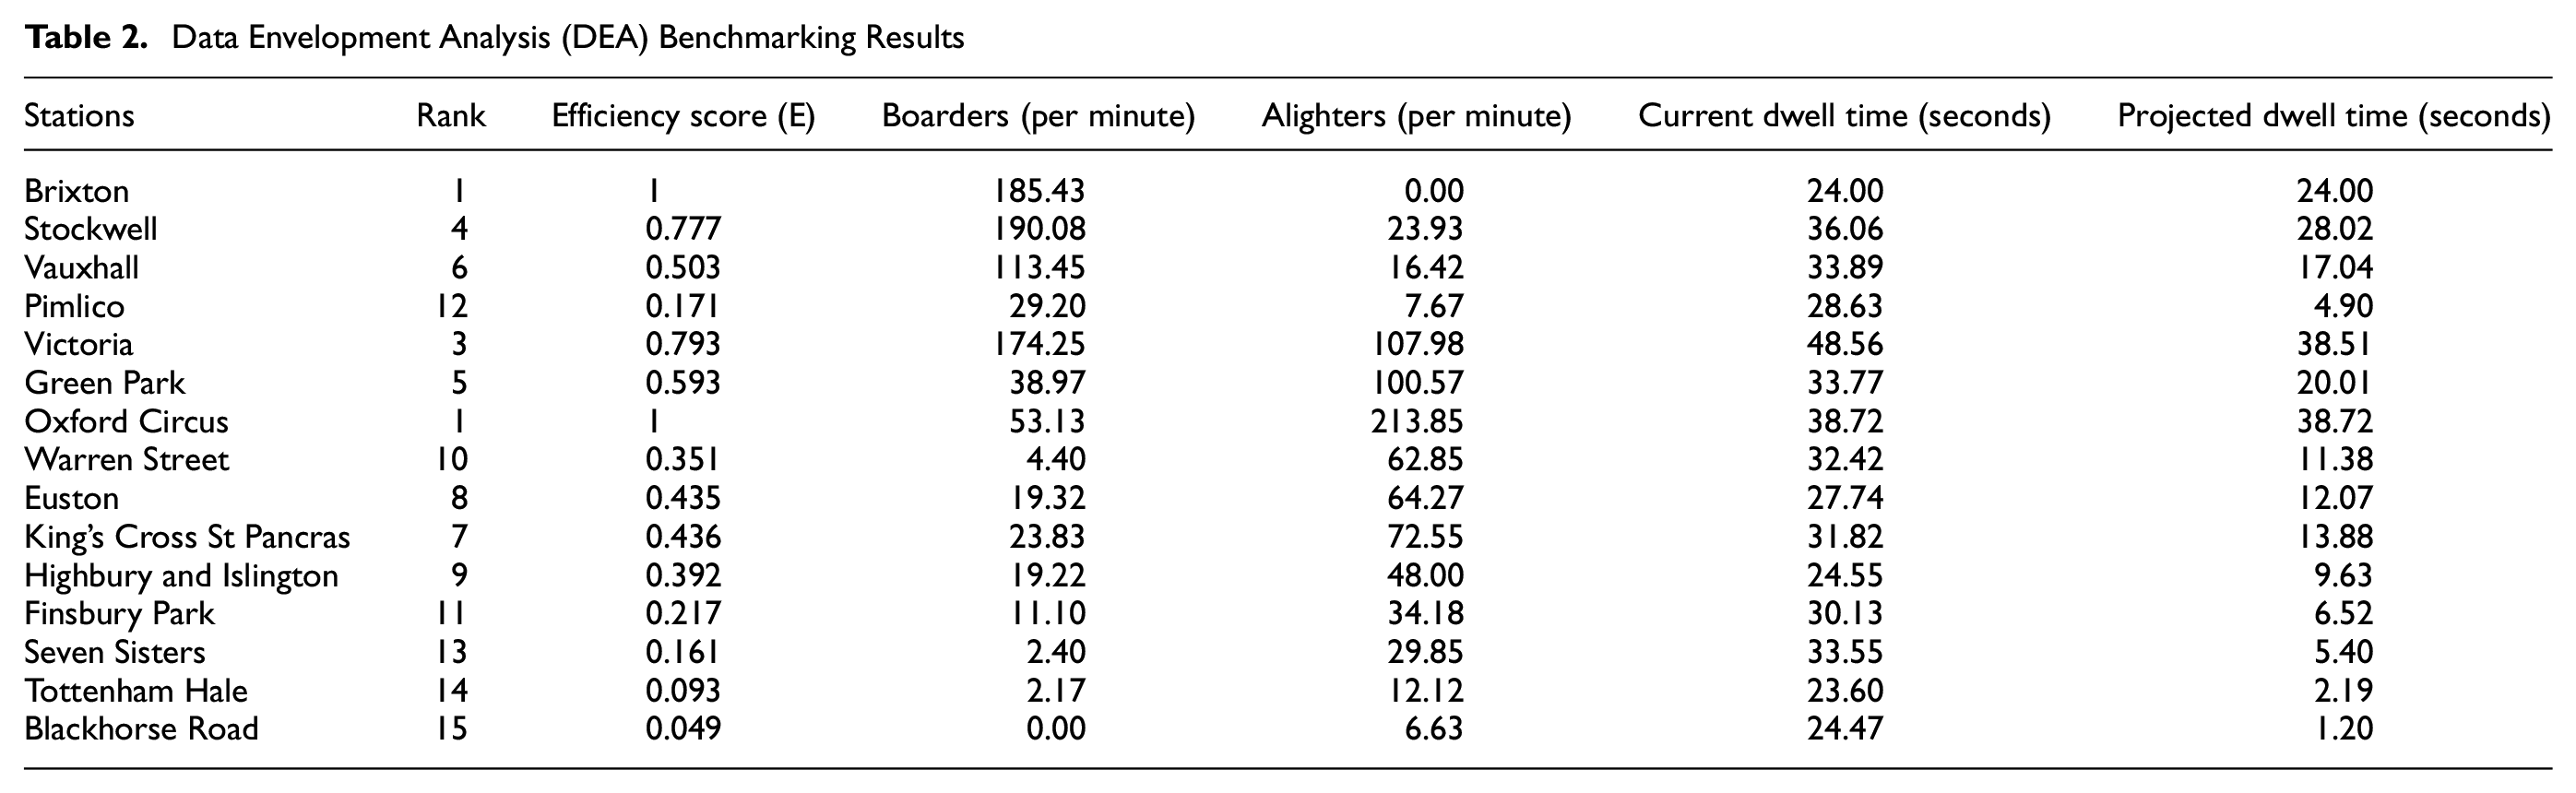
The model evaluates the relative efficiency from the ratio of the weighted outputs to the weighted input. The two outputs of this analysis are the number of passengers alighting (denoted as Aj) and the number of passengers boarding (denoted as Bj), and the input is the dwell time (denoted as Dj). One of the key results from this analysis is the efficiency scores of each station which are derived from benchmarking among stations on the line under a constant return to scale (CRS) assumption ( 26 ). A best-practice frontier line is established from the most efficient stations. The highest efficiency score (E = 1) is given to the stations which are the most efficient in utilising dwell time. In addition to the efficiency scores, the analysis provides the projected dwell time for the stations which have a lower efficiency score (E < 1). This projected dwell time suggests the length of dwell time necessary in order for the less efficient stations to meet the same efficiency level as the most efficient stations (E = 1).
Evaluation Based on Passenger Volume
Figure 4 presents the results of the passenger volume/efficiency score chart. Obviously, stations on the chart are clustered into low- and high-passenger-volume stations. In the lower-passenger-volume stations, the efficiency score increases relative to the increase in passenger volume (without differentiating between the numbers boarding and alighting) and the dwell times are all lower than 35 s. These stations have very low usage demand, thereby having low relative efficiency scores.
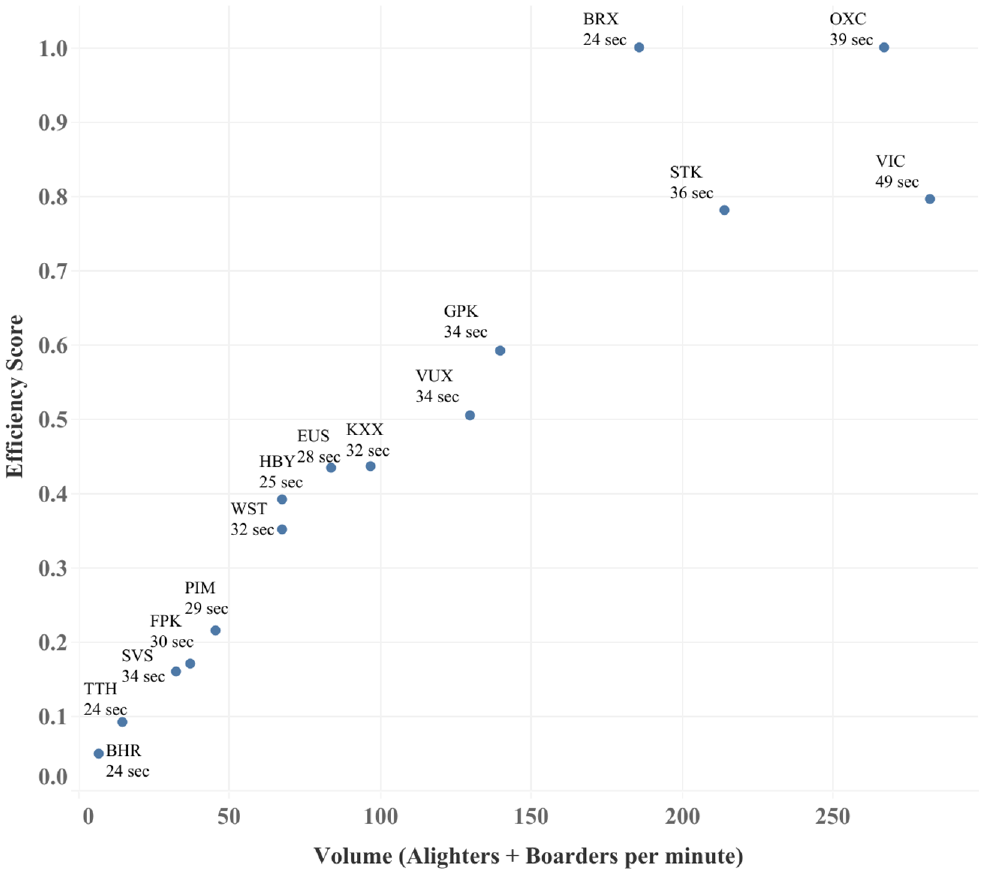
Plot of stations on passenger volume/efficiency score chart.
Considering the recorded dwell time spent at the low-passenger-volume stations, it does not clearly present an increase relative to the passenger volume. This is because the duration of the dwell time of the low-passenger-volume stations depends more on rail traffic and the timetable. The duration of dwell time spent at these stations might be longer than the time needed for passengers to board and alight trains (BAT). The dwell time at these stations has to follow the schedule of the timetable even when passengers have already finished boarding and alighting.
The dwell times at the low-passenger-volume stations (uncrowded stations) are already short and they are not the main problem causing train delays. This research will therefore not consider improving dwell times at uncrowded stations. Table 2 shows the projected dwell times derived from the DEA analysis (the suggested duration of dwell time to improve dwell time to the efficiency level), which is inapplicable to low-passenger-volume stations. (For example, the suggestion that Tottenham Hale should take 2.19 s of dwell time to improve the efficiency to the frontier, whereas this is not necessary for a low-passenger-volume station.)
The focus of the research problem is on the higher-passenger-volume stations where the dwell times result in train delays. In contrast to the low-passenger-volume stations, Figure 4 shows that dwell time efficiency scores of high-passenger-volume stations are not increased relative to passenger volume, and the dwell times at each station also show a great variation. There are other factors that have a stronger influence on dwell times at high-passenger-volume stations.
Evaluation Based on Passenger Movement Direction
Referring to the research reviewed in the previous section, the differentiation between boarding and alighting is another crucial factor that affects dwell times at high-passenger-volume stations. The results from DEA in Table 2 present that the stations which have the highest efficiency score are Brixton station and Oxford Circus station (E = 1). Both stations have a much lower dwell time than Victoria station, which has the third highest efficiency rank (efficiency score = 0.795). Considering the demand data in Table 1, passengers at Brixton and Oxford Circus move in a one-way flow in or out of the trains. All passengers at Brixton are boarding passengers (Brixton is a terminal station of the Victoria northbound line) and most of the passengers at Oxford Circus are alighting passengers (B/A ratio = 0.25). Dwell times at both stations are less than 40 s. Only Victoria station has a bi-directional flow (the numbers of boarders and alighters are not widely different) and it has an extremely high dwell time.
Figure 5 shows the DEA approach in a graphical chart which plots the high-passenger-volume stations based on the ratios of the numbers of passengers per second of dwell time for boarding and alighting calculated separately. The chart visually compares the relative efficiency of the stations by differentiating boarding and alighting. The information noted above each data point gives the station abbreviation, the dwell time spent at that station, and trains’ loadweight as a percentage before arriving at that station, respectively.
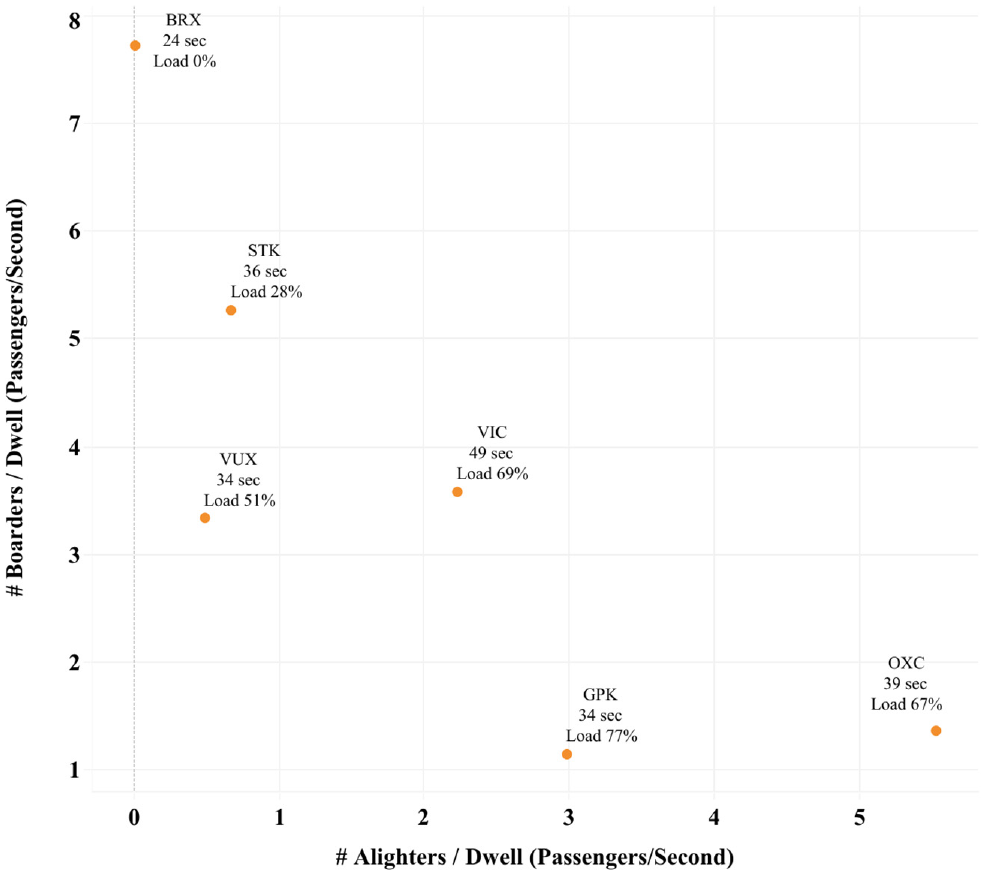
The ratios of the numbers of passengers per second of dwell time.
The stations with the highest value on the y-axis or on the x-axis are preferred from the efficiency point of view, as they represent higher ratios of the number of passengers per second. A best-practice frontier would be formed from the stations with the highest efficiency compared with other stations. Considering the results under the CRS assumption presented in Table 2, Brixton and Oxford Circus stations have the highest efficiency score (efficiency score = 1) where one station has the highest boarding rate, and the other has the highest alighting rate.
When this research considers that the efficiency of the dwell time at stations with different demand profiles is not comparable, it is necessary to classify the demand profiles before benchmarking the stations. High-passenger-volume stations should be classified into three groups, namely boarder-dominant, alighter-dominant, and bi-directional flow stations. Then, stations with the highest efficiency score of each group (which are Brixton, Oxford Circus, and Victoria, respectively) should be considered as a best-practice frontier.
Evaluation Based on Crowding Inside Trains
There is another important factor which has not yet been considered. Crowding inside trains (on-board passengers before arriving at the station) could be another factor that results in the high level of interactions between passengers.
Loadweights on trains before arriving at high-passenger-volume stations in Figure 5 show that three out of six stations are stations with pre-load on trains over 60% (roughly four passengers per m2). Among these stations, it is obvious that the dwell times at Victoria station are exceptionally high. Other high-passenger-volume stations, which have much lower dwell times of less than 40 s, have a predominantly one-way flow movement. In this case study, there is only Victoria station which has a bi-directional flow. Therefore, it may not be possible to conclude from this current study how crowding inside trains affects the dwell times. The factor could affect the stations with uni-directional flow and bi-directional flow differently. Further investigation should collect the loadweight data at each station separately and analyze with the dwell times.
The situation at Victoria station is interesting with regard to the challenge that it has to handle high passenger volume with bi-directional movement, and the trains arriving at Victoria station are exceptionally crowded. More stations (on the southbound service, or other lines) with the same characteristics as Victoria station should be investigated to prove that this station characteristic could lead to an extremely high dwell time and result in train delay.
Considering the dwell time efficiency of Victoria station’s upstream stations, some have lower efficiency scores. Controlling passengers at these stations to get a lower number of passengers on trains and making trains less crowded before they get into Victoria station might help reduce dwell time at Victoria station. There are many researchers developing line-level passenger flow control models, which basically is the approach to control passengers at upstream stations to make space on trains available for passengers at the critical station ( 27 – 29 ). The approach should be studied and applied on Victoria line.
Station Classification and Train Dwell Time Evaluation
This research proposes the classification of stations according to their characteristics and supports further research to develop different dwell time models for stations with different characteristics. Table 3 shows an outline of types of stations derived from the results of this paper combined with the findings from other studies. Stations are classified based on passenger volume, passenger movement direction, and crowding inside trains.
Types of Station and Train Dwell Time Evaluation
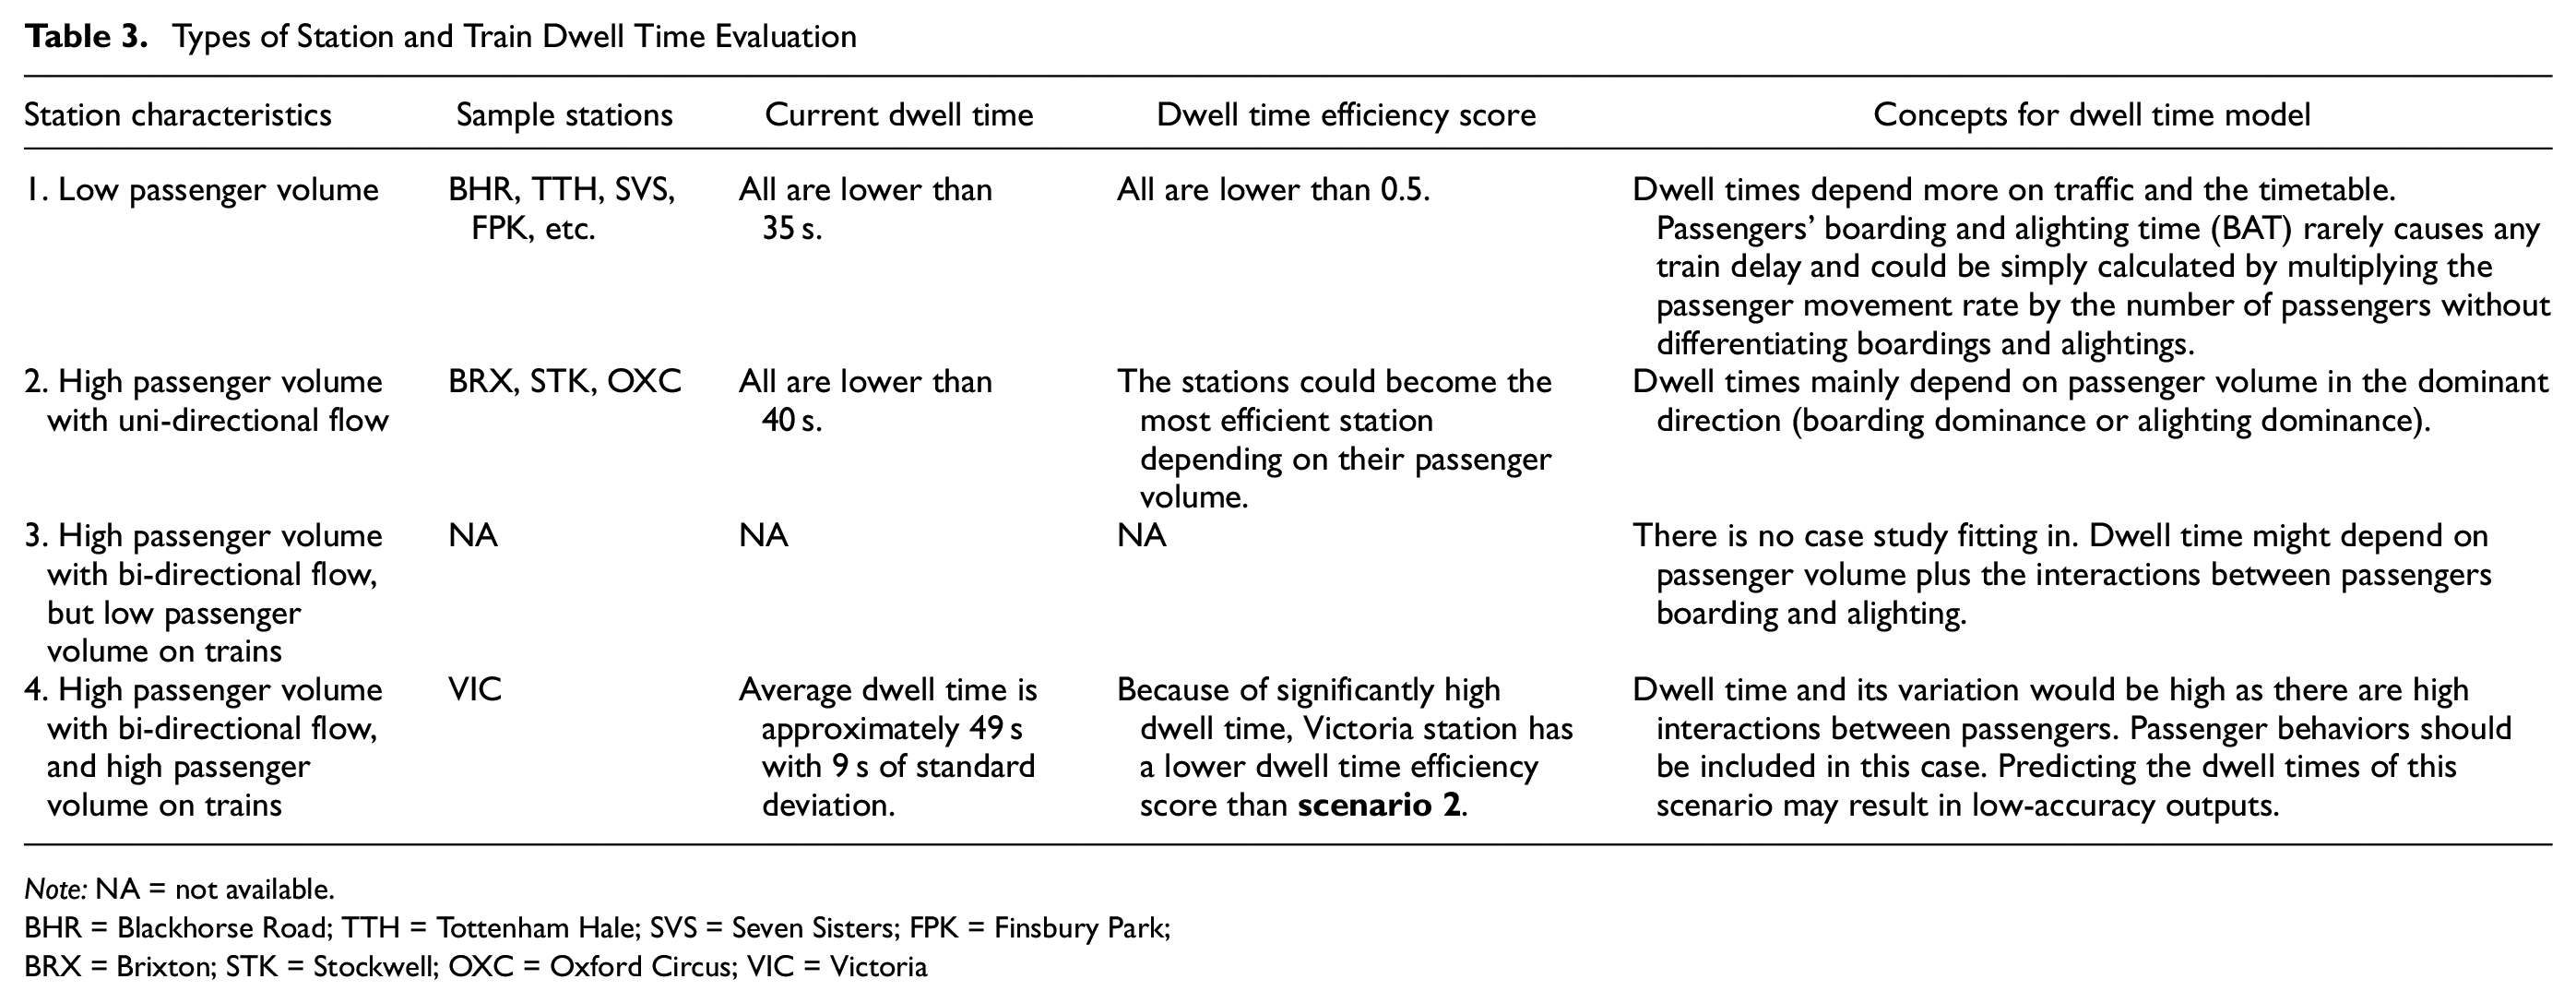
Note: NA = not available. BHR = Blackhorse Road; TTH = Tottenham Hale; SVS = Seven Sisters; FPK = Finsbury Park; BRX = Brixton; STK = Stockwell; OXC = Oxford Circus; VIC = Victoria
Conclusions
This research attempts to obtain insight into the complexity of dwell times, especially the dwell times at Victoria station where there are high interactions between passengers. There have been previous studies on dwell time which conducted experiments on passenger-related factors that affect the train dwell time; however, the experiments were conducted within limited scenarios. This research uses actual data which could reflect all existing scenarios. In addition, there has been much research which developed equations to predict train dwell time, although actual dwell time is too complicated to predict with one equation. This research proposes that the accurate evaluation of dwell time should be conducted by classifying stations according to their characteristics.
Stations on the northbound service of the Victoria line during the morning peak time have been analyzed concerning their different characteristics, namely the number of passengers boarding, the number of passengers alighting, and passenger movement direction. The study applied a DEA approach to evaluate and compare train dwell times at each station.
In conclusion, results indicate that the dwell times of the low-volume stations are all less than 35 s, and the dwell time efficiency score increases relative to the increase in passenger volume. In the low-passenger-volume stations, there are fewer passenger interactions. The general dwell time prediction models being developed are more reliable for the low-volume stations. However, as mentioned earlier, the actual dwell times in low-passenger-volume stations might be dominated by train traffic issues which may lead to a longer dwell time than necessary. In the case of high-volume stations, it is necessary to differentiate between the numbers alighting and boarding or to consider passenger movement direction (uni-directional or bi-directional flow). In addition, the density on trains might be relevant as it results in high levels of interaction between passengers. The density on trains could affect the stations with uni-directional flow and bi-directional flow differently.
In future work, the authors will focus on stations with the same characteristics as Victoria station (which has high passenger volume with bi-directional flow, and trains arriving are crowded) to demonstrate that these station characteristics could lead to an exceptionally high dwell time. This is the key component in future attempts to develop an approach to solve train delay at these stations.
Footnotes
Author Contributions
The authors confirm contribution to the paper as follows: study conception and design: T. Natchaya, F. Taku; data collection: W. Howard, W. David; analysis and interpretation of results: T. Natchaya; draft manuscript preparation: T. Natchaya. All authors reviewed the results and approved the final version of the manuscript.
Declaration of Conflicting Interests
The author(s) declared no potential conflicts of interest with respect to the research, authorship, and/or publication of this article.
Funding
The author(s) received no financial support for the research, authorship, and/or publication of this article.