
Abstract
Academics and the maritime industry have used the Heinrich Pyramid for decades to justify overall safety theory, risk assessments, and accident prevention strategies. Most use Heinrich’s original severity ratios (1:29:300) for accident causation development in a factory setting. However, to use the Pyramid effectively and mitigate risks/hazards, it must be calibrated to represent specific industry reality. This paper, for the first time, focuses on calibration of Heinrich’s Pyramid to maritime accident data, using databases from the Marine Accident Investigation Branch of the Department for Transport. This research clusters five years (2013–2017) of accident data, using K-Means clustering on categorical variables and severity levels of accidents, similar logic to Heinrich’s analysis. This approach and descriptive statistics provide new ratios between accident severity classifications for casualties with a ship (CS) and occupational accidents (OAs) separately. Results show that the data do not appear to fall into Heinrich’s Pyramid shape and yield a vastly different and lower ratio to that of Heinrich’s. Especially concerning was that Very Serious and Serious accidents occurred at a 1:5 ratio for CS and 4:1 for OA, very different from Heinrich’s 1:29. Although these results calculated a new ratio, it may not represent reality owing to accident reporting requirements under UK law, a lack of an agreed taxonomy of risk and hazard definitions, and likely underreporting of less severe accidents. This is proven because, in 2017, CS data became pyramid shaped, after a decrease in the number of accidents and a 17% increase in near-misses.
The port industry in the United Kingdom (UK) is the second largest in Europe, and the nation’s industry greatly benefits from the economic infrastructure supported by port operations ( 1 ). Because of the importance of maritime shipping, there are many ports around the UK’s coastline, displaying a wide diversity, and more than 95% of the UK’s trade passes through them ( 1 ). Over 100,000 people work directly for the port industry in the UK and they have an essential role in supporting different sectors, such as fishing, leisure, freight, and offshore industries ( 2 ).
The International Maritime Organization (IMO), the United Nations body responsible for regulating global maritime shipping, describes shipping as one of the world’s greatest industries and its most dangerous ( 3 ). Crucial to the industry’s success is its ability to rapidly analyze the potential risks to vessel, persons, infrastructure, or the environment, and to prevent or manage risks from becoming catastrophic accidents. Maritime traffic has increased in the number, speed, and size of vessels, all of which has an irrefutable impact on port area safety ( 4 ). Although the number of reported accidents in the UK has decreased over the past decade, the average yearly number of accidents in UK ports is still high ( 5 ).
As with other transportation modes, the maritime sector concentrates on the safety of both crews and vessels, both to prevent loss of life and minimize the physical and environmental impacts. Unlike more recent industry developments (e.g., in aviation) that benefit from a thoroughly modern outlook on safety, the maritime domain’s safety practices have developed over centuries of operation. Shipping being one of the oldest socio-technical systems of human invention ( 6 ), the seafarer’s instincts and skills to assess and manage a dangerous situation are paramount and result in a conservative approach to updating safety needs/culture, including incident reporting.
The UK’s Marine Accident Investigation Branch (MAIB) classifies maritime accidents into two categories: Casualty with a Ship (CS) and Occupational Accident (OA). A CS happens when an accident affects a ship, its equipment, or its cargo, whereas an OA refers to people being harmed on-board a ship ( 5 ). Moreover, each marine incident can be categorized, according to its severity, as: Very Serious (event resulting in severe pollution, loss of life or ship), Serious (event resulting in less severe pollution, partial loss of ship or breakdown needing shore assistance), Less Serious (any other marine casualty), and Marine Incident (near-miss). However, the MAIB requires reporting of Serious and Very Serious accident levels only, leading to a large potential for underreporting of less severe incidents ( 5 ).
Shipping and ship operations within port areas result in hazards and create the potential for accidents. Safety theories suggest using safety indicators as one of the best methods to evaluate risks present in a port operating environment and to establish and test potential remedies.
One such theory is Herbert Heinrich’s Pyramid (Figure 1) and his associated Domino Theory, used by organizations to understand risk and set goals to reduce or prevent accidents. The Pyramid theory is based on accident causation patterns and asserts that less serious incidents over a longer period may have the potential to manifest into a more severe accident ( 7 ). By focusing on the cause of the less serious incidents, and by understanding the ratios between incident severity levels, the system can help to prevent the greater accident from happening.
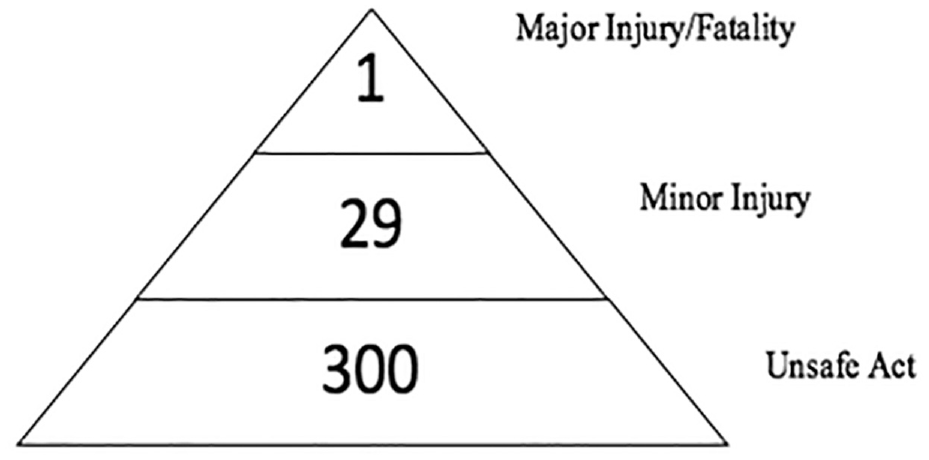
Heinrich accident pyramid ( 7 ).
Although the Pyramid is an adequate rule-of-thumb for safety planning, like any theory it must be tested and updated.
To use the theory, industries need a set taxonomy for hazards/incidents and data to calibrate it. Whereas the aviation community and aviation-focused academic literature use the Pyramid for analyzing accident prevention regimes, the maritime sector’s use of the Pyramid is minimal, and whether the Pyramid is the right safety theory for the industry is not clear. This paper uses data collected nationally by the MAIB to assess a possible calibration of the Pyramid for maritime, specifically for accidents involving vessels traveling or berthed within a UK port area.
This paper is organized as follows. A review of the available literature is conducted in the next section, specifically the Pyramid’s use and any previous calibration in maritime academic or industry literature. The following sections then establish a methodology for calibrating the Pyramid to UK port marine accident data from the MAIB. This calibration, by using K-Means clustering analysis, is shown in the subsequent sections and discussed further.
Literature Review
Scant literature exists that analyzes and calibrates the Pyramid and associated Domino Theory to explain maritime safety in depth. Maritime risk literature more broadly cites the Heinrich Pyramid without any industry calibration or analytical basis, including textbooks that use it to explain accident causation theory or broad maritime safety theory ( 8 – 10 ).
Major maritime organizations, including the International Chamber of Shipping (ICS) and the Protection and Indemnity Club often use the Pyramid in safety briefing (11, 12). The ICS asserted in its publications that if 30 serious incidents could be prevented, a life had been saved, following Heinrich’s original ratio calculations ( 11 ). Maritime safety training uses the Pyramid in a similar way for marketing. Recently, the UK Standard Club, a maritime and shipping insurance association, used the Pyramid and original ratios as a justification for near-miss reporting to maritime safety.
Understandably, because the Pyramid prescribes learning from minor incidents and non-fatal accidents, literature examining near-miss reporting uses the theory extensively (13–16). The Pyramid was not always referenced but the overall theory was, most specifically by the IMO when they called for greater near-miss reporting, using logic like Heinrich’s ( 17 ). Even within the UK, the Pyramid came up in discussions on UK CHIRP, a confidential maritime incident reporting service, as a clear example of the need for greater near-miss reporting ( 18 ).
The Pyramid in maritime safety was analyzed by Anderson’s 2003 work on implementation of the IMO’s International Safety Management (ISM) Code ( 19 ). Anderson, through a large-scale survey of the shipping industry, investigated the reporting process for near-misses, incidents, and dangerous occurrences. He identified that minor incidents were routinely underreported, in large part because of the reluctance of seafarers to report. His work made no attempt to directly calibrate the Pyramid.
Only two studies reference calibration of the Pyramid for the maritime sector. First, Landsburgh ( 20 ) references a 1990s–2000s long-term study by Det Norske Veritas and asserts that the accident data are representative of the original Pyramid. This study, however, only focused on the Norwegian offshore oil and gas industry ( 21 ) and did not provide a methodology.
The most similar research to this paper is a 2010 paper by Stade ( 22 ) at Chalmers University in Sweden. Stade’s work focused on compliance with the ISM code in Sweden, and his methodology combined formal accident reporting data with interviews of five Swedish shipping companies. Stade attempted to apply incidents to a model like Heinrich’s, but questioned whether the data available gave meaningful results. Similar to Anderson, Stade based much of his analysis on previous ISM code research ( 19 ).
A study conducted by ConocoPhillips Marine in the early 2000s built on the original Pyramid, rather than calibrate the existing ratios. It added a new dimension to the Pyramid, stating that 300,000 at-risk behaviors would cause one fatality. This study lacked any public research or methodology and was described in other sources only (23, 24). Although this paper considers this information, it does not rely on it, not knowing its scope.
Overall, little rigorous research exists analyzing the use of the Pyramid in maritime safety theory, or appropriate accident ratios for safety planning/analysis. Use of the Pyramid as a basis for safety or even as a simple visualization of maritime safety can be dangerous if it is not properly calibrated. This paper seeks to provide a more detailed Pyramid tailored to the UK maritime sector, using the sector’s own accident classifications and definitions.
Methods
This paper seeks to calibrate the Pyramid using waterside accident data for 275 UK ports (Figure 2) collected by MAIB. Datasets were consolidated, cleaned, and verified to ensure that definitions and classifications were consistent. This process resulted in unique accident panel data that cover the period of 2013 to 2017 calendar years. Observations are analyzed with descriptive statistics and clustering analysis (K-Means) to investigate accident relationships, specifically across severity levels. Clustering analysis is designed to follow Heinrich’s logic of less severe incidents leading to major accidents. The database and the results are interpreted considering the current safety regulations and accident reporting required by UK ports.
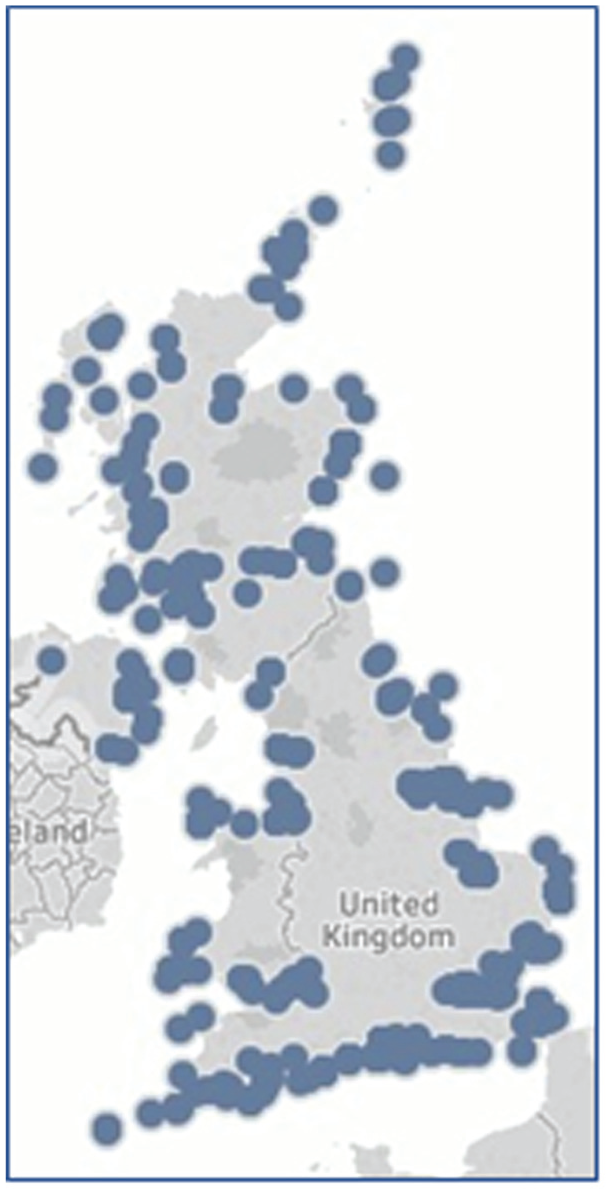
Ports included in the analysis.
To supplement the literature review, the authors met with members of the UK maritime sector for informal conversations. It was agreed with participants before the discussion that nothing they said would be directly attributable, to allow for more honest dialog, but comments would be used for context in research/analysis.
Data
A dataset of accidents reported at the ports of the UK from 2013 to 2017 was provided by MAIB of the Department for Transport, which was obtained under the Freedom of Information Act 2000. The data were extracted from the European Union (EU) database and include 2,546 rows, 2,186 occurrences, 2,489 vessels involved in those occurrences, and 780 details of injured persons or fatalities. The number of rows, occurrences, and vessels differ, as there can be multiple vessels or people involved in one accident, details of which are provided separately. Data only cover waterside accidents, and do not encompass health and safety accidents on the land side of ports, information which is collected by the UK Health and Safety Executive (HSE).
The datafields needed for the safety analysis are determined. Subsequently, data quality is assessed following the methodology of Psyllou and Majumdar ( 25 ) and using nine data quality dimensions: accessibility, accuracy, consistency, completeness, credentials, interpretability, relevance, timeliness, and level of detail of the narrative description.
Selection Criteria
Only accidents occurring within a UK-designated port area (to all vessels) are considered in this analysis. The specification of “Port Area” was chosen as it provides the most consistent hazard exposure for all vessel types involved. Entering or exiting ports is one of the more dangerous periods during a vessel’s voyage because of congestion (other vessels) and the presence of fixed objects in the water. Although individual ports have small datasets, the MAIB data provide national-level reporting and encompass many UK ports, making these data ideal for this analysis.
Period of the Data
The 2013 to 2017 accident data are suited to the analysis given relevance to current operations (technology and operation patterns), safety climate, and accident reporting and investigation working definitions. Although prior datasets would be useful, scope and definition changes required under IMO/EU/UK Regulations make it difficult to establish data consistency before 2012.
Data Extraction
Descriptive Statistics
The final dataset is analyzed using SPSS and Python for descriptive analysis. This identifies overall variable frequencies, frequencies confined to severity levels, and the analysis of types of injuries and affected parties. First, the datafields are standardized in SPSS using descriptive statistics. Second, the K-Means clustering function is used for different numbers of clusters. Last, the ANOVA table is analyzed to determine which datafields do not have a significant impact on the analysis and should be removed.
Clustering Analysis for Calibration of the Pyramid
Data are entered into SPSS for clustering analysis using K-Means clustering, an unsupervised clustering method that uses a machine learning algorithm to partition a dataset into segregated and exclusive groups based on data similarity. Because of the lack of proper contextual background for identifying superior variables, all relevant variables (where possible) were included in analysis (26, 27).
K-Means is an iterative refinement testing system (Figure 3); a point is chosen at random to be a centroid for a cluster, and others are matched with the algorithm calculating the minimum in-cluster variation of all data using the squared Euclidean distance, or D in Equation 1. “n” is the number of observations, “x” is the location of a data point on the vertical axis, and “y” on the horizontal axis in a Euclidean space.

The equation is repeated until all distances are minimized. A large majority of data features are text strings, some standardized—repeated on a specific categorical basis—and others are wholly unique text strings. Categorical text strings are converted into unique numeric values that can be applied in clustering algorithms. Unique number values, such as “Unique ID,”“MAIB Vessel ID,”“Date of Occurrence,” and specific Latitude/Longitude points, were removed from the calculations, as they would be detrimental to clustering (each would be its own cluster). The wholly unique text strings of Case Description and Location Description were also ignored, as they were non-repeating and thus could not be standardized.
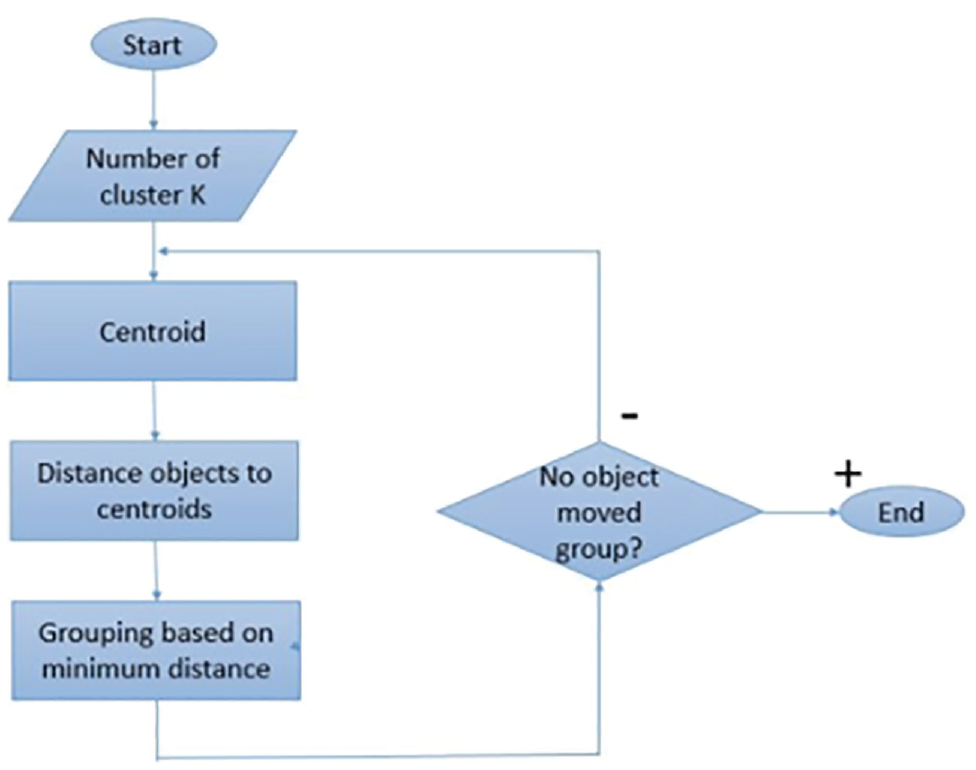
K-Means clustering process ( 28 ).
To begin clustering analysis, the first step is to establish the number of clusters sought. Using Python, a series of elbow graphs (explained variance by cluster size) are compiled to determine optimal clustering patterns. The test shows the optimal clustering, which is then re-run a total of ten separate iterations. For minor experimentation, to mimic Heinrich’s observation, it is first sought to have clusters of 330 accidents, then to limit “Very Serious” accidents to potentially one per cluster.
Results
CS and OA reported at UK ports were provided by MAIB of the Department for Transport. From 2013 to 2017, a total of 2,546 accident reports were submitted. The reports were associated with 2,186 individual accidents, 2,489 vessels, and 780 casualties.
Initial Results
After data cleaning, the dataset contained 1,627 data points from 1,352 unique accidents. Accidents involving two or more vessels were dissected so data from each vessel involved would be analyzed separately. A total of 35 variables were present in the final dataset, 19 of them being useful for the clustering analysis (Table 1). Initial frequency calculations showed that the data did not represent Heinrich ratios (1:29:300) but contained 14 “Very Serious” accidents, 67 “Serious,” 714 “Less Serious,” and 557 “Marine Incidents” (Figure 4). The data are not pyramid shaped, but more that of a diamond. Also, the ratio between “Very Serious” and “Serious” was closer to a 1-to-5 relationship, than Heinrich’s original 1-to-29. Excluding the near-misses which are not mandatory to report, the data are indeed pyramid shaped with ratios 1:5:51.
List of Datafields
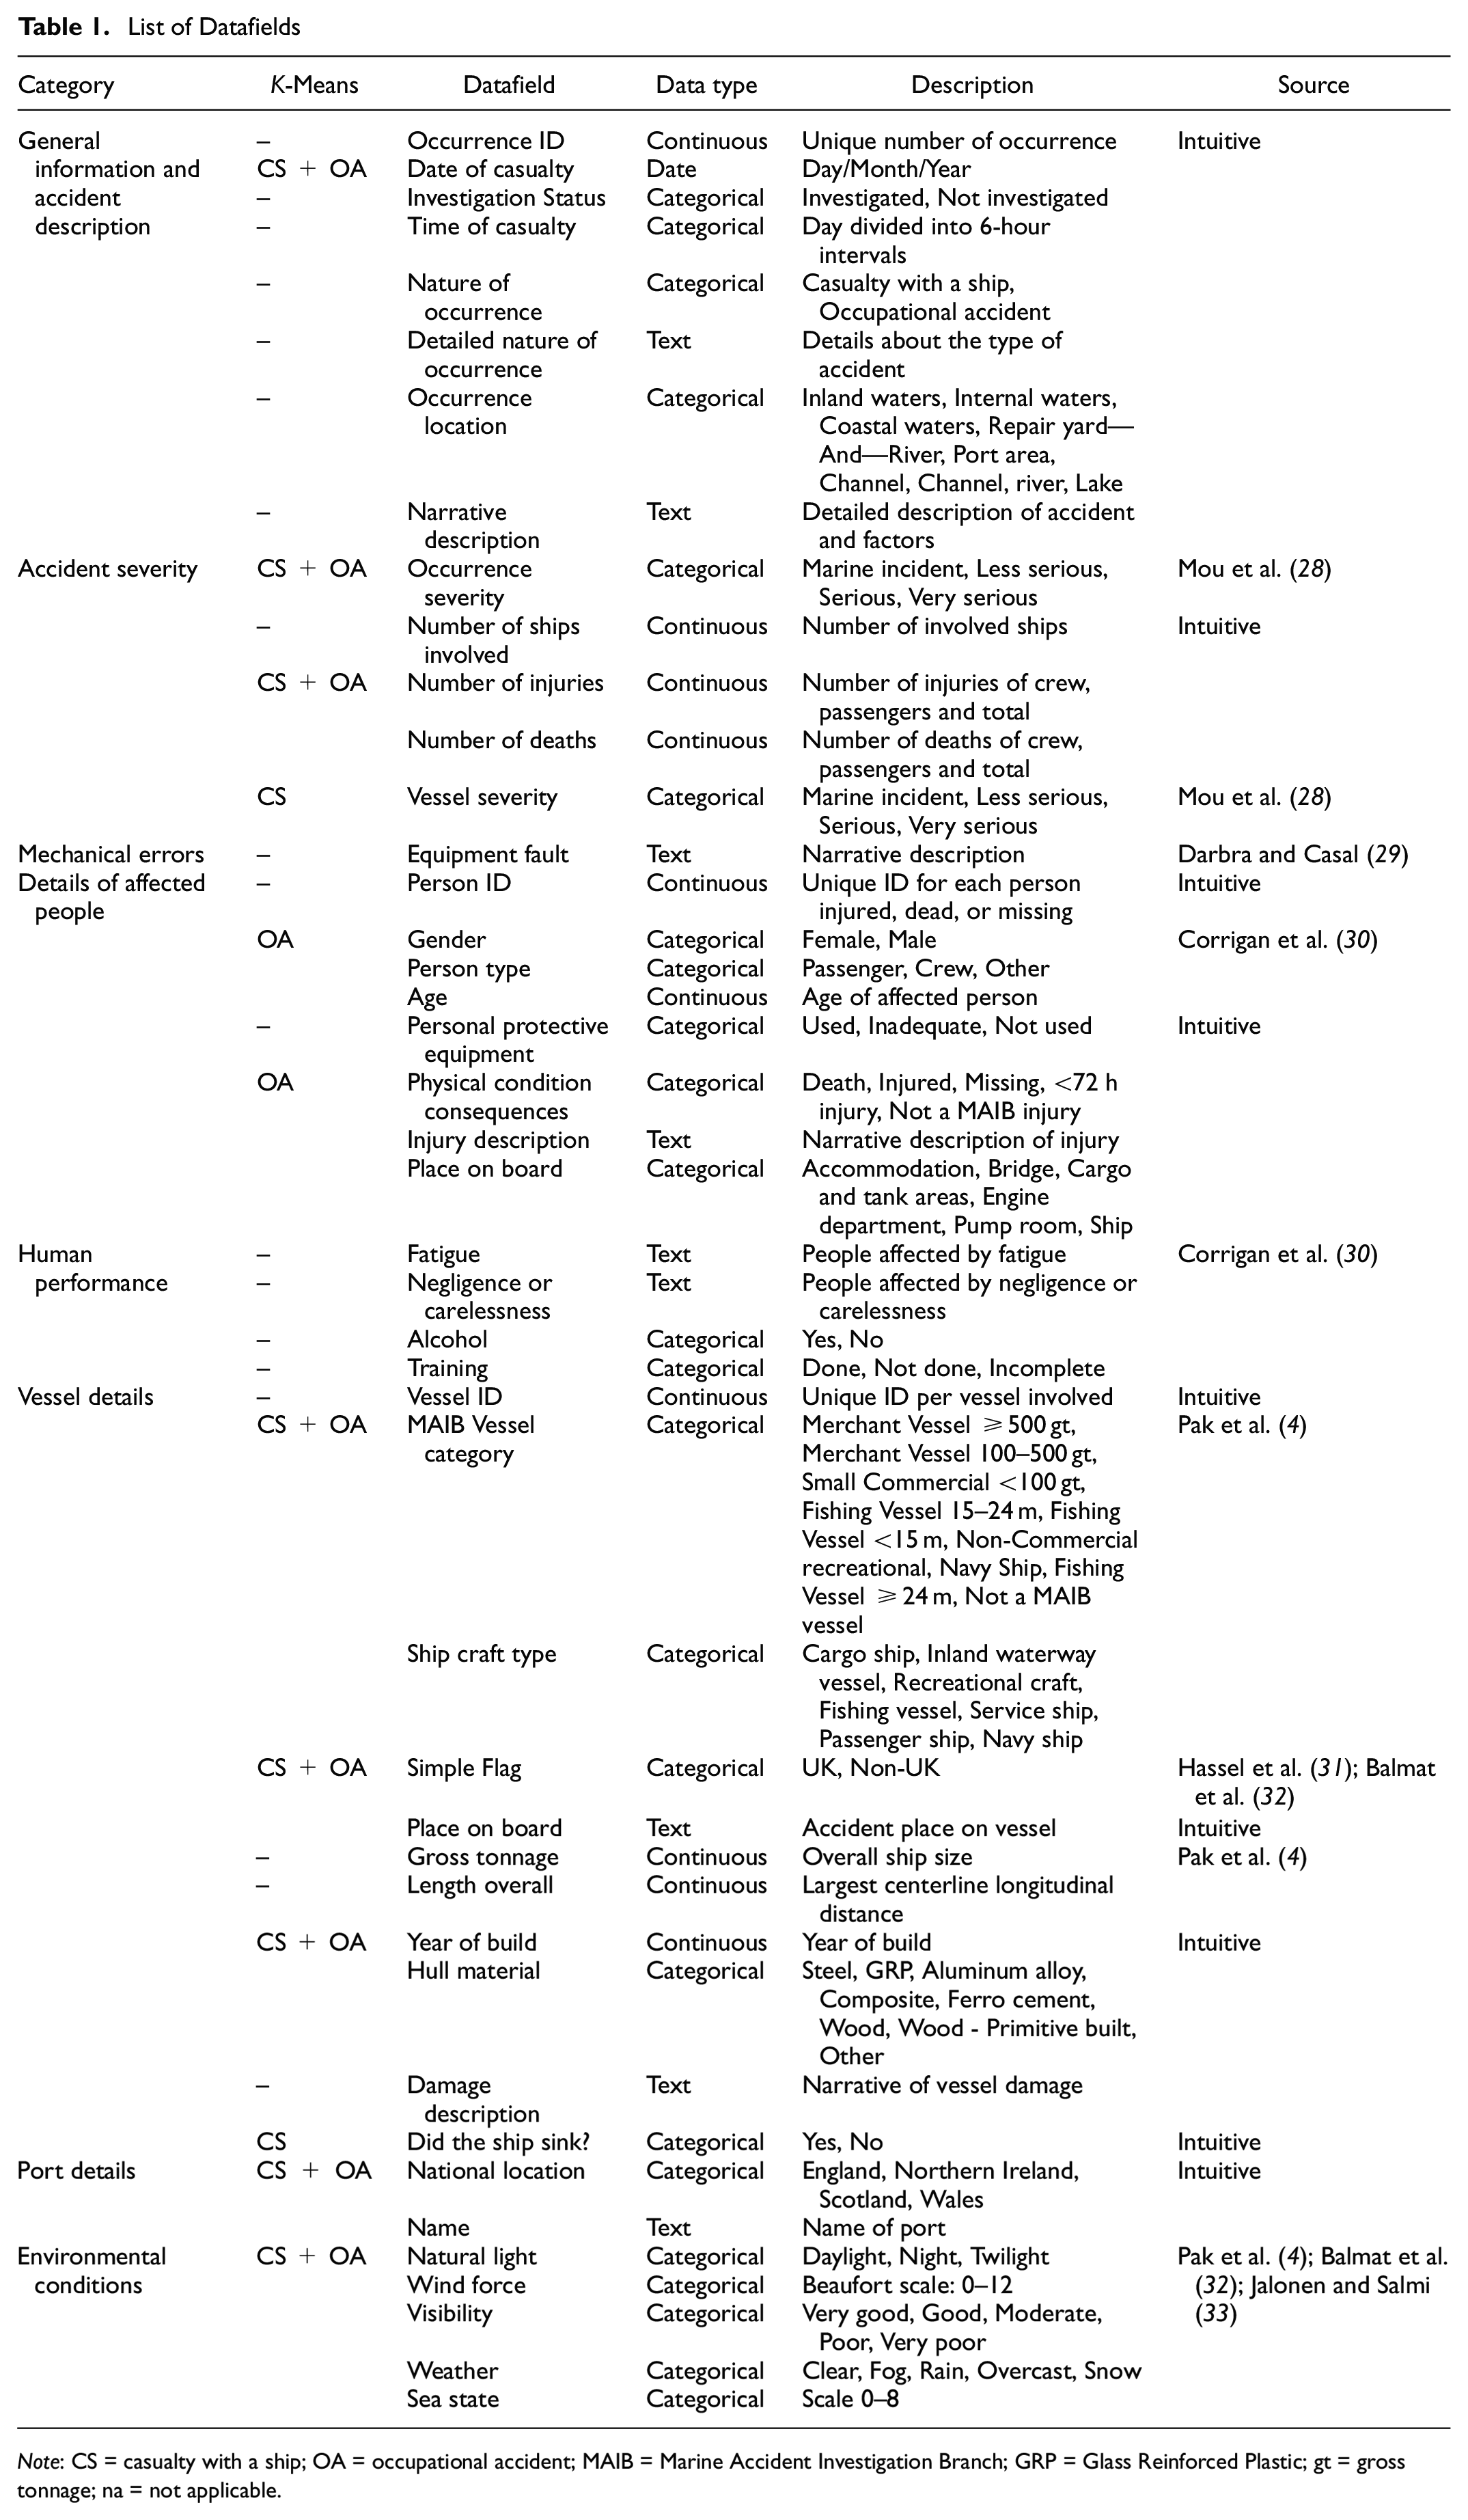
Note: CS = casualty with a ship; OA = occupational accident; MAIB = Marine Accident Investigation Branch; GRP = Glass Reinforced Plastic; gt = gross tonnage; na = not applicable.
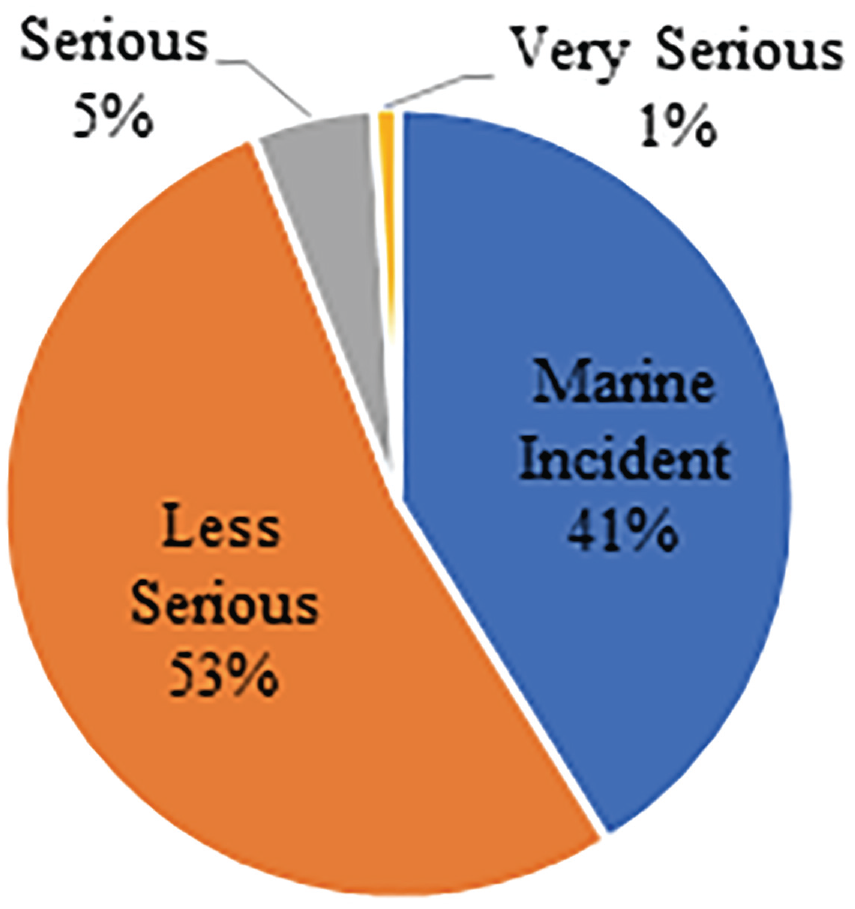
Casualty with a ship accident severity.
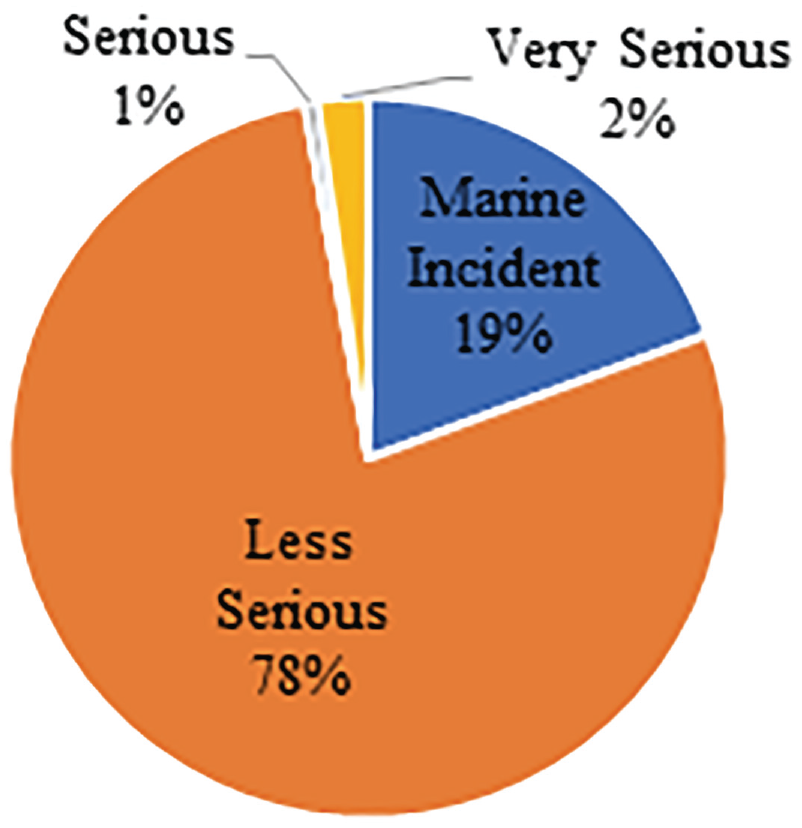
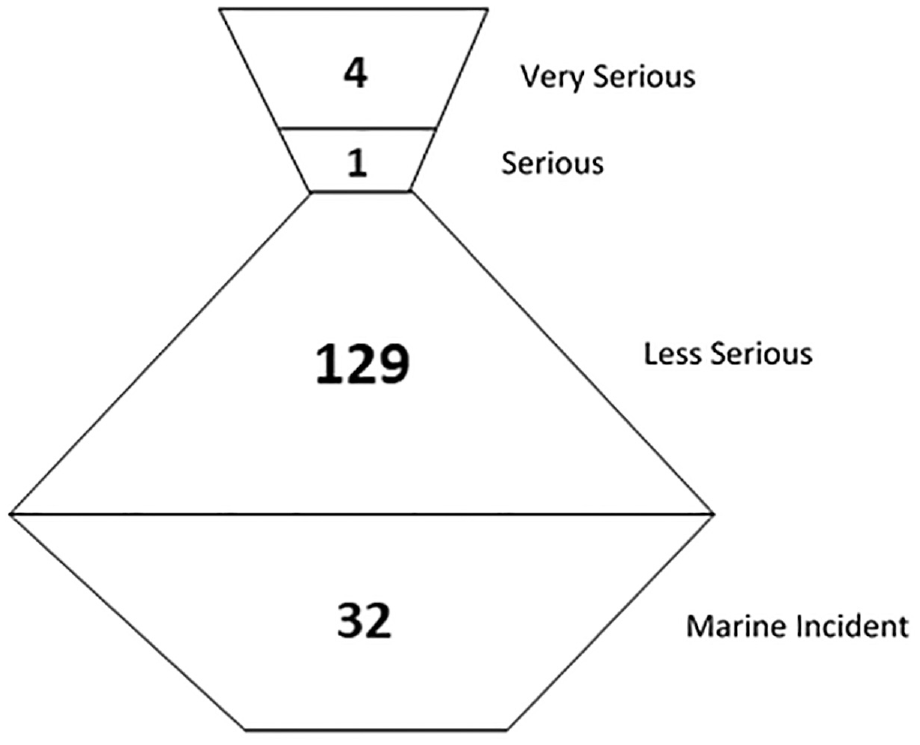
The OA dataset contained, after data cleaning, 683 data points from 664 unique accidents. Accidents involving two or more people were left separated by individuals. A total of 35 variables were present in the final dataset, 24 of them being useful for the clustering analysis (Table 1). Initial frequency calculations showed that the data did not represent Heinrich ratios (1:29:300). Data contained 15 “Very Serious” accidents, 4 “Serious,” 516 “Less Serious,” and 129 “Marine Incidents” (Figure 5). The data are not pyramid shaped but more that of an hourglass, and Very Serious accidents represent a much larger percentage of OA than for CS (2.3% versus 1%). Also, the ratio between “Very Serious” and “Serious” was reversed and close to a 4-to-1 relationship.
Occupational accident severity.
Data Quality Assessment
The data quality assessments are summarized in Table 2. The data were easily comprehended, accurate, and obtained from a credible stakeholder. On average, accident reports were submitted within 10 days. Some 75% of the data was provided and the format was consistent during the study period. Overall, the dataset possessed relevant datafields that were directly accessed (e.g., accident severity, weather, wind force).
Data Quality Assessment
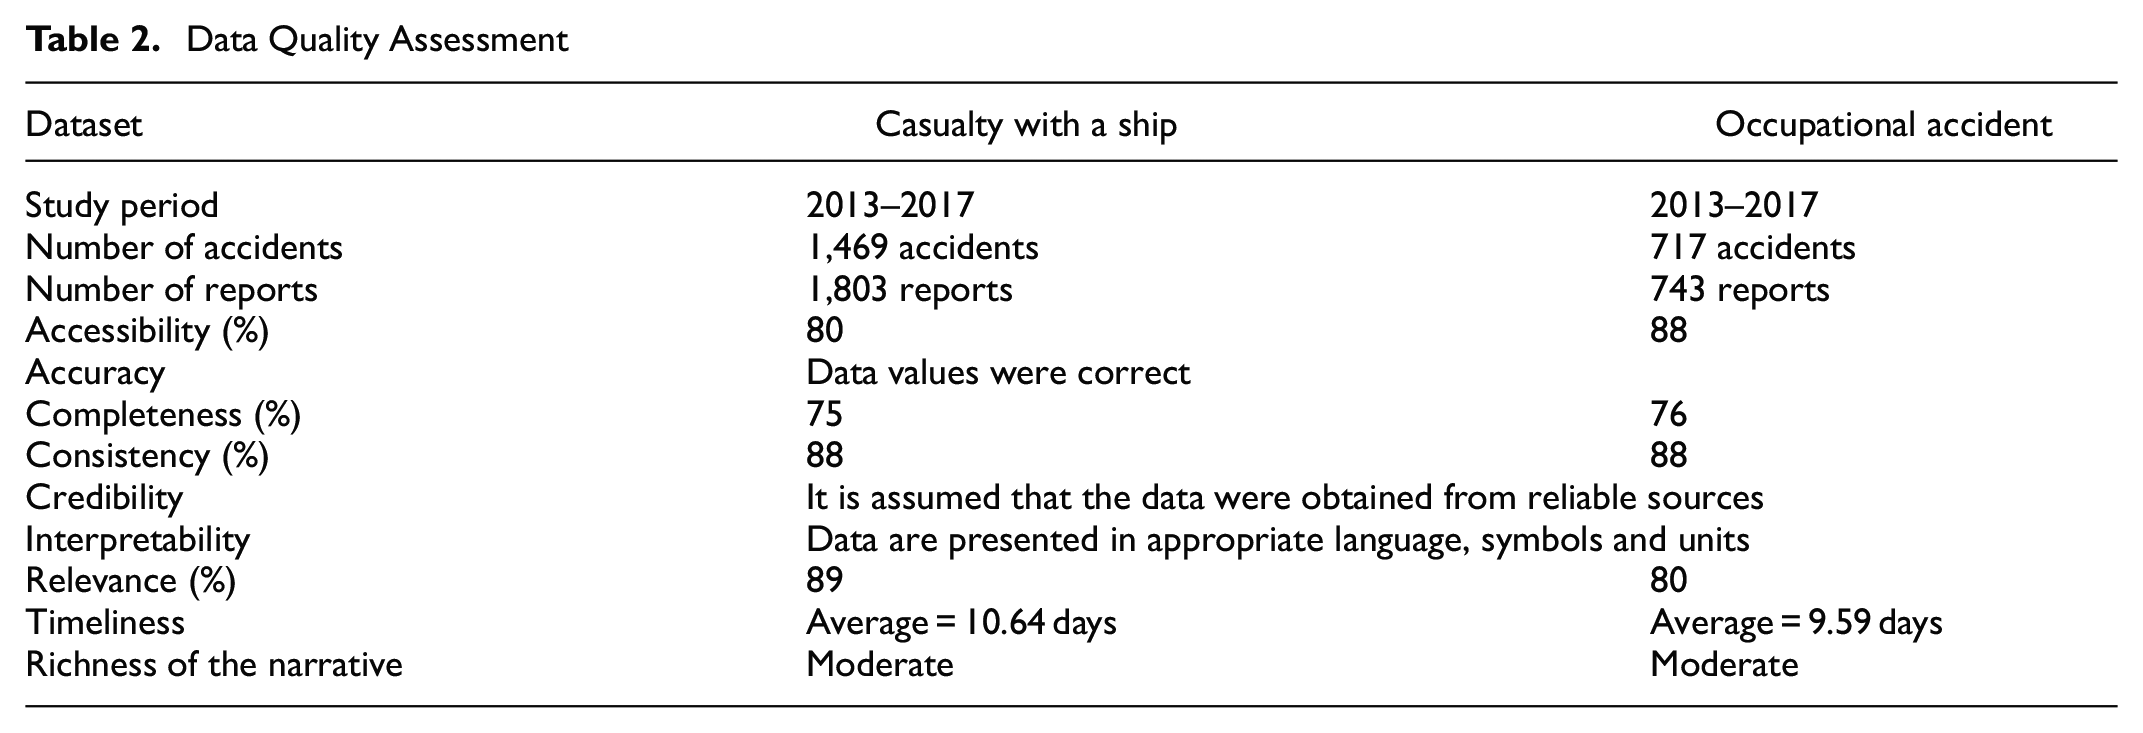
Narrative descriptions of OA and CS were moderately detailed, so not all narratives could be analyzed. Detailed narratives included a comprehensive description of how and why the accident occurred. For CS, human factors (e.g., decisions made by humans, negligence, fatigue), the impact of new technologies, and the procedures (e.g., expected communication when something goes wrong) were missing. Instead, these narratives provided extensive information on physical damages. For OA, narratives focused on the affected people (e.g., gender, age, injury). Therefore, the reduced sample of detailed narratives prevents us from analyzing the human and system performance. Only the remaining data fields were analyzed for the historical analysis as the dimensions scored high values.
Descriptive Statistics
Casualties with a Ship
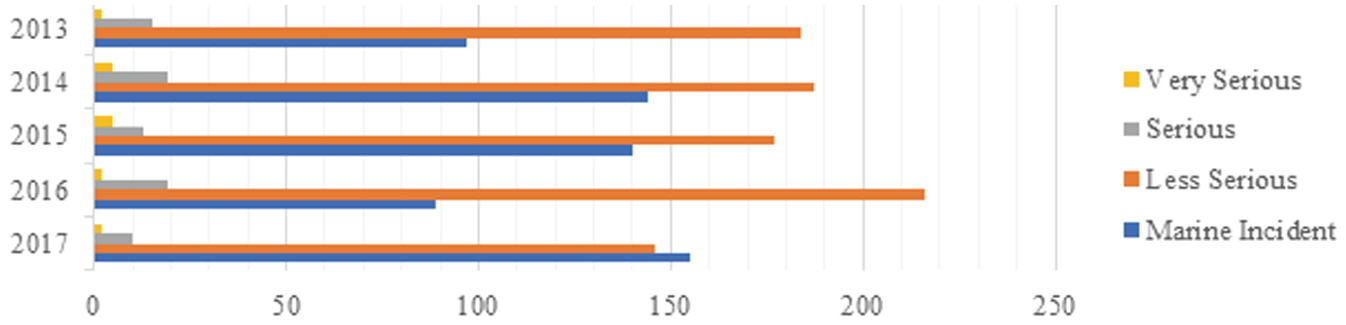
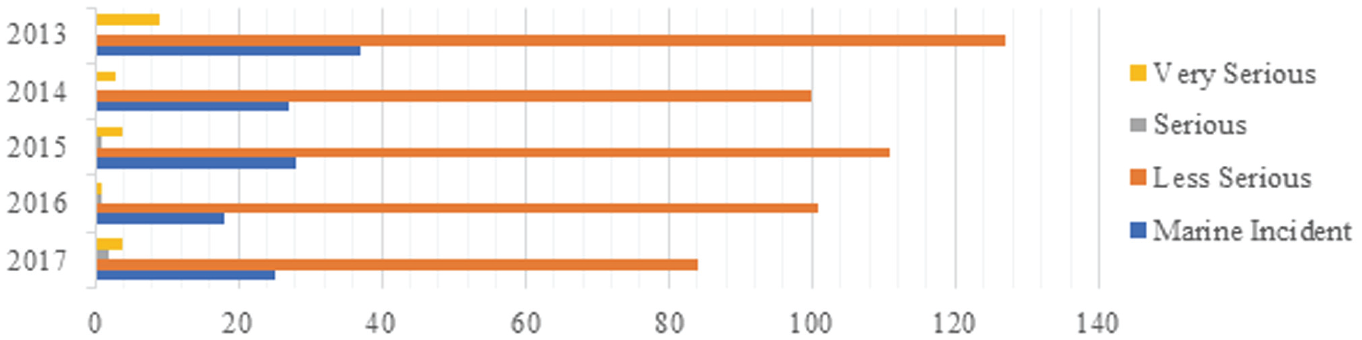
The number of reported CS increased over the studied period. This change probably results from improved safety and health awareness ( 30 ), as all severity categories decreased apart from the near-misses, which increased considerably by 17% (Figure 6). The number of Less Serious CS followed an increasing trend up to 2016, then decreased significantly by 32.4% in 2017. On average, these accounted for 55.9% of the accidents. Serious and Very Serious accidents only accounted for 4.7% and 1% of the accidents, respectively. It is noted that, in 2017, the data suddenly became pyramid shaped, with ratios 1:5:73:78.
Casualty with a ship yearly accident severity.
Both collisions and contacts were the dominating accident types (Figure 7) and accounted for more than half of the ship casualties, representing 26.8% and 28.5% of the CS, respectively. A collision between two ships was the most common type of collision. A ship contacting a fixed object, such as a pier or breakwater, was the most frequent type of contact. Loss of control was recorded for 15.4% of CS. Grounding, damage to ship/equipment, and fire/explosion reached their lowest values in 2017. Flooding/Foundering, non-accidental and capsizing/listing rarely recorded.
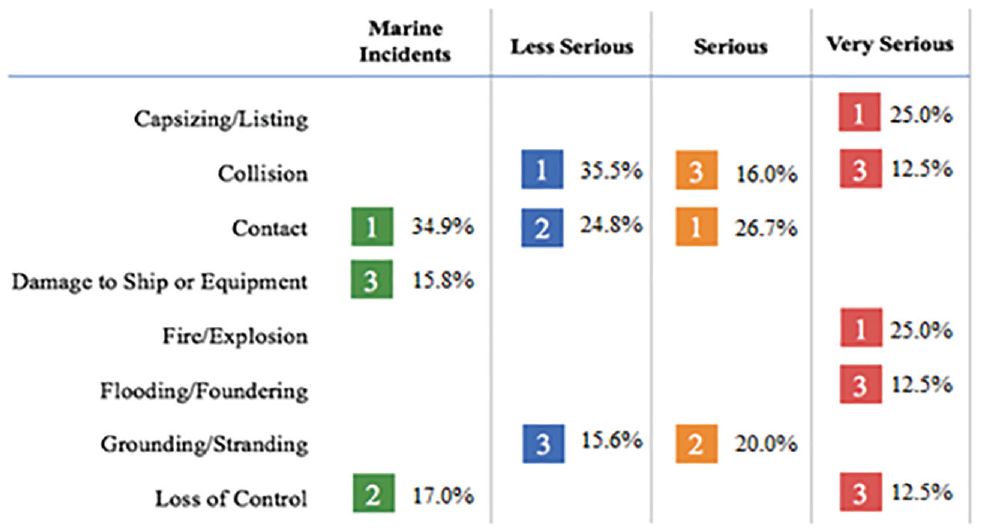
Casualty with a ship accident severity by accident type.
The number of CS involving cargo ships dominated (Figure 8) (39.5% average) and it increased greatly by 30.9% from 2013 to 2017. The next most frequent categories were service (21.7%) and passenger ship (17.4%). There were no accidents on navy ships from 2014 to 2017. There was a significant drop in the number of accidents involving inland waterway vessels and recreational crafts of 73% and 55.6%, respectively.
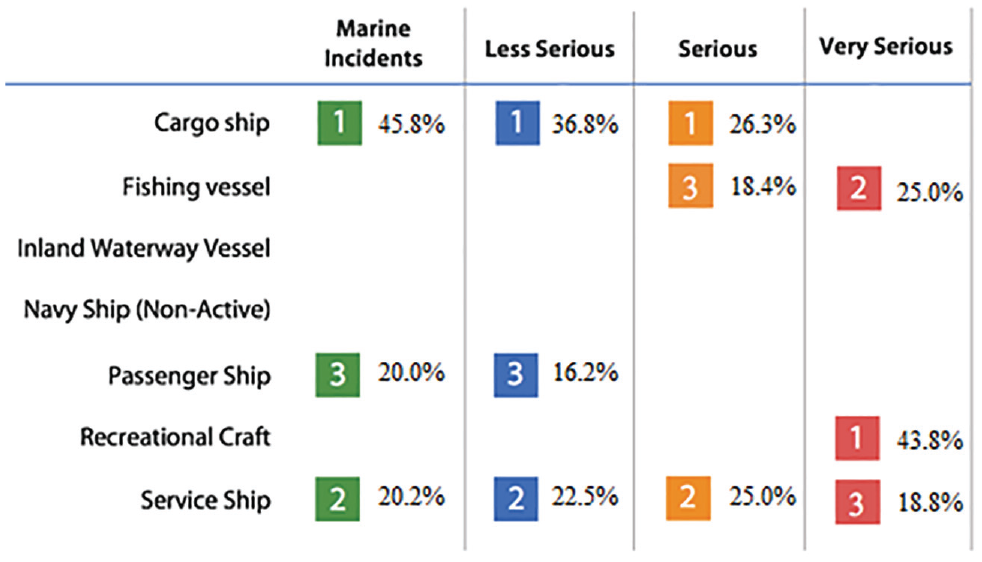
Casualty with a ship accident severity by vessel type.
Most injuries were to males (73.7%) between 25 and 54 years old (32.3%) who were crew (70.7%) and on duty (62.6%). Injuries were often to the whole body or multiple body parts (18.2% of accidents), followed by head (16.2%), and upper extremities (14.1%). On-board the vessel, most casualties (38.4%) were recorded on the ship, followed by cargo and tank areas (14.1%), and accommodation (12.1%). In 7.1% of the CS cases where the information was provided, people did not use personal protective equipment.
In relation to the environmental conditions, most accidents occurred during daylight hours (64.6%), followed by night (30.8%). The weather conditions were provided for only 52.7% of the accidents; however, the completeness rate has improved during the period. Some 42.3% of the accidents occurred during clear weather. The accident frequency during overcast conditions increased from 0% to 14.8%. Some environmental conditions categories had high frequencies of data “unknown” compared with the other datafields, ranging from 23% to 26.4%. Disregarding these, it was observed that most CS occurred in good visibility and sea state conditions (76.1% and 62.1%, respectively) and low wind (54%).
Occupational Accidents
The number of reported OAs decreased over the studied period (Figure 9). Marine incidents and less serious accidents followed a decreasing trend and they accounted for 97.1% of the OAs. Serious and very serious accidents only account for 0.6% and 2.3% of the reported accidents. Most OA incidences involved crew (75.8%) aged 25 to 54 years old (60.4%). In relation to the location of the accident, most OAs (63.3%) were recorded on the ship area (engine department, cargo/tank areas, accommodation and bridge), followed by accommodation (16.1%), and cargo area (13.4%).
Occupational accident yearly accident severity.
The most frequent causes of OA (Figure 10) were slipping, stumbling and falling (45.8%), which coincides with HSE’s observation ( 34 ) for injuries at work more broadly in Great Britain. The total number of OAs involving crew members decreased 34% in 2017 compared with 2013 levels. External injuries from body movement without physical stress were more common (21.8%) than internal injuries (12.3%), usually caused by body movements under or with physical stress. External injuries were often resulted from body movement without any physical stress. The observed period saw a decreasing trend for accidents resulting from loss of control (total or partial) of machine, means of transport or handling equipment, handheld tool, object, or animal. The most common injury types were reported as: bone fractures, dislocation, sprains and strains, wounds, and superficial injuries.
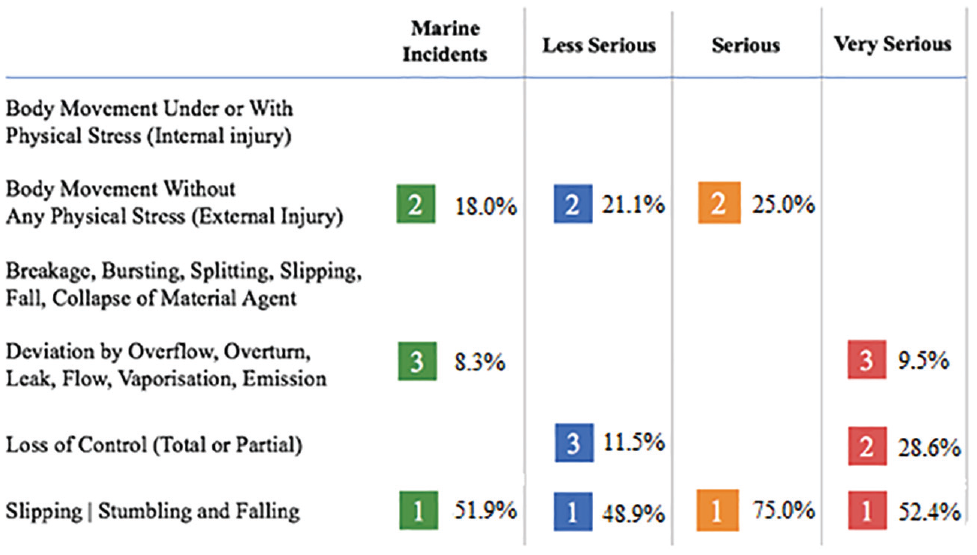
Occupational accident severity by accident type.
Accidents involving passengers accounted for 33.9% of the OAs. Accidents equally occurred at the accommodation area at stairway/ladders, ship boat deck, and ship freeboard deck. Slipping accounted for 77.4% of the accidents involving passengers, followed by body movements without physical stress (15.1%). Most accidents occurred during daylight and good weather conditions. Passengers were injured while on-board a passenger (57%) or recreational ship (21.4%).
Clustering Analysis
Clustering analysis was used to mimic Heinrich’s observations at designated levels. First, sub-sets of 330 accidents were used to follow the total value of Heinrich’s Pyramid (1:29:300). Then, it was sought to have one “Very Serious” accident for each cluster. Finally, the optimal number of clusters was tested. It should be noted that having small clusters does not indicate usefulness, and might show underrepresentation owing to differences in factors contributing to an accident.
The first results of clustering analysis for CS (Table 3) mirrored initial observations. When cluster size was limited to replicated Heinrich’s observations of sub-sets of 330 (five clusters), the results were a larger amount of “Very Serious” than stated in accepted ratios.
Mimicking Heinrich Initial Individual Cluster Size
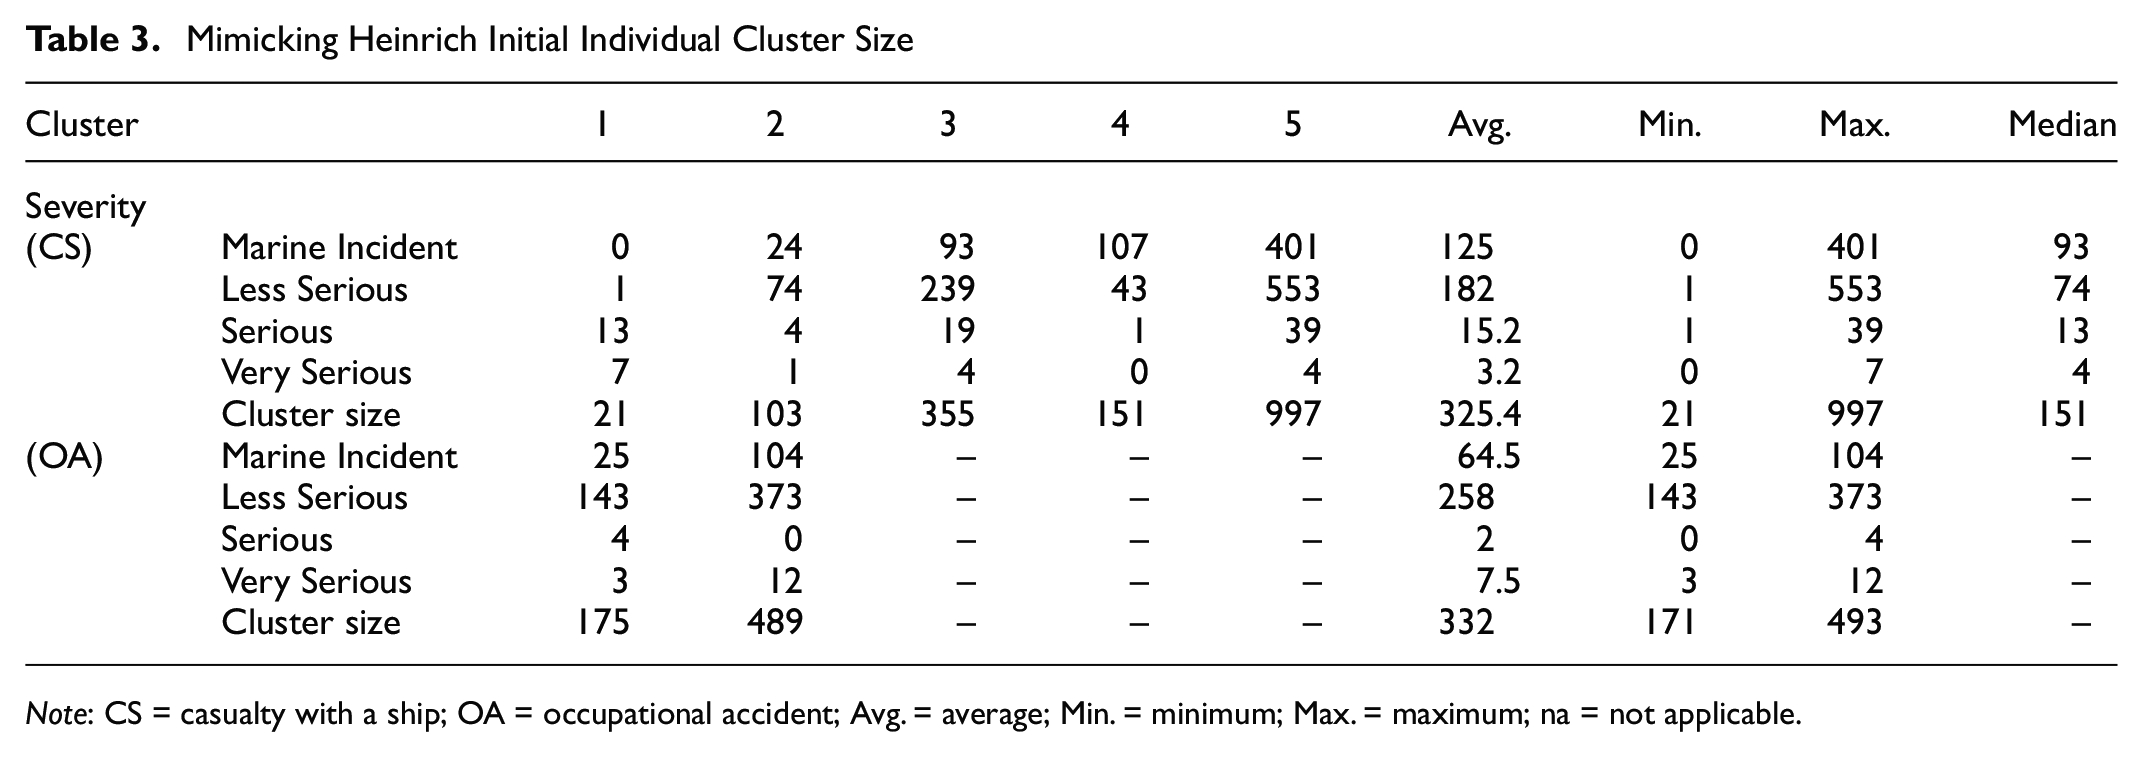
Note: CS = casualty with a ship; OA = occupational accident; Avg. = average; Min. = minimum; Max. = maximum; na = not applicable.
The results for OA (Table 3) did not mirror initial observations. When only two clusters were used to replicated Heinrich’s observations of sub-sets of 330, the results showed again a larger amount of “Very Serious” than stated in accepted ratios. However, even though the ratios of “Marine Incident” and “Less Serious” were close to the ones observed, the ratios of “Serious” and “Very Serious” differed greatly from the initial observations.
Table 4 summarizes attempts to derive only one “Very Serious” per cluster. For CS, the parameter was set to 14 clusters, with 15 clusters for OA (Table 4). Although ratios differ greatly between CS clusters an average 1:5:50 ratio is seen, though Marine Incidents are unexpected low. For OA, however, there are four clusters with “Very Serious” accidents only. The ratios vary greatly between clusters and this number of desired clusters was determined to be too big for the analysis.
Attempting One “Very Serious” Per Cluster
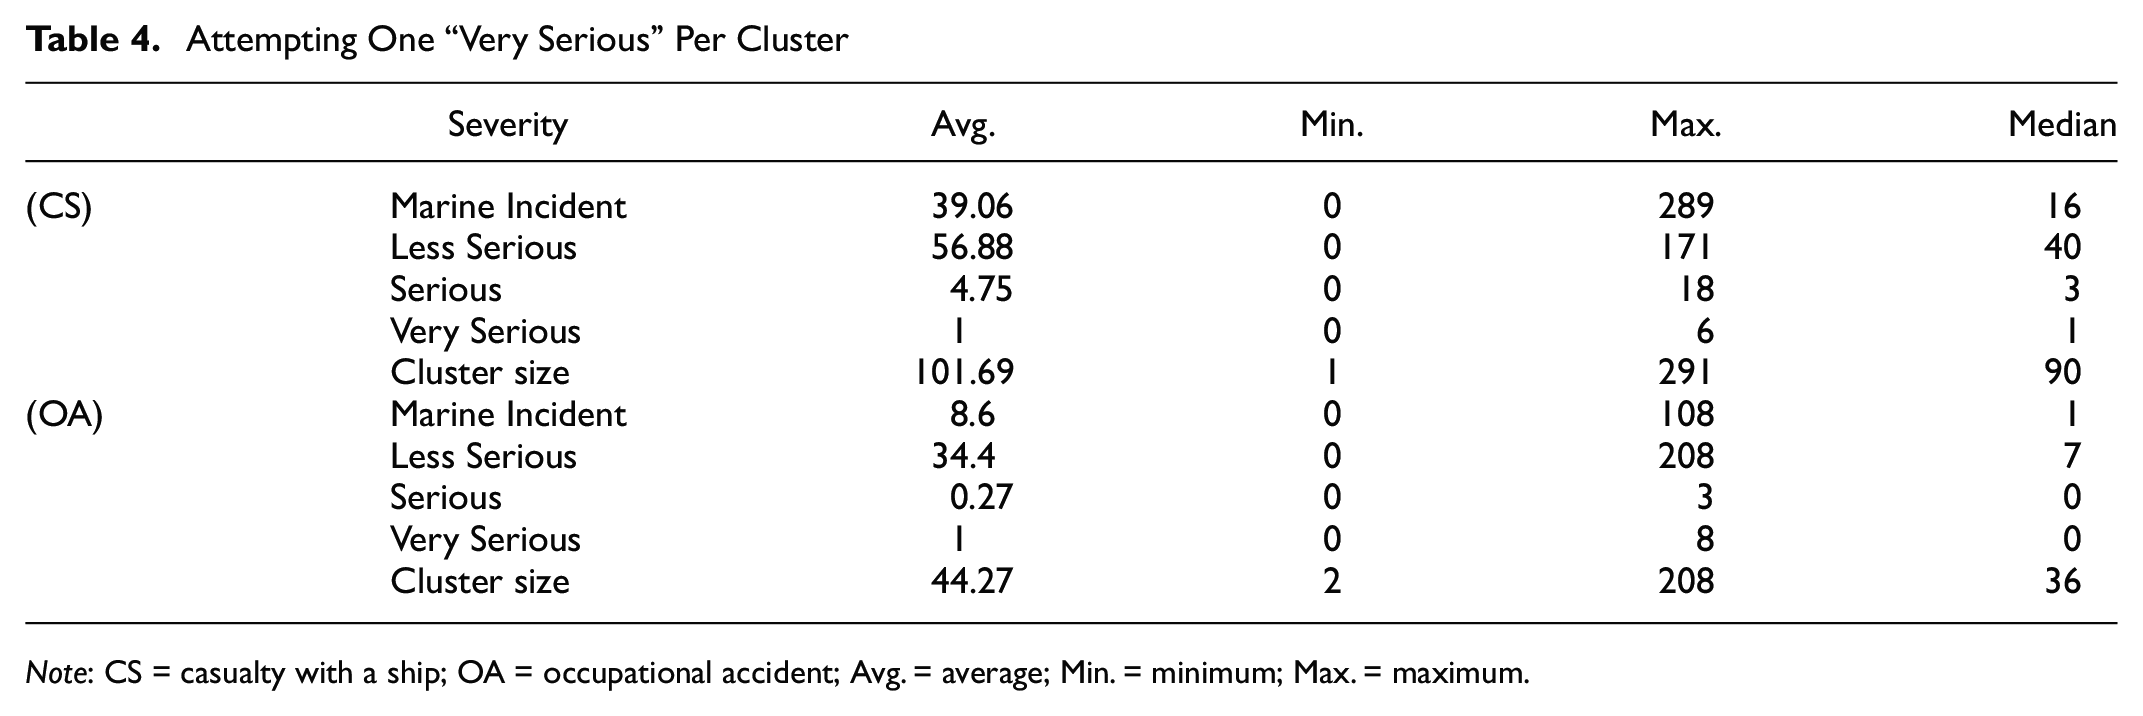
Note: CS = casualty with a ship; OA = occupational accident; Avg. = average; Min. = minimum; Max. = maximum.
Finally, the most stable and meaningful number of clusters were checked. Ten clustered datasets for CS and five for OA were created by running the algorithm through ten iterations. A summary of all attempts is seen in Table 5. These clusters explained an average of 99% of all variance in the data.
Optimal Clusters Analysis
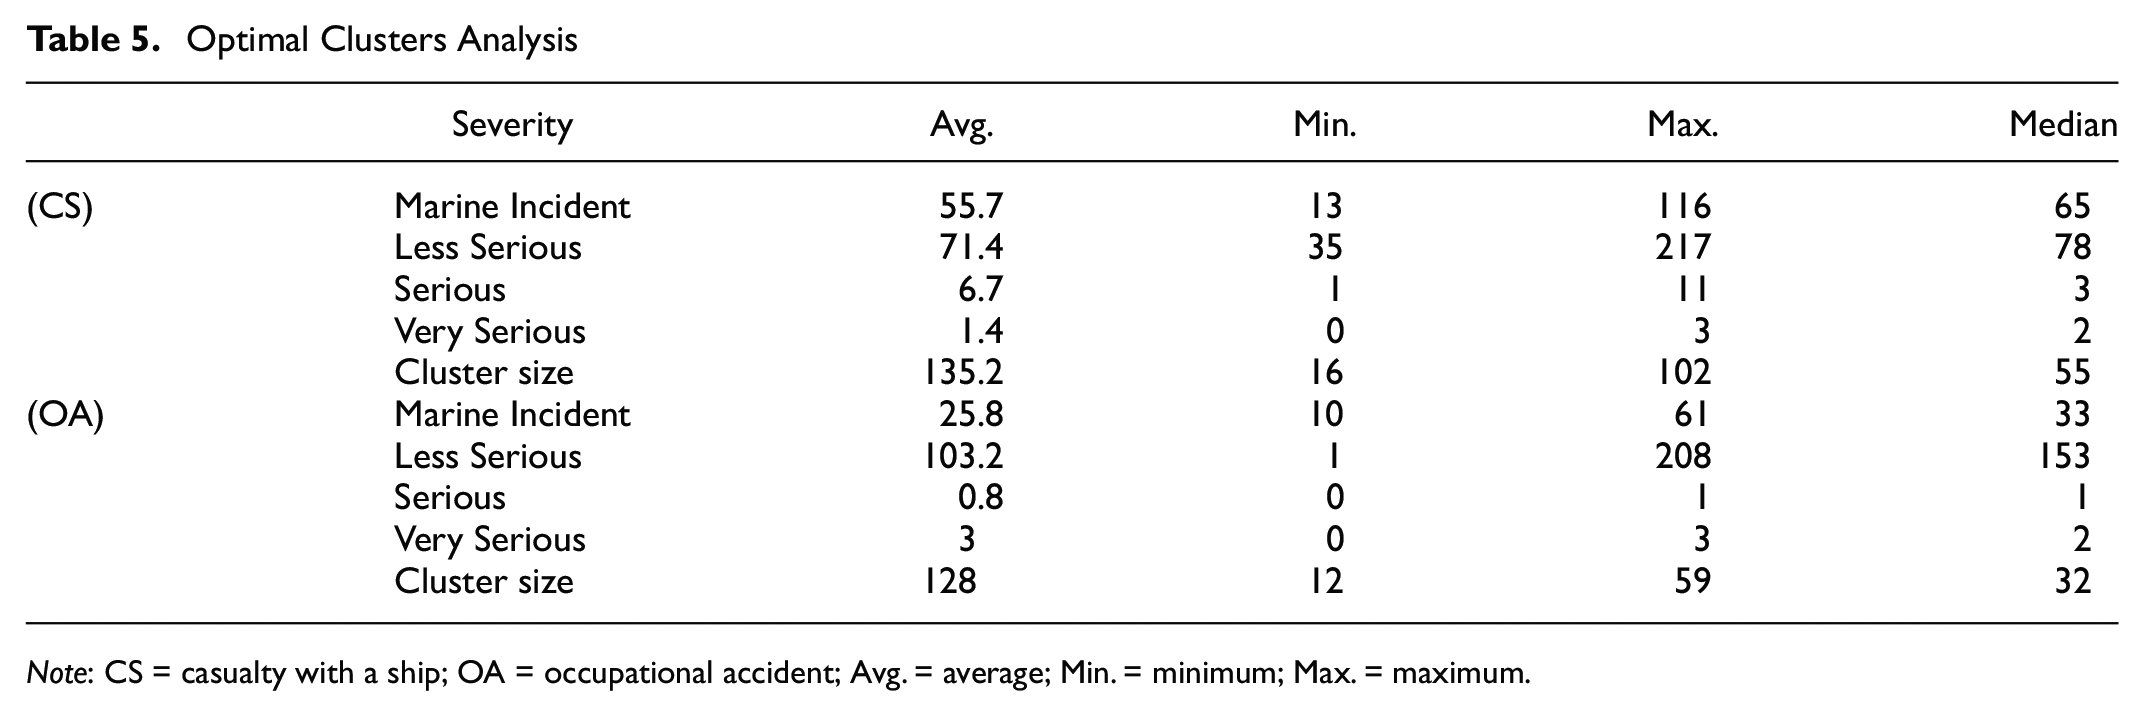
Note: CS = casualty with a ship; OA = occupational accident; Avg. = average; Min. = minimum; Max. = maximum.
Discussion
Assuming all CS and OA are reported, the data do not match Heinrich’s original ratios. This is understandable, as the maritime sector is quite different from an industrial factory.
This study assessed the quality of the accident data using dimensions that have been applied to aviation safety databases. This enabled the authors to determine that the data were suitable for analysis. However, the narratives of CS provided extensive information on the physical damage but not on the decisions that humans made, miscommunication, the use of technologies, and the adequacy of the procedures—factors that were studied in past publications. OA narratives were more detailed, describing the affected people.
CS accounted for 67.2% of the accidents, whereas 32.8% of them were OA. These results also show that the environment seems to have played only a small factor in accidents. Most accidents tended to occur in rather safe-sounding conditions, such as clear visibility and daylight. This finding contrasts with the conclusion drawn by Pak et al. ( 4 ), who stated that fog is the most significant weather factor. This may confirm studies that show the large role human error plays in accidents.
Moreover, factors such as the ineffective use of the on-board navigation technologies during the embarking and disembarking of the vessel might have contributed to the reported accidents. However, such information cannot be captured through categorical data within accident reports, so could not be researched within this analysis.
The number of reported CS decreased by 15.9%, whereas the number of OA increased by 18.8% from 2015 to 2017. This change is probably attributable to improved safety and health awareness, as explained by Corrigan et al. ( 30 ). Despite a reduction in the number of CS, ship casualty remains dominating, representing over two-thirds of the total accidents, with the most frequent accident types being contacts and collisions. The most frequent events of OA were slipping, stumbling, and falling. Furthermore, the majority of affected people were male members of the on-duty crew between 25 and 54 years old.
As shown in Figure 11, the ratio between “Very Serious” and “Serious” for CS accidents between 2013 and 2017 was closer to a 1-to-5 relationship than Heinrich’s original 1-to-29. Excluding Marine Incidents (near-misses), the CS data are indeed pyramid shaped with ratios 1-5-57, which can also be seen in all clustering methods. The diamond shape when Marine Incidents are included is likely the result of underreporting of near-misses, as their reporting is not mandatory at this time.
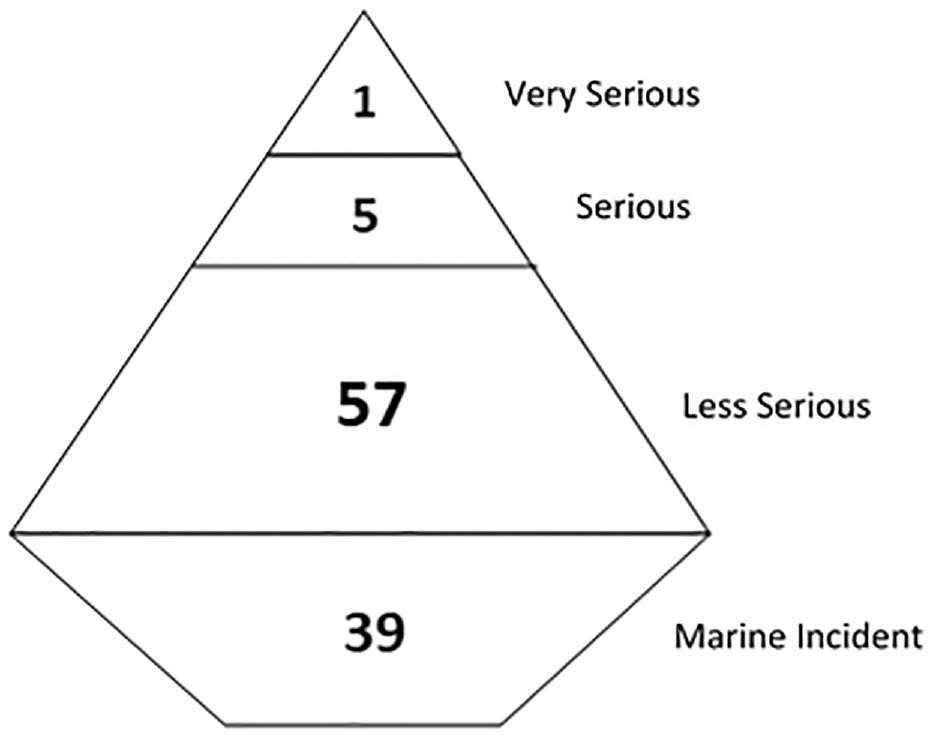
Approximate ratios using casualty with a ship accident data and severity classifications.
Surprisingly, the data for OA was not pyramid shaped but more that of an hourglass (Figure 12) during the period of 2013–2017. “Very Serious” accidents represent a larger percentage of OA than they did under CS (3.1% versus 0.9%). Also, the ratio between “Very Serious” and “Serious” was reversed and close to a 4-to-1 relationship.
Approximate ratios using occupational accident data and severity classifications.
Likelihood of Results
Although this calibration was based on available data, the data may not (and are unlikely to) fully represent reality. First, the data compiled by the MAIB directly result from subjective reporting methods, indicating that at least one level (possibly two) of interpretation has taken place to classify the data into their final severity levels. Even with the mandatory levels, especially at the Serious level, there is ambiguity in where the line of distinction with Less Serious may lie. Also, datasets often had high levels of variables marked with an “unknown” input value, thus providing a further lack of total contextual understanding of a specific accident or incident.
Second, in this paper’s analysis, the clustering analysis produced a large amount of variability in each iteration. Values of severity levels observed in individual clusters fluctuated heavily. Individual observed cluster sizes were also not consistent across a single trial, or series of trials. Generally, values for CS tended to follow the Pyramid shape only at the top three severity levels, with very few clusters showing the pyramid shape for all four levels.
Finally, the severity levels use a similar, but not identical scaling system to Heinrich (four categories instead of three). This makes direct comparisons illogical. Furthermore, the lowest two levels have non-mandatory reporting under current regulations, so are likely to be underreported.
Caveats
It is worth highlighting a range of the potential issues relating to the analysis presented in this paper.
It is important to note this work is only potentially applicable in the UK only, given the maritime sector reporting requirements. In the United States of America, for example, different reporting requirements mean the need to determine a bespoke ratio for data from that country;
The ratios determined in this paper are applicable only to the sector under consideration in the maritime sector, with different maritime sectors indicating different ratios;
Such ratios may change over time and are not static. The dynamic nature of the maritime sector and improvements in safety training and methodology mean that the ratios would be different in say 5 years time.
From a “real-world” perspective, the Heinrich Pyramid ratios are not frequently followed for a variety of reasons. The two prime among them are the reporting requirements and the organizational reporting culture. With respect to the former, underreporting of incidents is of major concern. The lack of reporting of less severe events may leave an organization vulnerable for these events to be repeated with a more severe outcome. An event can have a minor result, but these same events can often have a severe result, and therefore it is crucial to also report near-misses.
Therefore, for good safety practice in operations, it is important to not only consider the lagging indicators of safety, that is, previous incidents/injuries, though such indicators are useful in understanding the overall safety picture. Leading indicators of safety should also be considered, in particular the safety culture of an organization with a focus on reporting culture. A combination of both lagging and leading indicators will enhance safety in the maritime sector.
Conclusions
Review of available literature showed only one previous verified calibration of the Pyramid to the maritime sector by Stade ( 22 ), although this was not the initial objective of that paper, nor does it use a similar methodology to this paper. Many examples were found, both in academic research and industry safety efforts, of the Pyramid being used with its original 1931 ratios as a justification for safety culture or near-miss reporting.
A methodology was established using descriptive statistics and K-Means clustering analysis to group individual accident data points through an iterative process. The results showed that at no point did any clusters have a ratio resembling that of Heinrich’s original 1:29:300, even accounting for the MAIB segmentation of serious and minor injuries. Clustering analysis showed average clustering of 135 CS and 128 OA, with the CS pyramid calibrated to 1 Very Serious, 5 Serious, 57 Less Serious, and 39 Marine Incidents for CS and the OA pyramid with 4 Very Serious, 1 Serious, 129 Less Serious, and 32 Marine Incidents.
Although an attempt at calibration was successful with the data provided, the data used might not be a credible representation of reality, and thus the calibration achieved should not be considered either. In line with previous results/observations by Stade ( 22 ) and Anderson ( 19 ), the data and the results do not mirror those established by Heinrich. With this result, there are four possible outcomes (or likely a mix of some):
The true relationship between maritime accidents is not a Pyramid shape as described;
The relationship between severity levels has drastically different ratios than Heinrich’s 1:29:300;
The data found in the MAIB database is a non-representative sample set; and/or
The methods used for collecting accident data (especially at lower severity) skew/obscure true reality.
In contextual conversations with UK maritime actors, all agreed that there was logic behind the assumption that there will be a higher quantity of smaller incidents with no injury compared with similar more catastrophic ones. The larger question is whether those smaller incidents have the same linear causation patterns for catastrophic accidents. Would blocking smaller incidents with some risk mitigation effort really guarantee prevention a fatal accident?
Heinrich’s initial work focused on accident reports from a highly repetitive sector (factories), making causation patterns slightly easier to establish through records. There is almost nothing repetitive about the movement of a vessel within a port area with evolving factors, such as sea and weather conditions, individual ship power output, and crew alertness.
The low quantity and quality of actionable data provided made it impossible to firmly establish different causation patterns across multiple accidents at varying severities. Less Serious and Marine Incidents (and even most Serious) accidents only had the information available in the database, and could not be reconciled into formal investigation reports for greater severity accidents.
The Pyramid also seems to ignore the impact of complexity in the overall risk of the system. As these data were taken from UK nationwide reporting, the analysis essentially had to treat each port and each accident type similarly. Even larger ports of similar sizes, such as the Port of London (England) and the Forth Ports (Scotland), would have drastically different risk portfolios and levels of operating complexity.
Though reporting to MAIB is mandatory at Serious and Very Serious accident levels, as well as all accidents with serious injuries, reporting for lower severity is not. This discrepancy leaves a large potential for underreporting. Lower severity data may be kept at the Port and Operator level, being rarely (if at all) communicated to MAIB. These will be missing from this national database.
Even if reporting of less severe incidents was possible, the lack of a formal hazard/reporting taxonomy at all levels of accident reporting (MAIB, Ports, Operators) means merging various datasets would be very difficult. A similar incident may be classified at different levels, recorded differently, or both, dependent on definitions used. Currently, there is no legal mandate for standardized lower severity data reporting, nor does there appear to be much appetite to do so. Individual port Pyramid calibrations would be challenging because of the small local datasets likely available, and presumably would be of little use overall.
More broadly, lower severity incidents are likely to be continually overlooked and underreported. A common refrain from all academic research on near-miss reporting measures cites the lack of real understanding of what a near-miss is and if/when one should be reported. Because an unwanted occurrence (i.e., accident) does not occur, it can be difficult for involved parties to accurately identify there was a near-miss (13, 14).
Even more, as cited by Capt. Rose from CHIRP, the industry has still not entirely built a culture which encourages near-miss reporting ( 18 ). Seafarers, understandably, seem to trust their instincts and skill rather than a check-list, but that can create an unconscious bias against acknowledging potentially unsafe acts. Furthermore, the safety/reporting culture may still focus more on punishment rather than learning from unsafe acts, adding more incentive not to report.
Requirements and methods of reporting almost assure that data are siloed, mislabeled, or ignored, and are not fully present in MAIB’s accident database. This has the effect of making safety improvements more challenging, as well giving the appearance of greater safety concerns (i.e., 1-to-5 ratio for Very Serious and Serious CS) around this specific data focus (waterside accidents within UK ports).
Footnotes
Author Contributions
The authors confirm contribution to the paper as follows: study conception and design: R. Nalty, A. Majumdar; data collection: I. Manole; analysis and interpretation of results: I. Manole, R. Nalty; draft manuscript preparation: I. Manole. All authors reviewed the results and approved the final version of the manuscript.
Declaration of Conflicting Interests
The author(s) declared no potential conflicts of interest with respect to the research, authorship, and/or publication of this article.
Funding
The author(s) disclosed receipt of the following financial support for the research, authorship, and/or publication of this article: The authors would like to thank the Maritime Accident Investigation Board (MAIB) for the data and the Lloyd’s Register Foundation for sponsoring this research.