
Abstract
In the discipline of fire engineering, computational simulation tools are used to evaluate the available safe egress time (ASET) and required safe egress time (RSET) of a building fire. ASET and RSET are often analyzed separately, using computational fluid dynamics (CFD) and crowd dynamics, respectively. Although there are advantages to coupling the ASET and RSET analysis to quantify tenability conditions and reevaluate evacuation time within a building, the coupling process is computationally complex, requiring multiple steps. The coupling setup can be time-consuming, particularly when the results are limited to the modeled scenario. In addition, the procedure is not uniform throughout the industry. This paper presents the successful one-way coupling of CFD and crowd dynamics modeling through a new simplified methodology that captures the impact of fractional effective dose (FED) and reduced visibility from smoke on the individual evacuee’s movement and the human interaction. The simulation tools used were Fire Dynamics Simulator (FDS) and Oasys MassMotion for crowd dynamics. The coupling was carried out with the help of the software development kit of Oasys MassMotion in two different example geometries: an open-plan room and a floor with six rooms and a corridor. The results presented in this paper show that, when comparing an uncoupled and a coupled simulation, the effects of the smoke lead to different crowd density profiles, particularly closer to the exit, which elongates the overall evacuation time. This coupling method can be applied to any geometry because of its flexible and modular framework.
The safe evacuation of humans during fire events is crucial to avoid loss of life. Past incidents, for example, the Daegu subway fire in 2003, have intensified the study of fire safety of buildings. A fire evacuation is typically categorized into substages of required safe egress time (RSET), that is, the time needed by occupants to evacuate from the fire to a safe place from the point of the fire ignition. The RSET should be shorter than the available safe egress time (ASET), that is, the time from the fire ignition until the conditions become untenable for evacuation, as shown in Figure 1.
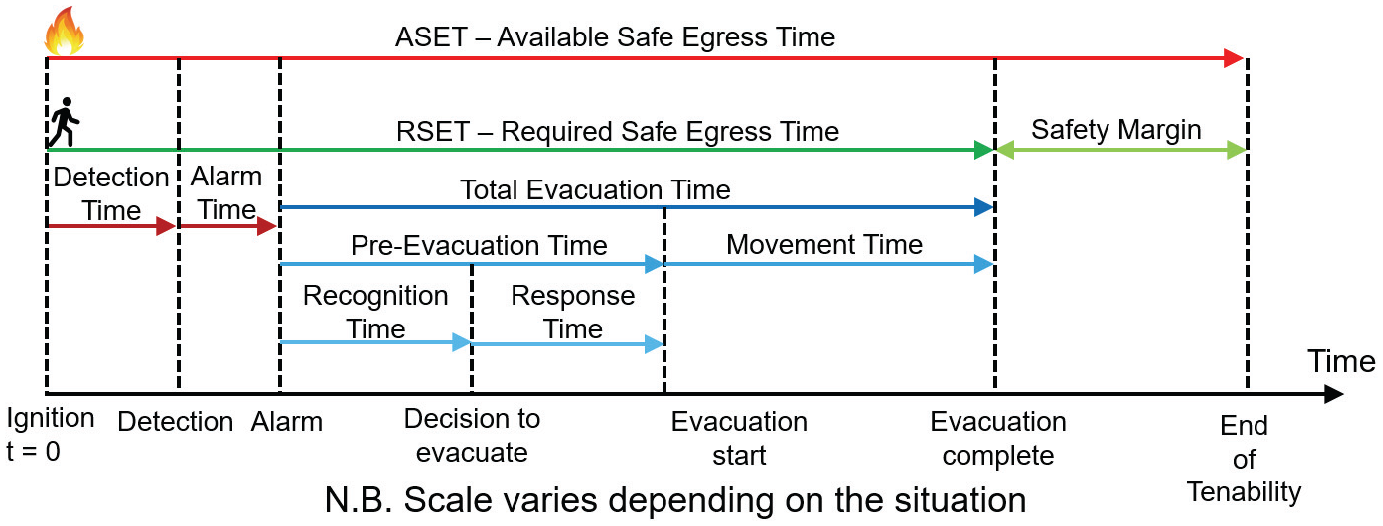
Stages of evacuation in event of fire.
RSET is calculated as shown in Equation 1.
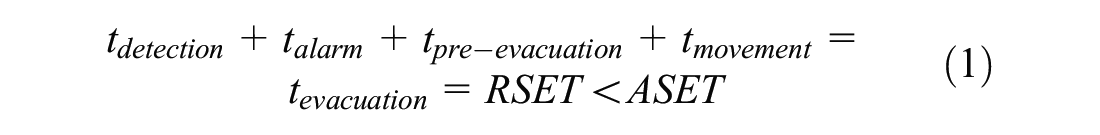
Within the RSET, how quickly evacuees leave the site of danger to a place of safety can affect the total evacuation time, especially because the starting point of movement time is when the fire has developed further. Fire growth is traditionally described in terms of heat release rate (HRR), which has a parabolic growth curve up to a flashover range where the fire fully develops, as shown in Figure 2.
Stages of evacuation with an example fire growth rate.
Although RSET and ASET are closely linked, evacuation simulations are often conducted independently from the fire modeling process for a variety of reasons, apart from fire and evacuation modeling belonging to different disciplines. First, there are situations when evacuation is required that are either unrelated to fire or when the fire is successfully contained in an isolated location, as intended by building regulations ( 1 ). Second, fire evacuation simulation serves different purposes, one being the prediction of a possible evacuation scenario and another being post-incident evaluation. For the former, as it is time-consuming to model every likely fire evacuation scenario, the coupling of fire and evacuation modeling is an uncommon practice for building design. For post-incident evaluation, using a coupled model would serve as a powerful tool in understanding how a fire evacuation may have taken place.
A third reason for separating ASET and RSET modeling is because the coupling is technically challenging. Crowd dynamics modeling is carried out on a two-dimensional (2D) plane while fire simulation is carried out in three dimensions. Fourth, based on the experimental data, the direct effects of a fire on evacuation speed require a simulation methodology and framework. However, this kind of coupling comes at the expense of computational power. This paper tackles both the third and fourth aspects by introducing a new practical methodology for coupling fire and evacuation simulations with two example geometries and comparing the resource requirements for uncoupled and coupled methods.
Objective
A methodology for a one-way coupling is developed where the fire simulation is pre-run independently of people movement, and the evacuation model is adapted at each time step of the fire model. The outputs considered for evacuation modeling are two parameters: (i) visibility and (ii) fractional effective doses. The paper subsequently assesses the differences in outputs of the model with and without coupling.
The paper is organized as follows. The next section covers the literature review and existing work within the field. The section after discusses the proposed coupling methodology followed by results and discussion based on two example scenarios. Following suggestions for future work, the paper concludes.
Literature Review
Human Behavior
RSET, particularly the movement time, is strongly related to human behavior, as shown in Kuligowski and Gwynne ( 2 ) and Kuligowski et al. ( 3 ). The key relevant findings are as follows:
Individuals’ decisions are affected by the action of the people around them.
The visibility on the route can affect the route selection. The presence of smoke does not always influence route choices but can interfere with the movement along a path.
Individuals have different actions because of their diverse abilities and personalities.
In situations where information is lacking or incomplete, people seek for information.
People move toward people, places, and things that are more familiar to them.
People may re-enter a structure, especially if there is an emotional attachment to the content and inhabitants.
Evacuation is a social process, as people are likely to form groups during an evacuation.
Cao et al. ( 4 ) categorized factors affecting human behavior into the following groups:
Objective factors include a pedestrian’s position, the environment, and the situation at every exit. These can change dynamically during the evacuation process.
Subjective factors are individual characteristics, including the pedestrian’s gender, age, mobility, patience level, and psychological state.
Random factors contain random errors and unobservable aspects.
Exit Selection
Certain subjective factors assist modelers to categorize the evacuees into types of agents that approach the exit selection process differently. After collating different methods from the literature, for example, Cao (
4
), Korhonen et al. (
5
), and Lovreglio et al. (
6
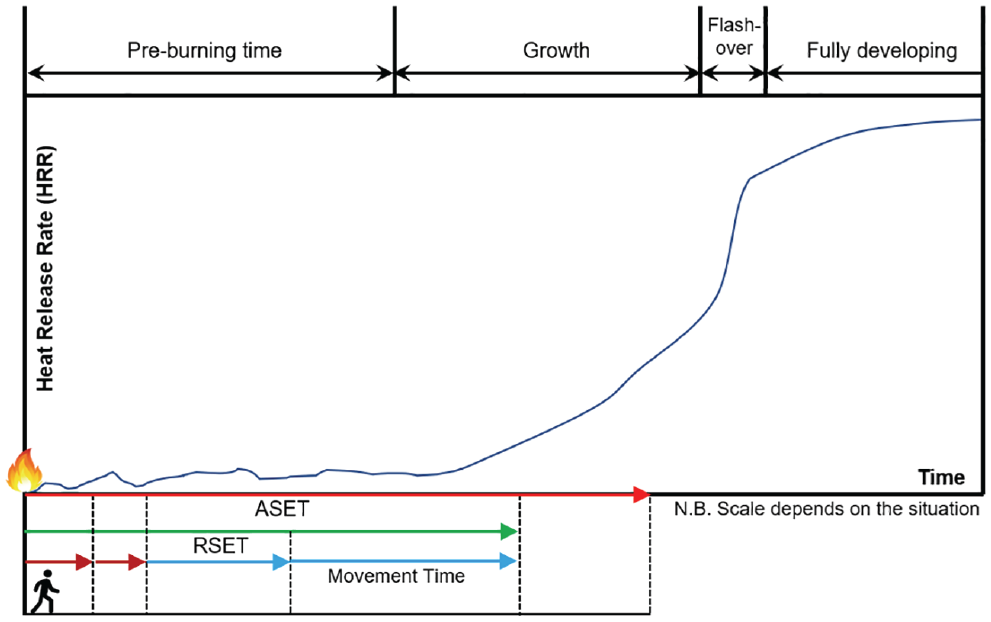
), the proposed methodology implements the evacuees into three simplified types: active, following, and herding agents. Active agents select a door from all visible exits without consideration of its familiarity. They observe the surrounding environment actively and prefer the fastest exit. Following agents only prefer familiar exits among all visible doors, unless an active agent within an influence radius,
Description of agent types.
Fractional Effective Doses
The objective factors explicitly related to fire are toxic smoke, poor visibility, and heat. These affect the occupant movement and tenability condition ( 4 ). Fractional effective dose (FED) is defined by the Society of Fire Protection Engineers (SFPE) Task Group ( 8 ) and in ISO 13571 ( 9 ) as a quantifiable measure of incapacitation from toxic asphyxiant smoke, irritant gases, heat, and reduced level of oxygen. The FED related to irritant gases is often referred to as fractional irritant concentration (FIC). The definitions of FED are shown in Equations 2–4, where t represents time. These have been reformulated from the original forms from SFPE and ISO 13571 ( 8 , 9 ).
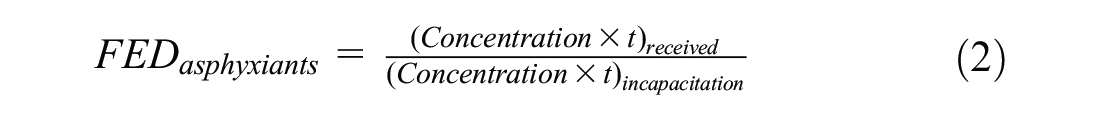

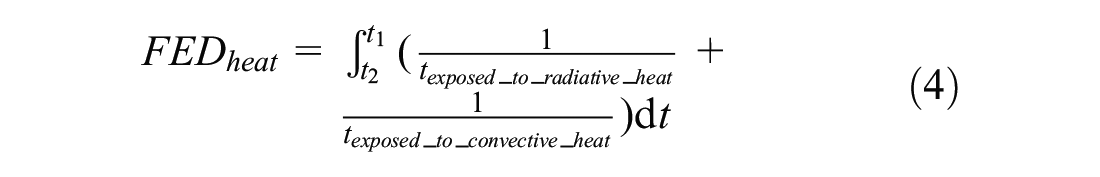
where
Smoke is assumed to have the effect of visual obscuration. The visibility toward the exit, or the distance that an occupant will be able to see from their location to the exit sign, is calculated using the method from Jin ( 10 ) and Kang and Macdonald ( 11 ), as shown in Equation 5.

where
In line with ISO 13571 ( 9 ), the primary assumption for the calculation is that each FED group of asphyxiant toxicants, irritants, heat, and visual obscurations is considered a separate, independent entity. When the subtotals of the FED in each category reach 1, the occupant is predicted to be in an untenable condition and will not be able to move on their own.
Common Types of Toxic Gases
The general equation of stoichiometric combustion is shown in Equation 6.
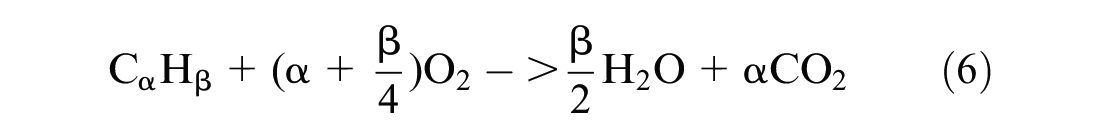
where
Combustion is not always complete, however, and it produces by-products, such as nitrogen oxides (
Walking Speed
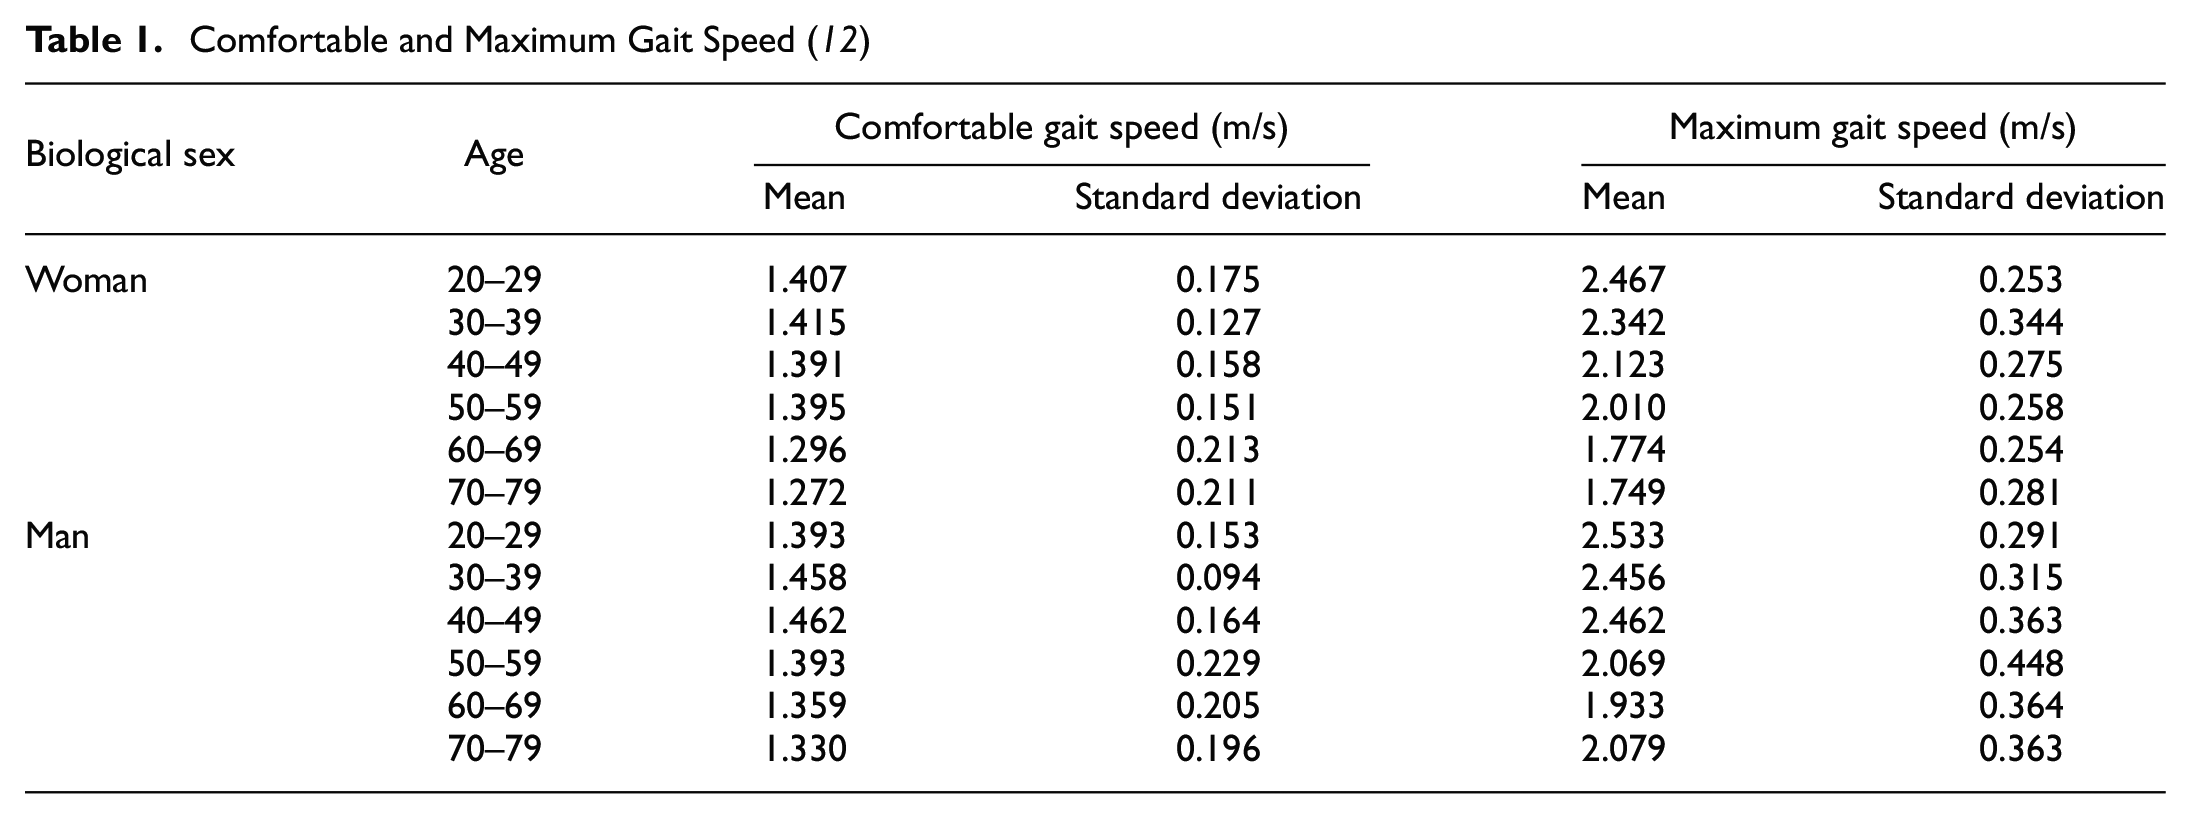
The two primary components of walking speed are the personal physical abilities of the walker and the influence of the environment on the walking speed. Personal abilities have been studied by Bohannon ( 12 ) and summarized with reference to comfortable and maximum gait speed, as shown in Table 1. Walking speed is assumed to follow a Gaussian distribution. The average maximum gait speed of men aged between 70 and 79 is higher than the maximum gait speed of those a decade younger, based on Bohannon ( 12 ), as these are averages of the maximum gait speeds, rather than comfortable gait speeds. The average comfortable walking speed for men in the age group of 20 to 29 is low in comparison to the same age group of women, while other age groups show the opposite trend. This may be the result of large standard deviations for both genders.
Comfortable and Maximum Gait Speed ( 12 )
The second component of walking speed—influence of the environment—can be calculated using the light extinction coefficient as shown by SFPE Task Group ( 8 ), the optical smoke density ( 8 ), or visibility as shown by Fridolf et al. ( 13 ). Fridolf et al. ( 13 ) present an individual calculation of walking speed affected by visibility as shown in Equation 7.
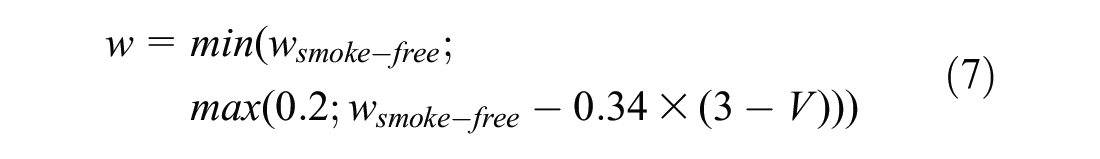
where
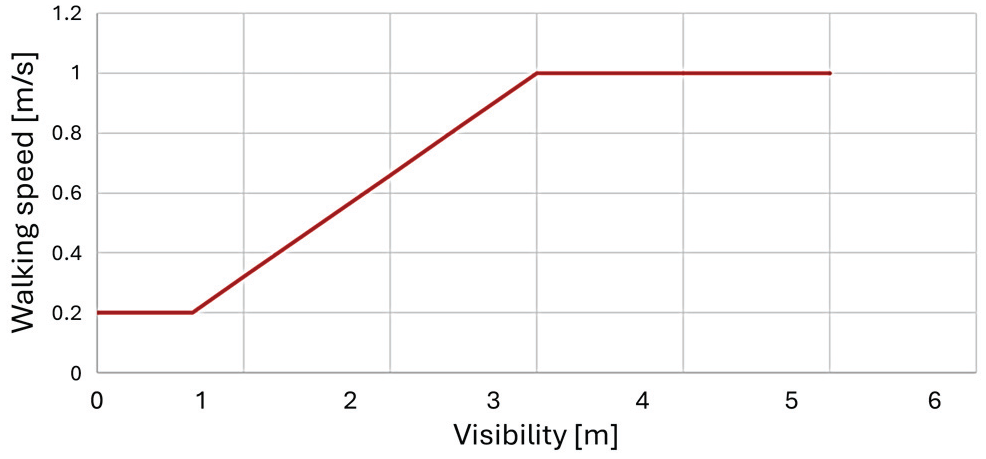
Average walking speed versus visibility ( 8 ).
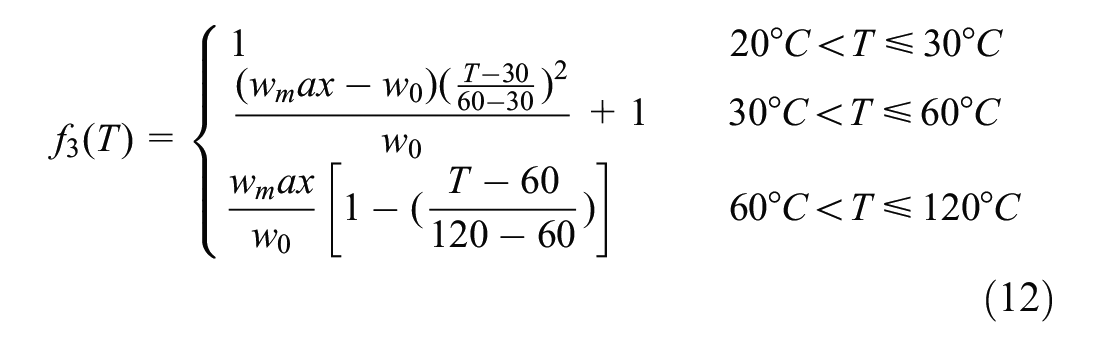
Cao et al. ( 4 ) developed a methodology that considers the effects of visibility, CO, and temperature in Equations 8–12.


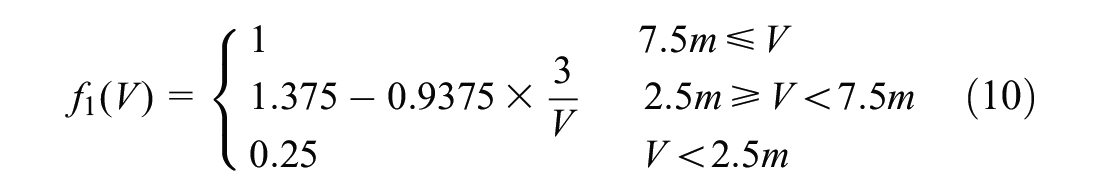
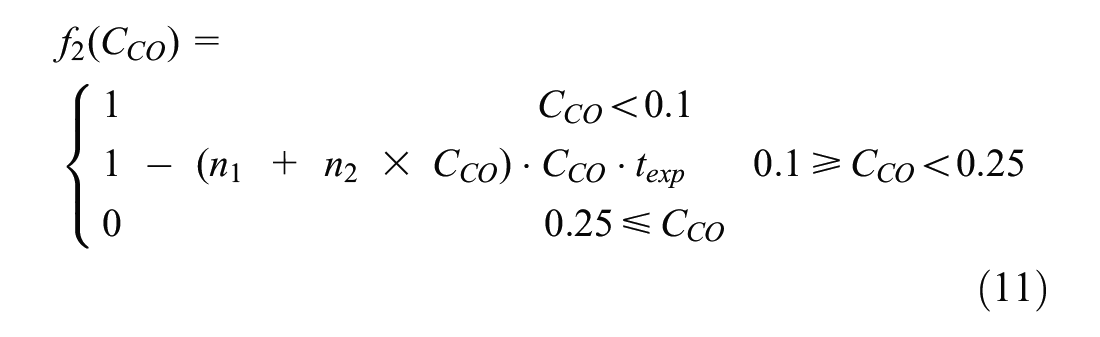
where
where
For irritant gases, Purser ( 15 ) developed an equation illustrating the effect of fractional walking speed as a function of FIC, as shown in Equation 13.
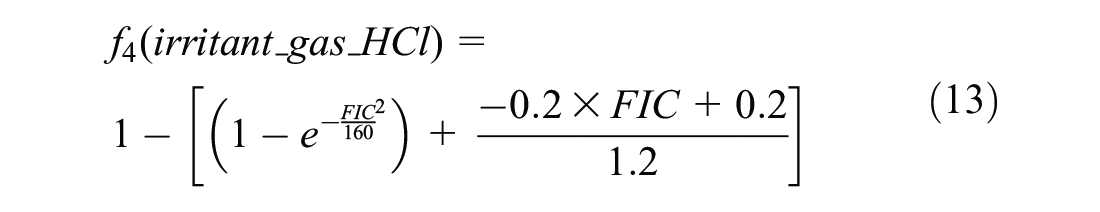
where
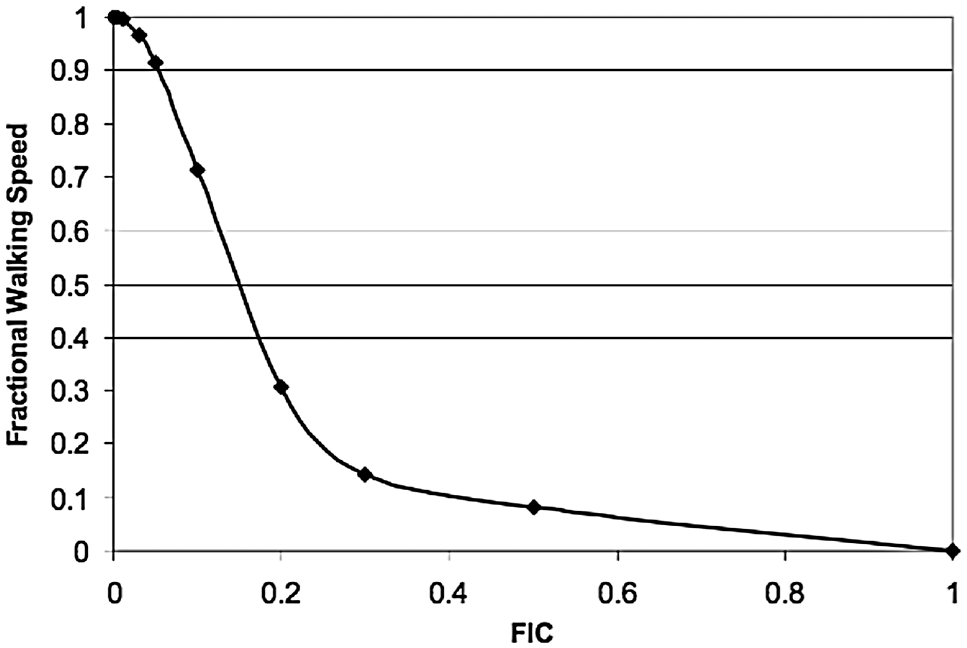
Estimated relationship between fractional walking speed and fractional irritant concentration (FIC) ( 15 ).
The fractional walking speed is the same for all genders and age groups, as this is a multiplier applied to the resulting walking speed from speed-density calculations based on comfortable and maximum gait speeds for varying groups of people, as determined by Bohannon ( 12 ).
After incorporating the methods of Kuligowski et al. ( 3 ), Cao et al. ( 4 ), Jin ( 10 ), Fridolf et al. ( 13 ), Fruin ( 14 ), and Purser ( 15 ), the equation adopted for the newly developed method calculates the walking speed using Equation 14.
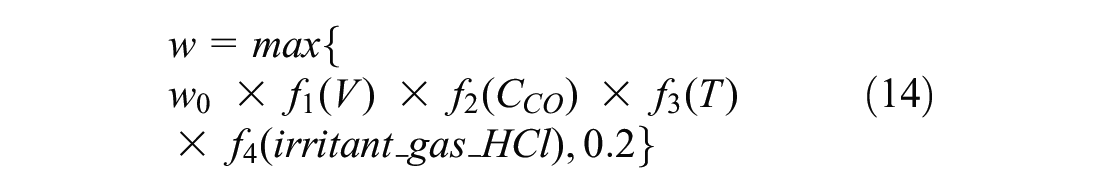
where
Coupling of Fire and Evacuation
There have been previous cases of the coupling methodology discussed in this paper (5, 16–18). The proposed methodology builds on the existing studies but also particularly expands on the impact of FED on the walking speed. This paper is based on an existing commercial agent-based crowd dynamics tool, which has been verified for the use of evacuation ( 19 ), and its software development kit (SDK).
Table 2 shows a summary of the comparison of existing couplings and how the proposed methodology differs. There are various fire models using computational fluid dynamics (CFD); the most popular one is Fire Dynamics Simulator (FDS), which is further explained in the subsection “Simulation Tools.”
Comparison of the Literature Review and the Proposed Method
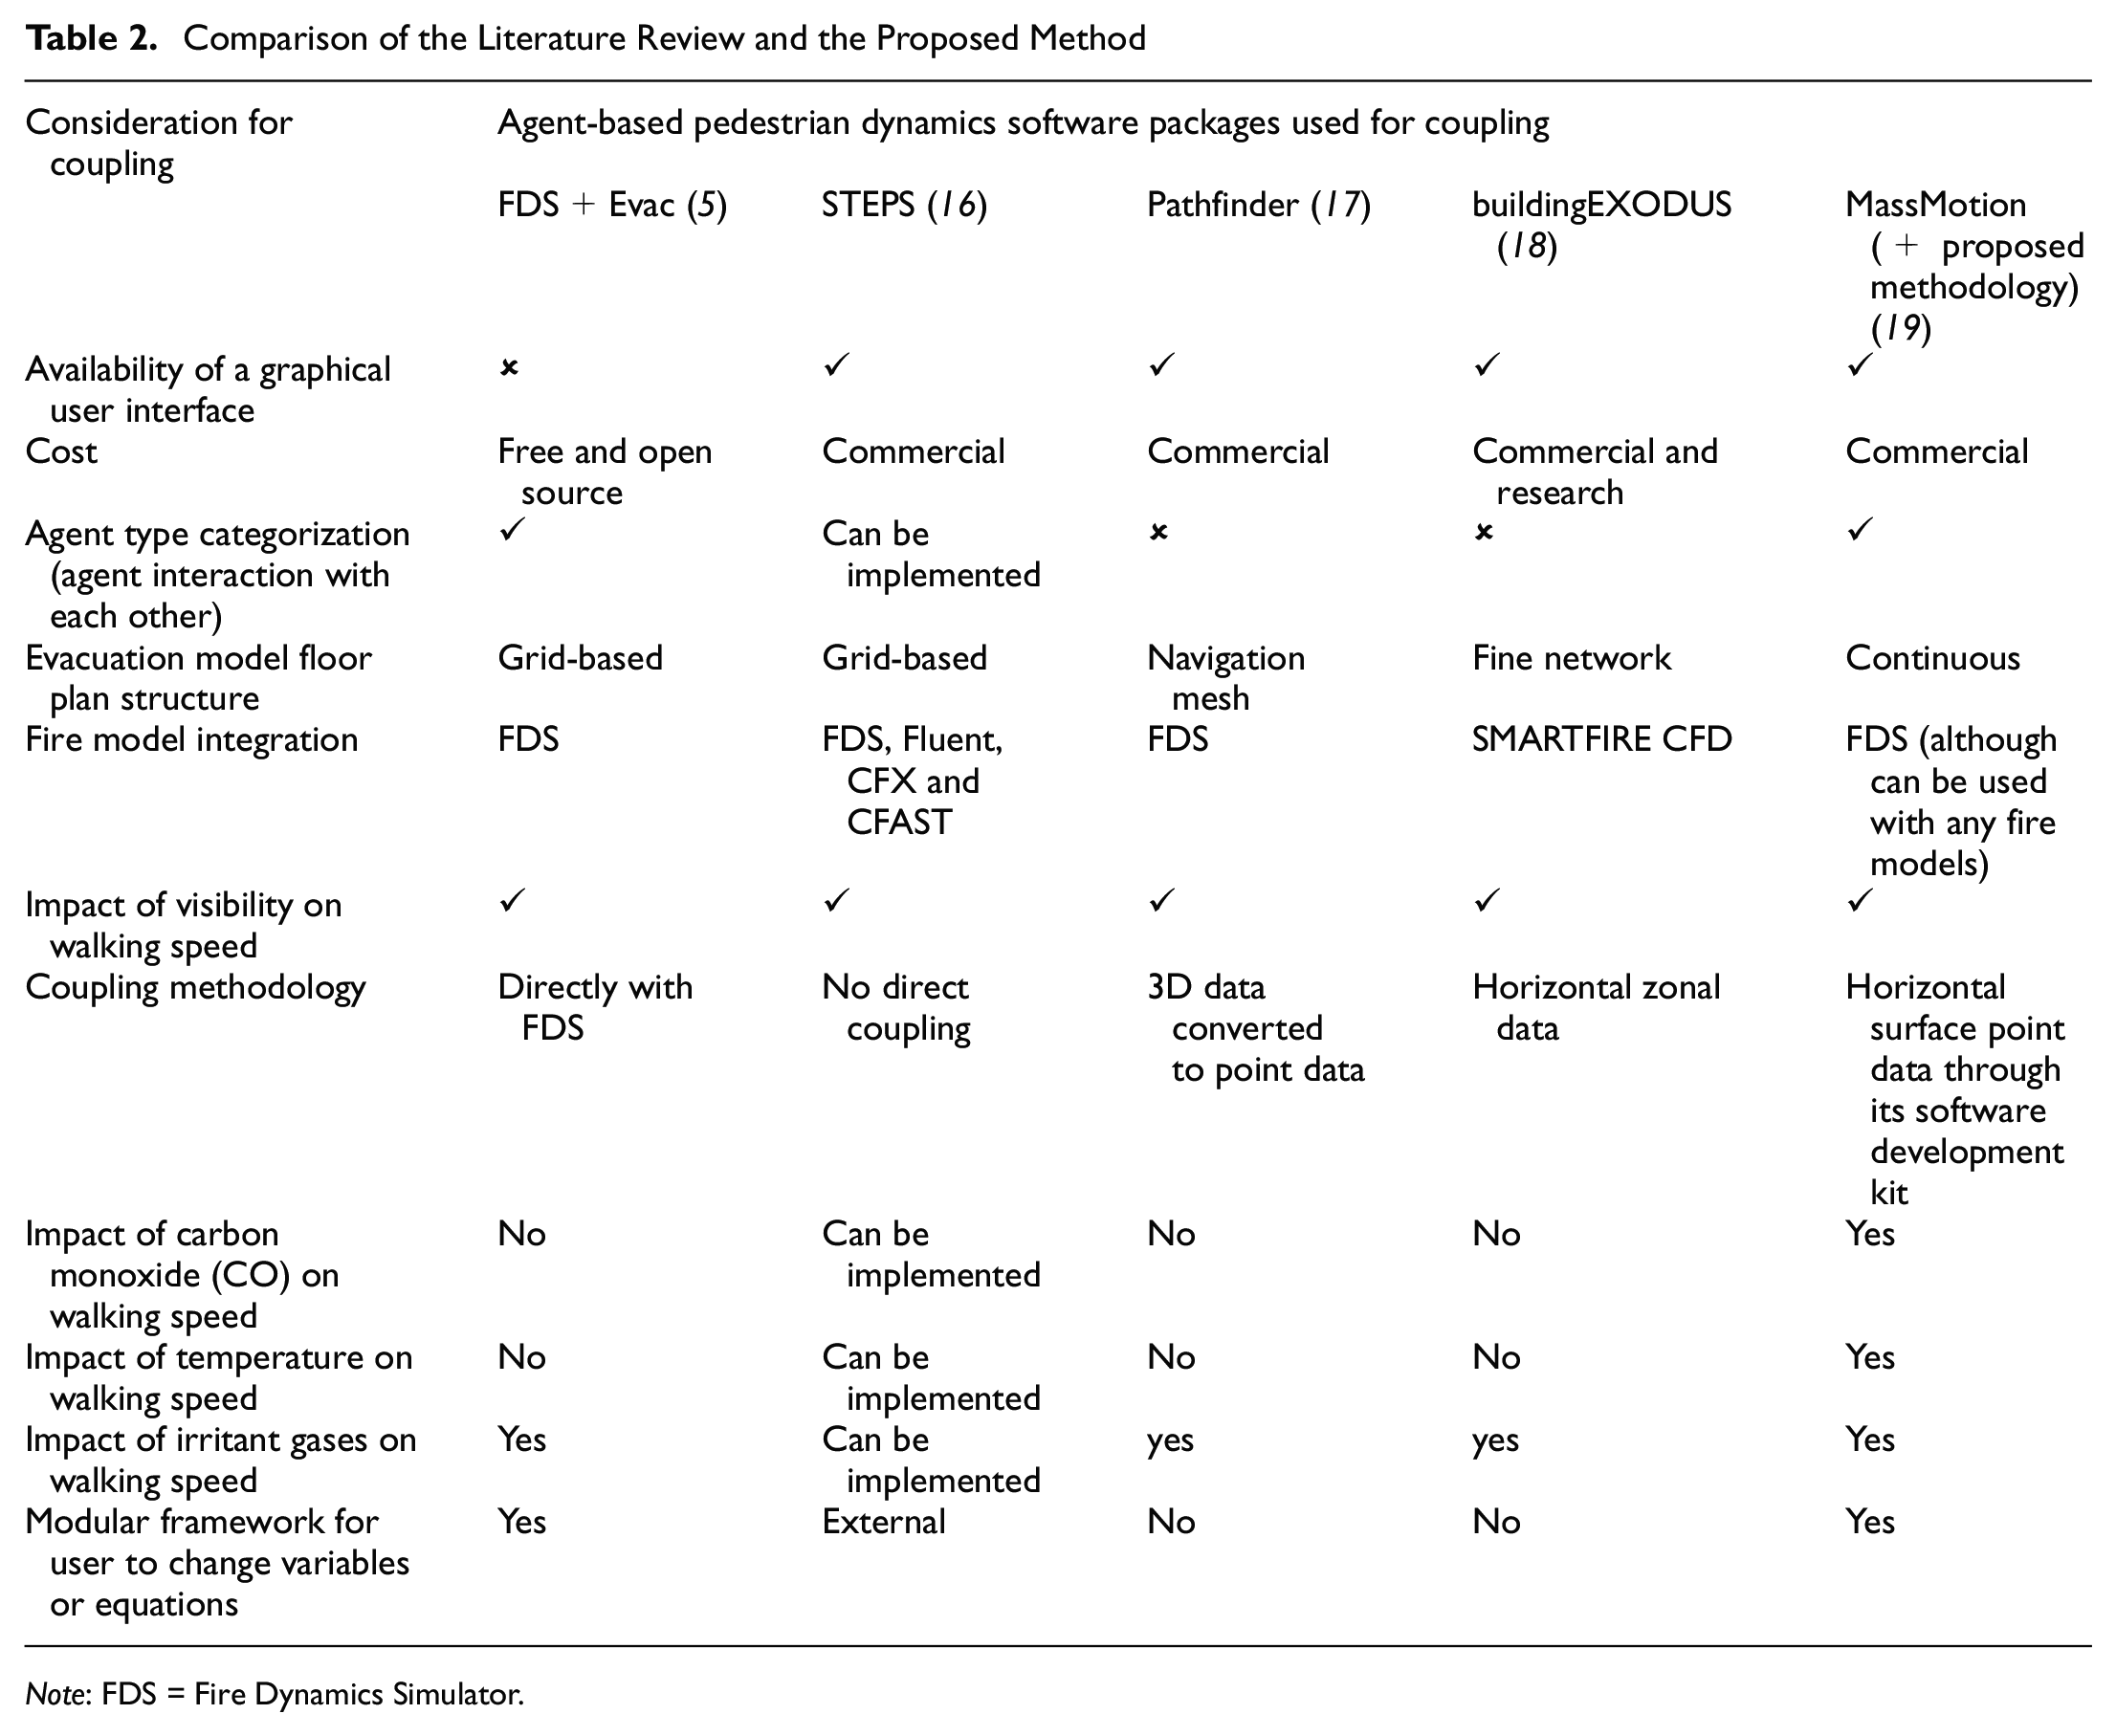
Note: FDS = Fire Dynamics Simulator.
Proposed Coupling Methodology
The proposed methodology for one-way coupling relies on two streams: the fire simulation and the evacuation model. The two will run independently but use the same inputs of room geometry and fire location. An additional input is required just for the fire simulation, which is the chemical composition of the fuel, or the fire source, which determines the overall fire size in terms of HRR and determines the combustion (by-)products. The fire simulation is then run alone, and the outputs of the chemical reactions at different x, y, z coordinates within the room geometry at different timesteps are recorded to feed into the coupling module.
Before the coupling procedure, the evacuation simulation is run for a short period to develop crowd movement in the room(s) and a spatially distributed crowd of mixed agent types. Additional inputs required just for evacuation modeling are the building occupancy levels and the demographics of the occupants. As shown in Figure 1, the end of the pre-evacuation time on the RSET timeline equals the beginning of the movement time. At this point, FED and visibility are calculated using Equations 10–14 and the outputs from the fire model at every x, y, z coordinate where there is an agent according to the evacuation model. Afterwards, the individual’s walking speed and exit selection are recalculated to determine the occupant’s new location at the next timestep. Walking speed of 0 m/s is included in the calculation, as this is an indicator of an agent having stopped and no longer moving.
The newly developed methodology is outlined in Figures 6–8.
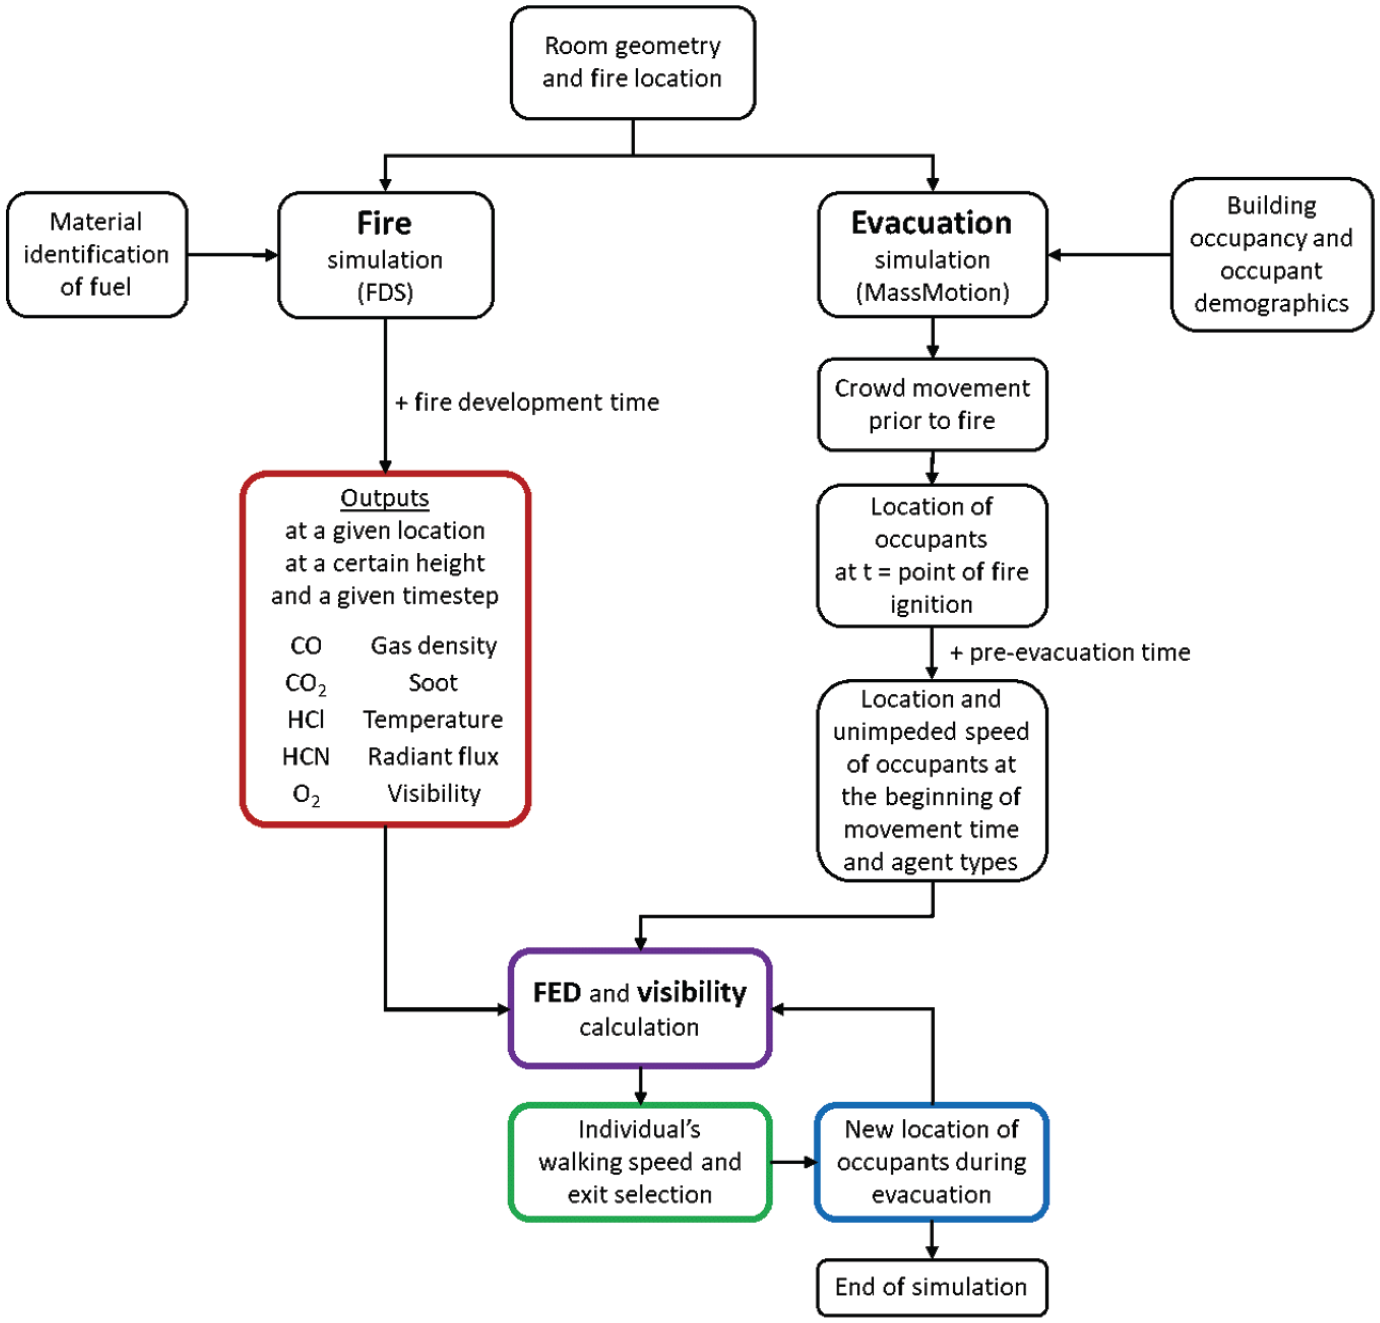
Overall procedure for the coupling process. FED = fractional effective dose.
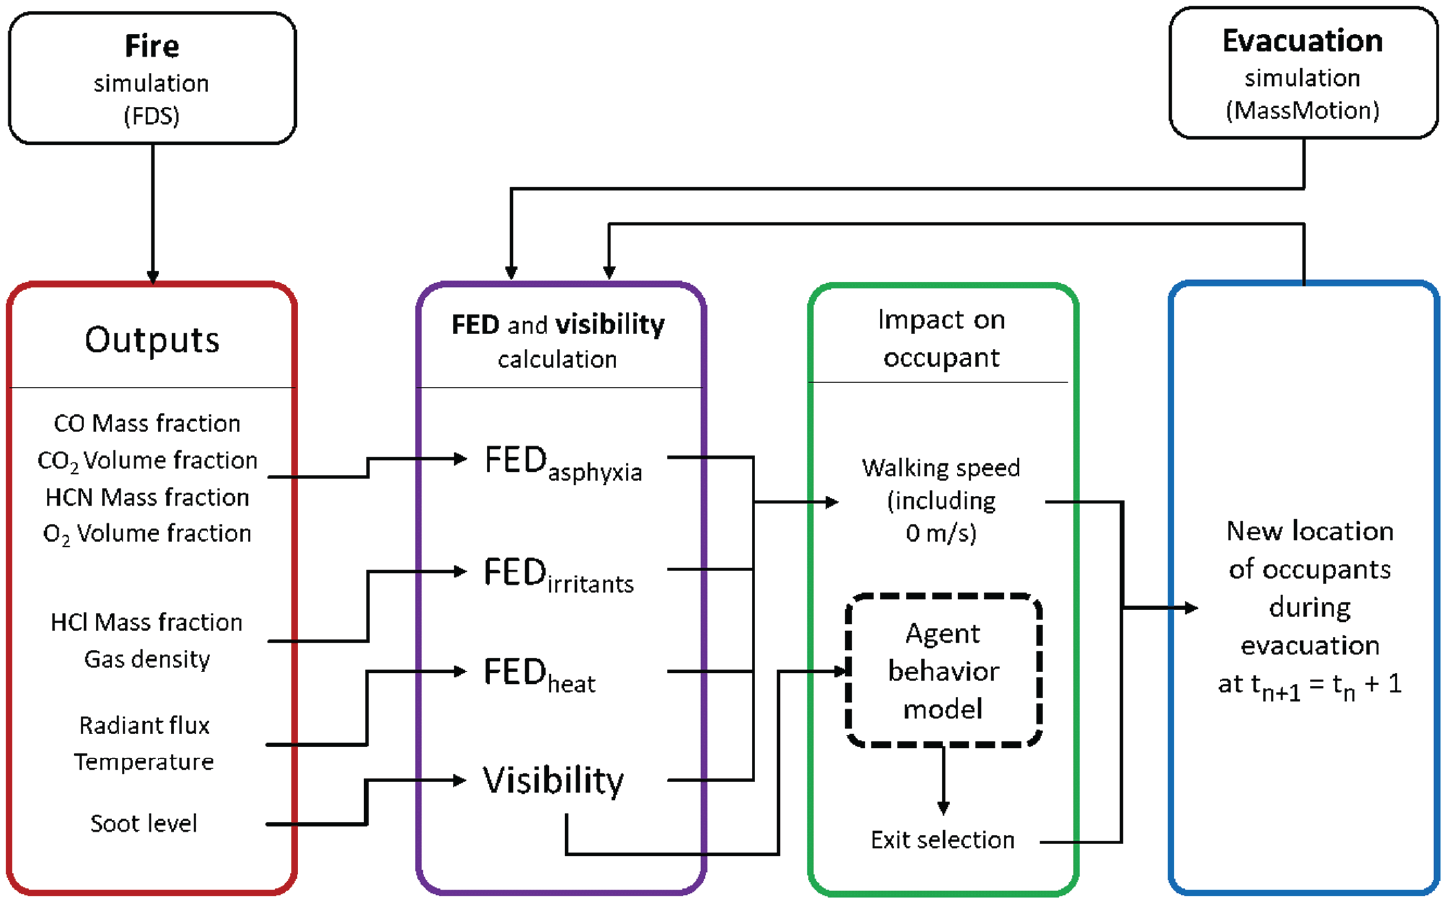
Detailed description of the coupling methodology. FED = fractional effective dose.
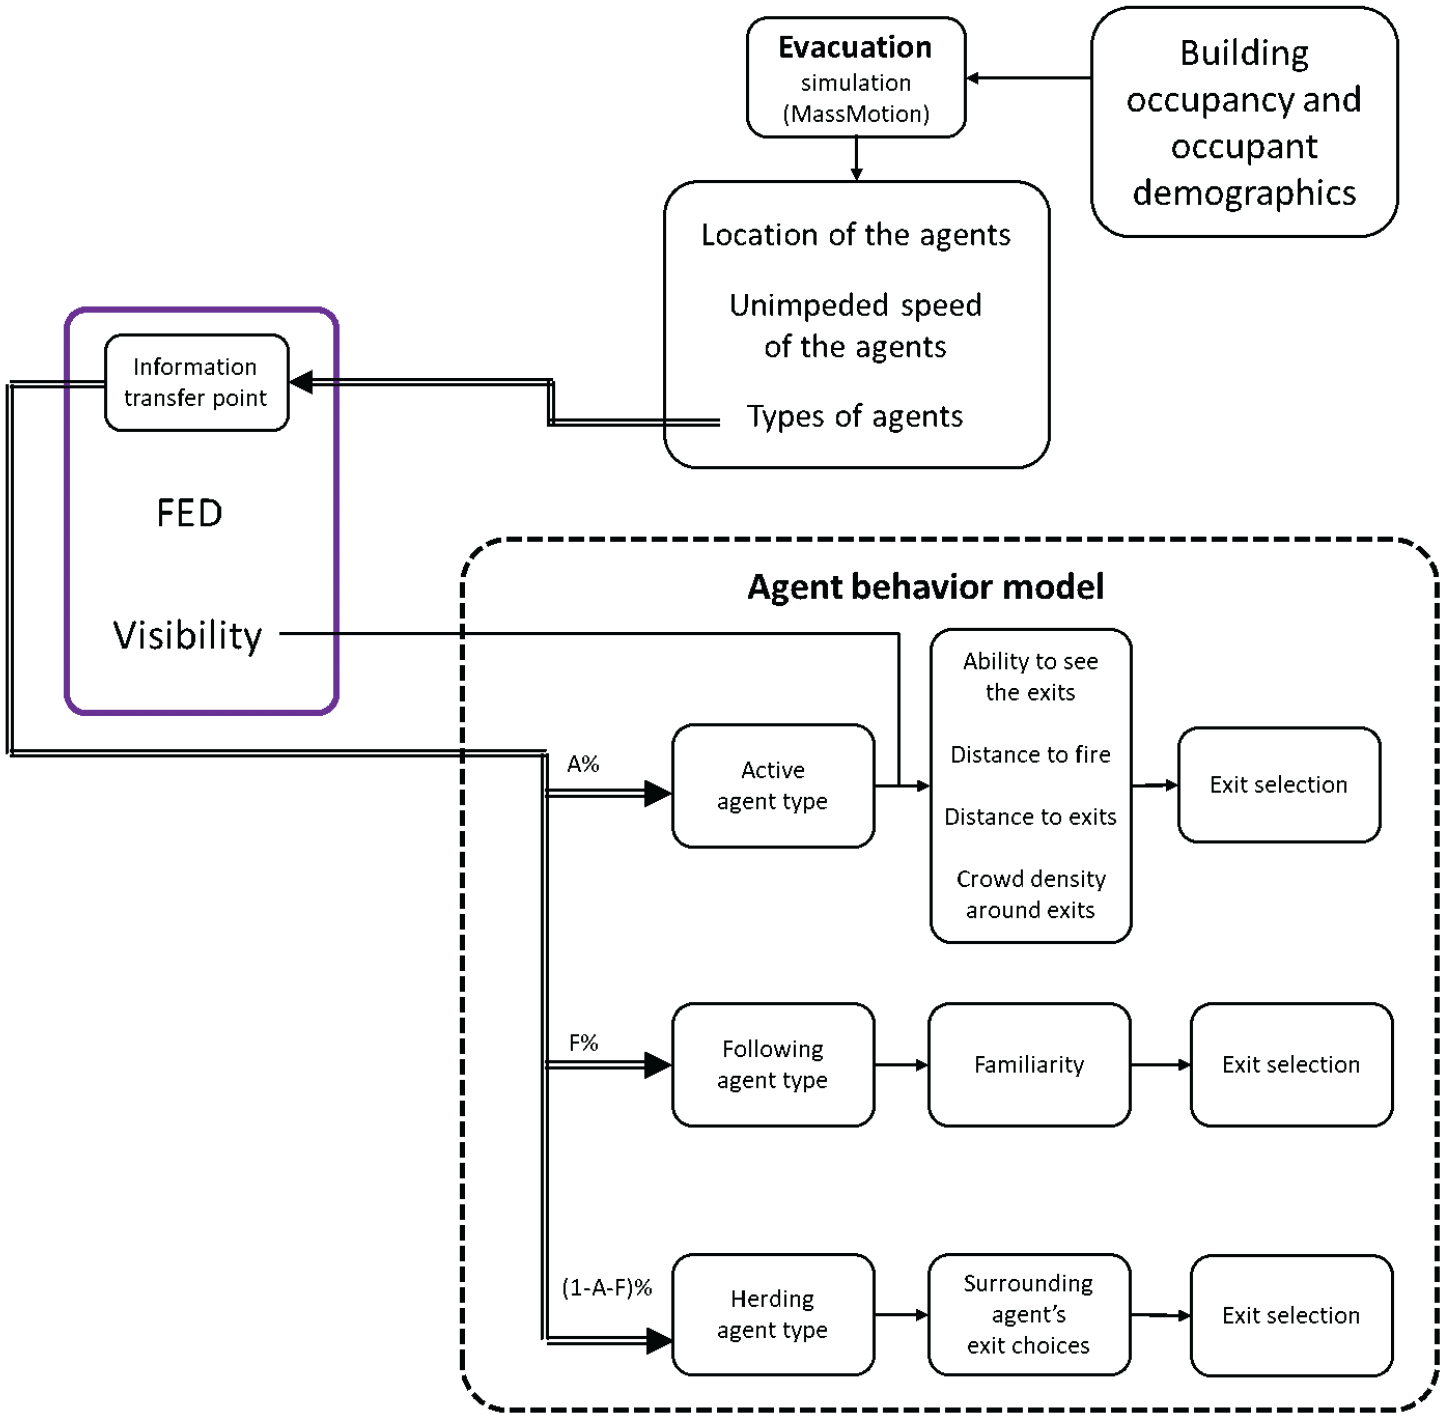
Agent behavior model (purple rectangle indicates the FED/Visibility module). FED = fractional effective dose.
The methodology is based on a modular framework, which would makes it possible for subsequent users to exchange any modules with their bespoke coupling algorithm or agent classification.
Simulation Tools
As mentioned in the “Literature Review” section above, there are different simulation tools available either commercially or in academia, to model fire and separately to model evacuation. In this paper, FDS version 6 was used. FDS is an open source 3D CFD tool provided by the National Institute of Standards and Technology (NIST) of the U.S. Department of Commerce. It is a large-eddy simulation code for low-speed flows solving Navier-Stokes equations numerically. It is a widely used fire simulation tool in the building industry. The advantage of FDS is the ability to obtain outputs at specific points across the control volume, and for this paper, they are obtained in 0.5 m intervals in the x and y directions on the horizontal plane at 1.5 m from the floor, which is the approximate average height of a person’s mouth and nose ( 4 ).
For evacuation modeling, MassMotion version 10.5 was used. It is a verified 2D agent-based tool from Oasys for the use of pedestrian dynamics and evacuation modeling ( 19 ). The advantage of MassMotion is the SDK feature which allows for customized coding by the user to control the agents using one of the common programming languages. For this project, Python 3.4 was used to import the FDS outputs through the SDK.
Inputs
Geometry
Two geometries are considered for the simulation. The first layout, Geometry A, is a 50 m × 50 m × 3 m open-plan room with two exits, similar to the geometry used by Fang and Breese ( 20 ). The room mimicks an activity hall in a university environment. The two exits are of 2.5 m height and are placed at diagonally opposite ends, with the fire being located in the middle of the room. To introduce asymmetry to the room, one of the exits, exit AA, has a width of 2 m, and the width of the other exit, exit AB, is 4 m.
The second layout, Geometry B, represents a single floor with internal dimensions of 30 m × 30 m × 3 m with six separate rooms and a hallway, similar to the geometry developed by Ronchi et al. ( 21 ). To introduce asymmetry, the fire location is in one of the rooms at the corner of the 30 m × 30 m plan, closer to one of the exits, exit BB.
Both geometries have two exits and smoke extraction systems in each segregated zone to meet British building fire regulations (
1
). Every extraction point is modeled to have a flow rate of close to 10
The two geometries modeled in MassMotion are shown in Figure 9. The yellow rectangles are areas measured for exit crowd densities. All the doors are left open to model the worst-case scenario where the smoke would spread to different areas and also to allow for aerodynamic movement from the smoke extraction systems.
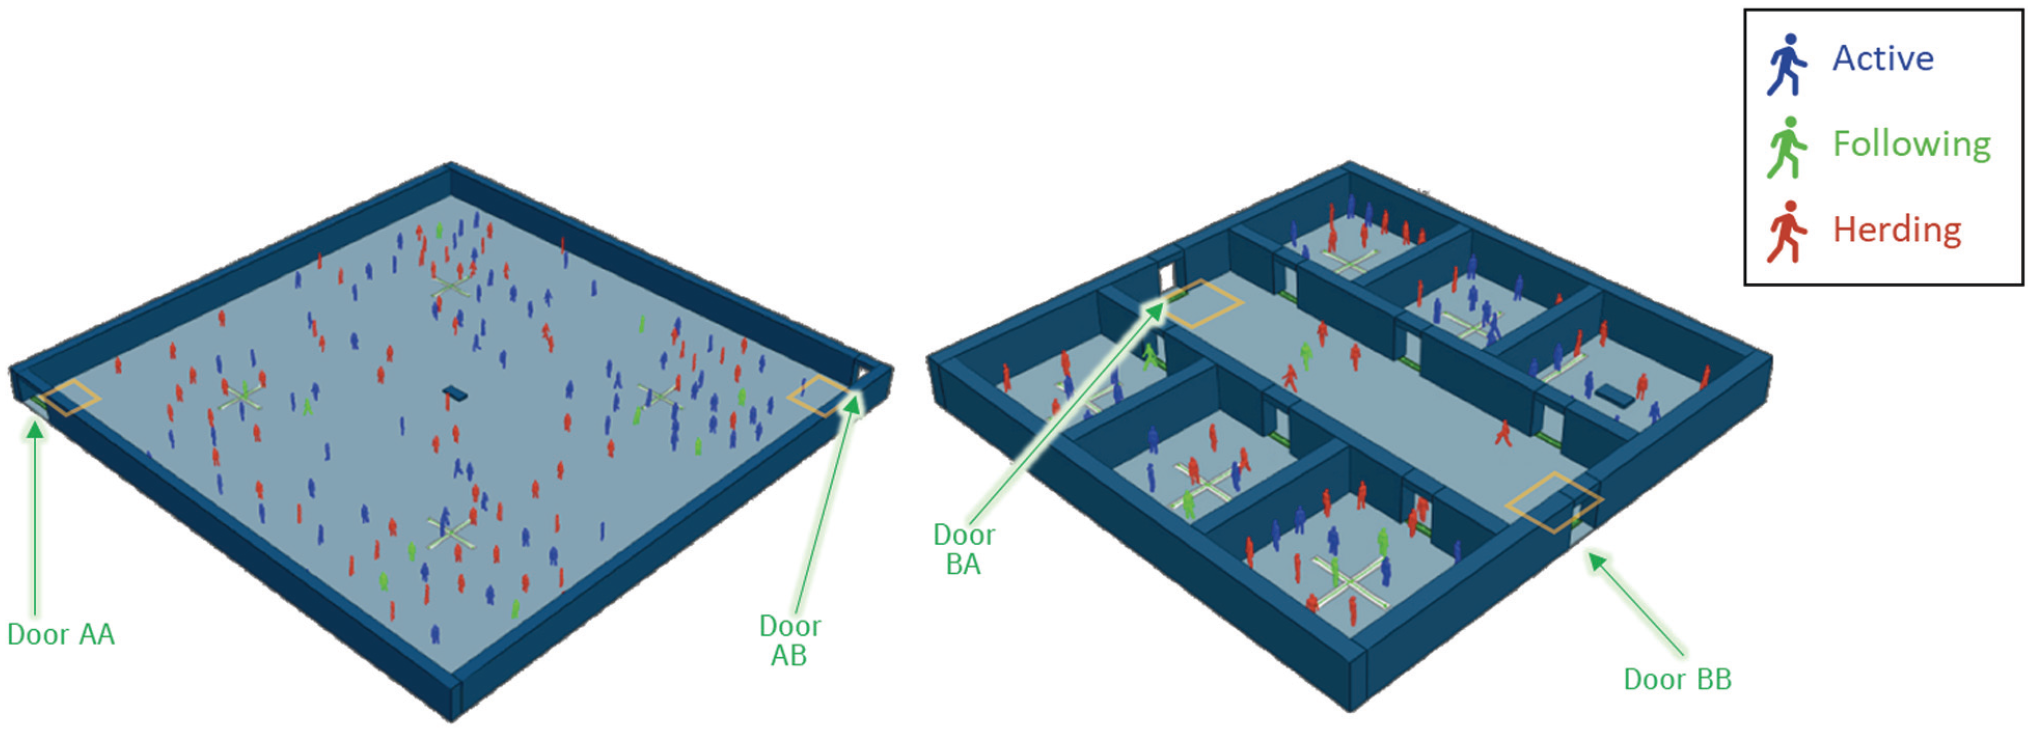
The two room geometries used for the simulations.
Fire Source
To keep the fire source identical in both geometries and large enough to represent a piece of upholstered furniture with combustible material and by-products that could affect evacuees, the fire source has been set to be a sofa of size 2 m × 1 m × 0.25 m. The common materials of a sofa are identified as polyurethane (PUR), polyvinyl chloride (PVC), wood, steel, cotton, and polyester, as identified by Jeong ( 22 ). The fire size is modeled to be over 3 MW following a fast fire growth rate with the growth parameter of 0.047, following National Fire Protection Association (NFPA) 92 standard ( 23 ).
Building Occupancy Information
In Geometry A, 150 agents or people are initially spatially distributed around the room and then circulate before the fire starts. In Geometry B, as the layout is smaller, the number of agents has been reduced to 100 agents.
The percentage of the agent types was adopted from the research by Cheong et al. ( 7 ) to 44% active, 7% following, and 49% herding for both geometries for a university environment. This limits the demographics in the room to men and women in the age group of 20 and 29. In Figure 9, the agent colors represent their associated types: blue is for active agent, green is for following, and red is for herding.
Simulation Scenarios
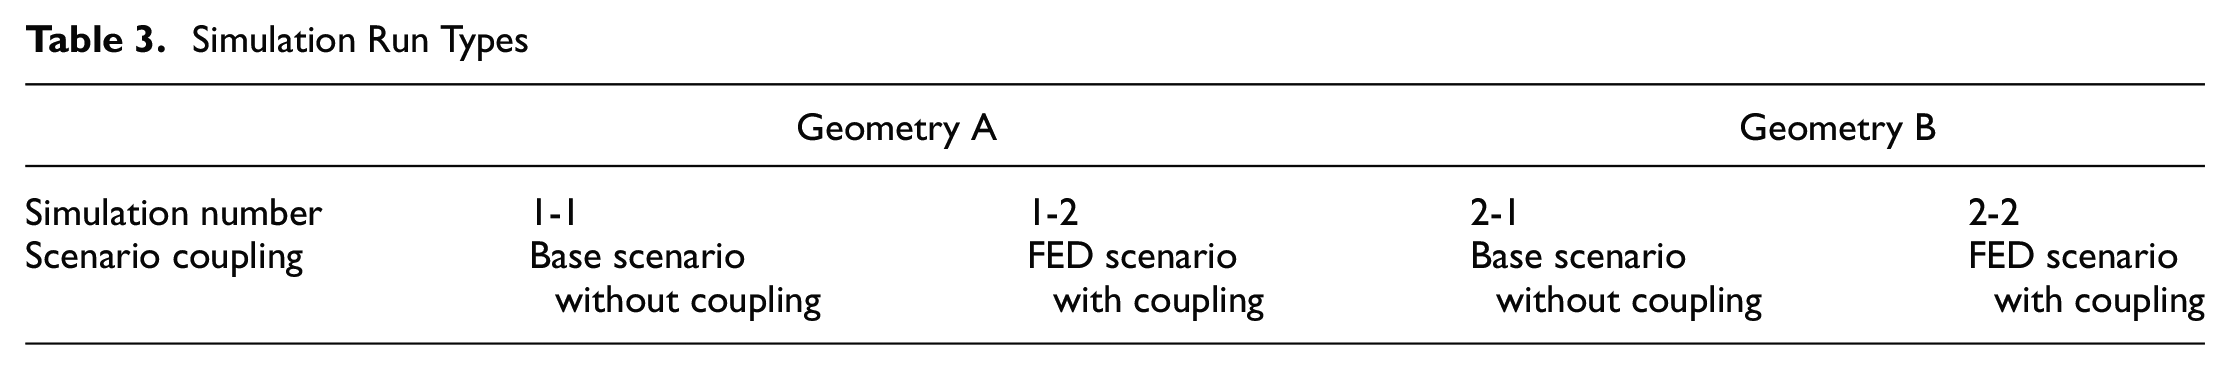
Table 3 summarizes the simulation runs carried out for the paper. For each geometry, the evacuation process was evaluated without and with coupling to understand the differences in the results. The base scenario without the coupling effect is based on the methodology as outlined in the “Proposed Coupling Methodology” section and Figures 6–8 but without the purple rectangles. The reason for primarily using the same method, just without the coupling, is to be able to assess the effect of the coupling only, without considering the impact of other factors.
Simulation Run Types
Results
Fire Simulation
The fire simulation was run with the cell size of 0.5 m × 0.5 m × 0.5 m per mesh. The visuals of the fire simulation outputs were created using the smoke density results and Smokeview, which is the post-processing tool associated with the FDS software, also developed by NIST. For Geometry A, at 55 s after the fire started, the smoke had covered the entire room. The smoke concentration continued to incline until it reached the maximum value at 135 s. The ventilators started extracting air from the room after 150 s. As a result, the smoke levels declined around areas near the wall after 250 s. Figure 10 shows soot density development in the case of a fire in Geometry A. The nine boxes on the roof represent nine ventilators as marked by red arrows.
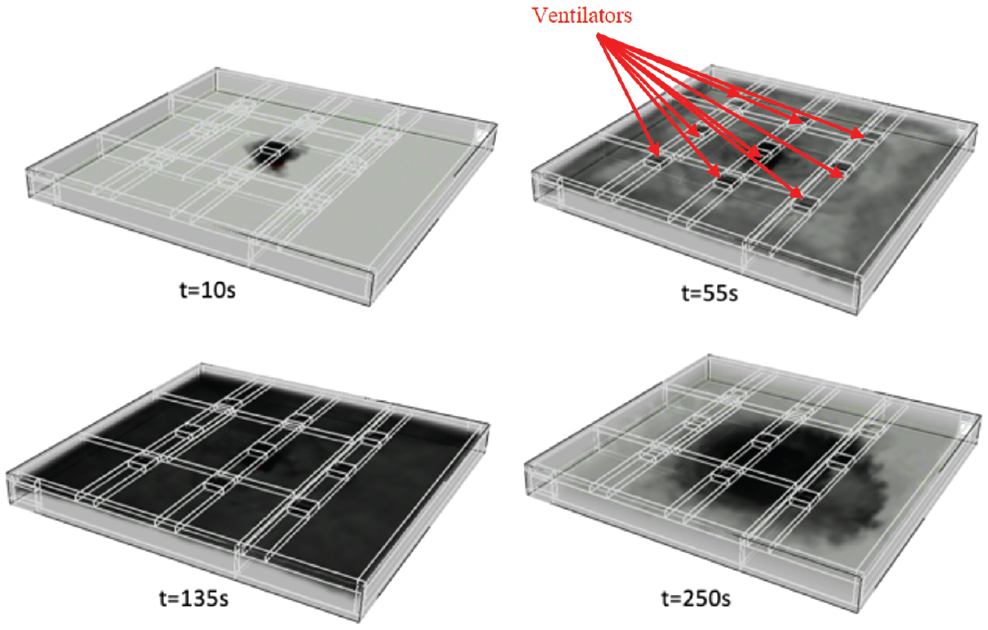
Soot density development for Geometry A.
For Geometry B, at 20 s after the fire started, the smoke quickly filled up the room of the fire and started to spread into the corridor. At 55 s, the smoke concentration in the room of the fire had reached the maximum level and the whole corridor was affected. At 135 s, the entire corridor reached the highest smoke density, whereas the other rooms where the fire still had relatively low smoke density. When the ventilation systems were switched on at 150 s after the fire start, the corridor and rooms started to clear of soot. Figure 11 shows soot density development in Geometry B.
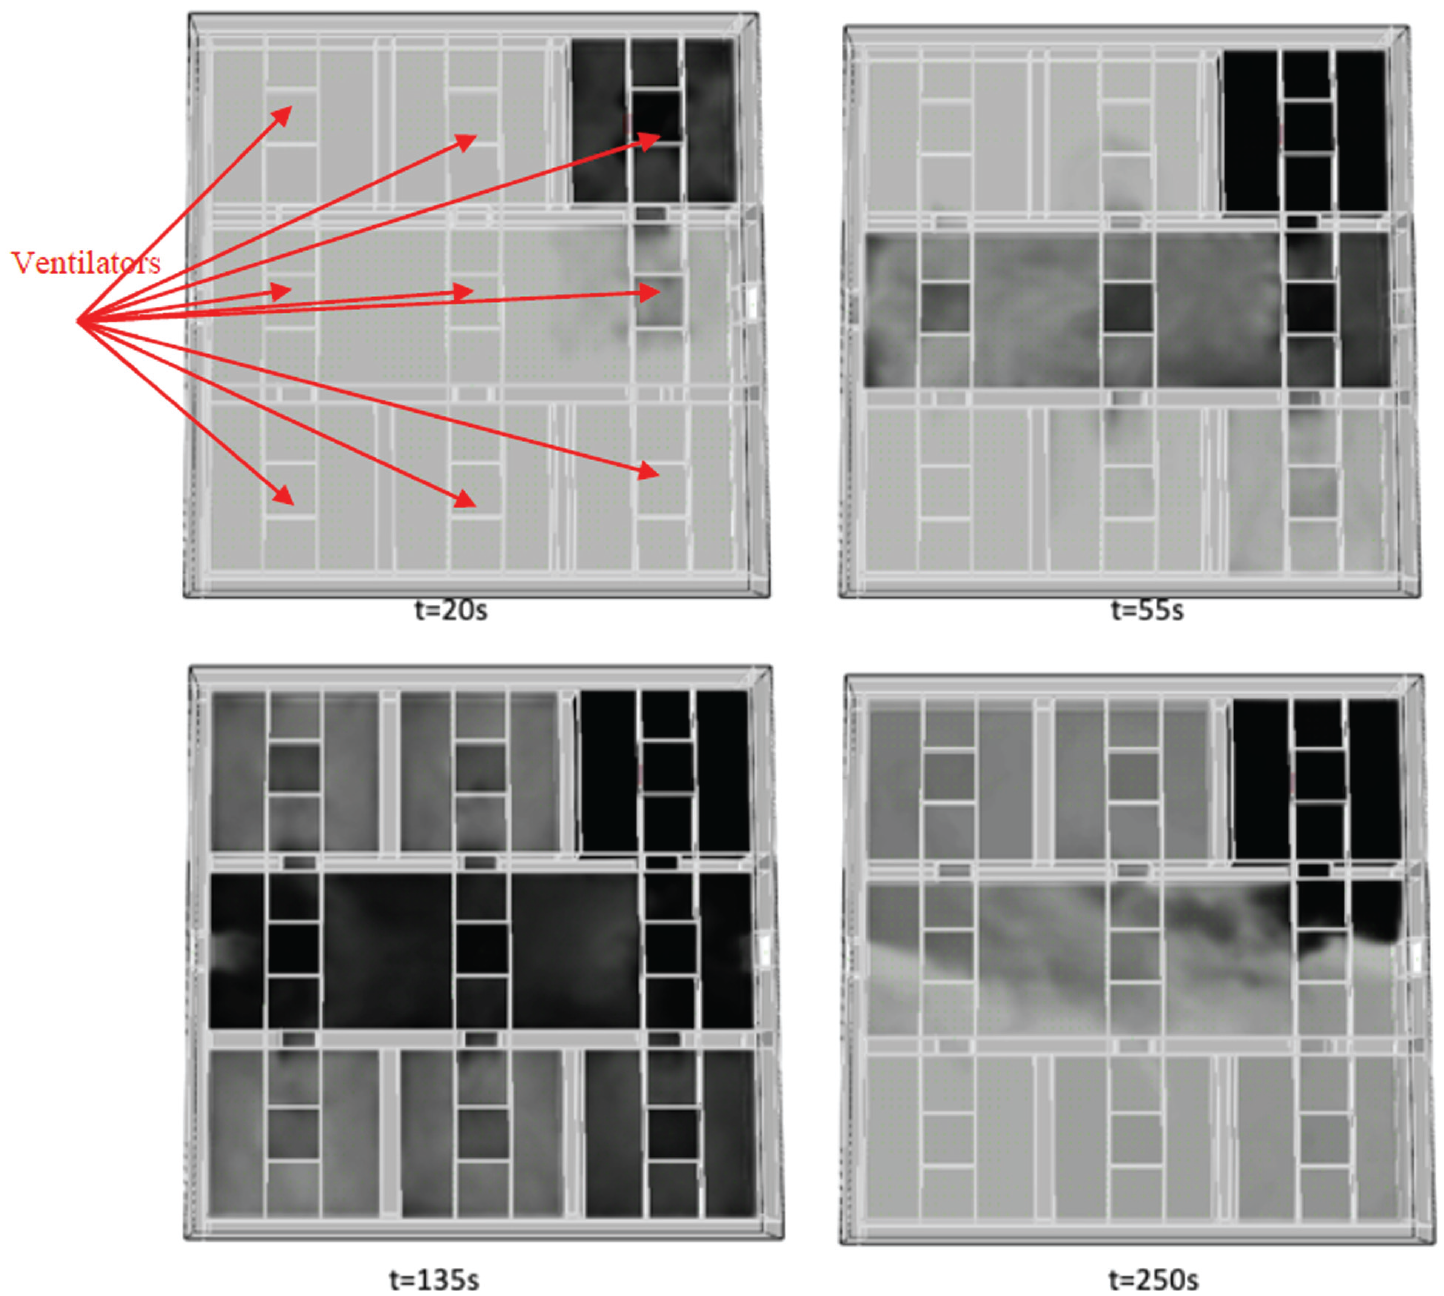
Soot density development for Geometry B.
Coupled Evacuation Simulation Result
Representative agents from FED cases and their walking speeds against time are shown as a ratio of their original comfortable gait speeds. Figure 12 provides diagrams for both geometries for a random agent. As stated in Equation 14, the four factors influencing the walking speed are represented with the following colors:
visibility factor
CO factor
temperature factor
FIC factor
For both geometries, the speed (dark purple) first decreases because of irritant gas,
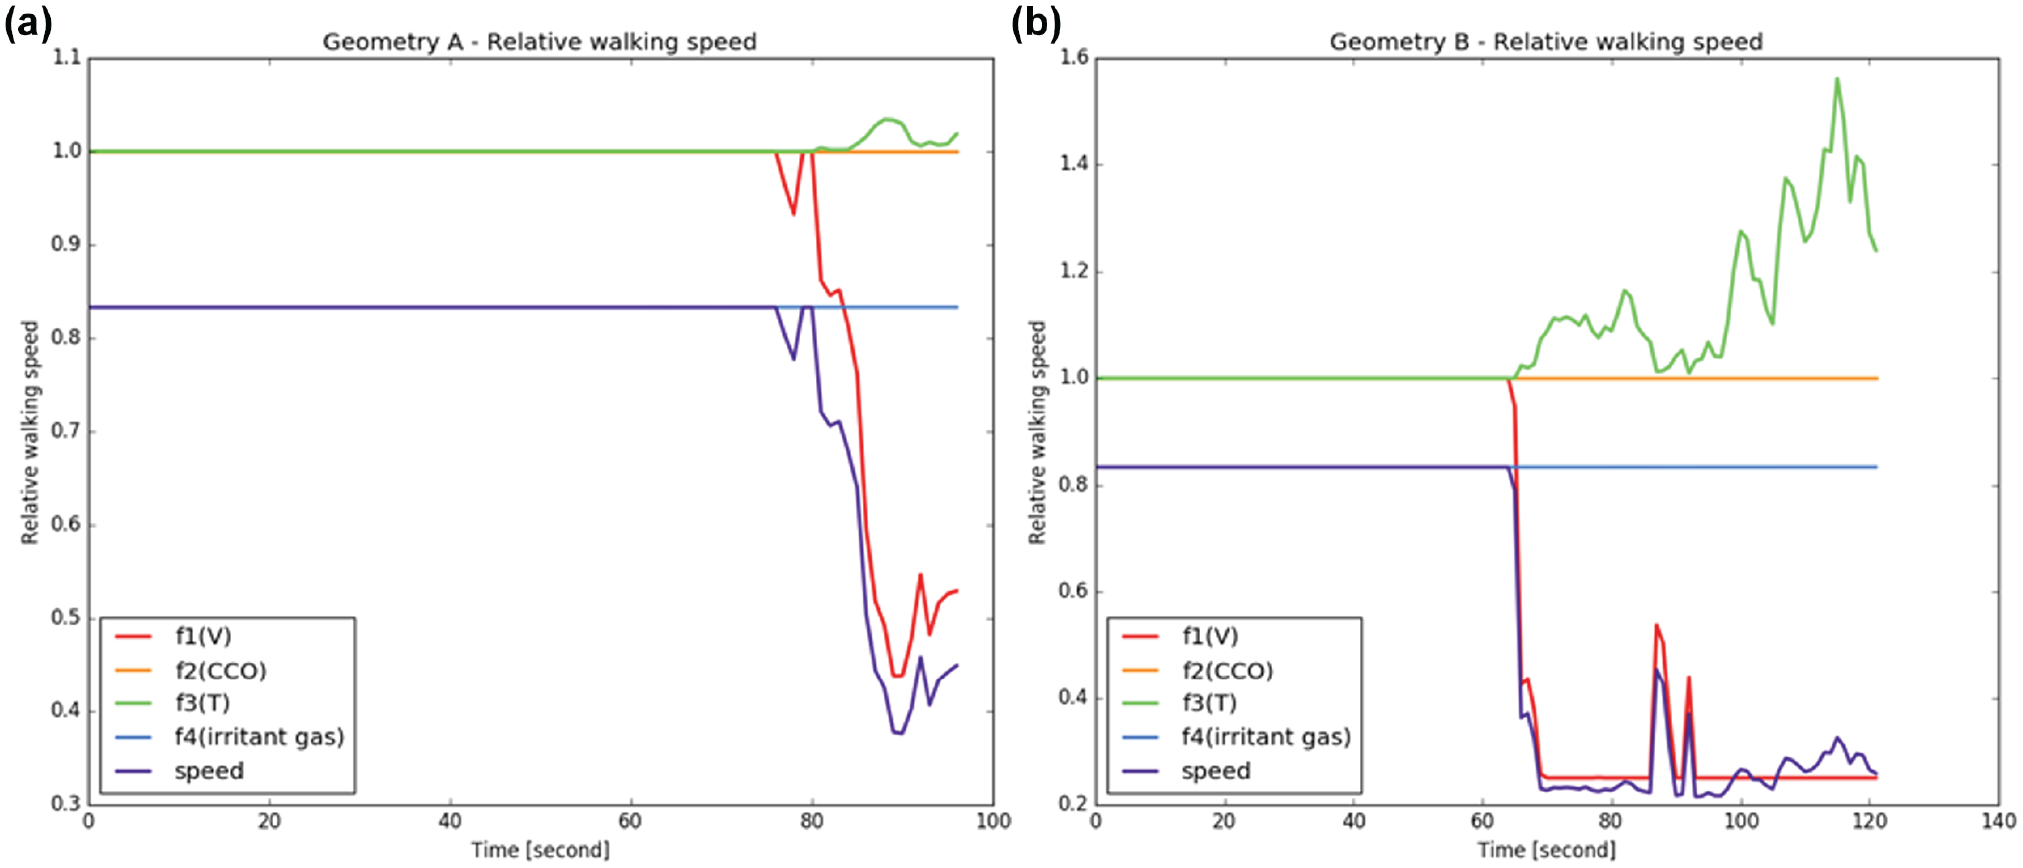
Walking speed of a random agent during the simulation: (a) Geometry A, (b) Geometry B.
Evacuation Time and Exit Densities Compared with the Base Scenario: Geometry A
For the calculation of density near exits, an area of 5 m × 5 m is chosen, as illustrated using yellow boxes in Figure 9. The results of exit densities for both scenarios and the two exits are shown in Figure 13. The exits are labeled as AA and AB. The start of the fire is at t = 0.
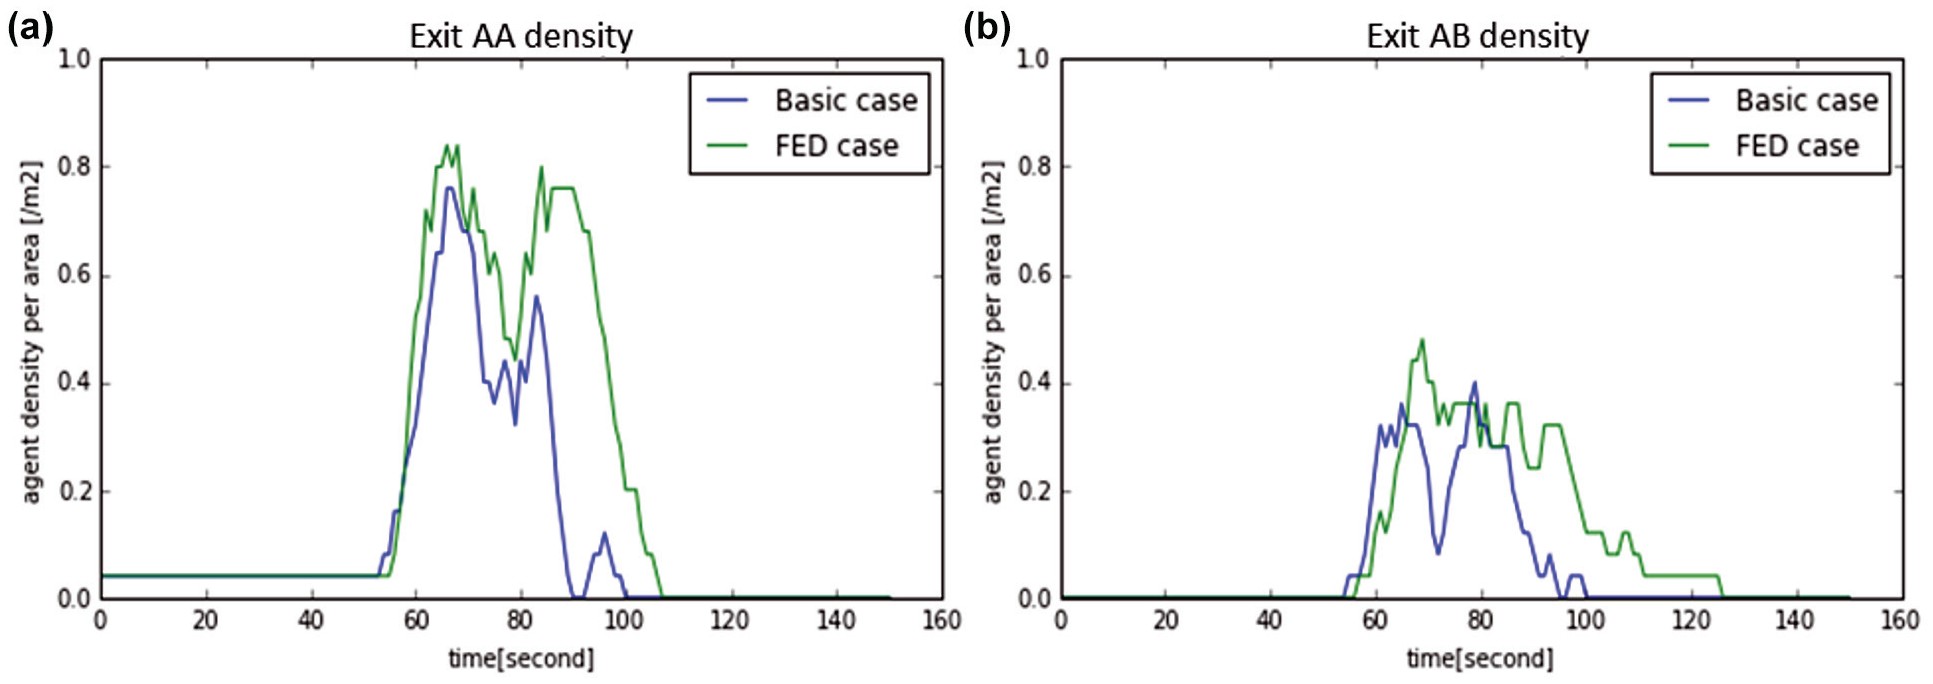
Exit crowd density for Geometry A: (a) exit AA, (b) exit AB.
In general, whether it is for the base or FED scenario, the numbers of occupants initially choosing exit AA and AB are similar because of the symmetric room structure and the central location of the fire. However, after evacuation starts, the crowd density at exit AA is significantly higher than at exit AB because of the different door sizes. As described in the “Inputs – Geometry” section, exit AB has a door width of 4 m while exit AA is 2 m wide. The higher throughput at exit AB leads to lower density, less congestion, and a smaller queue.
When comparing the base and FED scenarios, the presence of visibility, temperature, and toxic gases causes slower walking speeds, congested exits, longer waiting time and eventually longer evacuation time. When modeling evacuation without the consideration of fire, the base scenario shows an evacuation time of 99.6 s, whereas the coupling increases the evacuation time to 125 s. No agent reaches incapacitation during the entire process in Geometry A because of the open floor plan.
Evacuation Time and Exit Densities Compared with the Base Scenario: Geometry B
Figure 14 shows the exit density for Geometry B. As mentioned in the “Inputs – Geometry” section, both exits have the same size. However, because the location of the fire introduces asymmetry into the evacuation process, exit BA has a higher density. Many active and following agents first choose exit BA, their familiar exit, causing more herding agents to follow them, and leading to a high density at exit BA. They take the risk of going for the further exit despite the longer wait time. The position of the fire is placed at the center of the room, closer to exit BB, as Figure 14 illustrated, leading to a longer queue and higher density at exit BA.
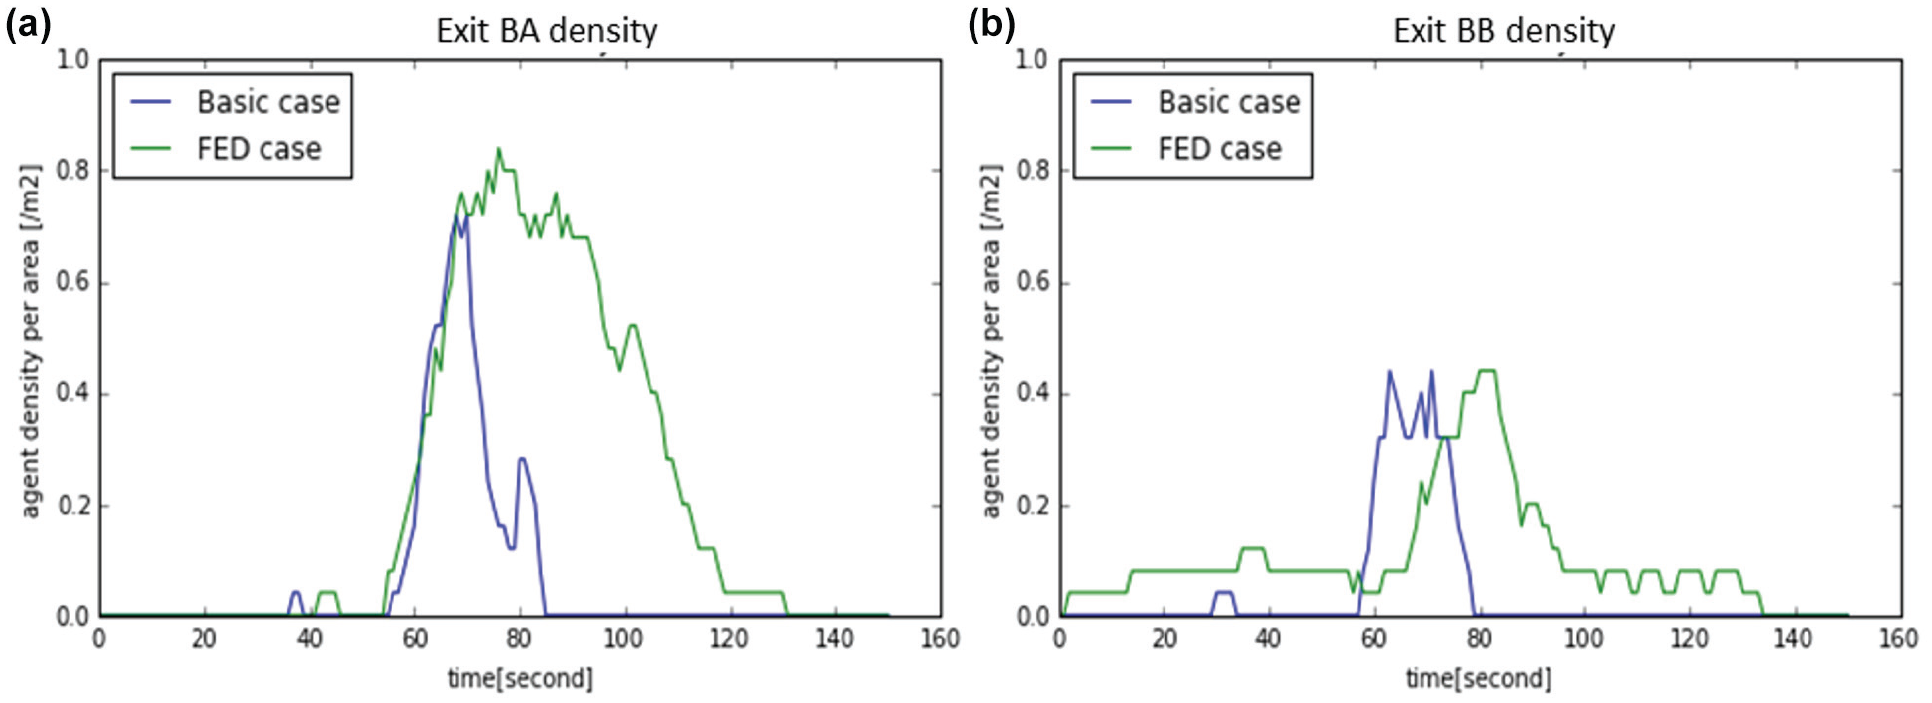
Exit crowd density for Geometry B: (a) exit BA, (b) exit BB.
For the FED scenario, the off-center fire location leads agents to choose exit BA, the exit further away from the fire location, at the beginning, until the ventilation system switches on. The poor tenability conditions in the corridor slow down most agents, and exit BB is utilized gradually again after the ventilation system clears the exit.
In the base scenario, all agents exit after 84.8 s since the fire started. In the FED case, 84 out of 100 agents exit successfully, with an evacuation time of 133.2 s. The other 16 agents reach incapacitation caused by heat exposure. The percentage of increase in the evacuation time is 57% with Geometry B while it is 25.5% for Geometry A. This shows that the incorporation of toxic gases, visibility, and temperature has a significant impact on the evacuation time and success rate, particularly in a complex geometry.
Discussion
The paper presents the impact of applying theoretical implications of FED to evacuation time and exit densities. Table 4 summarizes the main findings and simulation results.
Simulation Run Types
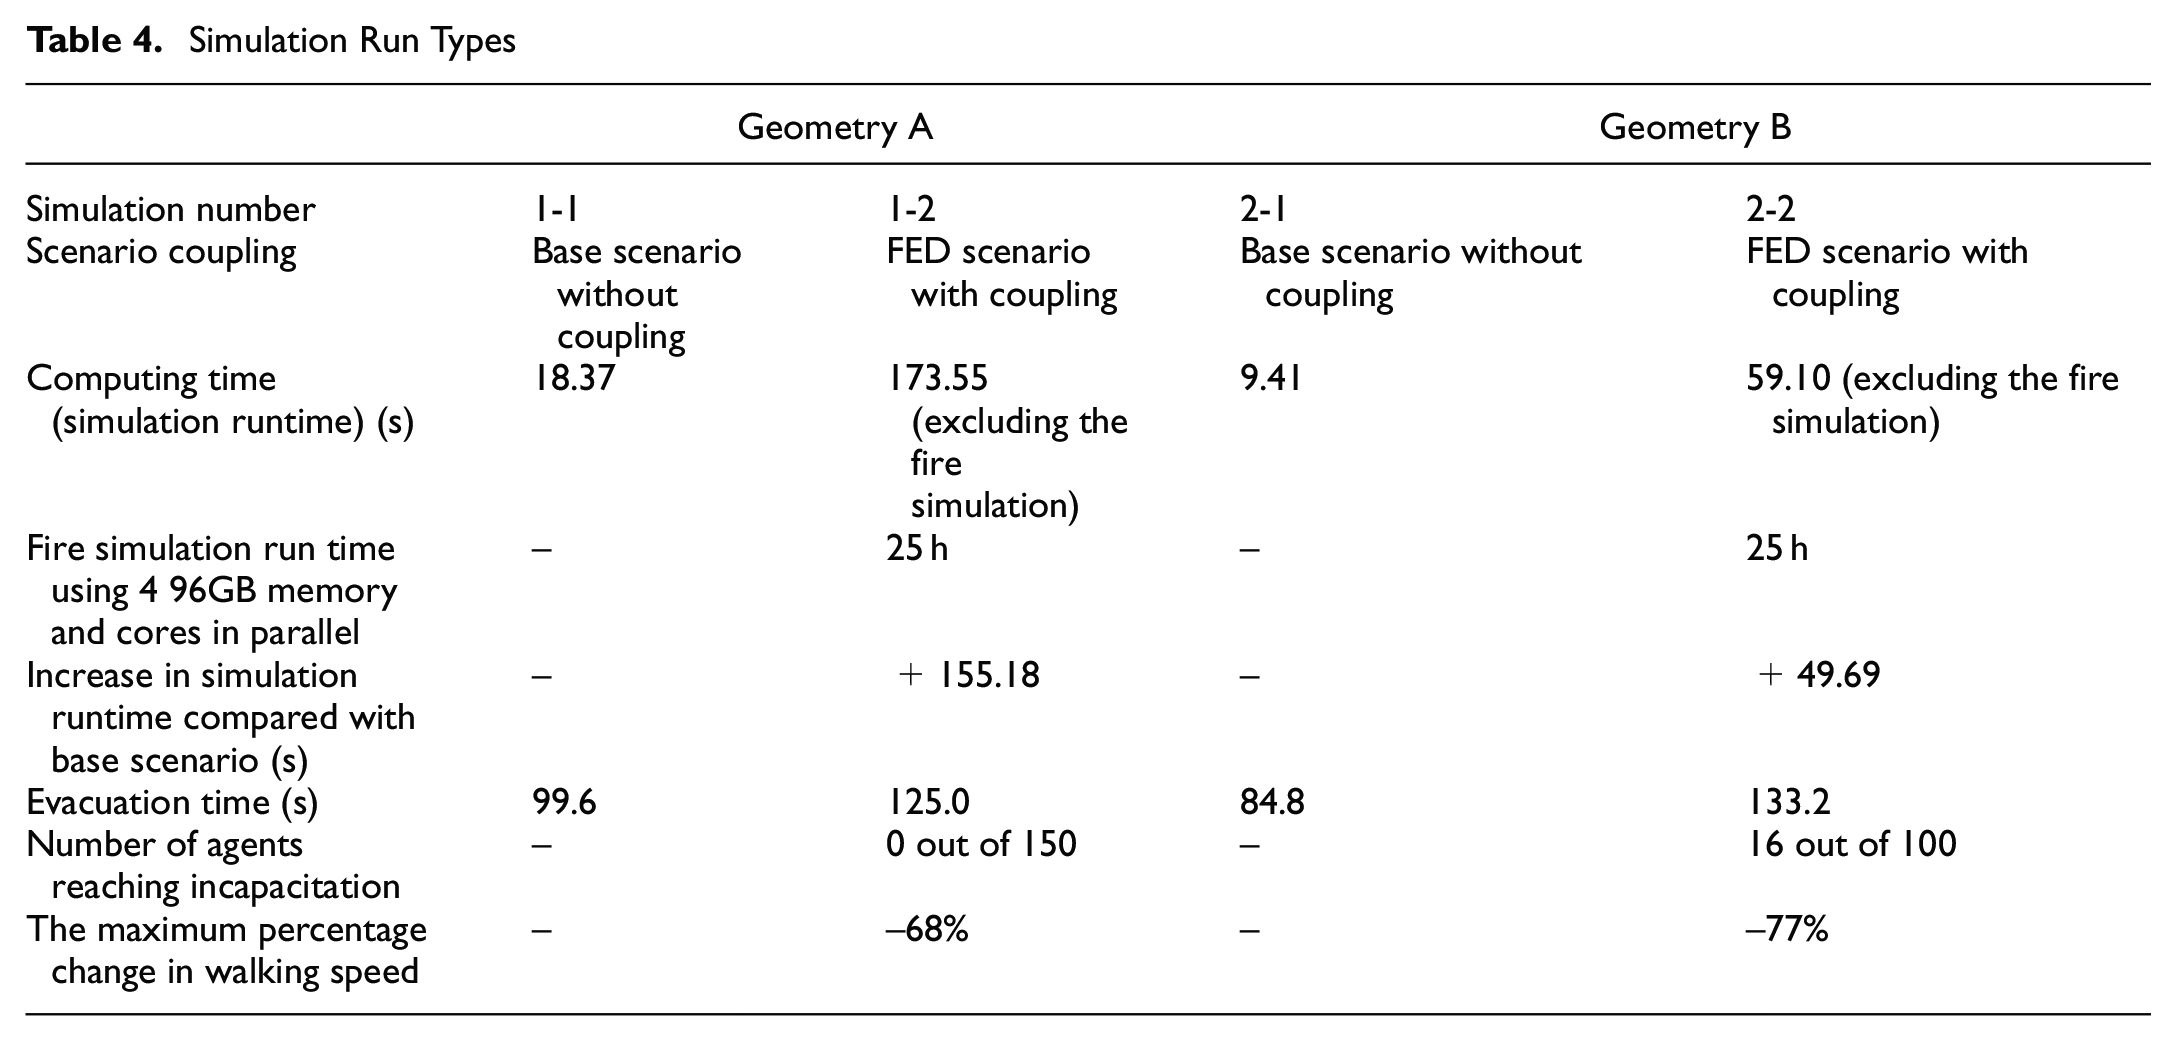
The simulation time comparison helps understand the balance between computing time and the result. The simulation execution time of the evacuation simulation of the FED scenario is almost ten times that of the base scenario for Geometry A and over six times that ofGeometry B. The differences in the simulation time will multiply with varying fire locations and sizes. However, despite the additional simulation and preparation time, the computational effort is justified for its impact on the resulting evacuation time, process, and success rate. The amount of preparation time before coupling helps to evaluate the effort-to-result ratio. The calculation of each FDS output per geometry with a timestep of 1 s took over 25 h using multi-core parallel runs on a 96 GB memory high-performance computing facility. The FDS simulation could have a lower simulation time at the cost of low-resolution spatial data, which will affect the result and the coupling quality. However, the fire simulation runtime should not be considered as additional time required for coupling because fire modeling is often conducted, regardless of coupling, to develop fire strategy and size ventilation requirements and help with the building design. In fact, a coupling can potentially even save time in model preparation. The FDS model preparation is currently carried out separately to the MassMotion model preparation, despite the overlapping input requirements. This could be streamlined through an automated process attached to the proposed methodology to avoid duplication of effort. When modeling agent behavior, regardless of incorporation of the FED effect, simulating herding agents’ exit selections is the most challenging task of all three agent groups. Herding agents make decisions depending on the closest moving non-herding agents within a given influence radius to select the most suitable agent(s). Therefore, the calculations of utility functions require iterations for the assessed herding agent.
There are other technical difficulties when coupling FDS with a pedestrian dynamics model. Firstly, FDS provides results in three dimensions (3D), whereas MassMotion simulations are carried out in 2D per floor. To translate the 3D data to 2D simulation, for the purpose of this paper, a 2D plane of the FDS results was chosen at a height that represents the distance between the floor and an average person’s nose and mouth area. This is a simplified methodology. One of the next steps would be to include a variance or develop another method for converting the 3D to 2D data to regard the effect of temperature on the person’s whole body. Secondly, when only relying on the three types of agent behavior to guide the agents to the exit, the agents treat the walls, especially at corners, as an obstacle to avoid walking into, but not as an obstacle to avoid getting close to. This means that when herding agents happen to start from a corner, the rule of using an influence radius to find a non-herding agent is restricted and sometimes can leave the herding agent lost in the corner for a significant time, if not for the entire simulation duration. For this reason, agents in corners have been given a larger radius at a consistent value for each geometry.
Limitations and Future Work
There are limitations to the proposed coupling methodology. Firstly, the proposed methodology uses only three types of agents: active, following, and herding, and ignores the presence of fire wardens, people with disabilities, and other categories. In addition, the demographics in this study reflect those of a typical university setting, as identified by Cheong et al. ( 7 ), with little variety in age of evacuees. The age groups need to be diversified in future study, as each age group has varying walking speed, which would result in different evacuation dynamics.
Research is currently being conducted to assess the impact of the incorporation of further agent types on the evacuation process and sensitivity analysis of the percentages based on the results from Cheong et al. ( 7 ). Secondly, the simulations for this paper used the shortest path algorithm for active and following agents. In reality, this is not necessarily the case and some agents detour, as shown by previous research and the video recordings from Cheong et al. ( 7 ). For additional geometries, incorporation of varying routes will need to be considered, given their impact on the simulation.
Thirdly, the methodology does not incorporate situations where agents may re-enter the building if they have left something behind or to look for someone. While the evacuation procedures rely on evacuees not returning, the literature ( 2 , 3 , 7 ) shows that some evacuees return in reality.
Fourthly, the methodology has adopted the theoretical relationship between temperature and walking speed developed by Cao et al. ( 4 ). The relationship shows an increase in walking speed at temperatures between 30 and 60°C, as if hot surroundings make people react and run faster. This relationship has, therefore, not reduced the walking speed more than one would expect at first.
Fifthly, the paper presents a one-way coupling. There are literature reviews for two-way coupled case studies. However, they have been shown to extend the overall simulation times by multiple orders of magnitude and require high-performance computing to support the computationally intensive fire simulations that require new inputs at every new timestep. Such two-way couplings have shown significant benefits only for situations where the people move in such a way as to affect the aerodynamics or extinguish the fire themselves.
Sixthly, a further investigation on the weighting of each factor and the influence on the walking speed based on Equation 14 would be beneficial. Currently, the assumption is that the impact of visibility, temperature, CO, and irritant gases on walking speed is equal, as each factor has been separately studied by Cao et al. ( 4 ), Jin ( 10 ), Fridolf et al. ( 13 ), Fruin ( 14 ) and Purser ( 15 ).
Overall, with further development, the methodology could be applied to any building structure with any fire type. The input data were collected from different sources, such as the walking speed from Bohannon ( 12 ) or the demographics and the agent classifications from Cheong et al. ( 7 ). While each of those studies was carried out to provide a database or set of data that could be applied for general use, a further investigation of any potential errors resulting from fusion of data from different sources would be beneficial. In addition, there may be unforeseen teething problems for new geometries that introduce different kinds of obstacles, such as stairs and elevators. Additionally, for each fire type, the main gases produced need to be re-identified and re-simulated on FDS.
Conclusion
This paper analyzed the influences of visibility, toxic gases, and temperature on occupants’ tenability conditions and walking speeds during fire evacuation, using a new methodology. The methodology was tested on two different geometries with a realistic fire source in each of the given settings.
The results indicate that a low concentration of CO produced by the sofa fire has a minimal influence on the occupants’ walking speeds, while the presence of an irritant gas, HCl, causes a stable reduction of 17% in gait speed. Visibility and temperature influence the walking speed more than other factors when a fire has fully developed. Reduced visibility leads to a reduction of up to 75% of the original speed, while the resulting temperatures caused the agents to walk faster. Furthermore, the presence of low visibility, toxic gases, and high temperature lead to a delay in the evacuation time and an increase in exit congestion. A more complex structure with more obstacles, such as walls and corners, could lead to greater incapacitation of people and longer evacuation time.
The proposed coupling methodology has the advantages of being adaptable to different geometries and fire sources. The methodology incorporates FED and the effect of visibility on human behavior, evacuees’ individual walking speed, and exit selection during an evacuation based on various previous research findings, and therefore, can provide a more realistic simulation of fire evacuation scenarios. This coupling methodology could help in the design of large buildings, such as transportation hubs or large train stations with many occupants, to design their evacuation plans more effectively to help people evacuate safely with consideration of the effects of fire on the egress performance.
Footnotes
Declaration of Conflicting Interests
The author(s) declared no potential conflicts of interest with respect to the research, authorship, and/or publication of this article.
Funding
The author(s) declare that they received the following financial support for the research, authorship, and/or publication of this article: EPSERC Centre for Doctoral Training in Sustainable Civil Engineering and Lloyd’s Register Foundation.