
Abstract
This study explores the transformative impact of big data analytics on university libraries, examining its potential to disrupt traditional systems and services through the lens of Clayton Christensen's four-step framework. A qualitative case study approach was employed involving semi-structured interviews with 25 participants from five groups of Australian university libraries (independent universities and the members of Innovative Research Universities, the Regional Universities Network, the Group of Eight and the Australian Technology Network). The data collection occurred between 2018 and 2022. The findings confirm the disruptive potential of big data analytics in modern librarianship, enhancing decision-making and demonstrating libraries’ value. Its adoption is revolutionising librarians’ decision-making practices, signifying a major shift towards data-driven approaches. This study contributes to the field of library and information science, applying the theory of disruptive technologies to analyse the importance of big data analytics in librarianship decision-making. The study's recommendations lay a foundation for future research and provide actionable strategies for implementing big data analytics in university libraries to enable informed decision-making and fully harness its potential. Additionally, this study makes a significant contribution to the existing literature on analytics adoption, particularly in the context of emerging and disruptive innovations. The findings have far-reaching practical implications for Australian libraries, emphasising the need to adopt big data analytics tools to elevate decision-making processes and enhance user experiences.
Keywords
Introduction
A substantial body of literature has emerged on the application of analytics in higher education, indicating that analytics solutions in this sector represent a promising field of inquiry (Ashaari et al., 2020; Attaran et al., 2018; Chaurasia and Frieda Rosin, 2017; Mahroeian and Daniel, 2021; Rossi, 2021; Umer et al., 2023; Viberg et al., 2018; Wang et al., 2016). Higher education institutions are currently under heightened scrutiny from various stakeholders, including governments, accrediting agencies, students, parents and donors, and are seeking innovative strategies to enhance student outcomes (Campbell et al., 2007; Tsai et al., 2022). In response to shrinking budgets, academia are increasingly seeking novel tools to optimise their processes, leading to a growing interest in business analytics, and particularly predictive analytics (Litsey and Mauldin, 2018). The burgeoning fields of predictive analytics and machine learning have become essential professional practices in large corporations, especially those offering products and services to customers (Litsey and Mauldin, 2018). The emerging culture of accountability in higher education necessitates the evaluation of the processes and tools employed for decision-making, prompting academia to leverage business data analytics to address practical challenges (Litsey and Mauldin, 2018; Mahroeian and Daniel, 2021).
Researchers have investigated the application of data analytics from the perspective of university libraries (Ijab et al., 2019; Litsey and Mauldin, 2018; Roy, 2024; Roy et al., 2018). For instance, Litsey and Mauldin (2018) propose that data usage can be extended to library service environments, and demonstrate the proactive development and utilisation of machine learning algorithms and predictive analytics to discern library behaviour, thereby informing data-driven decision-making. Previous studies have found that the adoption of big data analytics is a game-changer in the current industrial environment for precision decision-making (Maroufkhani et al., 2020), where organisations benefit from adopting big data analytics because it improves overall organisational performance (Mikalef et al., 2019; Wamba et al., 2020). Studies have also attempted to explain business data analytics and its application in higher education (Chaurasia and Frieda Rosin, 2017; Doty, 2020; Garoufallou and Gaitanou, 2021; Travis and Ramirez, 2020; Tsai et al., 2022). These studies identify how analytics applications play an essential role in higher education, its competitive advantage and the challenges of data complexity. More recently, a study conducted by Tsai et al. (2022) found that the extensive collection of big data from learning management systems, student information systems and associations with institutional services such as libraries makes academic analytics an excellent solution for understanding student engagement and success.
However, research suggests that big data alone does not deliver value; rather, its proper analysis is essential (Kaisler et al., 2013; Thirathon et al., 2017). Studies have identified that a big data platform that can integrate with existing infrastructure and processes is still a significant challenge for higher education institutions (e.g. Attaran et al., 2018; Chaurasia and Frieda Rosin, 2017; Daniel, 2015; El Alfy et al., 2019; Hamad et al., 2022; Hilliger et al., 2020; Umer et al., 2023; Viberg et al., 2018). A study on analytics and decision-making in the higher education sector in New Zealand conducted by Mahroeian and Daniel (2021) found that analytics is limited to monitoring operational activities rather than improving the quality of learning, teaching and strategic initiatives. Furthermore, the study specifies several concerns regarding the ability of institutions to find the means and skills to extract helpful information from available data sets and turn such data into usable knowledge to support students and educators. Similarly, Attaran et al. (2018), Chaurasia and Frieda Rosin (2017), Eclevia et al. (2019), Murumba and Micheni (2017) and Tsai et al. (2022) report on the challenges of big data in education, including the cost, the lack of executive vision, the inability to associate fundamental business problems with big data solutions, the lack of data strategies, data quality issues and simply leaving most data uncollected, leading to no analysis.
While analytics can enhance strategic decision-making, there is a high cost involved in deploying the necessary infrastructure to achieve the required results; as such, many institutions have opted to refrain from investing in analytics initiatives (Roy, 2024). Similarly, Attaran et al. (2018), Deho et al. (2022), Jaakonmäki et al. (2020) and Roberts et al. (2016) report concerns about predictive and learning analytics with regard to possible unfairness in predicting students’ potential and the invasion of students’ or applicants’ privacy, as analytics involves data privacy and data protection.
Moreover, a few investigations have examined disruptive technologies in higher education (e.g. Al-Imarah and Shields, 2019; Dillon, 2002; Duvivier, 2019; Flavin, 2021; Foreman et al., 2021; Lafferty and Edwards, 2004; Moodie, 2016; Oliver et al., 2007; Wilson, 2014). However, only a limited number of studies have investigated disruptive innovations or technologies in libraries (Cooper, 2015; Otike et al., 2022; Quinn, 2014; Wilson, 2014; Yeh and Walter, 2017).
Although some research has been carried out on disruptive technologies in libraries, there appears to be no studies that investigate how analytics impacts disruptive innovations in librarianship practices. Flavin’s (2021) study states that the theory of disruptive innovation analyses how powerful incumbent technologies are challenged and potentially defeated by technologically inferior goods and services. The landscape of librarianship is undergoing a significant transformation, driven by the emergence of disruptive innovations, and therefore librarianship practices are being challenged (Cooper, 2015). Tella's (2021) study on librarians’ views of big data in libraries highlights that integrating big data and data-driven decision-making can greatly improve library functions and services. The research recommends that libraries in Nigeria prioritise secure data storage across various databases and hire data specialists to manage big data efficiently. However, this study does not point out the disruptive impact of big data or suggest that such technologies could challenge established librarians’ decision-making practices, necessitating a thorough examination of the wider consequences.
While Christensen's (1997) work has shed light on the impact of technological innovations on firms and industries, a closer examination of his theory reveals a lack of exploration of the mechanisms and effects of disruptive technology in university libraries. This study therefore applies Christensen’s (1997) disruptive innovation theory to identify the impact of big data analytics on university librarianship practices. The main research question is: To what extent do big data analytics tools, such as business intelligence tools, qualify as disruptive technologies that are capable of transforming decision-making practices in university libraries in Australia? To the investigator's understanding, this is the first attempt towards a holistic approach to consider applying Christensen's disruptive innovation theory to research on the application of big data analytics in university libraries.
This study seeks to address a critical knowledge gap by re-exploring the concept of disruptive technological change, its underlying mechanisms and its far-reaching consequences for librarianship decision-making practices. By applying the lens of big data analytics, this study aims to: (1) identify the impact of big data analytics tools as disruptive technologies on today's librarianship decision-making practices in university libraries in Australia and (2) apply the theory of disruptive innovation in the context of the big data analytics tools used in librarianship decision-making.
Literature review
Definitions of big data
The concept of data analytics has gained significant attention in recent years, encompassing the examination of large data sets to uncover trends and patterns that facilitate a deeper understanding of current phenomena and inform future planning (Madry, 2020). The term ‘big data’, first introduced by Roger Magoulas in 2005 (Halevi and Moed, 2012), refers to the vast and complex amounts of data that exceed the processing capabilities of traditional database systems and applications (Naeem et al., 2022). Notably, the absence of a universally accepted definition of big data has led scholars to propose various interpretations based on its characteristics, technological aspects and emerging trends (Yaseen and Obaid, 2020). Research by Kitchin (2014) reveals that, similar to other terms describing the rapid evolution of technologies and practices, a consensus on a definitive academic or industry definition of big data remains elusive. Existing definitions of big data present divergent perspectives, conceptualising it as a social phenomenon, analytical technique, process or data set.
A study by De Mauro et al. (2015) investigated the various definitional views of big data, identifying four primary themes: information, technologies, methods and impact. The study found that big data is often characterised implicitly through success stories, characteristics, technical features, emerging trends or its impact on society, organisations and business processes, rather than being defined explicitly.
Big data is more than simply collecting information and generating reports (Alotaibi, 2021; Murumba and Micheni, 2017). Hospitals, manufacturers, colleges, banks, retailers and governments all collect so-called ‘big data’ (Wang et al., 2016). Big data was first defined in terms of volume, velocity and variety (the 3Vs; Wang et al., 2019). Since then, most definitions of big data have been based on the storage data size, and the most common refers to the 3Vs: volume, velocity and variety (Zikopoulos and Eaton, 2011). Vashisht et al. (2021) discuss ‘volume’ represents the amount/size of data produced daily. ‘Velocity’ means the speed at which data is produced and the power with which data processing can be done. ‘Variety’ indicates the data produced by Internet of Things devices, such as unstructured, structured and semi-structured. Most of the data created by Internet-enabled devices is unstructured.
On the other hand, Maheshwari et al. (2021) found that big data analytics has five crucial Vs: volume, velocity, variety, veracity and value. Big data has a huge volume, consisting of terabytes or petabytes of data; it has a high velocity, being created in or near real time; and it is diverse in terms of the variety of types, being structured and unstructured, and often temporally and spatially referenced.
Kehal and El Alfy (2021) and Vashisht et al. (2021) identified seven key characteristics of big data, known as the 7Vs: value, volume, variability, visualisation, veracity, variety, and velocity. Figure 1 provides a detailed explanation of each of these characteristics.
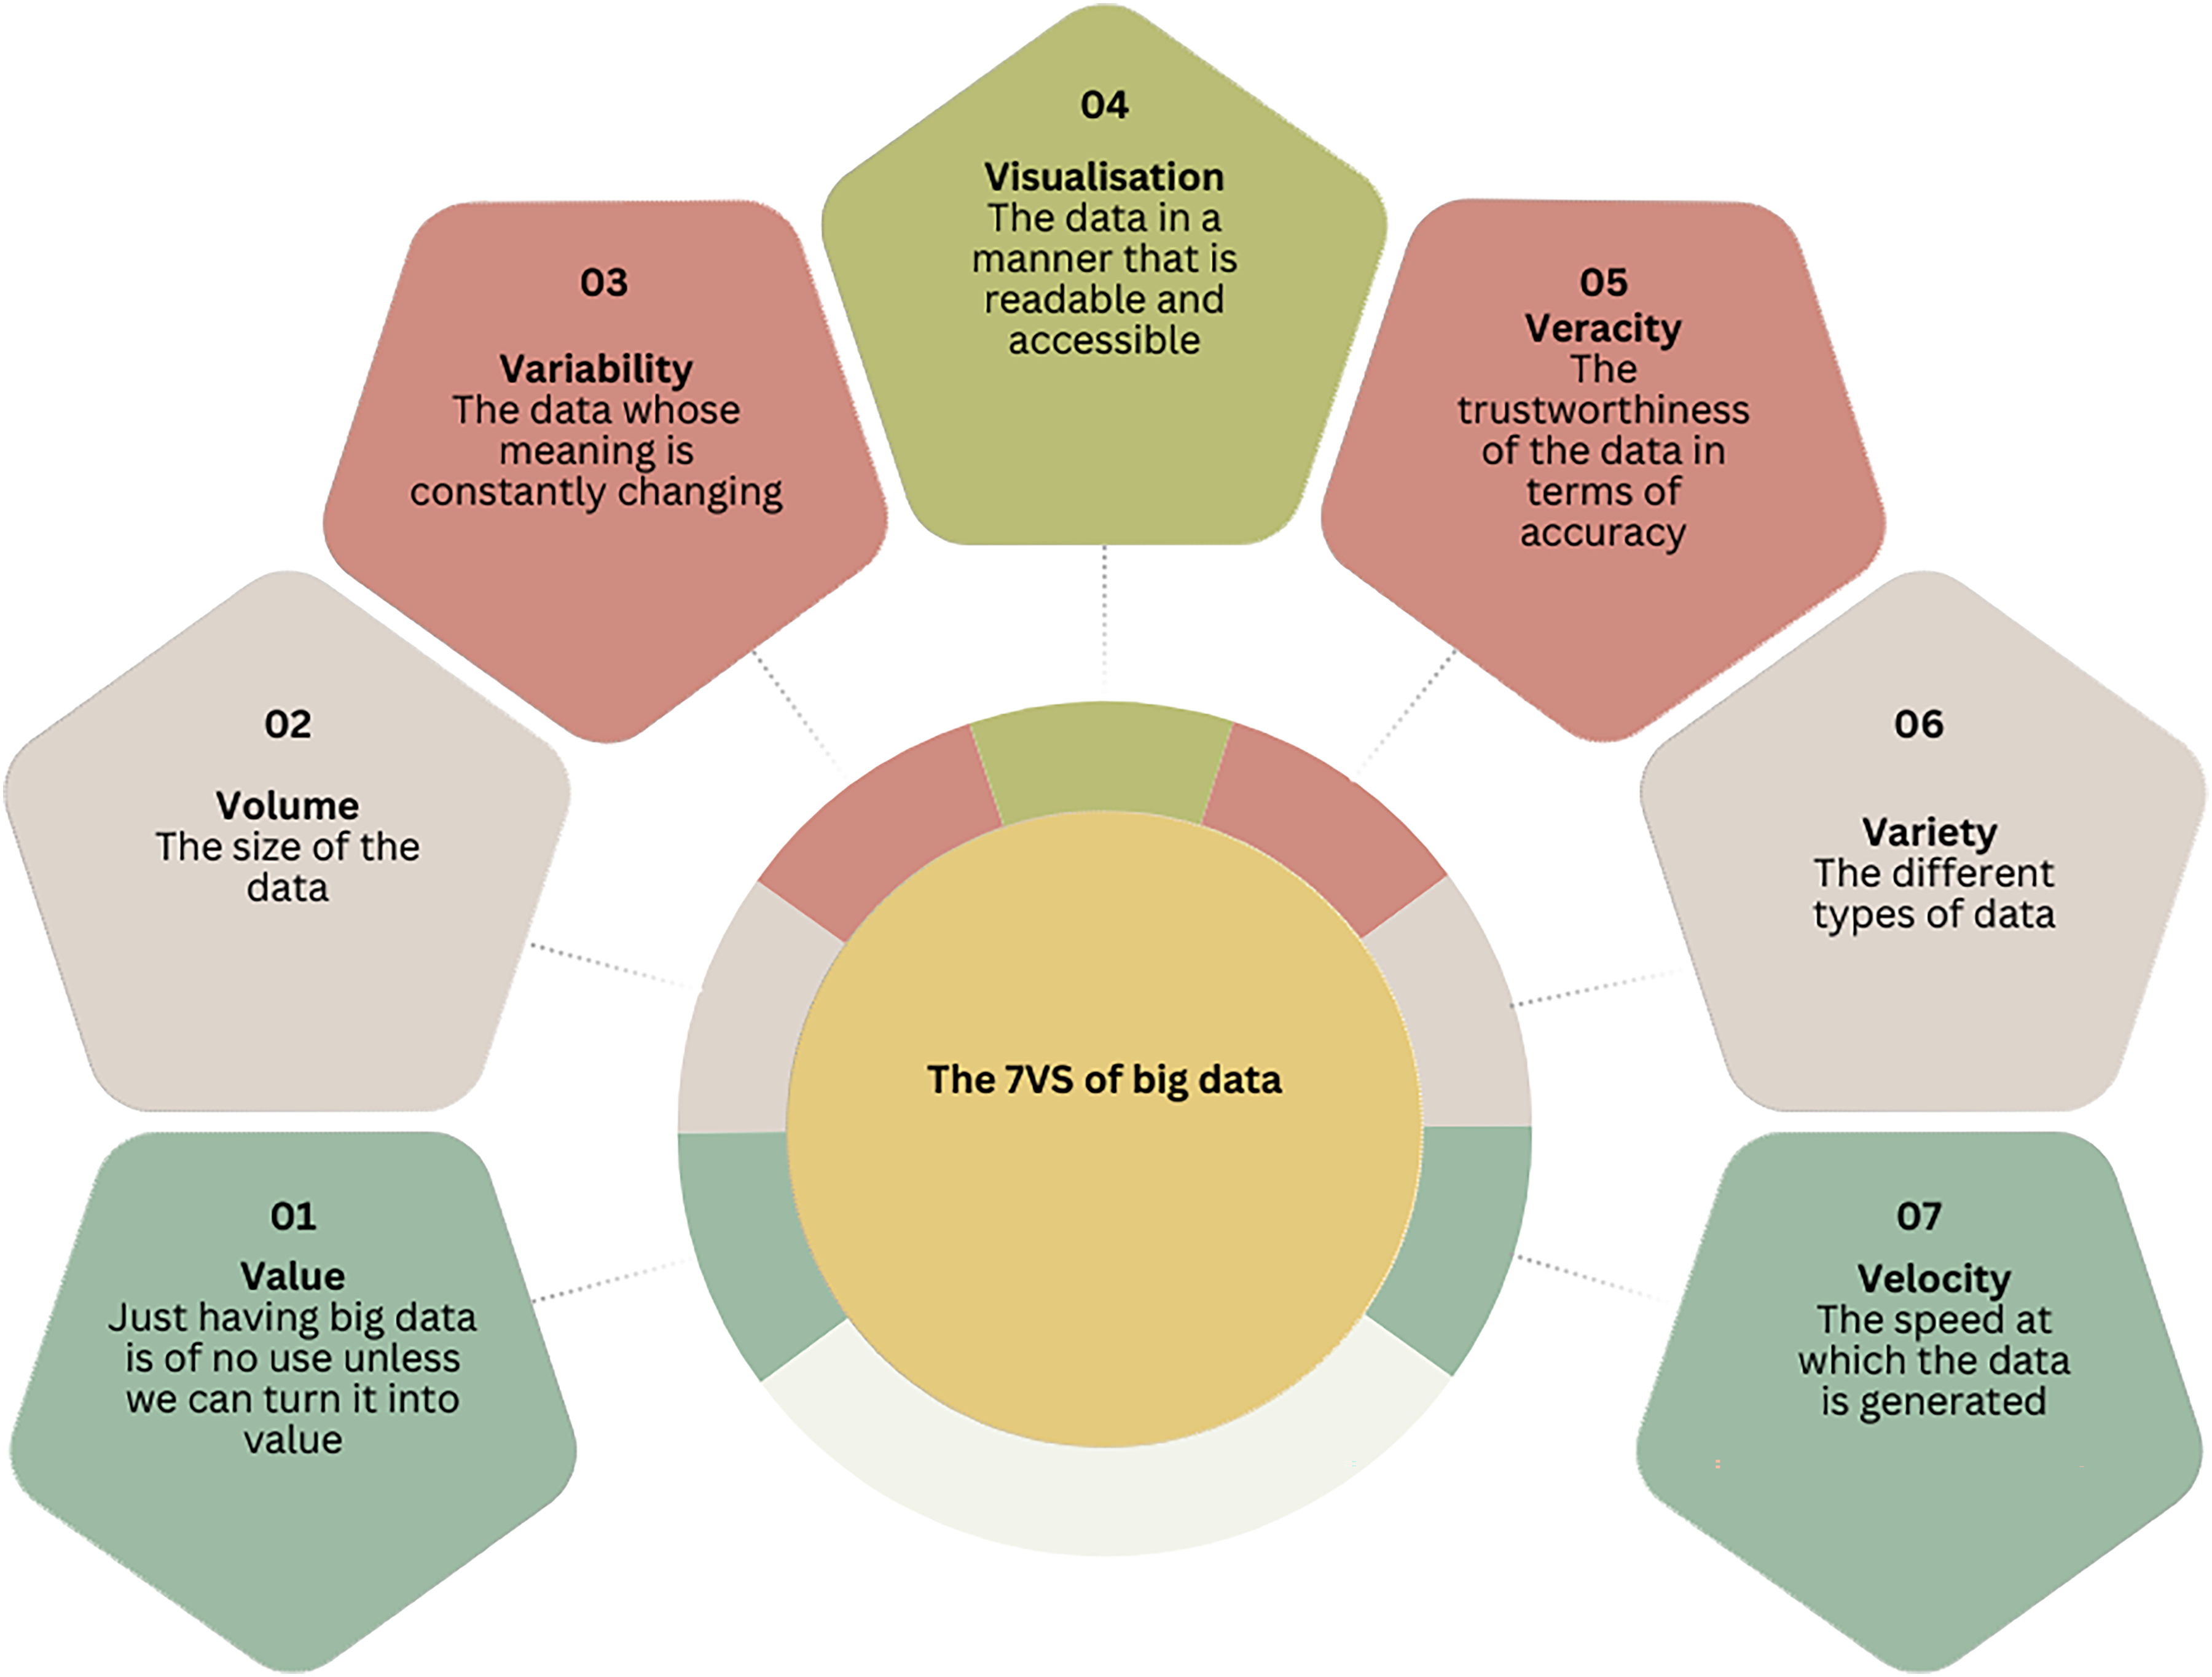
An adapted representation of the 7Vs of big data created by the author, based on Kehal and El Alfy (2021: 125).
Big data is enormous data sets that are complex and unorganised. These enormous data sets are analysed computationally to reveal patterns and trends related to human behaviour and interactions (Kehal and El Alfy, 2021). While various definitions of the term ‘big data’ have been suggested, this study identifies the definitions provided by industrial organisations and academics.
Table 1 presents the concepts of big data and their definitions in the literature, providing an understanding of what big data means for library professionals.
Definitions of big data.
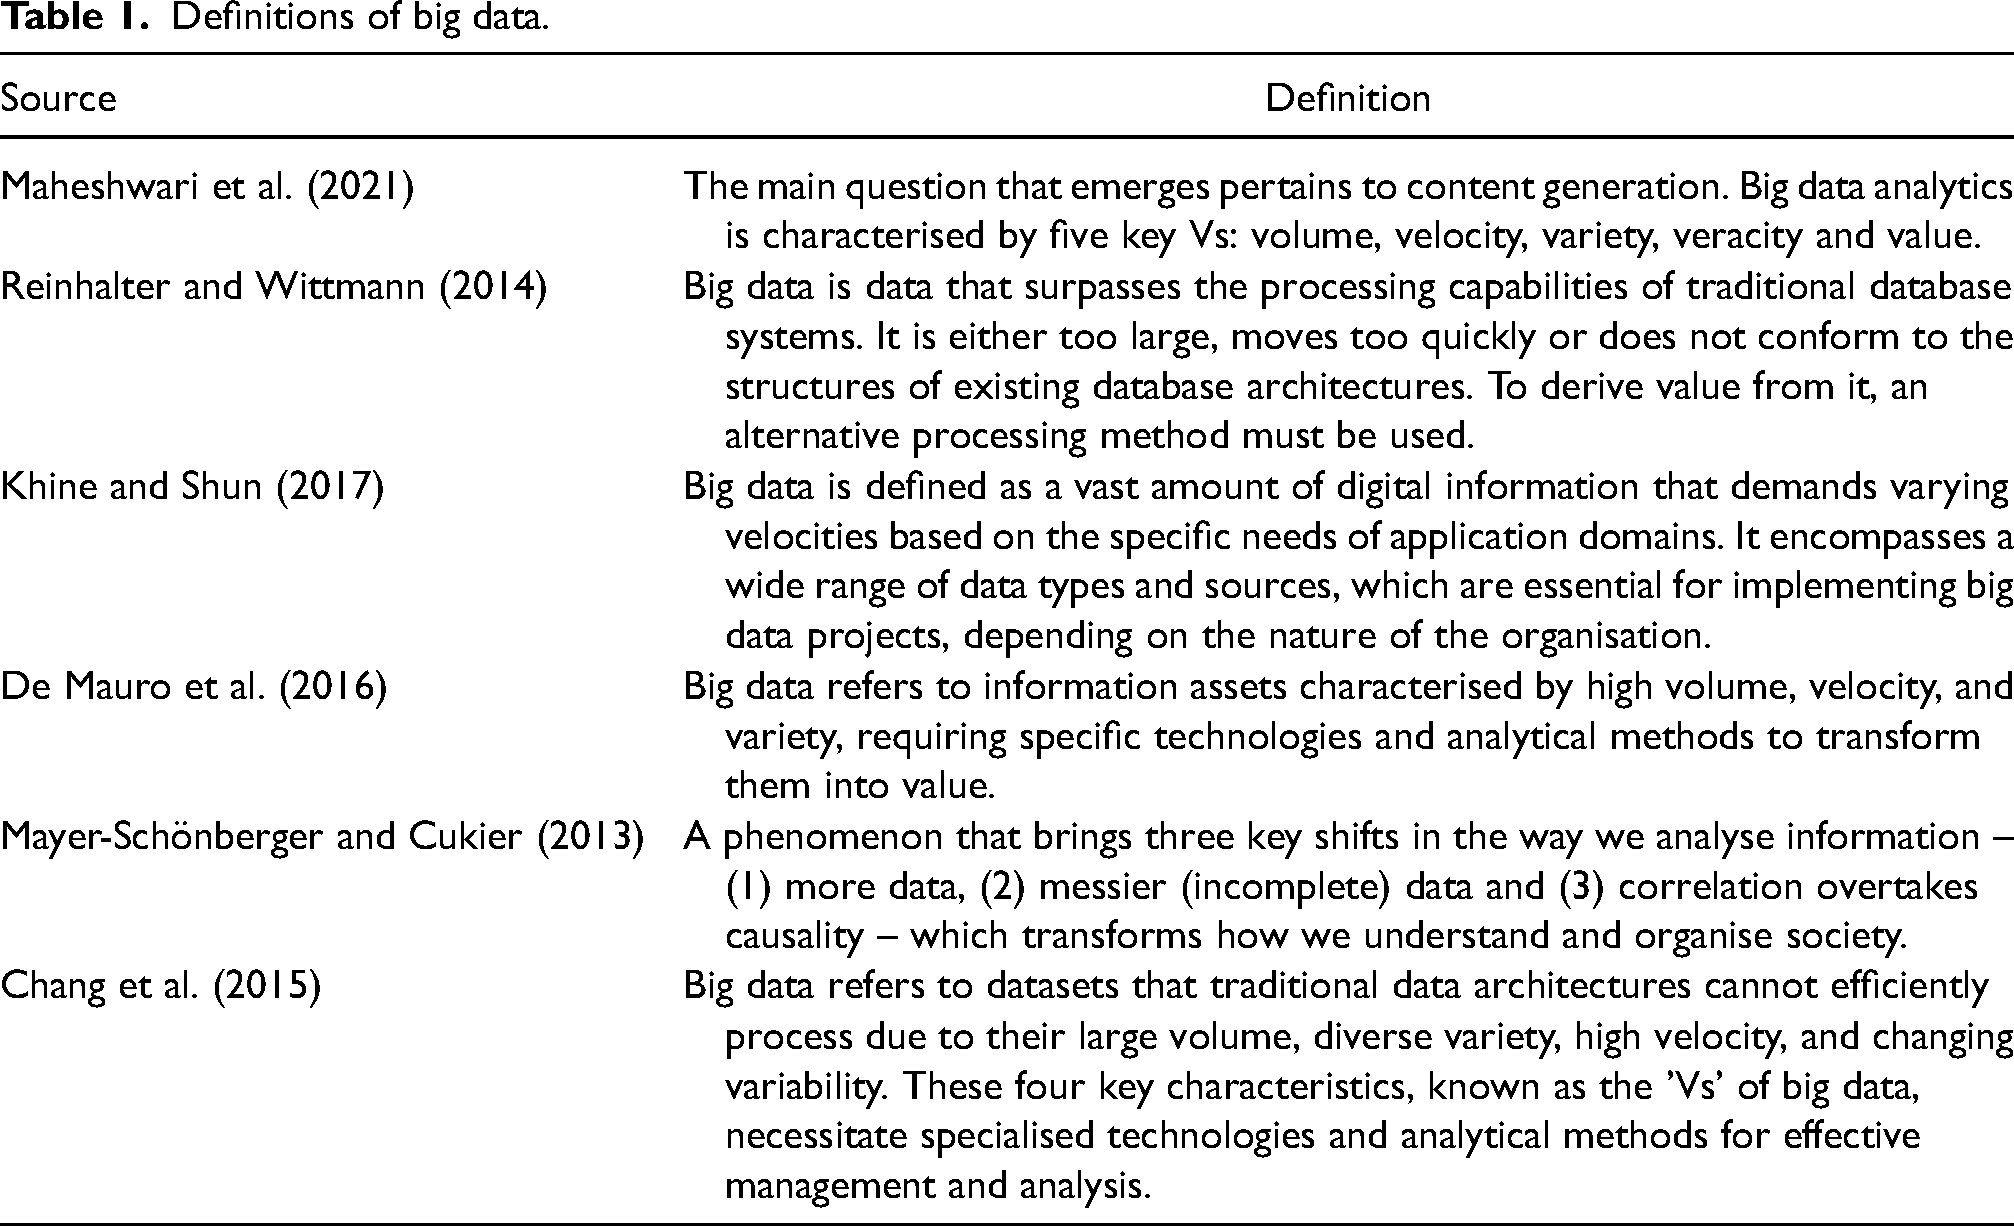
Table 1 shows that organisations are generating significant volumes of data in various formats and at higher speeds than they used to. Such data is referred to as big data. This data can benefit organisations if better insights are drawn for management to improve decision-making. Segooa and Kalema (2018) and Showers (2015) suggest that advanced forms of analytics need to be employed to draw valid insights from big data; such techniques are commonly known as ‘big data analytics’.
Classification of analytics based on application
Figure 2 illustrates the analytics maturity model and the progression of the analytics journey, highlighting key stages in the development of analytics capabilities.
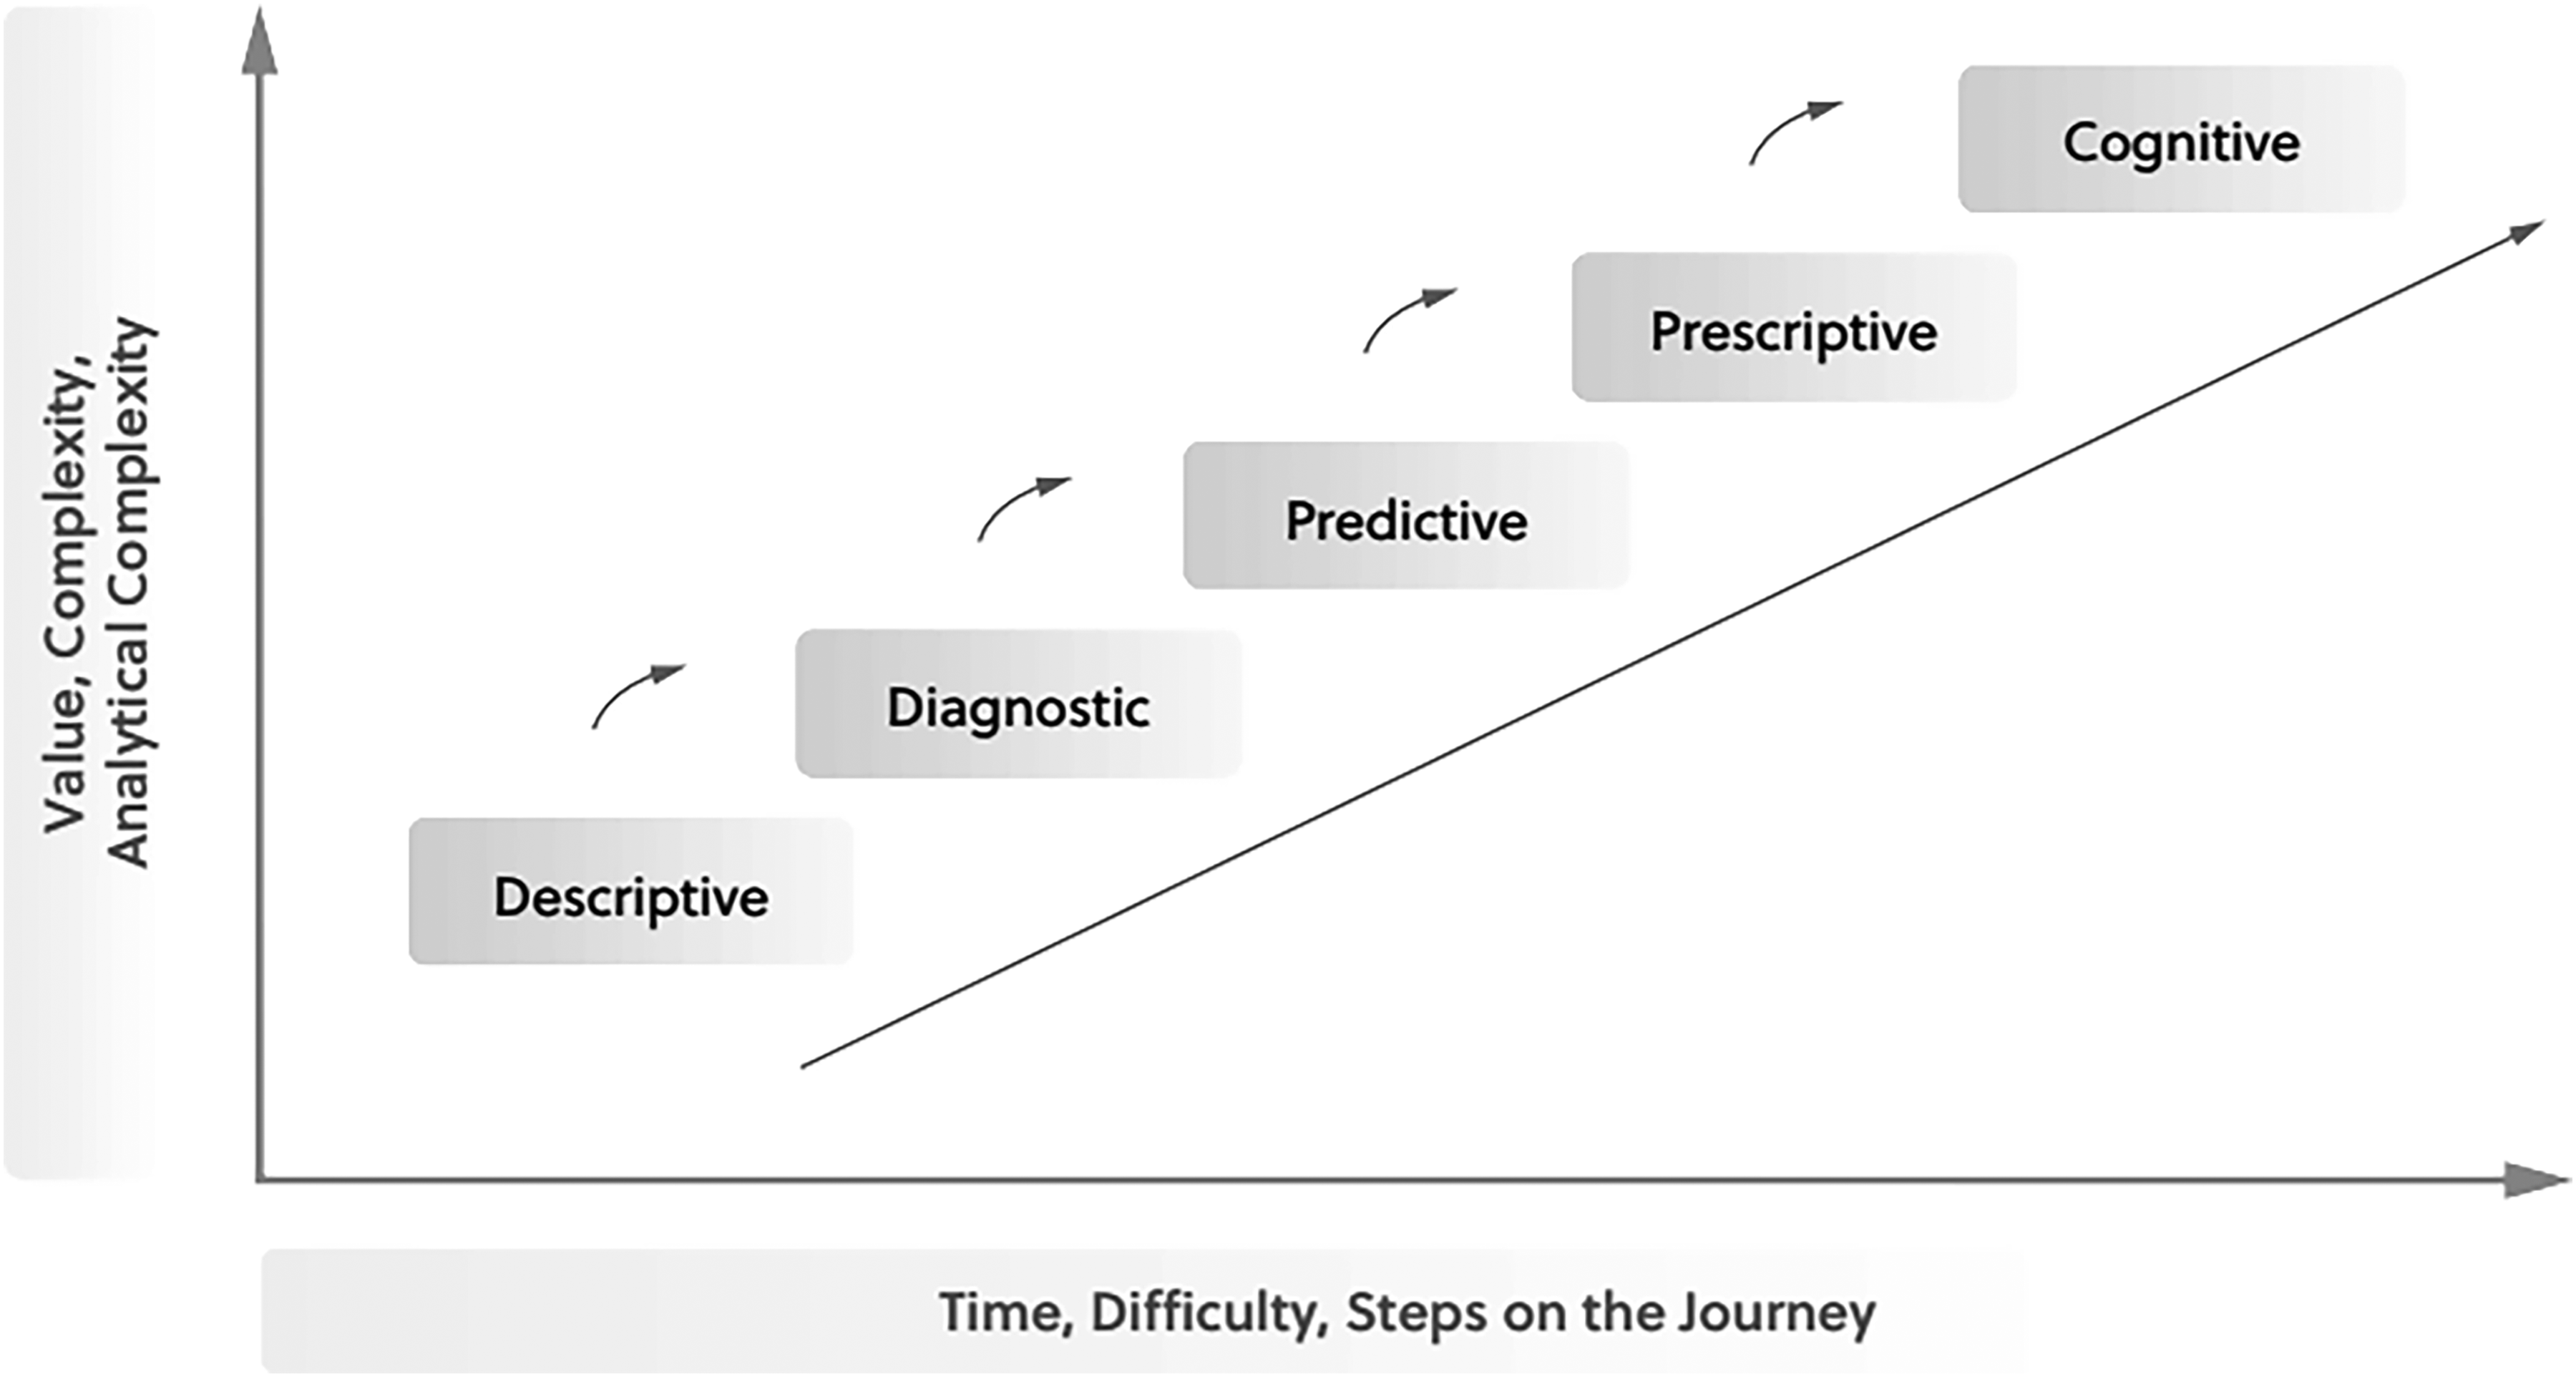
Consolidation of common visual representations of analytics maturity and the progression of the analytics journey.
As stated by Liberatore and Luo (2010), analytics encompasses the methods and techniques employed in logical analysis to convert data into actionable insights, supporting intelligent decision-making and problem-solving within organisations. Over the years, researchers have developed various taxonomies of analytics, particularly in the domain of the Internet of Things (Vashisht et al., 2021). Bertolucci (2013) and Kitchin (2014) identify four broad classes of analytics: descriptive analytics, which is used by over 90% of companies today (e.g. Google Analytics to summarise and analyse historical data); diagnostic analytics, which is part of advanced analytics and answers the question ‘Why did it happen?’; predictive analytics, which aims to predict future events; and prescriptive analytics, which builds on both descriptive and predictive analytics to recommend optimal solutions or decisions.
Bothe et al. (2022) outline five stages of analytics: descriptive analytics, which examines historical data to address the question ‘What happened?’; diagnostic analytics, which investigates the causes of events to answer the question ‘Why did it happen?’; predictive analytics, which forecasts potential future outcomes to answer the question ‘What could happen?’; prescriptive analytics, which suggests optimal actions or solutions to answer the question ‘What should be done?’; and cognitive analytics, which combines the earlier stages into autonomous systems that are capable of self-monitoring, decision-making and action. Cognitive analytics is particularly focused on addressing the question ‘How can we adapt to change?’.
Davenport (2013) notes that Analytics 1.0 represented a time of significant progress in understanding business phenomena and enabling fact-based decision-making. Analytics 2.0 ushered in the era of big data, which necessitates advanced capabilities in text mining, web mining and social network analysis (Chen et al., 2012). Analytics 3.0 emphasises the analysis of unstructured data gathered from mobile devices and sensors (Eggert and Alberts, 2020).
The phenomenon of big data and libraries
Several scholars have explored the rise of big data and analytics as a significant trend within management and information systems literature (De Mauro et al., 2015; Murumba and Micheni, 2017; Sharma et al., 2014; Showers, 2014). As organisations strive to make data-driven decisions, the need for business data analytics has expanded, particularly in the context of self-service analytics. Empirical research identifies big data as a pervasive phenomenon that spans numerous sectors (Chandler et al., 2011; Duan and Xiong, 2015; Murumba and Micheni, 2017; Travis and Ramirez, 2020). However, this concept is rather generic and lacks specificity, especially in today’s world. In addition to its use in business and industry, there is growing recognition of the critical role that librarians play in managing big data, with studies emphasising its value as a vital information asset (Garoufallou and Gaitanou, 2021; Zhan and Widén, 2019). Although much of the literature has focused on the impact of business analytics on organisations (Duan and Xiong, 2015; Kimbrough and Lau, 2018; Matthews et al., 2022; Santiago Rivera and Shanks, 2015; Showers, 2015), there has been limited research on the behavioural intention of organisations to adopt big data analytics.
The study by Tella (2021) on librarians’ perceptions of big data in libraries found that adopting big data and data-driven decision-making could significantly enhance library operations and services. The study recommends that libraries in Nigeria ensure reliable data storage across multiple databases and employ data experts to manage big data effectively. While the study acknowledges the disruptive potential of adopting big data, it does not explore the full extent of its disruptive impact. Specifically, it recognises that such technologies may challenge traditional decision-making practices and values in librarianship, underscoring the need for further research and careful consideration of their broader implications. Further, research by Ahmad et al. (2019) demonstrates a strong connection between the competencies required for librarians to effectively use big data analytics in university libraries. Most of their participants demonstrated a clear understanding of big data analytics. The study reveals that library operations – such as collection management, acquisition, preservation, and curation generate vast amounts of data, which can benefit from the application of data analytics tools.
Despite the growing interest in big data analytics and its potential to revolutionise decision-making in libraries, a critical review of the literature reveals a notable gap in understanding the disruptive impact of big data on traditional library practices. This highlights the need for further research to explore the full implications of big data for librarianship and inform strategies for integrating these technologies effectively into library operations.
Theoretical lens: disruptive innovation and theory
Christensen's (1997) theory of ‘disruptive technology’, introduced in his seminal work The Innovator’s Dilemma, explains how emerging technologies can disrupt established industries by initially offering products or services that are lower in quality but more affordable, accessible or convenient. Over time, these disruptive technologies improve and eventually replace dominant, established technologies. Christensen observes that organisations, even when well managed and customer-focused, often fail to adapt to disruptive innovations because they prioritise sustaining innovations that cater to their existing customer base. He stresses the importance of managers recognising and addressing disruptive technologies early, even if these technologies do not immediately align with current market demands.
In the context of libraries, this theory is particularly relevant for understanding how big data analytics may initially seem inefficient or unnecessary compared to traditional library practices. However, the potential of big data analytics for improving efficiency, decision-making and service delivery could disrupt traditional librarianship by offering new ways to manage data, predict user needs and enhance library services. While disruptive technologies often start out with limitations compared to established systems, they can lead to significant advances in areas such as cost reduction and operational efficiency, ultimately transforming the landscape of librarianship. Christensen’s framework, often referred to as ‘disruptive innovation’, provides insight into how libraries can either embrace or be overtaken by new technologies such as big data analytics, making it a valuable lens through which to analyse the impact of these technologies on the profession.
From disruptive technology to disruptive innovation
Christensen (2013) later changed the term ‘disruptive technology’ to ‘disruptive innovation’, reasoning that disruption is not an inherent component of a technology but emerges through practice. Therefore, this study uses the term ‘disruptive innovation’ as the research is mainly interested in emerging technology that continues to evolve and can meet librarianship demands.
In the Innovator's Dilemma, Christensen (1997) identifies three fundamentals of disruption (see Figure 3). First, customers can achieve a certain degree of improvement in every market, as represented by the dotted line in Figure 3. Second, innovating companies offer a notably different line of improvement in every market as they introduce new and improved products. The sharply rising solid lines in Figure 3 show that this technological development is progressing faster than customers' ability to use it, regardless of the market level. This occurs because companies keep striving to make better products. The third critical component of the model is the distinction between sustaining innovations and disruptive innovations.
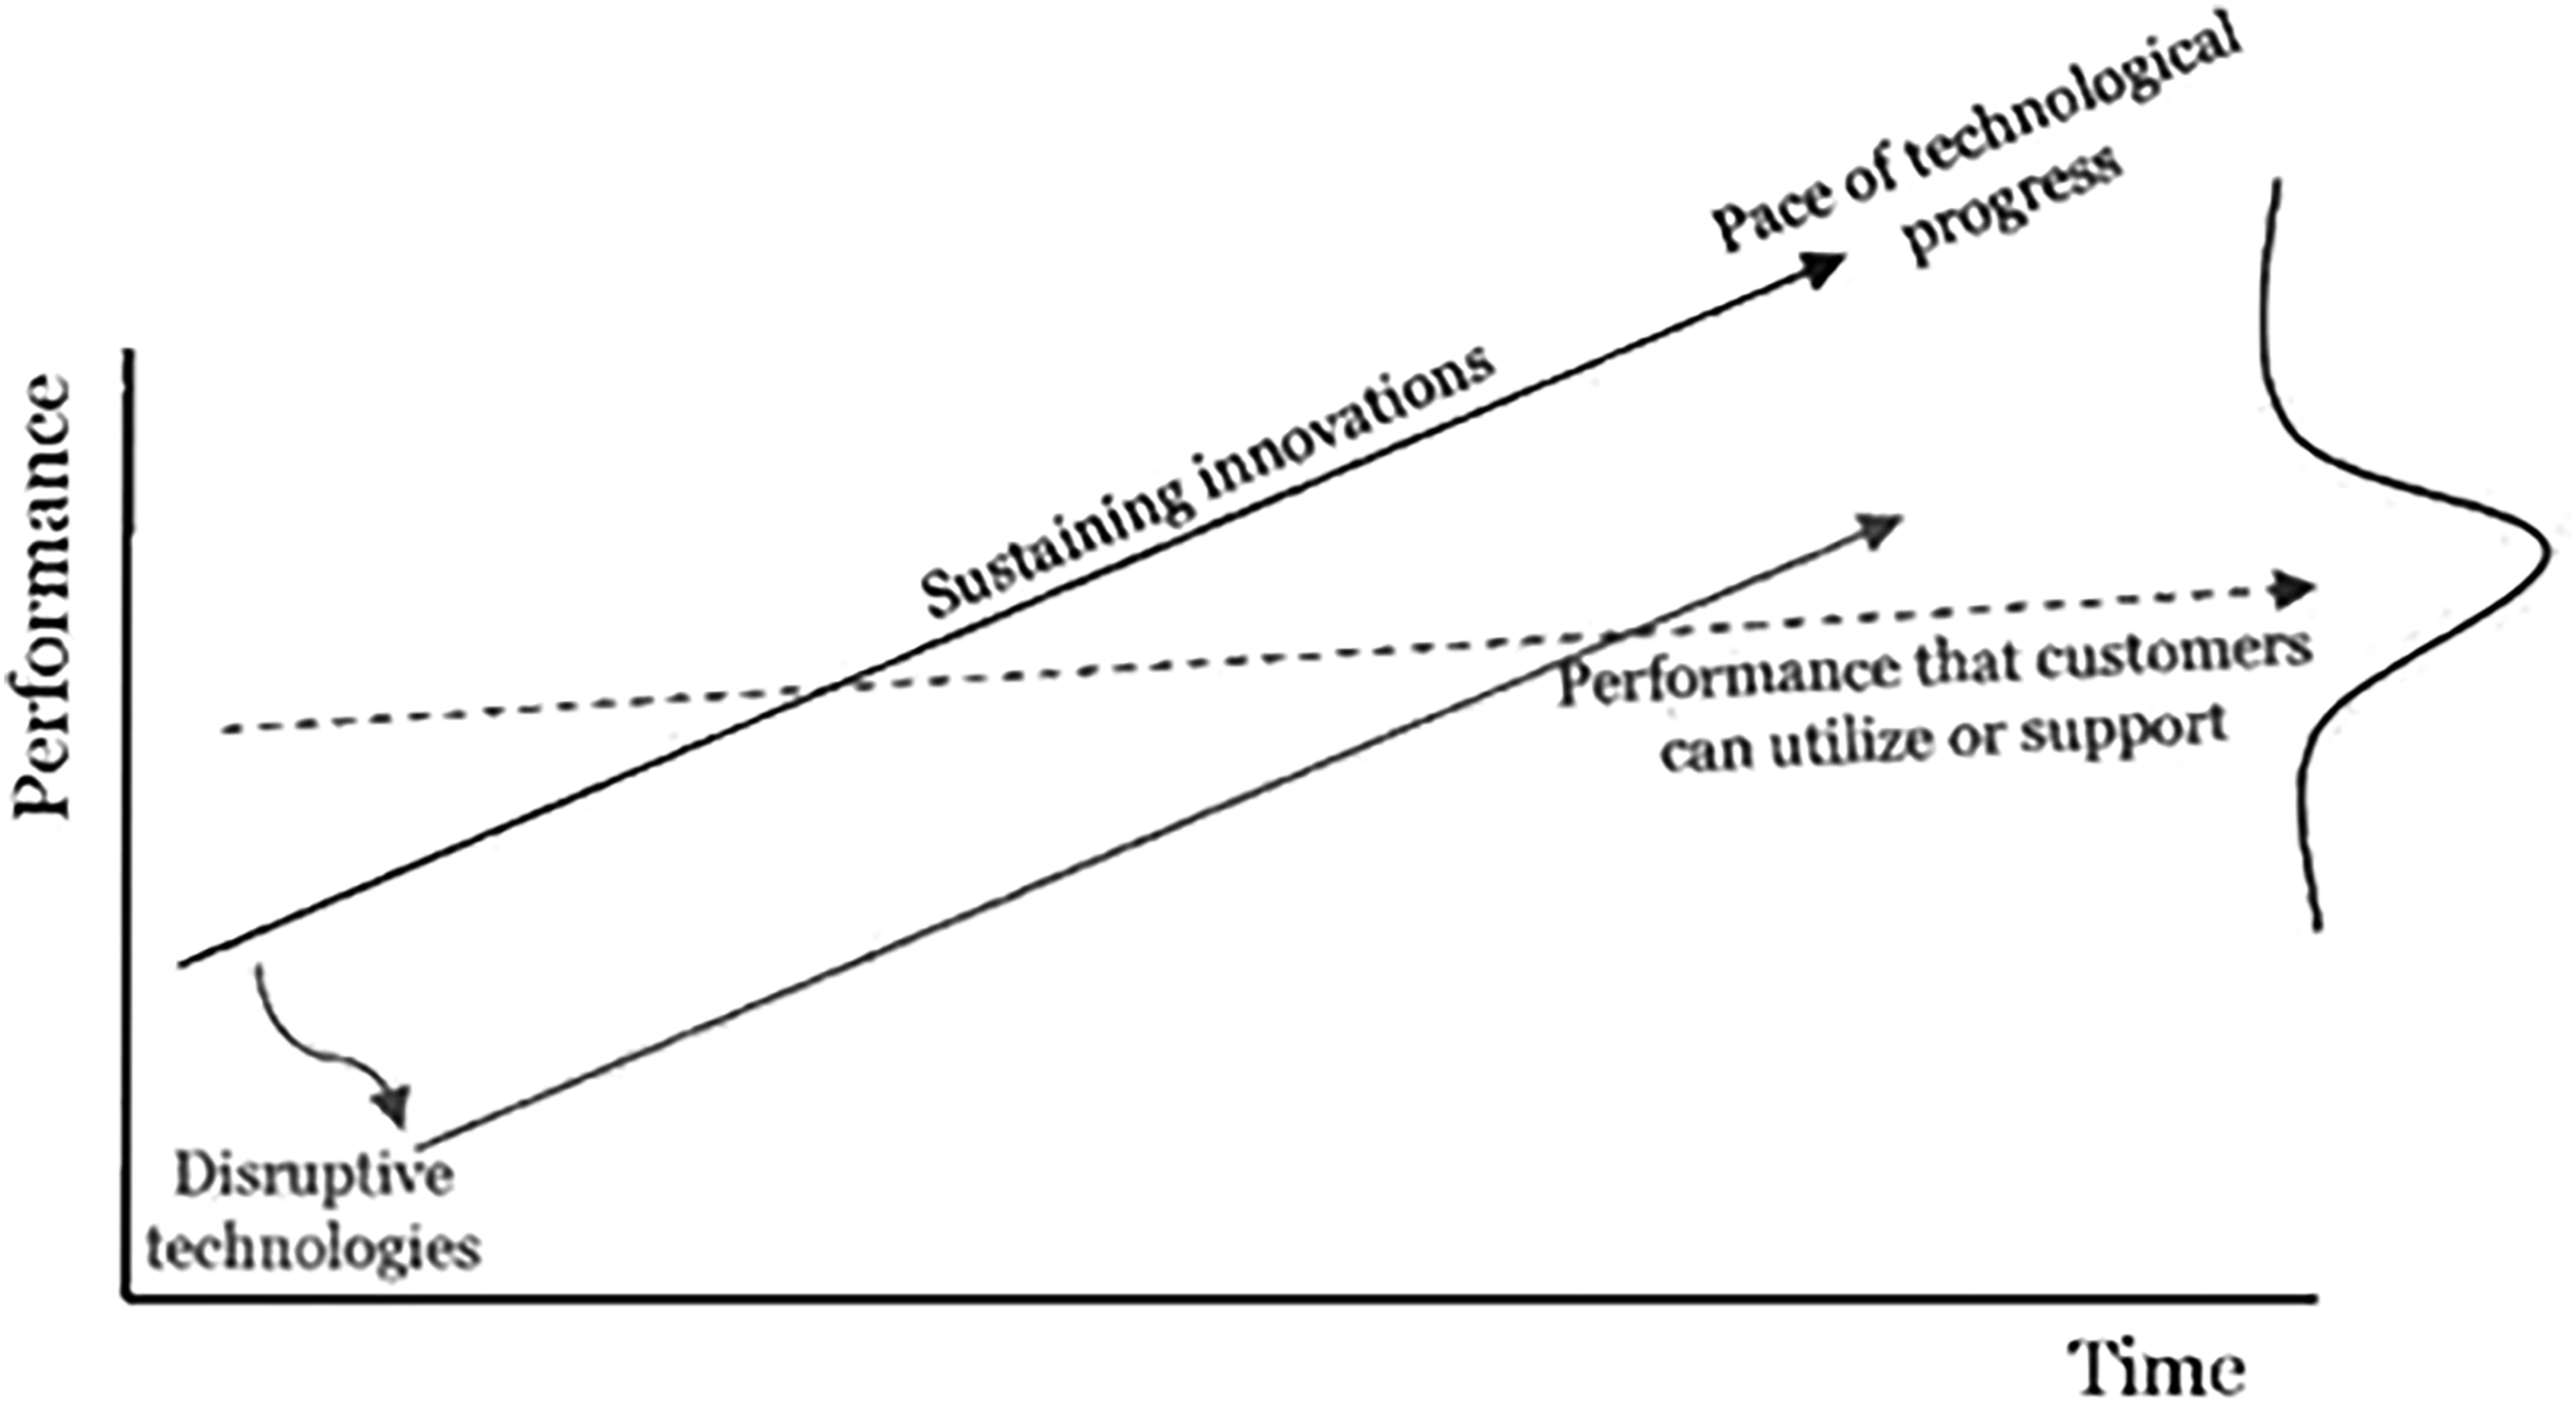
The theory of disruptive innovation.
Christensen's (1997) theory of disruptive innovation explains that technologies evolve over four stages: performance, reliability, convenience and price. Initially, new technologies offer advanced features, which is followed by increased reliability and customer acceptance. Over time, they become more widely adopted, and competition shifts to price. Big data analytics, still in its early stages, is developing and gaining acceptance in sectors such as university libraries, which may follow this progression.
Christensen's (1997) theory suggests that new technologies, even if initially inferior, can challenge dominant technologies, leading to changes in organisational practices. This study applies the theory of disruptive innovation to explore how the adoption of big data analytics in university libraries is transforming decision-making practices, challenging traditional methods and potentially displacing established technologies, ultimately reshaping the role of university libraries.
The theory of disruptive innovation and the study’s propositions
Figure 4 presents a framework linking the theory of disruptive innovation to the study's propositions, offering a conceptual model for understanding the relationship between these elements.
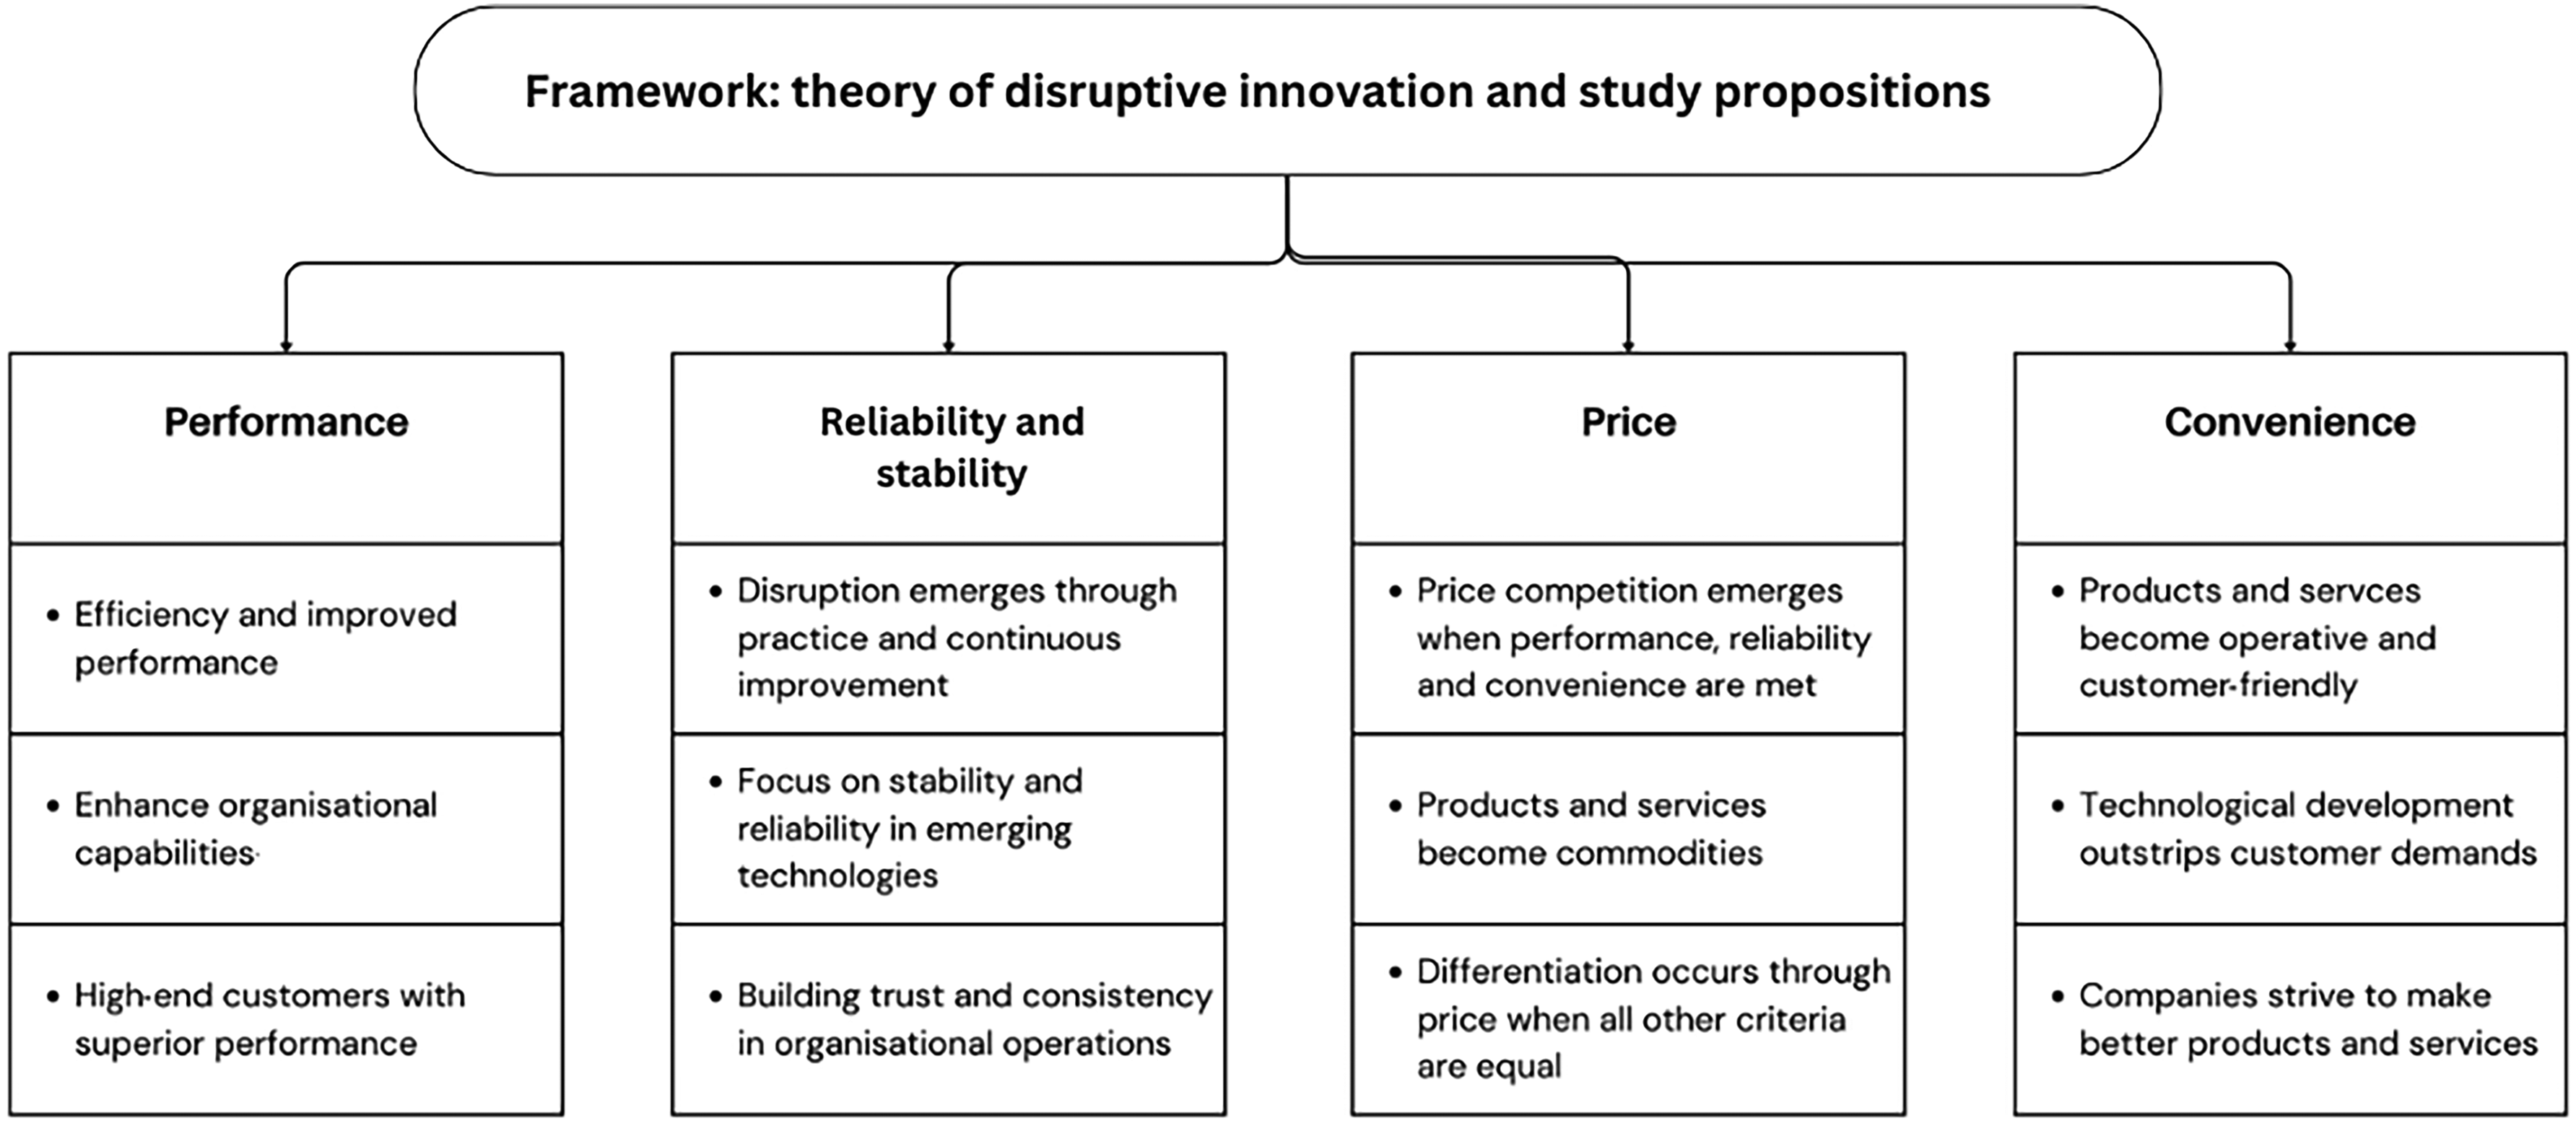
Framework linking the theory of disruptive innovation and the study’s propositions.
The identification of disruptive technologies is a crucial task for managers, but it can be a challenging one. Fortunately, Christensen's (1997) framework offers a valuable approach for managers to identify potentially disruptive technologies. By plotting the trajectory of performance improvement demanded by the market against the performance improvement supplied by a technology, managers can gain insights into a technology's disruptive potential. In the context of big data analytics in university libraries, this framework is particularly useful. By examining the four steps outlined by Christensen (1997) – performance, reliability, convenience and price – this study aims to investigate how big data analytics impacts university libraries as a disruptive technology. Based on this framework, the following four propositions are made:
Performance: the adoption of big data analytics in university libraries significantly enhances the efficiency and effectiveness of library operations, leading to improved decision-making.
Reliability and stability: big data analytics ensures consistent and accurate decision-making in libraries by providing data-driven insights, reducing the reliance on anecdotal evidence and intuition.
Convenience: the implementation of big data analytics in university libraries substantially improves the user experience and accessibility of library resources, enabling personalised recommendations, streamlined access and enhanced discovery.
Price: the cost of adopting big data analytics in university libraries is offset by significant long-term benefits, including reduced operational costs, improved resource utilisation and enhanced student outcomes, resulting in a positive return on investment.
These propositions provide a framework for investigating the impact of big data analytics on librarianship decision-making practices and its potential as a disruptive innovation in university libraries.
Research methodology
This study employed an exploratory and interpretive approach, utilising a qualitative design to examine the impact of big data analytics tools as disruptive technologies in modern decision-making practices within Australian university libraries. Adhering to established qualitative interview protocols, the study ensured rigorous data collection and analysis, providing a robust framework for investigating this emerging phenomenon. A qualitative single-case-study approach with a multiple-site paradigm was employed to explore the research questions, aligning with the findings of previous studies (Erlingsson and Brysiewicz, 2013; Grimes and Warschauer, 2010).
This approach is well suited for exploratory research, textual analysis and understanding complex human interactions. The study sought to gain a deeper insight into the participants’ experiences and perspectives regarding the impact of big data analytics tools on their decision-making processes. To achieve this, a qualitative framework was adopted, ensuring that the participants’ viewpoints were accurately reflected while providing a well-founded justification and interpretive perspective. As an exploratory study focused on university libraries, this research employed qualitative methods within multiple data collection paradigms to address the research questions, drawing on established methodologies (Beck and Manuel, 2008; Gorman, 2005). The qualitative approach was chosen for its flexibility, adaptability and ability to align with the service-oriented nature of libraries, making it an ideal choice for this study (Corbin, 1990).
The researcher planned to conduct in-depth interviews with university library staff to explore whether big data analytics qualifies as a disruptive technology in university libraries. Given this approach, a qualitative method using interviews was deemed appropriate for the study. The study employed purposive sampling to select participants who could provide valuable insights, consistent with Yin's (2015) approach. Although there is no universal agreement on ideal sample sizes in qualitative research, the concept of saturation guided the sample selection process (Morse, 2015). Patton (2014) recommends determining minimum sample sizes based on the research objectives and interests of stakeholders, emphasising the importance of clear justification and parameters to identify potential gaps. In contrast to quantitative research, which often relies on broader random sampling, qualitative research generally utilises purposive and selective sampling methods (Merriam and Tisdell, 2015).
Data collection
The first objective of this study was to examine the impact of big data analytics tools as disruptive technologies in contemporary decision-making practices within university libraries in Australia. The aim was to apply the theory of disruptive technology to gain a deeper understanding of whether big data analytics tools function as disruptive technologies that influence decision-making practices in librarianship. The study began by analysing the organisation and participant profiles, gathering demographic information from the participants. Australian university libraries were categorised based on factors such as their size, location, study modes, supported programs, research intensity, collections, organisational structures, and partnerships with other educational institutions and industries.
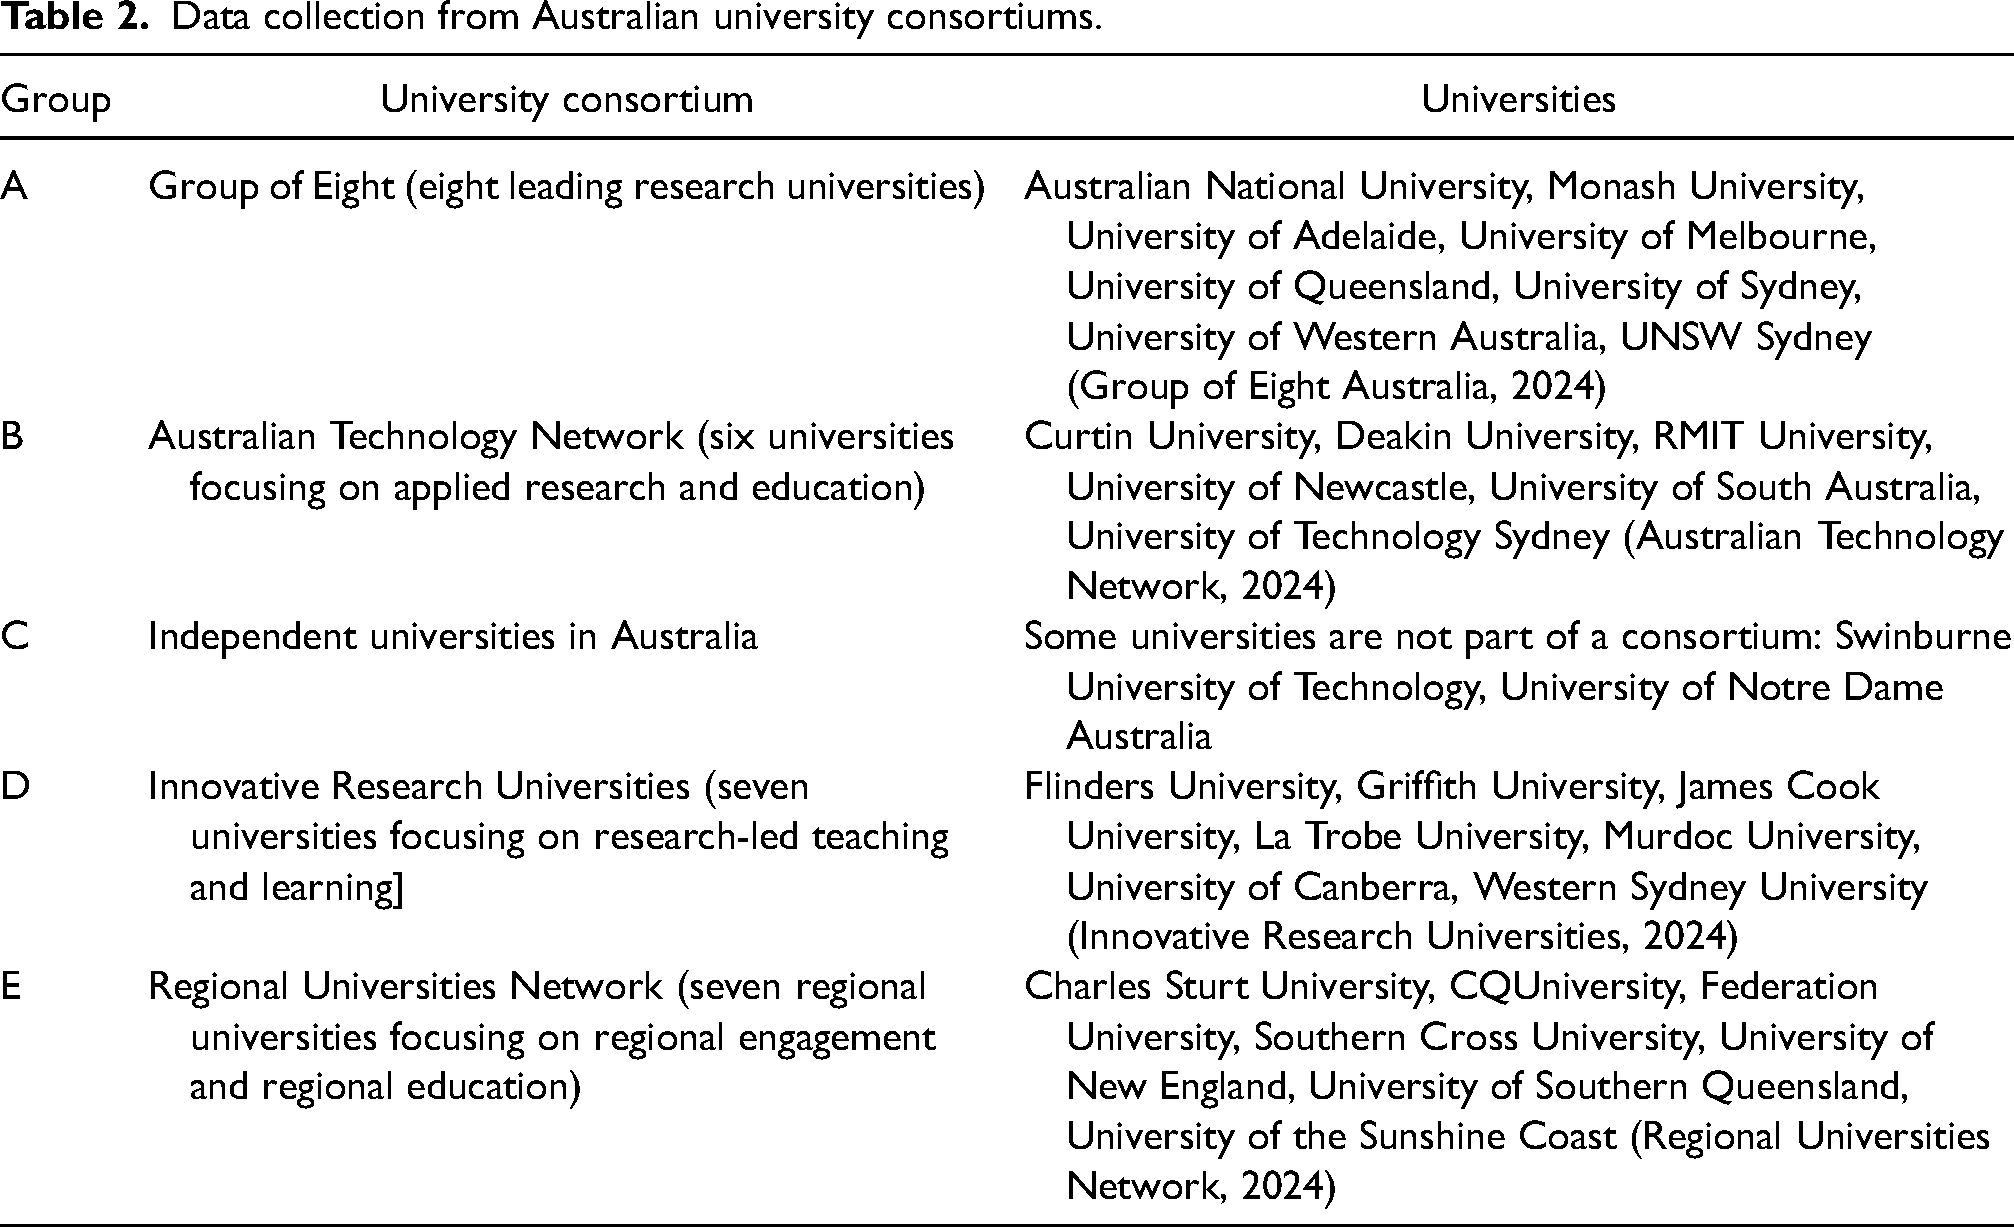
Four categories of universities were identified based on their official consortium groupings as outlined on their websites (Croucher and Woelert, 2022). However, it was discovered that several universities were not part of any consortium, and these were classified as independent and referred to as Group C. As a result, the study includes five types of university groups (see Table 2, Figure 5).
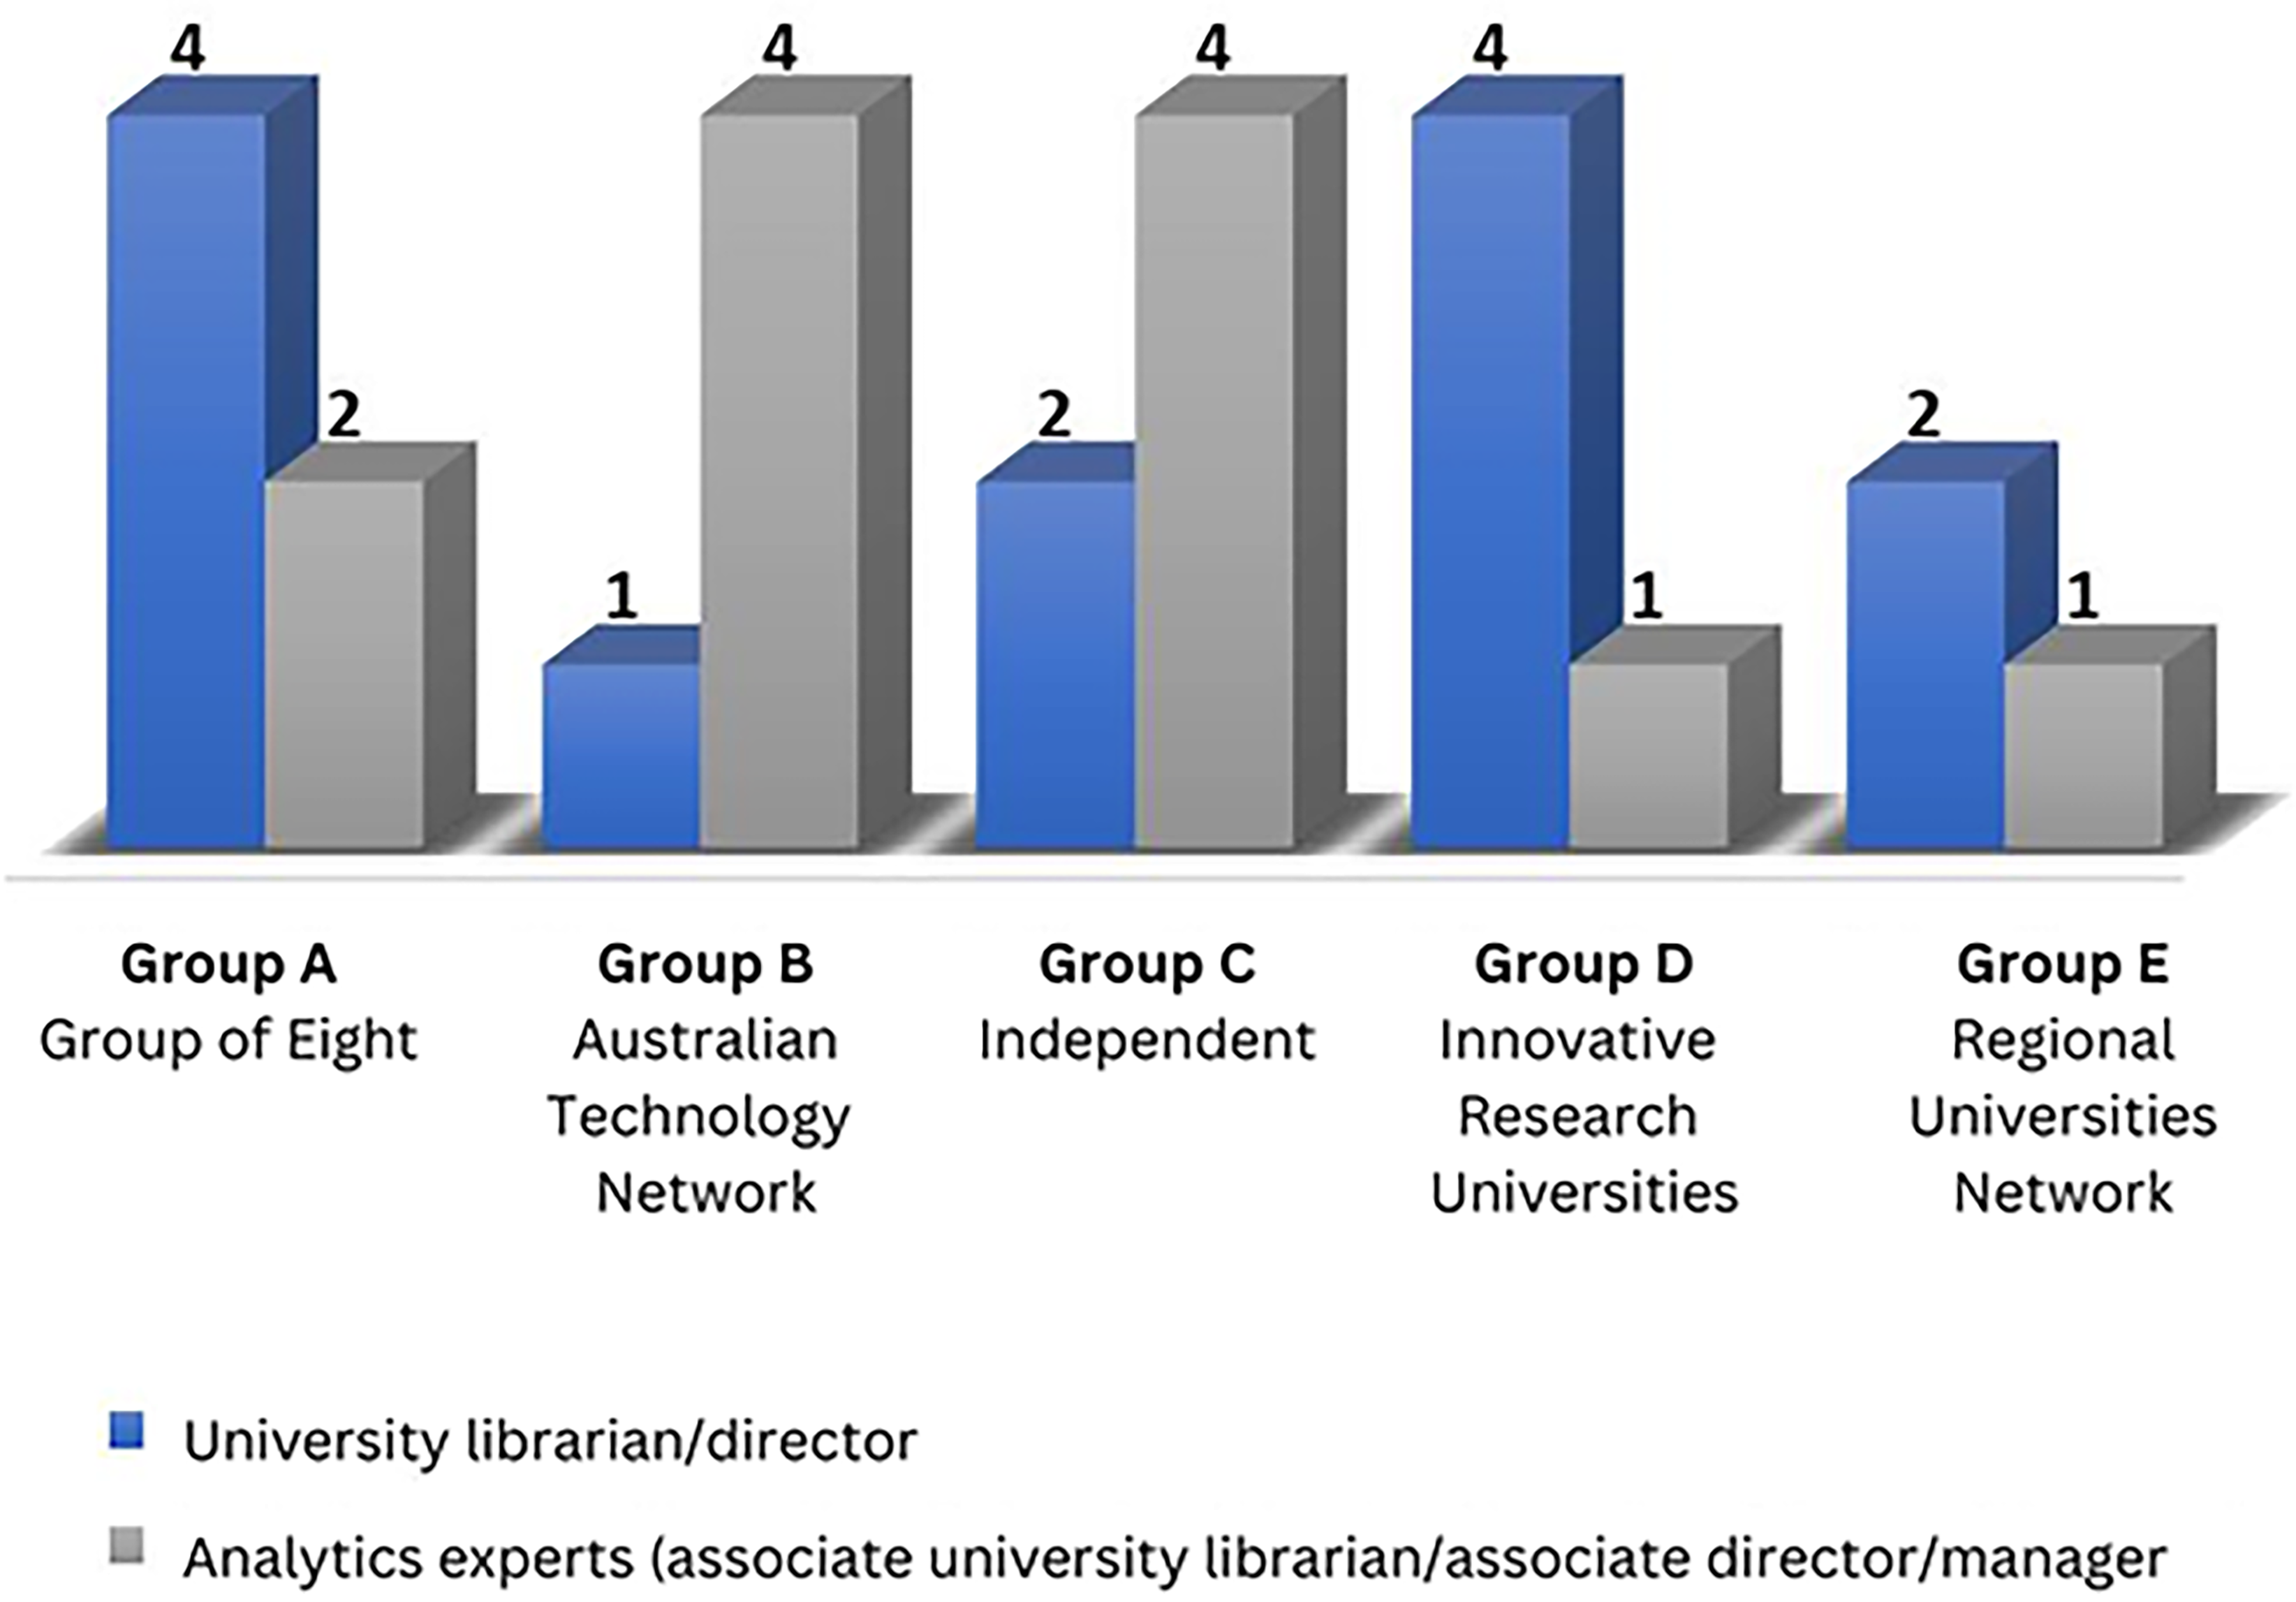
Data collection source by university group.
Data collection from Australian university consortiums.
Population and sample size
The study validated its sample size by conducting 20 interviews across 16 university libraries, involving a total of 25 participants (see Figure 5, Table 2). With 43 university libraries in Australia, the selection process included a diverse range of institutions, aligning with Bhattacherjee's (2012) recommendation to select varied case sites to support generalised inferences. The participants were chosen using convenience sampling based on their accessibility and willingness to participate. The sample size was further justified through a purposive approach, ensuring data collection from a representative range of university libraries across Australia while leveraging convenience sampling to identify participants.
Semi-structured interviews with university librarians
In-depth qualitative interviews are widely recognised as an effective method for comprehensive case study research (Wahyuni, 2012; Yin, 2018). This study employed semi-structured interviews with senior and middle managers from university libraries across Australia. The contact information of the university librarians was accessed via the publicly available database on the Council of Australian University Librarians website. Using this resource, the researcher collected the email addresses of university librarians to arrange interviews with senior library staff or their designated representatives. This approach facilitated the gathering of valuable insights from key decision-makers about the analytical tools and information utilised within library operations.
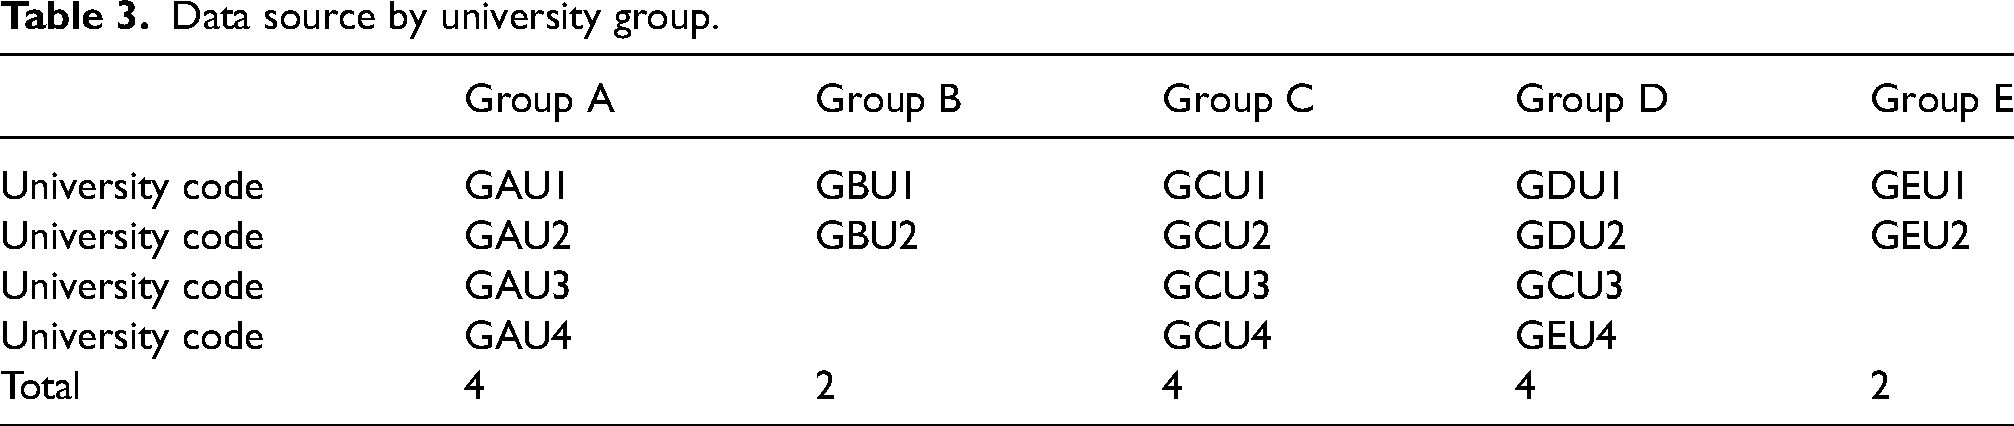
Following Drever’s (1995) recommendations, semi-structured interviews were used to encourage the participants to express their thoughts and experiences freely, yielding detailed and nuanced responses. The flexible nature of this method proved effective in capturing in-depth data from a specific group of participants. The interviews featured open-ended questions, focusing on the adoption and application of big data analytics in library practices, its overall impact and its influence on decision-making processes. Table 3 presents data categorised by university group, showing how different institutions utilise data analytics in their libraries. The university codes used in the table represent distinct university groups, which have been assigned to ensure confidentiality and facilitate comparison across various categories. An example for clarity, the university codes are defined as follows: GAU1 represents a group of 8 universities, and GBU1 represents a Group B university, which is part of the Australian Technology Network.
Data source by university group.
Semi-structured interviews with university library analytics experts
Qualitative research often incorporates various sampling methods, including purposive and snowball sampling, to recruit participants (Bryman, 2016). After conducting initial exploratory interviews, the researcher adopted a targeted sampling approach by asking the participants to recommend colleagues with expertise in using analytical tools within their university libraries. This process facilitated an in-depth follow-up interview with a library professional, providing detailed insights into their daily practices and experiences with analytics.
The primary aim was to understand how librarians leverage analytics to support their decision-making and enhance their professional activities. The expert participants were specifically asked to discuss their experiences with analytical tools, the skills they had developed, and the transformative impact of big data analytics on their library’s operations and services. This approach enabled the study to capture nuanced perspectives on the practical applications, benefits, challenges and issues surrounding big data analytics, as well as its impact on decision-making within the library context.
Thematic analysis
The study utilised thematic analysis to interpret the qualitative data and address the research questions, drawing on a wide range of evidence-based insights from the expert participants. Thematic analysis is a thorough approach for identifying, examining and interpreting significant patterns in qualitative data (Willig et al., 2017). It involves encoding and analysing qualitative information to uncover underlying themes (Boyatzis, 1998; Richards, 2014). By applying thematic analysis, the study aimed to discern trends and patterns in the data, shedding light on the participants’ perceptions, views and experiences with the application of big data analytics. The study utilised NVivo 12 Plus, a software tool for qualitative data management, to facilitate the coding and thematic analysis of the interview data (Zamawe, 2015). Leveraging NVivo’s capabilities, the researcher efficiently organised, analysed and interpreted the data, identifying patterns and themes that emerged from the participants’ responses. NVivo’s features enabled a systematic and rigorous approach to the data analysis, enhancing the study’s validity and reliability.
The analysis of the primary data involved iterative engagement with the data, pairing it with conceptual themes until each theme coalesced into a unified concept (Massey et al., 2014). Through repeated reading and rereading of the transcripts, the researcher identified recurring sense trends, facilitating the recognition of emerging themes. This meticulous process ensured a comprehensive understanding of the data, yielding rich insights into the research questions.
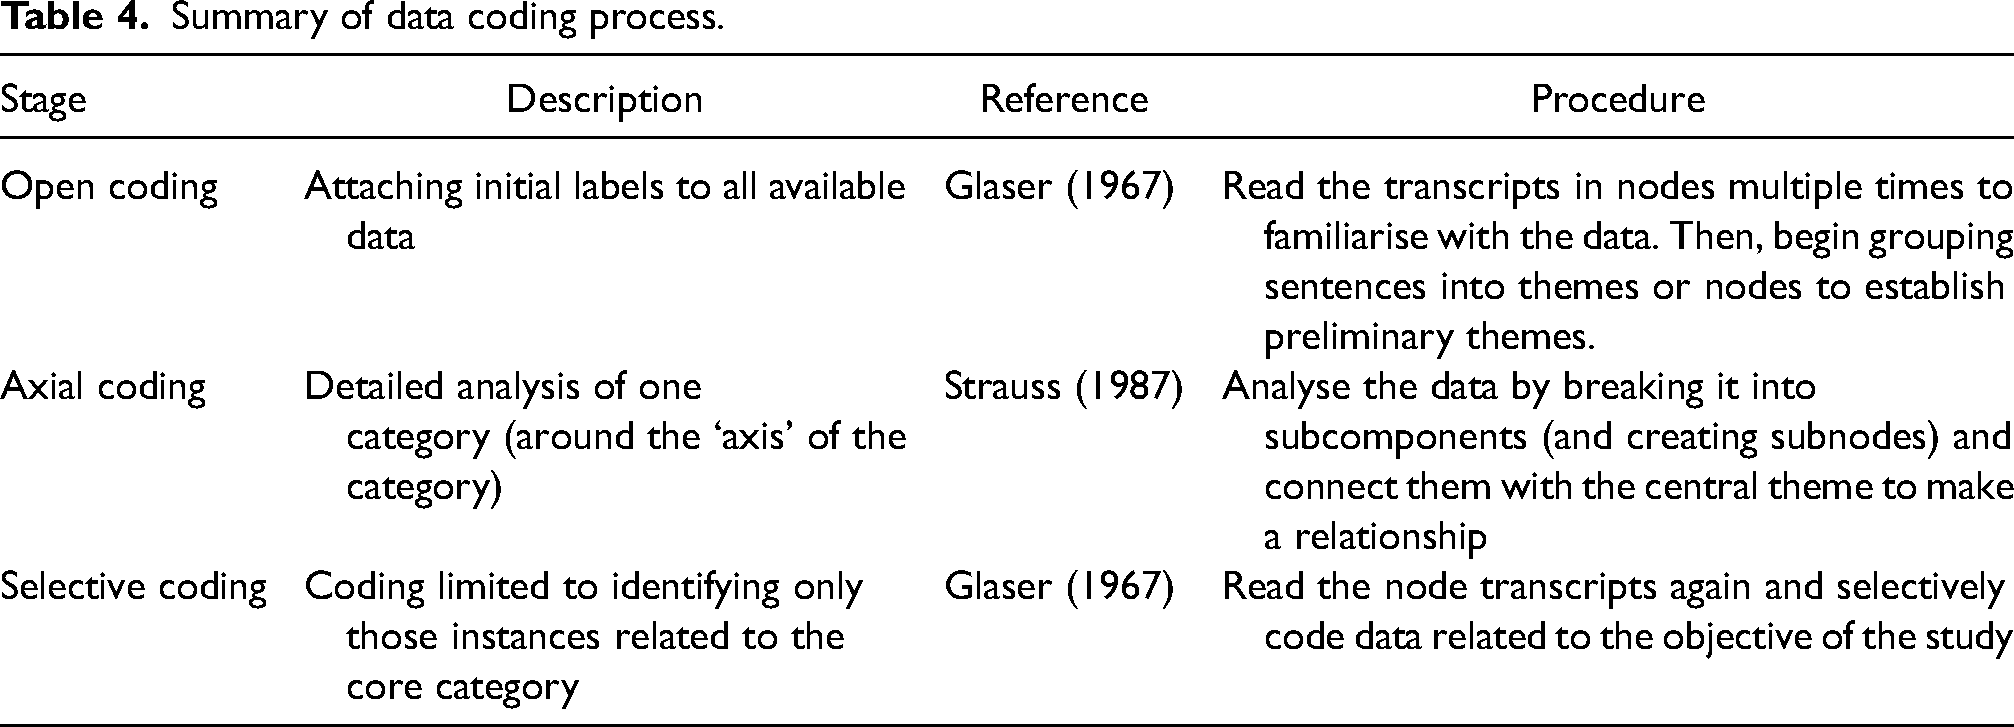
During the data analysis process, the researcher employed a rigorous coding methodology, detecting and labelling the meaning units’ words and sentences with comparable meanings within each participant’s transcript. By applying Corbin’s (1990) three-stage coding framework, open coding, axial coding and selective coding were used to distil the data into cohesive themes (see Table 4). This multi-stage coding approach ensured a comprehensive and nuanced understanding of the data.
Summary of data coding process.
Results
A key objective of this study was to examine the transformative impact of data analytics as a disruptive innovation within librarianship practices in Australian university libraries. The following sections provide an in-depth discussion of the findings, offering a comprehensive analysis of the results. This includes a detailed exploration of the data, highlighting the key themes, trends and insights that emerged through the research.
Performance: the adoption of big data analytics in university libraries significantly enhances the efficiency and effectiveness of library operations, leading to improved decision-making
To evaluate the participants’ perceptions of the impact of big data analytics on performance, they were asked: ‘Do you believe that adopting analytics in librarianship practice improves performance, such as decision-making?’. This question aimed to elicit the participants’ opinions on the effectiveness of analytics in enhancing decision-making processes and overall performance in librarianship practice. The responses provided valuable insights into the transformative potential of analytics in this context. Most of the participants from Group A (Group of Eight), Group B (Australian Technology Network), Group C (independent universities), Group D (Innovative Research Universities) and Group E (Regional Universities Network) confirmed that analytics improves performance within the library domain in decision-making. The participants’ statements universally support the proposition that ‘The adoption of data analytics in university libraries is a disruptive innovation that transforms librarianship decision-making practices’. There follow some examples.
Data-driven decision-making
The participants highlighted the critical role of data analytics in guiding decision-making, with statements such as: ‘We use usage data as a basis for collection development decisions’ (GAU2) and ‘We base most of our decisions on data’ (GAU1). This statement underscores the transformative impact of analytics in shaping decision-making processes within librarianship, empowering libraries to tailor their services more effectively to meet the evolving needs of users. Similarly, when asked about the connection between analytics and organisational-change decisions, participant GAU1 explained: ‘If we make a change, here are the reasons we’re making it: we base it on evidence, and we understand why we’re advocating for that change and what the expected outcome will be’. Other participants echoed this sentiment: We use those numbers to drive our decisions about subscriptions. (GCU2) We’ll run a trial and ask ‘Where's the data?’ so we can plan accordingly. (GEU1) I collect data from Australian University Libraries and academic libraries. The analysis helps provide a good overview of the current state of analytics and decision-making. (GCU1)
These comments reflect the participants' strong commitment to data-driven decision-making, utilising analytics to enhance service delivery, improve user engagement, and optimise resource allocation.
The participants highlighted the importance of data analytics in guiding resource allocation (e.g. subscriptions), assessing the effectiveness of trials and developing strategic insights for future planning. This focus on evidence-based decisions emphasises the value the participants placed on data to ensure their libraries stay responsive to user needs and adapt to the rapidly evolving landscape.
Evidence-based decisions
The participants highlighted the role of analytics in providing evidence for decision-making, with statements such as: ‘Decision-making for collection development is entirely based on statistics … I want to see the evidence’ (GBU1) and ‘We use analytics to manage our budget’ (GCU4). Statements by GEU1, GAU1, GBU1 and GAU2 reveal a consistent theme of evidence-based decision-making: If we make a change, here are the reasons we’re making a change: we based it on evidence and we understand why we’re, while we’re advocating that change, and what the expected outcome is going to be. (GAU1)
This suggests that the participants valued a structured and informed approach to decision-making, leveraging evidence and data to drive change and improvement in their libraries.
The following comment from GDU2 paints a vivid picture of the importance of high-quality data in driving informed decision-making: So, if we know that we can get good data, that will enable us to do good analysis and then be able to put forward to make a decision – for example, a business case or being able to improve library services. (GDU2)
This illustrates the participant's understanding of the data-analysis–decision-making continuum, where good data serves as the cornerstone for informed strategic choices that drive improvement and growth in library services. This feedback underscores the value of data analytics in supporting strategic decision-making, enabling libraries to make informed data-driven decisions.
Transformative impact
The participants noted the transformative impact of analytics on librarianship practices, with statements such as: I think, in my mind, it is sort of the analytics within the library domain that allows us to improve the services. (GAU2) Analytics has revolutionised our decision-making processes. (GAU2) So, the theoretical sense, yes, analytics and intelligence should be key elements to change or respond or evolve, whatever profession, not just librarianship. (GEU1)
These statements highlight the theoretical importance of analytics and intelligence in driving change and evolution in all professions, including librarianship. It emphasises the critical role of analytics and intelligence in driving professional growth, innovation and resilience, aligning with the study's focus on the impact of big data analytics on librarianship decision-making.
Alignment with the ‘performance’ proposition
The participants’ statements align with the ‘performance’ proposition in several ways:
Adoption of data analytics: the participants universally agreed that data analytics has transformed their decision-making processes. Disruptive innovation: the participants noted the transformative impact of analytics on librarianship practices, indicating that it is a disruptive innovation. Transforming decision-making practices: the participants emphasised the role of analytics in informing decision-making, providing evidence for decisions and improving services.
Overall, the participant statements provide strong support for the proposition, highlighting the transformative impact of data analytics on librarianship decision-making practices. These statements demonstrate strong support for the critical role of data analytics in elevating librarianship performance and decision-making practices.
Reliability and stability: big data analytics ensures consistent and accurate decision-making in libraries by providing data-driven insights, reducing the reliance on anecdotal evidence and intuition
When asked if adopting data analytics in librarianship practice improves performance in decision-making, reducing the reliance on anecdotal evidence and intuition, the participants overwhelmingly agreed that analytics transforms decision-making processes. They highlighted the ability of big data analytics to provide actionable insights: There is enormous potential for us to be much better at what we do and more relevant with analytics in making the right decisions in getting the right things for our users. (GAU1) We can’t stick our heads in the sand about big data. It's everywhere, and we might as well harness its power to improve education. (GCU3)
Echoing the sentiment of GCU3, another participant shared a similar experience, emphasising the transformative impact of big data on driving service improvements. They stated that their team had to intervene and generate (Structured Query Language; SQL) reports on behalf of others due to lack of expertise. However, with the introduction of a platform, creating reports had become a seamless and effortless process, empowering users to take ownership of their data analysis: We would have to say my team would have to go in and do an SQL report for somebody because they could not do it themselves. Now that we have the platform, it is really easy to go in and create a report. (GAU4)
Big data analytics has given the library professional the ability to drill down into data and understand user behaviour in ways that were never thought possible. This testimony reinforces the notion that reliable and stable technologies can significantly enhance productivity, efficiency and decision-making capabilities, ultimately driving continuous improvement and disruption through practice. It relates to the theme of ‘reliability and stability’ as it emphasises the importance of establishing a solid foundation for data management to enable informed decision-making. The feedback highlights the need for automation, clean data and standardised protocols to ensure consistency and accuracy in data visualisation. This focus on reliability and stability is driven by the desire to provide decision-makers with immediate and easily digestible data insights, rather than overwhelming them with complex spreadsheets. By automating processes and establishing clear protocols, the library professionals aim to build trust and consistency in data management, ultimately supporting reliable and informed decision-making.
Similarly, one of the participants commented: I have been part of a lot of initiatives and lots of these initiatives across the university. The university is trying to increase its maturity in the analytics space. We have a central intelligence and planning unit looking at data from multiple sources. (GDU1)
The adoption of data analytics was described by the participants as a ‘game-changer’, which has enabled them to move from reactive to proactive decision-making. As many stated, they were now able to anticipate user needs and make informed decisions. This suggests that big data analytics has increased confidence in their decision-making abilities. As one participant noted: ‘I feel more confident in my decisions now that I have data to back them up’ (GAU1).
The participants emphasised the importance of big data analytics in enabling them to respond to changing user needs, with another participant stating: ‘Big data analytics has allowed us to be more agile and responsive to user needs, which has improved our services overall’ (GDU1).
These statements illustrate a strong reliance on analytics in librarianship decision-making practices, characterised by:
Recognising the vast potential of analytics in enhancing librarianship practices; Emphasising the importance of using evidence and data to inform decision-making; The primary goal of using big data analytics to improve services and meet user needs.
However, a few of the respondents further specified that the best decisions in a difficult situation are based on experience and not necessarily data and analysis because, often, data that tells you the sort of things you need to know will not give you the nuances you need to be aware of. Instead, the respondents suggested that the best decisions come from an experienced leader who knows when to trust their gut instinct and when to rely on data and analysis. Experience can help you understand what the data and numbers are telling you and how they should be interpreted. In this regard, GDU2 stated: ‘So, they’re probably the two where I would make a bit of a leap of faith without necessarily having the data’. For example, when we've received emails about a complaint, or when I know the discovery layer failed. I didn't need any analytics to tell me we needed to fix these issues. Echoing this, GCUE responded: ‘Arguably, all the most important decisions we make, I think are made without analytics’. These statements suggest that the participants were willing to take risks and make decisions without relying solely on data. This shows that they were comfortable making decisions based on intuition and experience, which are assets in many professions.
Overall, the emergence of big data analytics in university libraries is precipitating a paradigm shift in decision-making practices, as librarians harness the power of data to inform their strategies and drive innovation, thereby fulfilling the criteria of a disruptive innovation.
Convenience: the implementation of big data analytics in university libraries substantially improves the user experience and accessibility of library resources, enabling personalised recommendations, streamlined access and enhanced discovery
The study revealed that the integration of big data analytics in university libraries significantly enhances user experience and the accessibility of library resources, aligning with the previous propositions that performance and reliability are key benefits of these tools. While this proposition suggests that big data analytics in university libraries will enhance convenience, the results indicate that the reality is more complicated, with significant barriers to implementation and varying levels of success. The pursuit of convenience in library analytics is a multifaceted endeavour, encompassing the development of operative and customer-friendly products and services, the rapid pace of technological advancements and striving for better solutions.
In contrast to the findings, the participants stated that libraries still have a long way to go to take full advantage of big data analytics: Yeah, but I feel like it is a … it is a development stage, I think. We are in it. The disruption is because it is new, and we are starting to incorporate it into our processes; then, ultimately, hopefully, they will become streamlined into processes. (GCU4)
In support of the above, GDU1 remarked: ‘I have been part of a lot of initiatives and lots of these initiatives across the university. The university is trying to increase its maturity in the analytics space’.
The participants highlighted the challenges of manual data entry, inconsistent definitions and inaccurate data from third-party providers, which can lead to difficulties in big data analytics. The lack of integrated systems and sophisticated tools hinders the ability to analyse and visualise data effectively. Furthermore, the rapid evolution of analytics technologies creates challenges for libraries to keep pace and ensure that they possess the necessary skills to effectively utilise these tools. The limitations of granular data and significant privacy concerns add complexity to the analytics landscape.
The following challenges have been identified as key obstacles to effectively leveraging analytics in the library setting:
Manual processes and a lack of integration hinder efficient analytics; Data accuracy, definitions and privacy concerns pose significant challenges; Limited expertise and skill gaps impede effective analytics utilisation; Trust in staff expertise and aptitude for learning new tools is essential; Continuous learning and skills development are crucial in the rapidly evolving analytics landscape.
These findings underscore the importance of convenient, user-friendly analytics solutions that address the complex needs of libraries, ensuring staff can effectively harness the power of data to drive informed decision-making.
Despite these challenges, libraries are driven to improve their analytics capabilities, addressing their limitations and complexities to enhance decision-making and the user experience. Trust in staff expertise and aptitude for learning new tools is essential, and continuous learning and skills development are crucial in the rapidly evolving analytics landscape. Overall, the convenience of library analytics is a dynamic and ongoing pursuit, requiring adaptability, expertise and a commitment to innovation.
This finding reveals that convenience is a pivotal theme in library big data analytics, encompassing three key conclusions:
Customer-friendly products and services: the participants highlighted the need for intuitive, user-friendly analytics tools, citing challenges with data accuracy, definitions and integration. Technological development outpacing customer demands: the rapid evolution of analytics technologies creates challenges for libraries to keep pace and ensure that they possess the necessary skills to effectively utilise these tools. Striving for better products and services: libraries are driven to improve their analytics capabilities, addressing their limitations and complexities to enhance decision-making and the user experience.
The findings confirm that the implementation of big data analytics in university libraries substantially improves the user experience and accessibility of library resources, enabling personalised recommendations, streamlined access and enhanced discovery. The study's results highlight the importance of addressing the challenges and complexities associated with big data analytics, including manual processes, data accuracy concerns, limited expertise and rapidly evolving technologies. By doing so, libraries can harness the potential of big data analytics to provide convenience, improve the user experience and enhance decision-making. Therefore, the ‘convenience’ proposition is validated.
Price: the cost of adopting big data analytics in university libraries is offset by significant long-term benefits, including reduced operational costs, improved resource utilisation and enhanced student outcomes, resulting in a positive return on investment
The participants highlighted the potential of big data analytics to improve efficiency, demonstrate value and impact, and provide a positive return on investment. They noted that the cost of adopting big data analytics is significant but can be offset by the benefits of reduced operational costs, improved resource utilisation and enhanced student outcomes.
GAU1, for instance, mentioned that big data analytics can make libraries more efficient and better able to demonstrate value and impact: I think it can make us more efficient; initially, it has. It can make us better able to demonstrate value and impact and return on investment in a way we have never been able to before, in a more objective way. So, there is enormous potential for this. (GAU1)
Similarly, other participants highlighted the potential of having a dashboard to advertise library services and provide value for money: I want to expose some of those publicly … I think it is interesting, for example, for academics to see which library services are being used and also the value for money that the library provides to the university. (GAU4) We manage a multi-million-dollar budget, and it's essential to examine the cost per use to determine if our resources are being utilised effectively, rather than making assumptions. (GBU2) These factors are closely scrutinised to ensure we’re spending wisely and achieving value for (GBU2)oney (GBU2).
The participants emphasised the importance of assessing data to make informed decisions about resource allocation and ensuring value for money. They also noted that the cost of big data analytics requires careful consideration, including the need for funding, information technology support and skilled personnel. However, they also highlighted the potential for cost-effectiveness and return on investment, particularly when combined with evidence-based decision-making and student-centred design. Overall, the statements from the participants suggest that the cost of adopting big data analytics in university libraries can be justified by the significant long-term benefits, including reduced operational costs, improved resource utilisation and enhanced student outcomes, resulting in a positive return on investment.
The proposition that the cost of adopting big data analytics in university libraries is offset by significant long-term benefits is justified by the participants’ emphasis on the potential of big data analytics to improve efficiency, demonstrate value and impact, and provide a positive return on investment. While the cost of adoption is significant, the benefits of reduced operational costs, improved resource utilisation and enhanced student outcomes outweigh the expense. Therefore, the proposition is justified, as the participants’ statements collectively suggest that the cost of adopting big data analytics in university libraries can be offset by significant long-term benefits, resulting in a positive return on investment.
Discussion
The theory of disruptive technologies explains how new technologies can affect an organisation's future performance, leading to changes in value-creation processes. Some of the studies reviewed in the literature. This study aims to justify the impact of analytics as a disruptive innovation in modern university librarianship practices.
The literature review shows that big data analytics plays an essential role in improving organisational performance by identifying new opportunities, highlighting possible threats, revealing new business insights and enhancing decision-making processes, among many other benefits (Kehal and El Alfy, 2021; Laursen and Thorlund, 2016; Ram et al., 2016; Roy et al., 2018; Xia and Gong, 2014). Similarly, the results from this study show that analytics supports and improves librarianship efficiencies such as decision-making. The theory, current studies, and findings from participant statements closely align with the decision-making process regarding whether analytics serves as a disruptive innovation for enhancing an organisation's efficiency.
Several studies have highlighted the potential of analytics to transform organisational performance by enabling data-driven decision-making, assessment and optimisation. For instance, McAfee et al. (2012), Travis and Ramirez (2020), and Zhan and Widén (2018) have all demonstrated how analytical tools can be leveraged to achieve greater efficiency and effectiveness in various contexts. In line with these findings, the present study reveals that university libraries are actively seeking to enhance their analytics capabilities, recognising the importance of data-driven insights in informing their practices.
According to the literature, big data is currently very relevant to libraries (Garoufallou and Gaitanou, 2021; Tella and Kadri, 2021). From the theory, we know that technological development continuously outstrips customers. Notably, the study's results indicate that university libraries are not only embracing analytics but also striving to develop their analytics practices by integrating data from multiple sources. This shift towards analytics-driven decision-making marks a significant disruption in traditional librarianship practices, as libraries increasingly rely on data to optimise their services, resources and overall performance. By harnessing the power of analytics, libraries can better respond to the evolving needs of their users, ultimately enhancing their relevance and impact in the academic community. The study's findings thus underscore the transformative potential of analytics in librarianship, highlighting its capacity to drive innovation, improvement and excellence in library services.
Similarly, this study found that library data is big data and thereby crucial due to technological developments and data richness. To manage big data, libraries are continuously leveraging analytics and its features to enhance data management and decision-making. Based on disruption theory, a sustaining innovation targets demanding, high-end customers with improved performance. Mikalef et al. (2019), Roy (2024) and Wamba et al. (2020) also state that analytics improves overall organisational performance. Further to this, studies such as those by Bose (2009), Chen et al. (2015), Farmer and Safer (2016), Garoufallou and Gaitanou (2021), and Showers (2015) also found that analytics is being used in libraries to improve performance.
According to the theory of disruptive innovation, organisations strive to make better products. Similarly, identifying, collecting and analysing data to drive service development and demonstrate impact is not straightforward (Showers, 2014). On the other hand, the results of this study indicate that analytics is complex and difficult in terms of its data integration because it is new, and libraries incorporate it into their processes. The similarity among the theoretical concepts, literature, and study results demonstrates a relationship between them, as new tools have the potential to disrupt librarianship decision-making practices.
Disruptive innovation occurs when the introduction of a new product, service, process, or organisational change significantly alters existing activities. Similarly, Cooper (2015) found that disruptive innovations challenge librarianship practices. Librarianship practices have changed radically due to technological changes (Showers, 2015; Tella and Kadri, 2021). The studies from the literature review, such as McDonald and McEvoy (2019), Paul and Erdelez (2013), Showers (2014) and Stubbing (2022), demonstrate that analytics is transforming the library profession and professional practice, decision-making, (Rose, 2017; Travis and Ramirez, 2020) demonstrate value, (Chaurasia and Frieda Rosin, 2017; Garoufallou and Gaitanou, 2021) measure success, improve service (Silva and Miguéis, 2017). Similarly, the results of this study indicate that libraries make decisions about change based on evidence.
In summary, based on the fundamental idea of disruptive innovation theory and the analytics literature, this study justifies that big data analytics is a disruption innovation.
Theoretical implications
This study provides a valuable contribution to the literature on analytics adoption, particularly in the context of emerging and disruptive innovations. Although previous research has explored technology adoption extensively, the specific aspects of adopting analytics have not been sufficiently examined in scholarly work. By addressing this gap, this research sheds light on the distinct nuances associated with analytics adoption. It expands on Christensen's (1997) disruptive innovation theory by integrating fundamental concepts from this theory. This integration provides a more comprehensive framework for understanding the adoption of big data analytics in the context of modern librarianship practice. Notably, this study represents a first attempt to apply the adoption of big data analytics in the library and information science field, offering a holistic approach to expand the existing knowledge base and provide valuable insights for future research in this area. The findings contribute to the literature on the adoption of big data analytics in the emerging and disruptive innovation context.
Practical implications
The findings of this study have significant practical implications for libraries in Australia. By embracing big data analytics tools such as Microsoft Power BI and Tableau, libraries can tap into the power of data-driven insights to enhance decision-making and improve user experience. The provision of useful, reliable and accurate data through these tools will increase the perceived utility of analytics among librarians, ultimately driving adoption and fostering a culture of data-informed decision-making. This study provides a compelling case for library professionals, decision-makers and university stakeholders to adopt big data analytics as a key driver of strategy and innovation. By leveraging analytics, libraries can demonstrate value and have a meaningful impact on student success and user experience. Conversely, the failure to adopt big data analytics may result in libraries struggling to remain relevant, ultimately jeopardising their ability to meet the evolving needs of their users. As such, this study serves as a call to action for libraries to harness the potential of analytics and secure their position as vital hubs of learning and discovery.
Limitations and future research directions
The present study has several limitations that must be acknowledged. First, the analysis is restricted to library professionals primarily working in university libraries, excluding those employed by analytics vendors, which may offer additional insights. Additionally, the qualitative nature of the study presented challenges in maintaining a natural flow of discussion during the interviews, and the time-consuming process of the data analysis proved daunting. The researcher spent considerable time processing and reducing vast amounts of data into a few themes or categories – a task that spanned from July 2018 to July 2022. Furthermore, the absence of comparable studies on analytics usage in librarianship and other professional groups limited the scope of this study. As a result, the findings are unable to definitively establish whether there are differences in analytics usage between librarians and other professionals. Another limitation lies in the data collection method, which relied on semi-structured interviews and was restricted to Australian universities. Future research could address these limitations by conducting surveys to collect data on university librarianship practices and their potential disruption. This would allow a more comprehensive understanding of the subject matter and enable the provision of actionable insights for stakeholders seeking to harness the power of big data analytics in librarianship, ultimately enriching the existing body of knowledge.
Conclusion
In conclusion, this study has examined the transformative potential of big data analytics in university libraries through Christensen's (1997) four-step framework, illustrating its disruptive impact on traditional library systems and services. The findings confirm the disruptive role of big data analytics in contemporary librarianship, showing its ability to improve decision-making. This research significantly contributes to library and information science by applying disruptive technology theory to the context of big data analytics in library decision-making. The study's recommendations offer a basis for future research and guide strategies for implementing big data analytics in university libraries, equipping managers and policymakers with tools for informed decision-making. This research enhances the existing body of literature on analytics adoption, particularly within the realm of emerging and disruptive innovations, addressing a gap in scholarly focus. By exploring the unique aspects of analytics adoption, the study provides a comprehensive understanding of big data analytics in modern librarianship. The findings hold considerable practical relevance for university libraries, underscoring the importance of adopting big data analytics tools to improve decision-making and user experience. Ultimately, this study calls on libraries to leverage analytics in order to strengthen their role as essential centres of learning and discovery.
Footnotes
Acknowledgements
I would like to express my sincere gratitude to the university leaders who participated in this study, including directors, associate directors and managers. Their enthusiasm for the research topic was evident, and they generously shared their valuable insights and expertise, dedicating significant time to exploring critical issues related to the study. Their contributions have been invaluable, and I appreciate their willingness to engage in in-depth discussions, which have greatly enriched this study.
Declaration of conflicting interests
The author declared no potential conflicts of interest with respect to the research, authorship and/or publication of this article.
Funding
The author received no financial support for the research, authorship and/or publication of this article.