
Abstract
Background
Trigeminal zoster-associated neuralgia (TZAN) is a refractory intractable craniofacial neuropathic pain with a high risk of progressing to postherpetic neuralgia. Abnormal T2-weighted magnetic resonance imaging (MRI) hyperintensity in the spinal trigeminal nucleus (STN) has been reported in TZAN patients, but its diagnostic value, influencing factors and association with prognosis remain insufficiently explored. This study aimed to investigate the correlation between STN lesions and TZAN and identify factors affecting STN signal characteristics and TZAN therapeutic efficacy.
Methods
This retrospective cohort study included 105 TZAN patients, 105 non-TZAN normal controls (NC) and 287 classical trigeminal neuralgia (CTN) patients who underwent cranial MRI at Shandong Provincial Hospital Affiliated to Shandong First Medical University between September 2018 and March 2024. Propensity score matching (1:1, caliper = 0.1) was used to balance baseline differences between the TZAN and CTN groups. STN lesions were evaluated in a blinded manner by two radiologists, and clinical data (pain Numeric Rating Scale scores, pregabalin dosage) were collected via medical records and 6-month telephone follow-up. Multivariate logistic regression analyzed factors associated with STN hyperintensity and TZAN efficacy (pain relief ≥ 80% defined as “excellent response”).
Results
STN lesion detection rate was significantly higher in TZAN than in NC (62.9% vs. 1.0%, p < 0.001) and matched CTN (68.9% vs. 0%, p < 0.001), with 62.9% sensitivity, 99.0% specificity and 81.0% accuracy for TZAN diagnosis. Age (odds ratio (OR) = 1.06, 95% confidence interval (CI) = 1.006–1.116, p = 0.030) and subacute phase (vs. acute: OR = 32.01; vs. chronic: OR = 46.40, both p < 0.001) independently predicted STN hyperintensity. STN-normal patients had better short-term efficacy (discharge Numeric Rating Scale = 2 (1, 3) vs. 3 (2, 4), p = 0.042; excellent response rate: 38.5% vs. 19.7%, p = 0.036) but no long-term difference (3 and 6 months post-discharge, p > 0.05). Chronic phase predicted poor prognosis (vs. acute: OR = 6.55, p = 0.005; vs. subacute: OR = 5.39, p = 0.017).
Conclusions
STN lesions are highly specific for TZAN and may serve as an auxiliary diagnostic indicator. STN hyperintensity is most prominent in elderly TZAN patients in the subacute phase, potentially acting as a subacute-phase imaging marker. Early intervention in subacute TZAN may be critical for improving prognosis.
Keywords
Introduction
Herpes zoster (HZ) is caused by the reactivation of varicella-zoster virus (VZV) in sensory ganglia, and zoster-associated neuralgia (ZAN) affects 10–30% of patients with HZ. 1 Trigeminal zoster-associated neuralgia (TZAN), a subtype of ZAN involving the trigeminal nerve, accounts for 58% of head and facial HZ cases, with a higher risk of progressing to postherpetic neuralgia (PHN) (35–50%) than trunk or limb ZAN. 2 TZAN is characterized by severe burning or stabbing pain, allodynia, and sleep or anxiety disorders, imposing substantial physical and socioeconomic burdens. 2
The spinal trigeminal nucleus (STN) is a key relay station for orofacial nociception, integrating pain signals via its caudal subnucleus (also known as the “medullary dorsal horn”). 3 Recent case reports have described T2-weighted imaging (T2WI) hyperintensity in the STN of TZAN patients, which is attributed to inflammation caused by the anterograde spread of VZV.4–6 Niemeyer et al. 3 further showed that VZV triggers the release of proinflammatory cytokines (interleukin (IL)-6 and tumor necrosis factor (TNF)-α) in the trigeminal ganglion and STN, exacerbating neural damage and pain. However, most existing studies are case-based, and systematic data on the prevalence of STN lesions, their influencing factors and their relevance to TZAN prognosis remain lacking.
This retrospective cohort study analyzed the clinical and imaging data of TZAN patients to: (i) compare the rates of STN lesions across the TZAN, normal control (NC) and classical trigeminal neuralgia (CTN) groups; (ii) identify factors affecting STN signals; and (iii) explore the association between STN lesions and efficacy of treatment in TZAN. The findings aim to provide evidence for TZAN diagnosis and early intervention.
Methods
Participants
This retrospective cohort study was reported in accordance with the Strengthening the Reporting of Observational Studies in Epidemiology (STROBE) statement. This retrospective study was approved by the Ethics Committee of Shandong Provincial Hospital Affiliated to Shandong First Medical University (Approval No.: SWYX: 2025-076) and adhered to the Declaration of Helsinki. Written informed consent was waived given the retrospective nature of the study, while verbal informed consent was obtained and documented during telephone follow-up. All data were anonymized to protect patient privacy.
Patients who underwent cranial magnetic resonance imaging (MRI) at Shandong Provincial Hospital Affiliated to Shandong First Medical University between 1 September 2018 and 31 March 2024, were screened for inclusion. The inclusion criteria for the TZAN group were: a definite history of head/facial HZ in trigeminal dermatomes (confirmed by dermatologists); moderate-to-severe pain (Numeric Rating Scale (NRS) ≥ 4) at inpatient admission; age ≥ 18 years; and complete clinical data and 6-month follow-up data. All TZAN subjects were treated with analgesic medications combined with interventional therapies, including nerve block and neuromodulation. For the CTN group, inclusion criteria were adherence to the International Classification of Headache Disorders, 3rd edition, criteria, 7 moderate-to-severe pain (NRS ≥ 4) at inpatient admission, age ≥ 18 years, and complete clinical data and 6-month follow-up data. The NC group comprised non-TZAN patients without any head/facial pain or relevant disorders, who had complete clinical and imaging data; all NC subjects were recruited from the health check-up population and non-pain clinic inpatients of our hospital during the same study period.
Baseline characteristics
Demographic factors (age, gender, body mass index), smoking/alcohol history and comorbidities (hypertension, diabetes, coronary heart disease and cerebral infarction) were systematically recorded as potential confounders. Additionally, disease course (acute phase (AHN, < 30 days), subacute phase (SHN, 30–90 days), chronic phase (PHN, > 90 days)) and affected side were recorded for the TZAN and CTN groups. For both groups, cranial MRI examinations were completed within 2 days after inpatient admission, and so the timing of MRI scanning was deemed consistent with the disease course staging by default.
MRI was performed using a 3.0T MAGNETOM Prisma scanner (Siemens, Erlangen, Germany) with the following parameters: repetition time (TR) = 4000 ms, echo time (TE) = 100 ms, matrix = 320 × 156, slice thickness = 5 mm and 3-mm thin-slice reconstruction for the STN region (the medulla oblongata, ranging from the pyramidal decussation to the upper olive level) (Figure 1). Two radiologists with ≥ 5 years of neuroradiology experience independently reviewed T2WI images in a blinded manner (unaware of patients’ clinical diagnoses). Disagreements were resolved by a senior radiologist with ≥ 10 years of experience. Examples of typical imaging findings are shown in Figure 2.

Horizontal section of the medulla oblongata (at the level of the pyramidal decussation).

Brain magnetic resonance imaging (MRI) examination image (T2-weighted imaging). (a) MRI shows abnormally high signal intensity in the left spinal trigeminal nucleus (STN) of the medullary plane at decussation of lemniscus height (arrow). (b) MRI shows abnormally high signal intensity in the right STN of the medullary plane at decussation of pyramids height (arrow). (c) MRI shows abnormally weak high signal intensity in the left STN of the medullary plane at the height of the upper olive (arrow). (d) MRI shows abnormally high signal intensity with a large area in the left STN of the medullary plane at the height of the middle olive (arrow).
To minimize the impact of potential confounders, propensity score matching (PSM) (1:1 nearest-neighbor matching, caliper = 0.1, no replacement) was used to balance baseline differences between the TZAN and CTN groups. Matching variables included age, gender, disease course, smoking history, diabetes and coronary heart disease.
(A) MRI shows abnormally high signal intensity in the left STN of the medullary plane at decussation of lemniscus height (arrow); (B) MRI shows abnormally high signal intensity in the right STN of the medullary plane at decussation of pyramids height (arrow); (C) MRI shows abnormally weak high signal intensity in the left STN of the medullary plane at the height of the upper olive (arrow); and (D) MRI shows abnormally high signal intensity with a large area in the left STN of the medullary plane at the height of the middle olive (arrow).
Outcome measures and follow-up
To investigate the association between STN lesions and the efficacy of therapy in TZAN, the following outcome parameters were assessed at baseline, discharge, 3 months post-discharge and 6 months post-discharge: pain intensity, pain relief rate, sleep quality, medication use and complications. Pain intensity was evaluated using the validated NRS, a 0–10 scoring system with ‘0’ indicating no pain and ‘10’ representing the most severe pain, while the pain relief rate was calculated using: [(Baseline NRS score – Follow-up NRS score)/Baseline NRS score] × 100%. A simplified sleep quality assessment was employed to evaluate patients’ sleep status, categorized as excellent (difficulty falling asleep, defined as inability to fall asleep within 30 min, ≤ 1 episode per week, normal sleep duration), moderate (difficulty falling asleep > 1 episode per week and ≤ 3 episodes per week with slightly shortened sleep duration) or poor (difficulty falling asleep > 3 episodes per week with short sleep duration). Complications assessed in this study included pain recurrence, pruritus, numbness and other related symptoms.
Statistical analysis
All data compilation and statistical analysis were performed using Excel (Microsoft Corp., Redmond, WA, USA), SPSS, version 27.0 (IBM Corp., Armonk, NY, USA), R, version 4.4.2 (R Foundation, Vienna, Austria) and Prism, version 10.1.2 (GraphPad Software Inc., San Diego, CA, USA). All results were analyzed using descriptive statistical methods. The Shapiro–Wilk test was used to test the normality of continuous data. Data conforming to a normal distribution were expressed as the mean ± standard deviation; data not conforming to a normal distribution were expressed as median (first quartile, third quartile) (M (Q1, Q3)). Categorical data were described using case count (percentage) (n (%)). For inter-group comparisons, an independent samples t-test was used for variables with a normal distribution and a Mann–Whitney U-test or a chi-squared test was used for variables without a normal distribution. Multivariate binary logistic regression analysis was conducted to evaluate factors influencing STN signals and TZAN efficacy, with odds ratio (OR) and 95% confidence interval (CI) calculated. P < 0.05 was considered statistically significant.
Results
As illustrated in Figure 3, 524 patients with CTN and 219 patients with TZAN were admitted to the Department of Pain Medicine. Among the 524 CTN patients, 237 were excluded due to missing MRI data. Ultimately, 497 patients were enrolled in this study, comprising 105 patients in the NC group, 287 in the CTN group and 105 in the TZAN group. Additionally, the 105 TZAN patients were further subclassified into two groups based on cranial MRI findings: 66 with STN hyperintensity (STN-HS group) and 39 with normal STN signals (STN-NS group), with the symptomatic side of head and facial pain being completely consistent with the side of STN hyperintensity in all patients. Patients were also categorized into the excellent response group (n = 55) and the non-excellent response group (n = 50) according to whether pain relief was ≥ 80% at the 6-month follow-up.

Patient flowchart. CTN, classical trigeminal neuralgia; MRI, magnetic resonance imaging; NC, normal control; NRS, Numeric Rating Scale; STN, spinal trigeminal nucleus; TZAN, trigeminal zoster-associated neuralgia.
Comparison between TZAN group and NC group
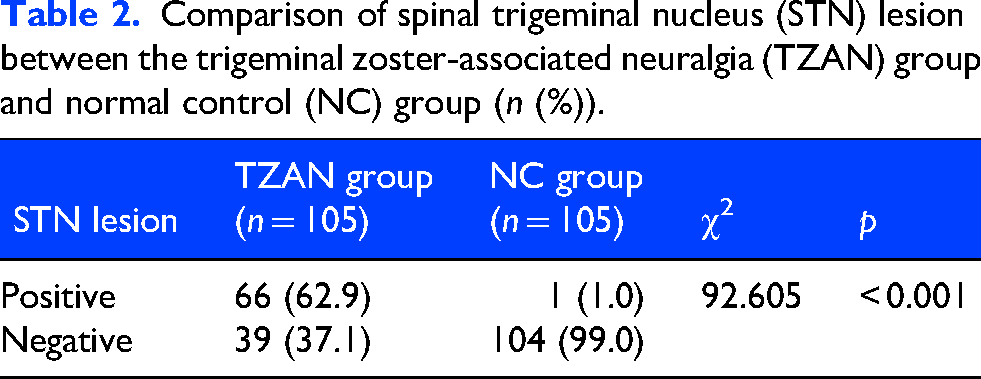
Although demographic characteristics (age, gender and body mass index), lifestyle factors (smoking and alcohol consumption history) and comorbidities were systematically compared between the TZAN and NC groups, no statistically significant differences were identified across any of these variables (all p > 0.05) (Table 1). Notably, STN lesions were detected in 62.9% (66/105) of TZAN patients, whereas this finding was extremely rare in the NC group, occurring in only 1.0% (1/105) of cases, comprising a difference that reached statistical significance (χ2 = 92.605, p < 0.001) (Table 2). When STN hyperintensity on T2WI was evaluated as a diagnostic marker for TZAN, it exhibited a sensitivity of 62.9%, a specificity of 99.0% and an overall accuracy of 81.0%.
Baseline characteristics of the trigeminal zoster-associated neuralgia (TZAN) group and normal control (NC) group.

Comparison of spinal trigeminal nucleus (STN) lesion between the trigeminal zoster-associated neuralgia (TZAN) group and normal control (NC) group (n (%)).
Comparison between TZAN group and CTN group
Prior to PSM, the TZAN and CTN groups differed significantly with respect to several baseline characteristics, including gender distribution, disease course, smoking history and the prevalence of diabetes mellitus and coronary heart disease (all p < 0.05). Following 1:1 PSM (caliper = 0.1), these baseline discrepancies were effectively balanced, with no statistically significant differences observed between the two groups (all p > 0.05) (Table 3). Post-PSM analysis revealed that STN lesions remained highly prevalent in the TZAN group (68.9%, 31/45) but were completely absent in the matched CTN group (0%, 0/45), a distinction that was statistically robust (χ2 = 47.288, p < 0.001) (Table 4).
Baseline characteristics of the trigeminal zoster-associated neuralgia (TZAN) group and classical trigeminal neuralgia (CTN) group before and after propensity score matching (PSM).

Note: BMI, body mass index.
Comparison of spinal trigeminal nucleus (STN) lesions between the trigeminal zoster-associated neuralgia (TZAN) group and classical trigeminal neuralgia (CTN) group after propensity score matching (PSM) (n (%)).

Note: *p < 0.01.
Comparison between STN-hs group and STN-NS group
A significant difference in disease course was observed between the STN-HS and STN-NS groups (p < 0.001): the STN-HS group had a higher proportion of SHN (51.5% vs. 5.1%) and lower proportions of AHN (36.4% vs. 66.7%) and PHN (12.1% vs. 28.2%), with no other baseline variables differing significantly (all p > 0.05) (Table 5).
Baseline characteristics of the spinal trigeminal nucleus (STN) hyperintensity (STN-HS) group and normal STN signals (STN-NS) group.
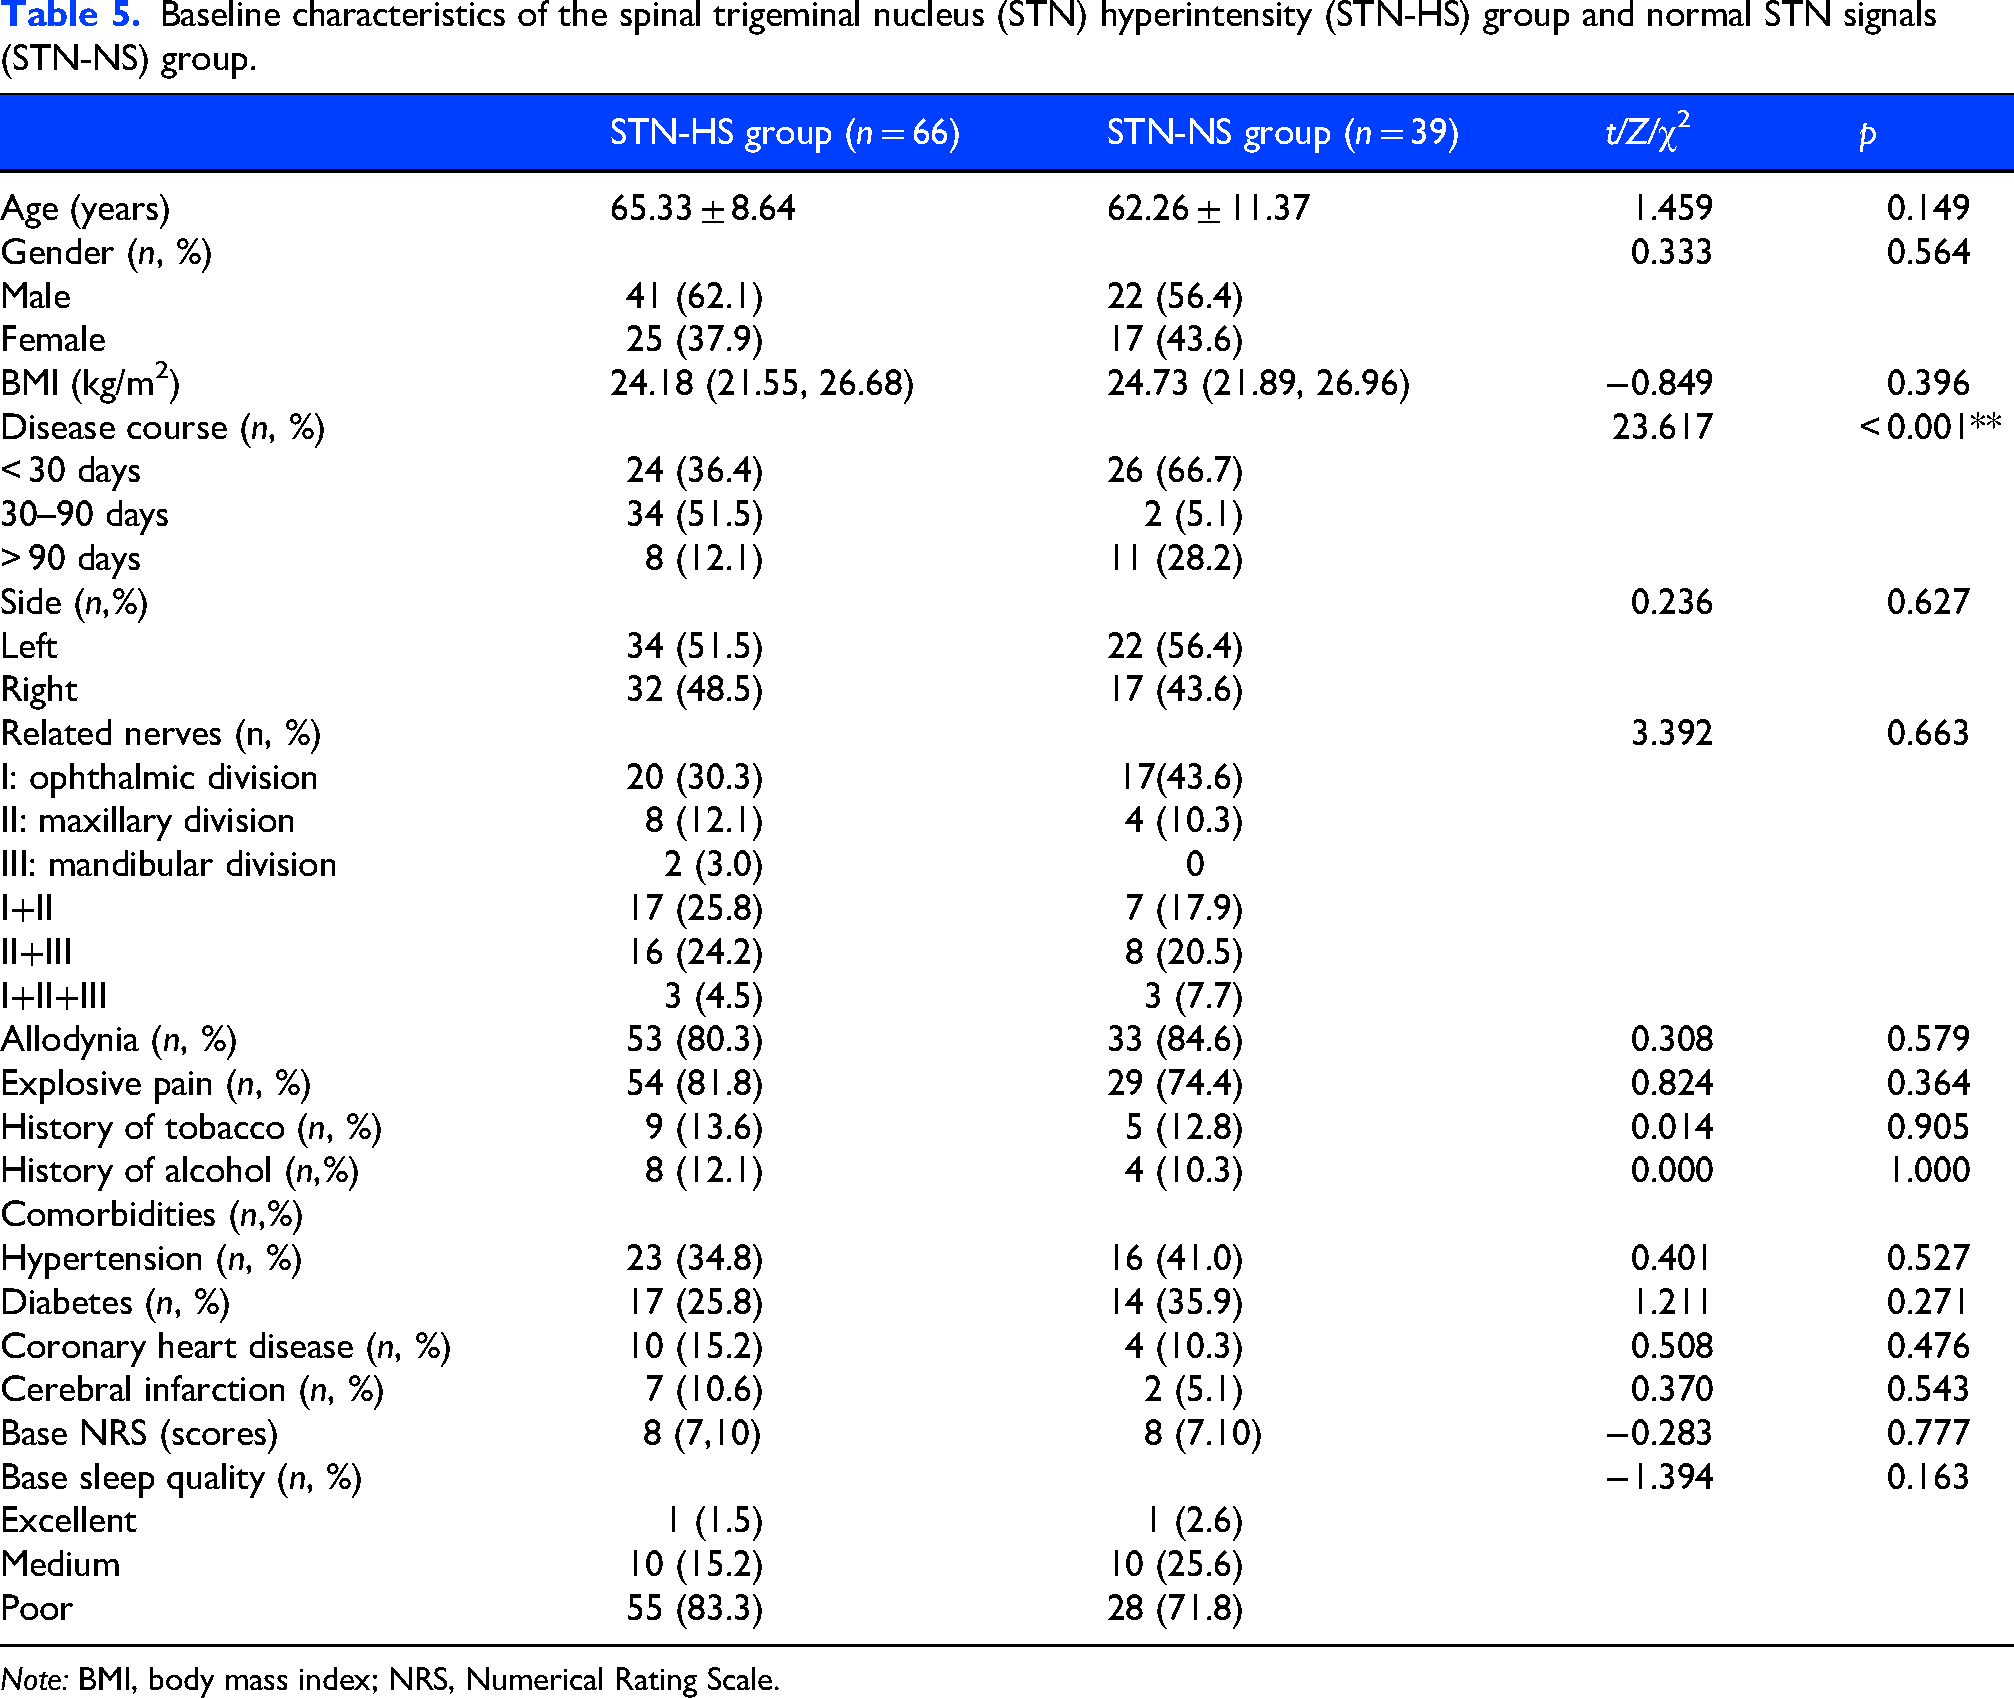
Note: BMI, body mass index; NRS, Numerical Rating Scale.
Multivariate logistic regression analysis, adjusted for potential confounders, identified age (OR = 1.06, 95% CI = 1.006–1.116, p = 0.030) and disease course as independent predictors of STN hyperintensity, with the SHN phase associated with a substantially higher risk compared to both AHN (OR = 32.01, p < 0.001) and PHN (OR = 46.40, p < 0.001) (Table 6). The prevalence of STN lesions varied dynamically across disease stages: 48.0% (AHN), 94.4% (SHN), 77.8% (PHN, 3–12 months) and 10.0% (PHN, > 12 months) (Figure 4).
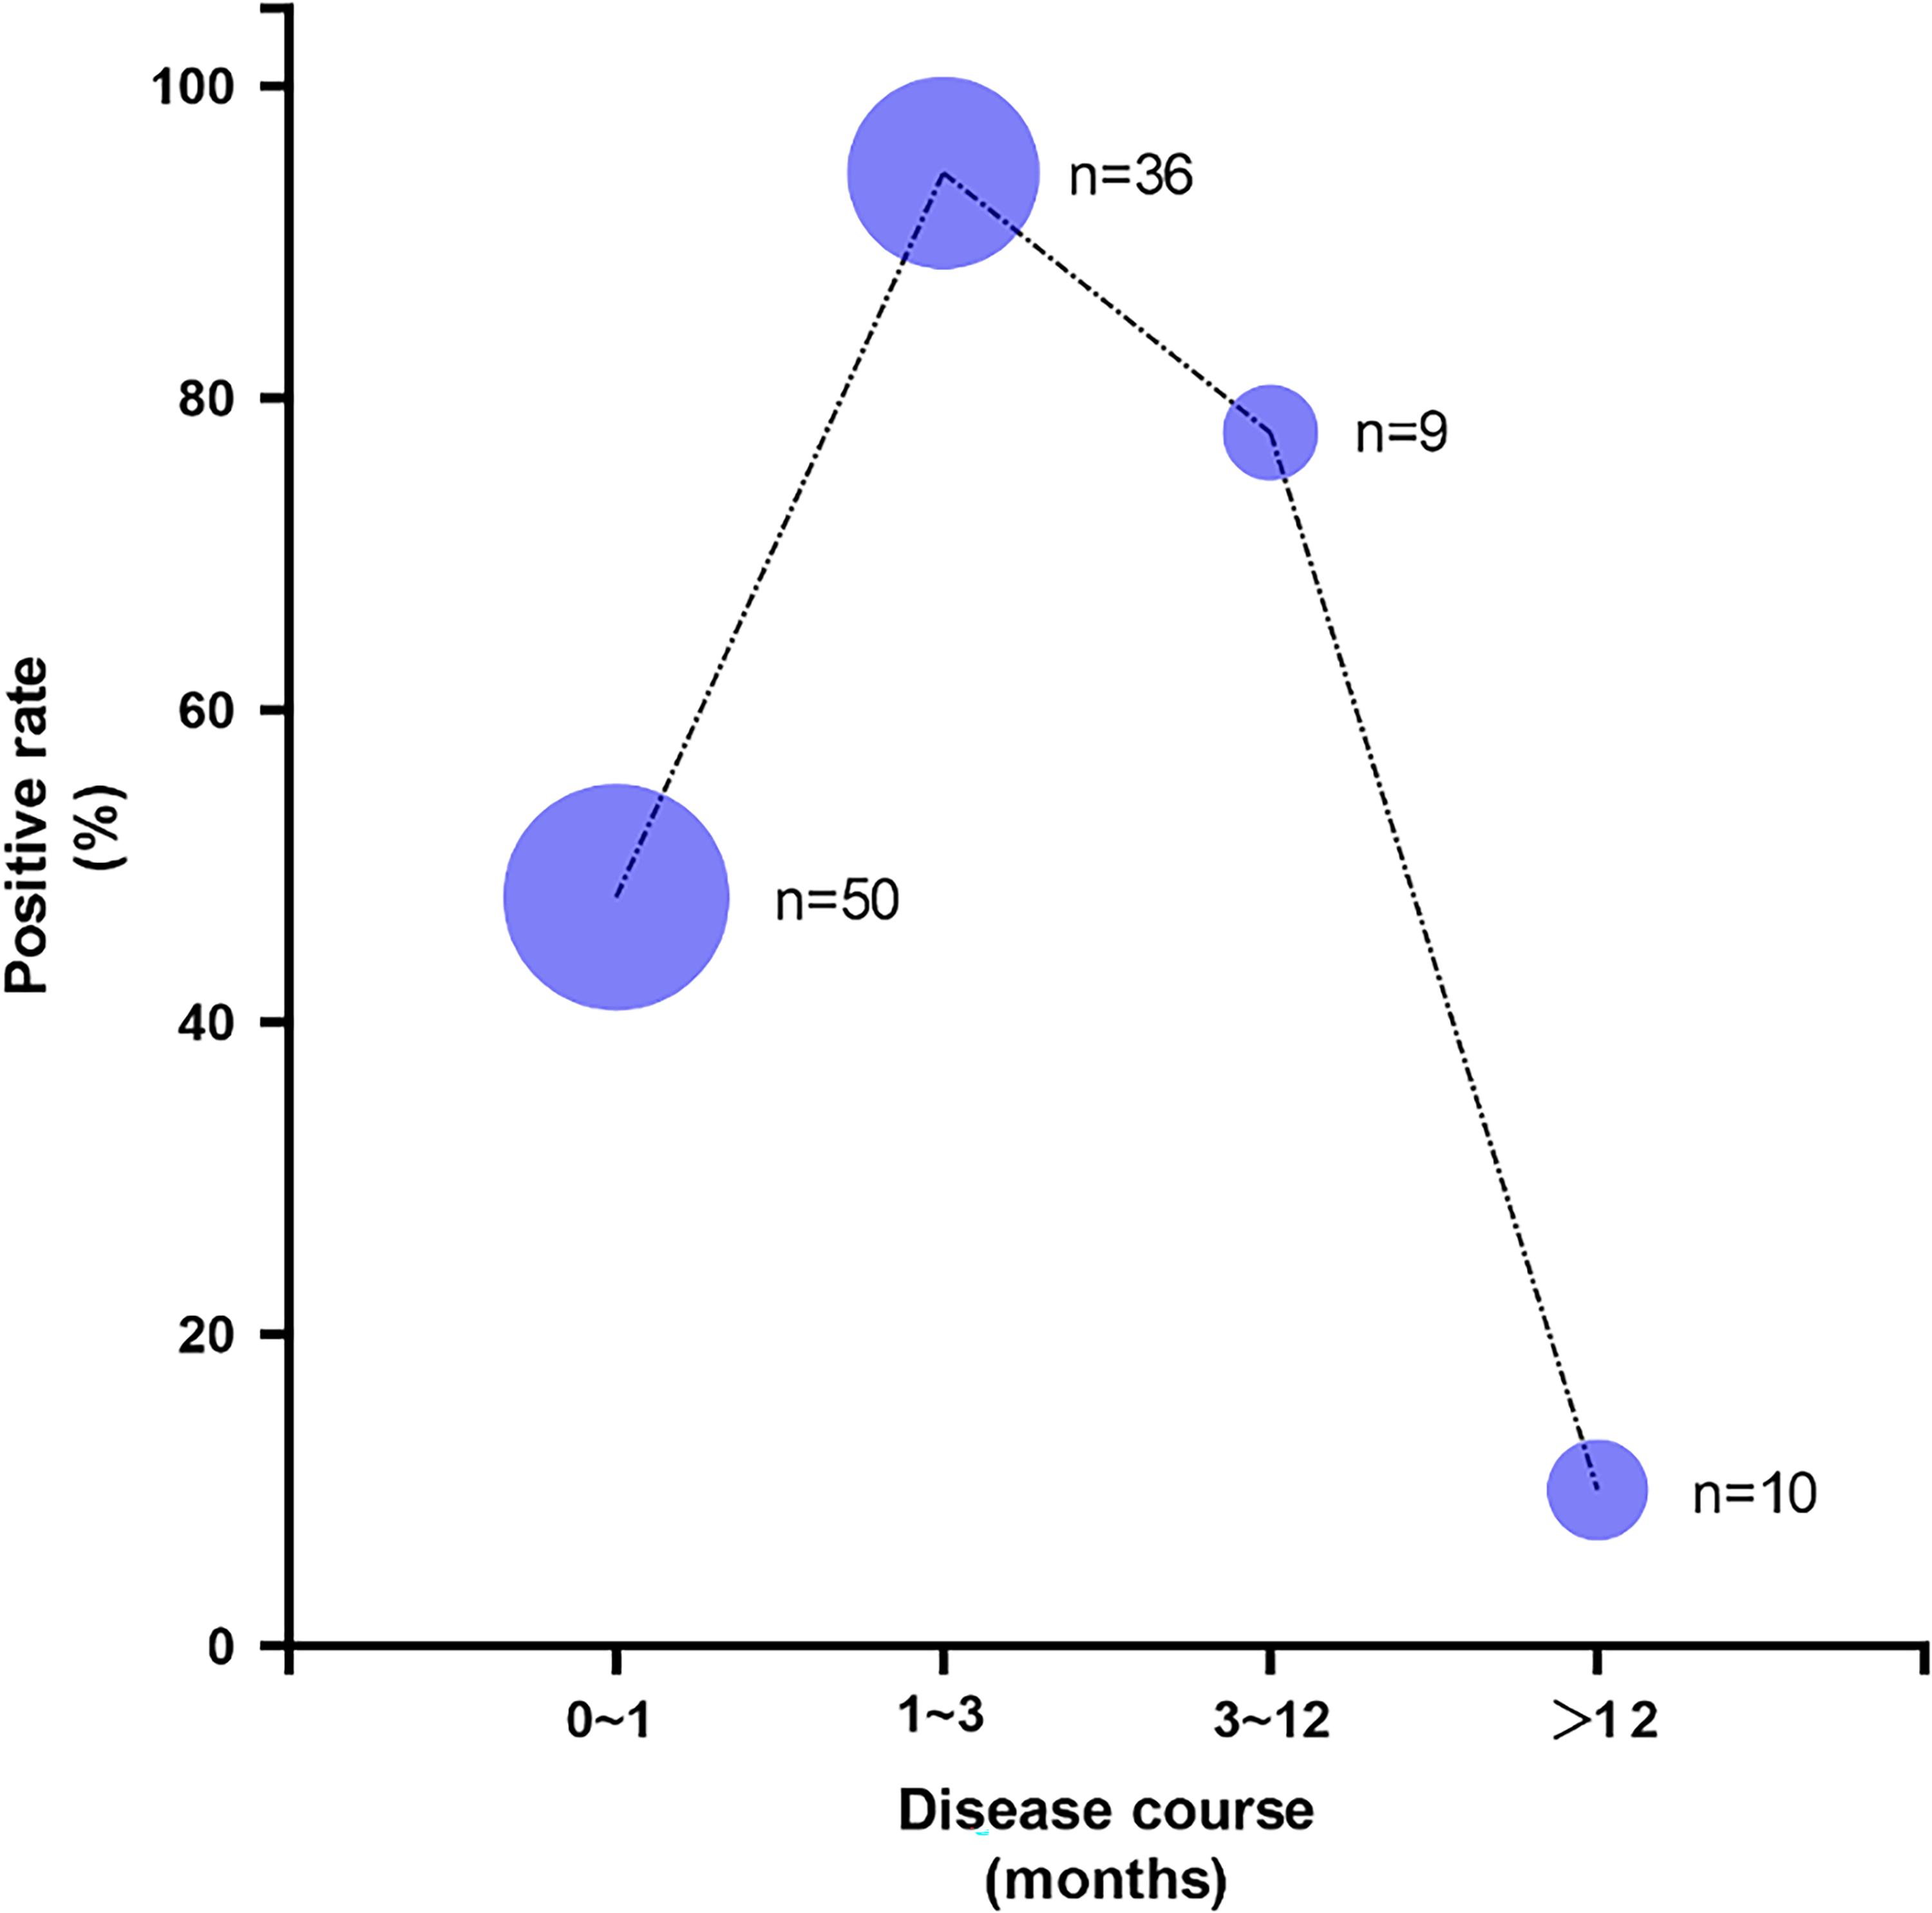
The positive rate of spinal trigeminal nucleus (STN) lesions changes with the course of the disease course. Bubble plot showing STN lesion positive rates by disease course; bubble size represents sample size.
Multivariate binary logistic regression analysis of spinal trigeminal nucleus (STN) signals.

Note: AHN, acute herpetic neuralgia; CI, confidence interval; OR, odds ratio; PHN, postherpetic neuralgia; SHN, subacute herpetic neuralgia.
Clinically, the STN-NS group achieved lower discharge NRS (2 (1, 3) vs. 3 (2, 4) p = 0.042) and a higher excellent response rate (38.5% vs. 19.7%, p = 0.036) than the STN-HS group, but this short-term advantage did not persist at 3- or 6-month follow-up (all p > 0.05) (Table 7). No significant differences in daily pregabalin dosage (admission, discharge and follow-up) or complication rates (pain recurrence, pruritus and numbness) were noted (all p > 0.05) (see Supplementary material, Tables S1 and S2) and no serious adverse events (neurovascular injury, wound infection) were reported.
Comparison of treatment outcome between the spinal trigeminal nucleus (STN) hyperintensity (STN-HS) group and normal STN signals (STN-NS)group (6-month follow-up).

Note: NRS, Numerical Rating Scale.
Baseline characteristics of excellent response group and non-excellent response group.

Note: AHN, acute herpetic neuralgia; BMI, body mass index; NRS, Numerical Rating Scale; PHN, postherpetic neuralgia; SHN, subacute herpetic neuralgia; STN, spinal trigeminal nucleus.
Comparison between excellent response group and non-excellent response group
Comparison between the excellent response and non-excellent groups at baseline revealed a statistically significant difference in disease course (Table 8). Multivariate logistic regression analysis demonstrated that disease course was a statistically significant factor associated with efficacy of treatment in TZAN (p < 0.05). Patients in the chronic phase (PHN) had a 6.55-fold higher risk of non-excellent response compared to those in the acute phase (AHN) (OR = 6.55, 95% CI = 1.774–24.148, p = 0.005) and a 5.39-fold higher risk than those in the subacute phase (SHN) (OR = 5.39, 95% CI = 1.360–21.379, p = 0.017). No significant difference in treatment efficacy was observed between the acute phase and subacute phase (p> 0.05) (Table 9).
Multivariate binary logistic regression analysis of efficacy of treatment in trigeminal zoster-associated neuralgia (TZAN).

Note: AHN, acute herpetic neuralgia; CI, confidence interval; OR, odds ratio; PHN, postherpetic neuralgia; SHN, subacute herpetic neuralgia.
Discussion
To our knowledge, this is the first large-cohort study to demonstrate that STN lesions exhibit high specificity (99.0%) for TZAN, consistent with earlier case reports4–6 but extending these observations to systematic, large-scale data. Importantly, the laterality of STN hyperintensity was fully concordant with the symptomatic side in all TZAN patients, and the rate of STN lesions was 62.9% in TZAN, compared to only 1.0% in NC and 0% in PSM CTN. These findings confirm that STN damage is not a non-specific manifestation of head and facial pain but a TZAN-specific radiological feature. It is hypothesized that the underlying pathway entails the transaxonal spread of VZV, where reactivation of latent VZV in the trigeminal ganglion prompts the virus to spread along axons to the STN, upregulate proinflammatory cytokines (IL-6 and TNF-α) and thereby trigger localized inflammatory responses and induce T2WI hyperintensity.8,9 Clinically, STN hyperintensity offers valuable diagnostic utility for atypical TZAN cases (e.g. those without a characteristic rash 10 ), which often overlap with conditions such as lateral medullary infarction (a disorder also linked to STN hyperintensity)11,12; integrating STN imaging with VZV serology or cerebrospinal fluid (CSF) testing may thus refine differential diagnosis in ambiguous scenarios.
Although the age difference between groups was borderline significant (p = 0.149), multivariate logistic regression identified age as an independent predictor of STN hyperintensity (OR = 1.06, 95% CI = 1.006–1.116, p = 0.030). This finding suggests that age-related declines in immune function and impaired neuronal repair capacity may increase vulnerability to VZV-induced STN injury, 13 although its clinical significance requires validation in larger cohorts. Multivariate analysis further identified the subacute phase as another independent predictor of STN hyperintensity. Notably, the detection rate of STN lesions reached 94.4% in the subacute phase (30–90 days) compared to only 48.0% in the acute phase (< 30 days). This difference may reflect the several-week window required for anterograde transaxonal spread of VZV from the trigeminal ganglion to the STN, such that STN involvement in the acute phase is often too early to be detected by conventional MRI. In the chronic phase (> 12 months), the detection rate drops to 10.0%, a phenomenon potentially explained by either resolution of VZV-induced inflammation following antiviral therapy 14 or reduced T2 relaxation time due to astrocyte activation. 15 These results redefine STN hyperintensity as a subacute-phase-specific marker (rather than a general “early-stage” indicator), providing actionable guidance for clinical imaging timing: MRI performed during the subacute phase maximizes the detection of STN lesions in TZAN patients.
The present study compared the impact of STN lesions on efficacy of treatment in TZAN. Patients in the STN-NS group exhibited superior short-term therapeutic outcomes at discharge, including lower NRS scores (2 (1, 3) vs. 3 (2, 4), p = 0.042) and a higher excellent response rate (38.5% vs. 19.7%, p = 0.036), whereas no significant differences in long-term efficacy were observed at other follow-up time points (3 and 6 months) between the STN-NS and STN-HS groups. Consistent with this, logistic regression analysis revealed no significant correlation between STN hyperintensity and long-term therapeutic effects. Previous studies have demonstrated that microglia in the caudal subnucleus of the STN are activated during tissue injury and inflammatory responses, with their hyperreactivity playing a crucial role in the initiation and maintenance of chronic orofacial pain.16,17 We thus hypothesize that VZV invasion of the STN induces microglial activation, which in turn activates astrocytes, enhances the excitability of nociceptive neurons, and promotes pain progression, 18 ultimately leading to poorer short-term efficacy in patients with STN lesions. Systemic treatment effectively inhibits microglial activation, thereby attenuating its impact on therapeutic outcomes over time. 19 Of critical importance, the chronic phase emerged as the sole independent predictor of poor prognosis (OR = 6.55), consistent with the well-established refractory nature of PHN.20,21 This finding suggests the potential necessity of early intervention during the subacute phase, via targeted therapies (e.g. antiviral agents combined with anti-inflammatory drugs) to mitigate STN inflammation and prevent central sensitization.
This study has several limitations that warrant acknowledgment. First, its retrospective design may introduce selection bias, as only TZAN patients with moderate-to-severe pain and typical skin lesions were included; future prospective studies should therefore incorporate milder cases as well as zoster sine herpete (rash-negative) patients to enhance generalizability. Second, imaging assessments were limited to conventional MRI, with no dynamic imaging to track the evolution of STN signals over time; repeated MRI scans from the subacute to chronic phases could clarify the persistence and reversibility of STN lesions. Due to the insufficient sample size, quantitative analysis of STN hyperintensity signal intensity was not performed in this study; STN hyperintense lesions exhibit signal strength variability (e.g. faint lesions in Figure 2c), and, although the signal intensity may be associated with the severity of viral infection and inflammatory response, direct clinical evidence is currently lacking. Third, mechanistic insights are constrained by the lack of CSF VZV DNA testing and STN cytokine profiling, which would help validate the direct association between VZV and STN damage. Finally, sleep quality was evaluated using a simplified scale; integrating comprehensive tools such as the SF-36 or DN4 scales (22) in future studies would provide more robust assessments of quality of life and neuropathic pain characteristics.
Conclusions
In conclusion, STN lesions exhibit high specificity (99.0%) for TZAN and thus serve as a valuable auxiliary diagnostic indicator, particularly for atypical TZAN cases. Age and the subacute phase are key risk factors for STN hyperintensity, supporting the potential of STN hyperintensity as a subacute-phase imaging marker for TZAN. While STN lesions influence short-term therapeutic efficacy in TZAN, they do not affect long-term prognosis. Critically, the chronic phase of TZAN predicts poor treatment outcomes, highlighting the necessity of early intervention during the subacute phase to optimize patient outcomes. More prospective dynamic studies are needed to establish the prognostic role of subacute STN-HS and their role in guiding treatment to potentially decrease the incidence of trigeminal PHN.
Article highlights
STN lesions on T2WI are highly specific (99.0%) for diagnosing TZAN.
STN hyperintensity is most prevalent in elderly patients during the subacute phase.
STN lesions are associated with poorer short-term, but not long-term, treatment efficacy.
The chronic phase of TZAN is an independent predictor of poor prognosis.
Supplemental Material
sj-docx-1-cep-10.1177_03331024261435927 - Supplemental material for Spinal trigeminal nucleus lesions in trigeminal zoster-associated neuralgia: A retrospective cohort study on diagnostic value and prognostic factors
Supplemental material, sj-docx-1-cep-10.1177_03331024261435927 for Spinal trigeminal nucleus lesions in trigeminal zoster-associated neuralgia: A retrospective cohort study on diagnostic value and prognostic factors by Lina Wang, Yang Chen, Mingrui Li, Yin Dong, Jun-nan Wang and Tao Sun in Cephalalgia
Footnotes
Ethical considerations
This retrospective cohort study was approved by the Ethics Committee of Shandong Provincial Hospital Affiliated to Shandong First Medical University (Approval No.: SWYX: 2025-076) and conducted in accordance with the principles of the Declaration of Helsinki. Due to the retrospective nature of the study, written informed consent from patients was waived by the Ethics Committee.
Consent to participate
Verbal informed consent was obtained and documented during telephone follow-up for the 6-month outcome assessment, and all patients agreed to the use of their anonymized clinical and imaging data for research purposes.
Author contributions
LW ,YC and ML: Responsible for data collection, statistical analysis, and drafting of the manuscript; YD and JnW: Participated in patient screening, clinical data verification, and follow-up management; TS: Conceptualization and design of the study, supervision of data analysis, revision of the manuscript for important intellectual content, study supervision, ethical approval application, and final approval of the submitted version.
Funding
The authors disclosed receipt of the following financial support for the research, authorship, and/or publication of this article: This study was supported by the Shandong Provincial Natural Science Foundation (ZR2021QH060) and the Shandong Provincial Medical and Health Science and Technology Development Plan Project (202109010812).
Declaration of conflicting interests
The authors declared no potential conflicts of interest with respect to the research, authorship and/or publication of this article.
Data availability statement
All data are stored in the medical record system of Shandong Provincial Hospital Affiliated to Shandong First Medical University and will be shared in compliance with ethical and legal regulations, ensuring the protection of patient privacy.
Supplemental material
Supplemental material for this article is available online.