
Abstract
Background
Vagus nerve stimulation (VNS) was recently found to inhibit cortical spreading depression (CSD), the underlying mechanism of migraine aura, through activation of the nucleus tractus solitarius (NTS), locus coeruleus (LC) and dorsal raphe nucleus (DRN). The molecular mechanisms underlying the effect of VNS on CSD in these nuclei remain to be explored. We hypothesized that VNS may activate glutamate receptor-mediated tropomyosin kinase B (TrkB) signaling in the NTS, thereby facilitating the noradrenergic and serotonergic neurotransmission to inhibit CSD.
Methods
To investigate the role of TrkB and glutamate receptors in non-invasive VNS efficacy on CSD, a validated KCl-evoked CSD rat model coupled with intra-NTS microinjection of selective antagonists, immunoblot and immunohistochemistry was employed.
Results
VNS increased TrkB phosphorylation in the NTS. Inhibition of intra-NTS TrkB abrogated the suppressive effect of VNS on CSD and CSD-induced cortical neuroinflammation. TrkB was found colocalized with glutamate receptors in NTS neurons. Inhibition of glutamate receptors in the NTS abrogated VNS-induced TrkB activation. Moreover, the blockade of TrkB in the NTS attenuated VNS-induced activation of the LC and DRN.
Conclusions
VNS induces the activation of glutamate receptor-mediated TrkB signaling in the NTS, which might modulate serotonergic and norepinephrinergic innervation to the cerebral cortex to inhibit CSD and cortical inflammation.
Keywords
Introduction
Migraine is a highly prevalent, incapacitating neurological disorder with a global impact. Non-invasive vagus nerve stimulation (VNS) is an approved therapeutic approach for both acute and preventive treatment, sanctioned by the US Food and Drug Administration for migraine in both adults and adolescents. Despite its proven clinical efficacy, the molecular mechanisms by which VNS mitigates migraine remain incompletely understood. Previous findings from our studies revealed that VNS inhibits susceptibility to cortical spreading depression (CSD) (1–3), a neuronal and glial depolarization propagating wave underlying the mechanism of migraine aura and triggering headache (4). Studies in rats employing anterograde or retrograde labeling have delineated the termination of vagal afferents within the nucleus tractus solitarius (NTS), which subsequently projects to the locus coeruleus (LC) and dorsal raphe nucleus (DRN) (5,6). Notably, VNS increases norepinephrine and serotonin release (7). Experimental depletion of these neurotransmitters attenuates the suppressive effect of VNS on CSD (3), indicating their potential roles in VNS efficacy against migraine. Yet, the specific mechanisms by which VNS activates neurons in the NTS, thereby activating serotonergic and norepinephrinergic pathways, remains unexplored.
The NTS is the central nucleus for coordinating baroreflex function via autonomic regulation. Impaired baroreflex response and autonomic dysfunction during and between headache attacks have been reported in migraine patients (8), suggesting the potential involvement of the NTS in migraine pathophysiology. Brain-derived neurotrophic factor (BDNF), a neuromodulator, modulates neuronal firing and sensitivity to synaptic input (9). BDNF and its receptor, tropomyosin receptor kinase-B (TrkB), are expressed in the NTS (10). The binding of BDNF to TrkB triggers dimerization and autophosphorylation, activating downstream signaling pathways such as mitogen-activated protein kinase and phosphoinositide 3-kinase/protein kinase B. Microinjection of BDNF into the NTS in rats elicits an excitatory response akin to glutamate (11), the neurotransmitter released from vagal afferents over the NTS, suggesting a crucial role for TrkB in NTS neuronal activity. Additionally, VNS rapidly activates BDNF-TrkB signaling in the hippocampus and cerebral cortex (12), with TrkB activity associated with antidepressant effects (13), suggesting a potential role for TrkB in mediating VNS efficacy. A previous study employing two-photon fluorescence imaging observed dynamic changes in BDNF-TrkB signaling within single spines of hippocampal CA1 pyramidal neurons. This study demonstrated the mediation of autocrine BDNF-TrkB signaling by N-methyl-
In the present study, we aimed to investigate the role of TrkB in non-invasive VNS efficacy for suppressing KCl-evoked CSD and to further test our hypothesis that glutamate receptor-mediated TrkB activation connects the NTS-LC/DRN axis, thereby contributing to the inhibition of CSD.
Methods
Ethics
All experimental protocols received approval from the Institutional Animal Care and Use Committee of National Yang Ming Chiao Tung University, Taiwan. Animal care complied with the Guide for the Care and Use of Laboratory Animals.
Animals
In total, 102 adult male Sprague–Dawley rats (200–300 g) supplied by BioLASCO (Taipei, Taiwan) were used in the presernt study. Rats were housed in a temperature- and humidity-controlled animal room (22 ± 1°C and 40–70% relative humidity) under a 12:12 hour light/dark photocycle and provided with standard rodent chow and water ad libitum before commencement of the study.
General surgery
Under an anesthetic induction dose of pentobarbital (50 mg/kg, intraperitoneal injection), tracheal intubation and cannulation of the femoral artery and vein were performed. Rats were mechanically ventilated (70% N2:30% O2, SAR-830/AP; CWE, Ardmore, PA, USA) via the trachea. Anesthesia was maintained via intravenous infusion of pentobarbital (10–20 mg/kg/h). Systemic arterial pressure (SAP; mmHg) was monitored through femoral artery cannulation connected to a pressure transducer (T844; ADInstruments, Castle Hill, NSW, Australia). Heart rate (HR; beats/min) was derived from SAP signals. Arterial blood gas data and pH values were measured using a portable analyzer (i-STAT; Abbott Point of Care Inc, Princeton, NJ, USA). Rectal temperature was maintained at 37 ± 1°C using a thermostatically controlled heating pad throughout the surgery and recording session.
Non-invasive VNS
The VNS paradigm followed the protocol described in our previous studies (1–3). Briefly, non-invasive VNS was delivered by attaching two disc electrodes (6 mm in diameter) of a hand-held stimulator for rats (a 5 kHz sine wave per millisecond repeating at a rate of 25 Hz; gammaCore; electroCore Medical, LLC, Basking Ridge, NJ, USA) to shaved, intact skin where the cervical vagal nerve was located. Conducting gel was applied to the disc electrodes to enhance the conductivity. Stimulation intensity was set at 24.4 V for two minutes.
CSD susceptibility
As previously described (1–3), a craniotomy was performed, involving two burr holes: one for KCl (1
Microinjection into NTS
Test agents listed in Table 1 were bilaterally injected into the NTS (20 μl at each site) following an occipital craniotomy. The coordinates were: AP +0.5 mm from the obex, ML ±0.5 mm from the midline and DV: −0.5 mm from the dorsal medullary surface. The injection rate was 0.5 nl/s. After the experiment, the medulla was fixed in 4% paraformaldehyde and dehydrated with a 30% sucrose solution. Coronal sections (20 μm) were prepared and counterstained with 1% Cresyl violet (#ab246817; Abcam, Cambridge, UK). The injection sites were visualized under an optical microscope (BX63; Olympus, Tokyo, Japan; field of view at 100× magnification). Supplementary Figure 1 displays a representative image showing the needle track within NTS, captured using MShot software (Guangzhou Micro-shot Technology Co., Guangzhou, China). In our preliminary testing, agents were co-microinjected with dye to confirm accurate localization within the NTS.
Test agents and antibodies.

IF, immunofluorescence; IHC, immunohistochemistry.
Western blot
At the time point of tissue harvest, anesthetized rats were transcardially perfused with ice-cold normal saline. Strips of the cerebral cortex (AP 0–2 mm) or NTS (AP −13.6 to −14.6 mm) were immediately harvested and stored at −80°C, following a previously established protocol (2,15). Total protein extraction involved tissue homogenization, cell lysis in lysis buffer (#786-181; Gbioscience, St Louis, MO, USA) with protease inhibitor (#04693132001; Roche, Basel, Switzerland) and phosphatase inhibitor (#04906837 001; Roche), followed by centrifugation (10,000 g at 4°C for 15 minutes) and supernatant collection. Protein concentration was determined using the Bradford assay (16). The protein samples were denatured by heating at 110°C for 10 minutes in 4 × Laemmli sample buffer and subjected to 10–12% polyacrylamide gel electrophoresis (40 μg/lane). Wet electroblotting (350 mA, 1.5–2 hours at 4°C) transferred the separated protein onto a polyvinylidene difluoride membrane. Afterward, the membrane was blocked with 5% fat-free milk (1 h at room temperature (RT)), incubated with primary antibodies (12–16 hours at 4°C) (Table 1), rinsed with tris-buffered saline with 0.1% Tween-20 and then incubated with horseradish peroxidase (HRP)-conjugated secondary antibodies (1 hour at RT) (Table 1). Finally, the membrane was incubated in ECL reagent (#WBKLS0500; Millipore, Burlington, MA, USA). The immunoblots were detected using a Luminescence/Fluorescence Imaging System (Imager 680; GE Healthcare, Amersham, UK) and subsequently quantified using ImageJ (NIH, Bethesda, MD, USA).
Immunohistochemistry
At the time point of tissue harvest, anesthetized rats were transcardially perfused with 4% paraformaldehyde. The procedure of examining c-Fos immunoreactivity followed a previously established method (2). Briefly, the brain was rapidly removed and post-fixed with 4% paraformaldehyde at 4°C for 24 hours. Following fixation, the brain was dehydrated with 30% sucrose. Coronal sections (20 μm) of DRN (AP −7.8 mm to −8.3 mm) and trigeminal nucleus caudalis (TNC, from bregma −15 mm to spinal cord C1 level) were collected. The endogenous peroxidase was quenched with a 3% hydrogen peroxide solution (10 min at RT). Subsequently, sections underwent a series of steps: blocking with phosphate-buffered saline (PBS) containing 3% normal goat serum, 0.375% gelatin and 0.2% Triton-X-100 for 30 minutes at RT, followed by incubation with rabbit anti-c-Fos primary antibody (Table 1) diluted in 1% normal goat serum with 0.2% Triton-X-100 in PBS for 24–48 hours at 4°C. After washing in three changes of PBS, the sections were incubated with biotinylated goat anti-rabbit IgG (#PK-6101; Vector Laboratories, Burlingame, CA, USA; 1 hour at RT), followed by incubation with avidin/biotin-based peroxidase system (#PK-6101; Vector Laboratories; 0.5 hours at RT). The c-Fos immunoreactivity was labeled with a 3,3′-diaminobenzidine/nickel substrate working solution (#SK-4100; Vector Laboratories). Sections were mounted onto silane-coated slides and dehydrated in a series of ethanol (50, 75, 95 and 100%), cleared with xylene and coverslipped using mounting medium (#06522; Sigma-Aldrich, St Louis, MO, USA). Image acquisition was performed within an area of 560 × 400 μm2 at 100× magnification field of view under a BX63 optical microscope (Olympus, Tokyo, Japan) and MShot image analysis system (MD60). In the DRN, c-Fos immunoreactivity was analyzed in three to five sections (interval: 120 μm) and averaged. In the TNC (lamina I and II, from the caudal medulla to spinal cord C1 level) ipsilateral to the CSD induction site, c-Fos immunoreactivity was averaged across seven to nine random sections. The mean count of positive cells was determined from three independent stainings (i.e. n number of each group), as specified where appropriate. ImageJ software was utilized for image analysis, applying a uniform threshold across all images within corresponding experimental sets.
Immunofluorescence staining
Immunofluorescence staining was used to simultaneously label the expression of two or three target proteins. Coronal sections (20 μm) of the NTS (AP −13.6 mm to −14.6 mm) and the LC (AP −9.3 mm to −10.3 mm) were prepared and blocked with the previously mentioned blocking buffer: PBS containing 3% normal goat serum, 0.375% gelatin and 0.2% Triton-X-100, as described earlier. Following blocking, the sections were incubated with primary antibodies (Table 1) for 24–48 hours at 4°C, followed by rinse with PBS and incubation with secondary antibodies (Table 1) for 2 hours at RT. The sections were counterstained and mounted with antifade mounting medium containing 4′,6-diamidino-2-phenylindole (DAPI) (#H-1500; Vector Laboratories) under coverslips. We captured images displaying the expression of the target proteins in the commissural, medial and lateral subnuclei of the NTS, as well as the calcitonin gene-related peptide (CGRP)-positive cells within the central regions of five trigeminal ganglion (TG) sections (at a section interval of 120 μm). These images were taken within a square area of 200 × 200 μm2 using a field of view at 400× (for CGRP) or 600× (for target proteins in the NTS) magnification under a laser scanning confocal microscope (FV1000; Olympus). Image analysis was conducted with a consistent threshold applied to all images within the same sets of experiments using ImageJ software.
Statistical analysis
All rats were randomized into experimental groups and maintained at normal physiology (Table 2), and no animal was excluded as a result of abnormal blood pressure, heart rate or arterial blood gas. The minimal sample size needed to achieve a power of 0.8 was calculated using G*Power software (17). Data analysis was carried out in a blinded fashion. Statistical analysis was performed using Prism, version 7 (Graphpad Software Inc., San Diego, CA, USA). A Shapiro–Wilk test was used to assess whether continuous data followed a normal distribution. Two-tailed unpaired t-tests or one-way analysis of variance (ANOVA) followed by post-hoc Tukey’s or Bonferroni tests were used when data sets passed the normality test. Non-normally distributed variables were analyzed using the Mann–Whitney U-test or Kruskal–Wallis test followed by post-hoc Dunn’s test. CSD frequency within specific time intervals (0–30 minutes and 31–60 minutes post-CSD induction) was analyzed using the restricted maximum likelihood method followed by multiple comparisons, corrected by the two-stage linear step-up procedure of Benjamini, Krieger and Yekutieli (18). Data are displayed as whisker box plots (whisker: full range; box: interquartile range; line: median; +: mean) with all individual data points shown. Statistical tests corresponding to each data set, as well as detailed statistics, are indicated where appropriate, as well as in Supplementary Table 1. p < 0.05 was considered statistically significant.
Animal physiology.

Data are the mean ± SD. No significances among groups.
Results
VNS inhibits CSD and CSD-induced cortical neuroinflammation via TrkB-dependent mechanism in the NTS
We initially assessed TrkB activation following VNS treatment by examining the expression levels of its extensively studied autophosphorylation sites at Tyr705, Tyr816 and Tyr515 (12). After VNS, TrkB phosphorylation at Tyr816 rapidly increased by 77% within 0.5 hours, whereas overall TrkB expression (Figure 1a) and phosphorylation at Tyr515 and Tyr705 residues remained unaffected (supplementary Figure 2a,b). Immunohistochemistry revealed a similar rapid increase in TrkB phosphorylation within the NTS at 0.5 hours post-VNS, returning to basal levels by 2 hours (Figure 1b). Double immunostaining images revealed that neuronal p-TrkB constituted 41.9% of all p-TrkB+ cells and 5.7% of all neurons at baseline. Following VNS, these percentages increased to 55.9% for p-TrkB+ cells and 37.7% for neurons, with the number of NeuN+ cells remaining constant (Figure 1b). Subnucleus analysis across the NTS (commissural, medial or lateral subnuclei) showed increased TrkB phosphorylation following VNS (supplementary Figure 2c), suggesting that VNS induced widespread neuronal TrkB activation rather than restricted to a specific subnucleus. Further identification revealed that some TrkB+ neurons activated by VNS were glutamatergic, whereas little to no expression of p-TrkB+ was observed in GABAergic neurons (supplementary Figure 2d,e). Additionally, we assessed the expression of BDNF, the ligand of TrkB, after VNS. Immunofluorescence staining showed that BDNF was primarily located in neurons, and its expression level remained unchanged within 2 hours after VNS (supplementary Figure 2f).

Vagus nerve stimulation (VNS) rapidly activates TrkB in the nucleus tractus solitarius (NTS). (a) Representative western blot gels and whisker box plots (whisker: full range; line: median; cross: mean) demonstrate the increase in TrkB phosphorylation at Tyr816 residue in the NTS following a 0.5 hour VNS treatment (24.4 V for 2 minutes), whereas the level of TrkB protein remained unchanged. n = 6; *p = 0.0005 for p-TrkB and p = 0.3036 for TrkB assessed by unpaired t-test. (b) Immunofluorescence staining images show temporal changes in TrkB phosphorylation at Tyr816 residue in the NTS after VNS. VNS activated TrkB at 0.5 hours (*p = 0.02 versus sham control), returning to basal level at 2 hours (#p = 0.0033 versus VNS 0.5 hour group; p = 0.9357 versus sham control). VNS did not significantly impact on NeuN+ cell count (p = 0.5040). n = 4; Statistical analysis was performed using one-way ANOVA followed by a post-hoc Tukey’s test. Lower right: showing the proportions of p-TrkB+ NeuN+ (yellow proportion in the bar graph), p-TrkB+NeuN− (green proportion in the bar graph) and p-TrkB− NeuN+ (pink proportion in the bar graph) in sham, VNS 0.5 hour and VNS 2 hour groups. Scale bar = 50 μm.
Next, we addressed whether TrkB activation in the NTS contributed to VNS efficacy on CSD suppression. VNS reduced CSD frequency, whereas pretreatment with ANA12 (4 pmol) via bilateral NTS microinjection significantly abrogated VNS efficacy in reducing KCl-evoked CSD frequency compared to controls (i.e. the group receiving vehicle pretreatment plus VNS) (Figure 2). We further conducted separate analyses of CSD frequency within intervals of 0–30 minutes and 31–60 minutes to assess the potential impact of temporal factors on VNS efficacy and the effectiveness of TrkB blockade. The results from both intervals displayed consistent trends (see supplementary Figure 3), suggesting that VNS efficacy on CSD and the effect of TrkB blockade appeared to persist consistently throughout the recording duration, irrespective of the specific time intervals examined.
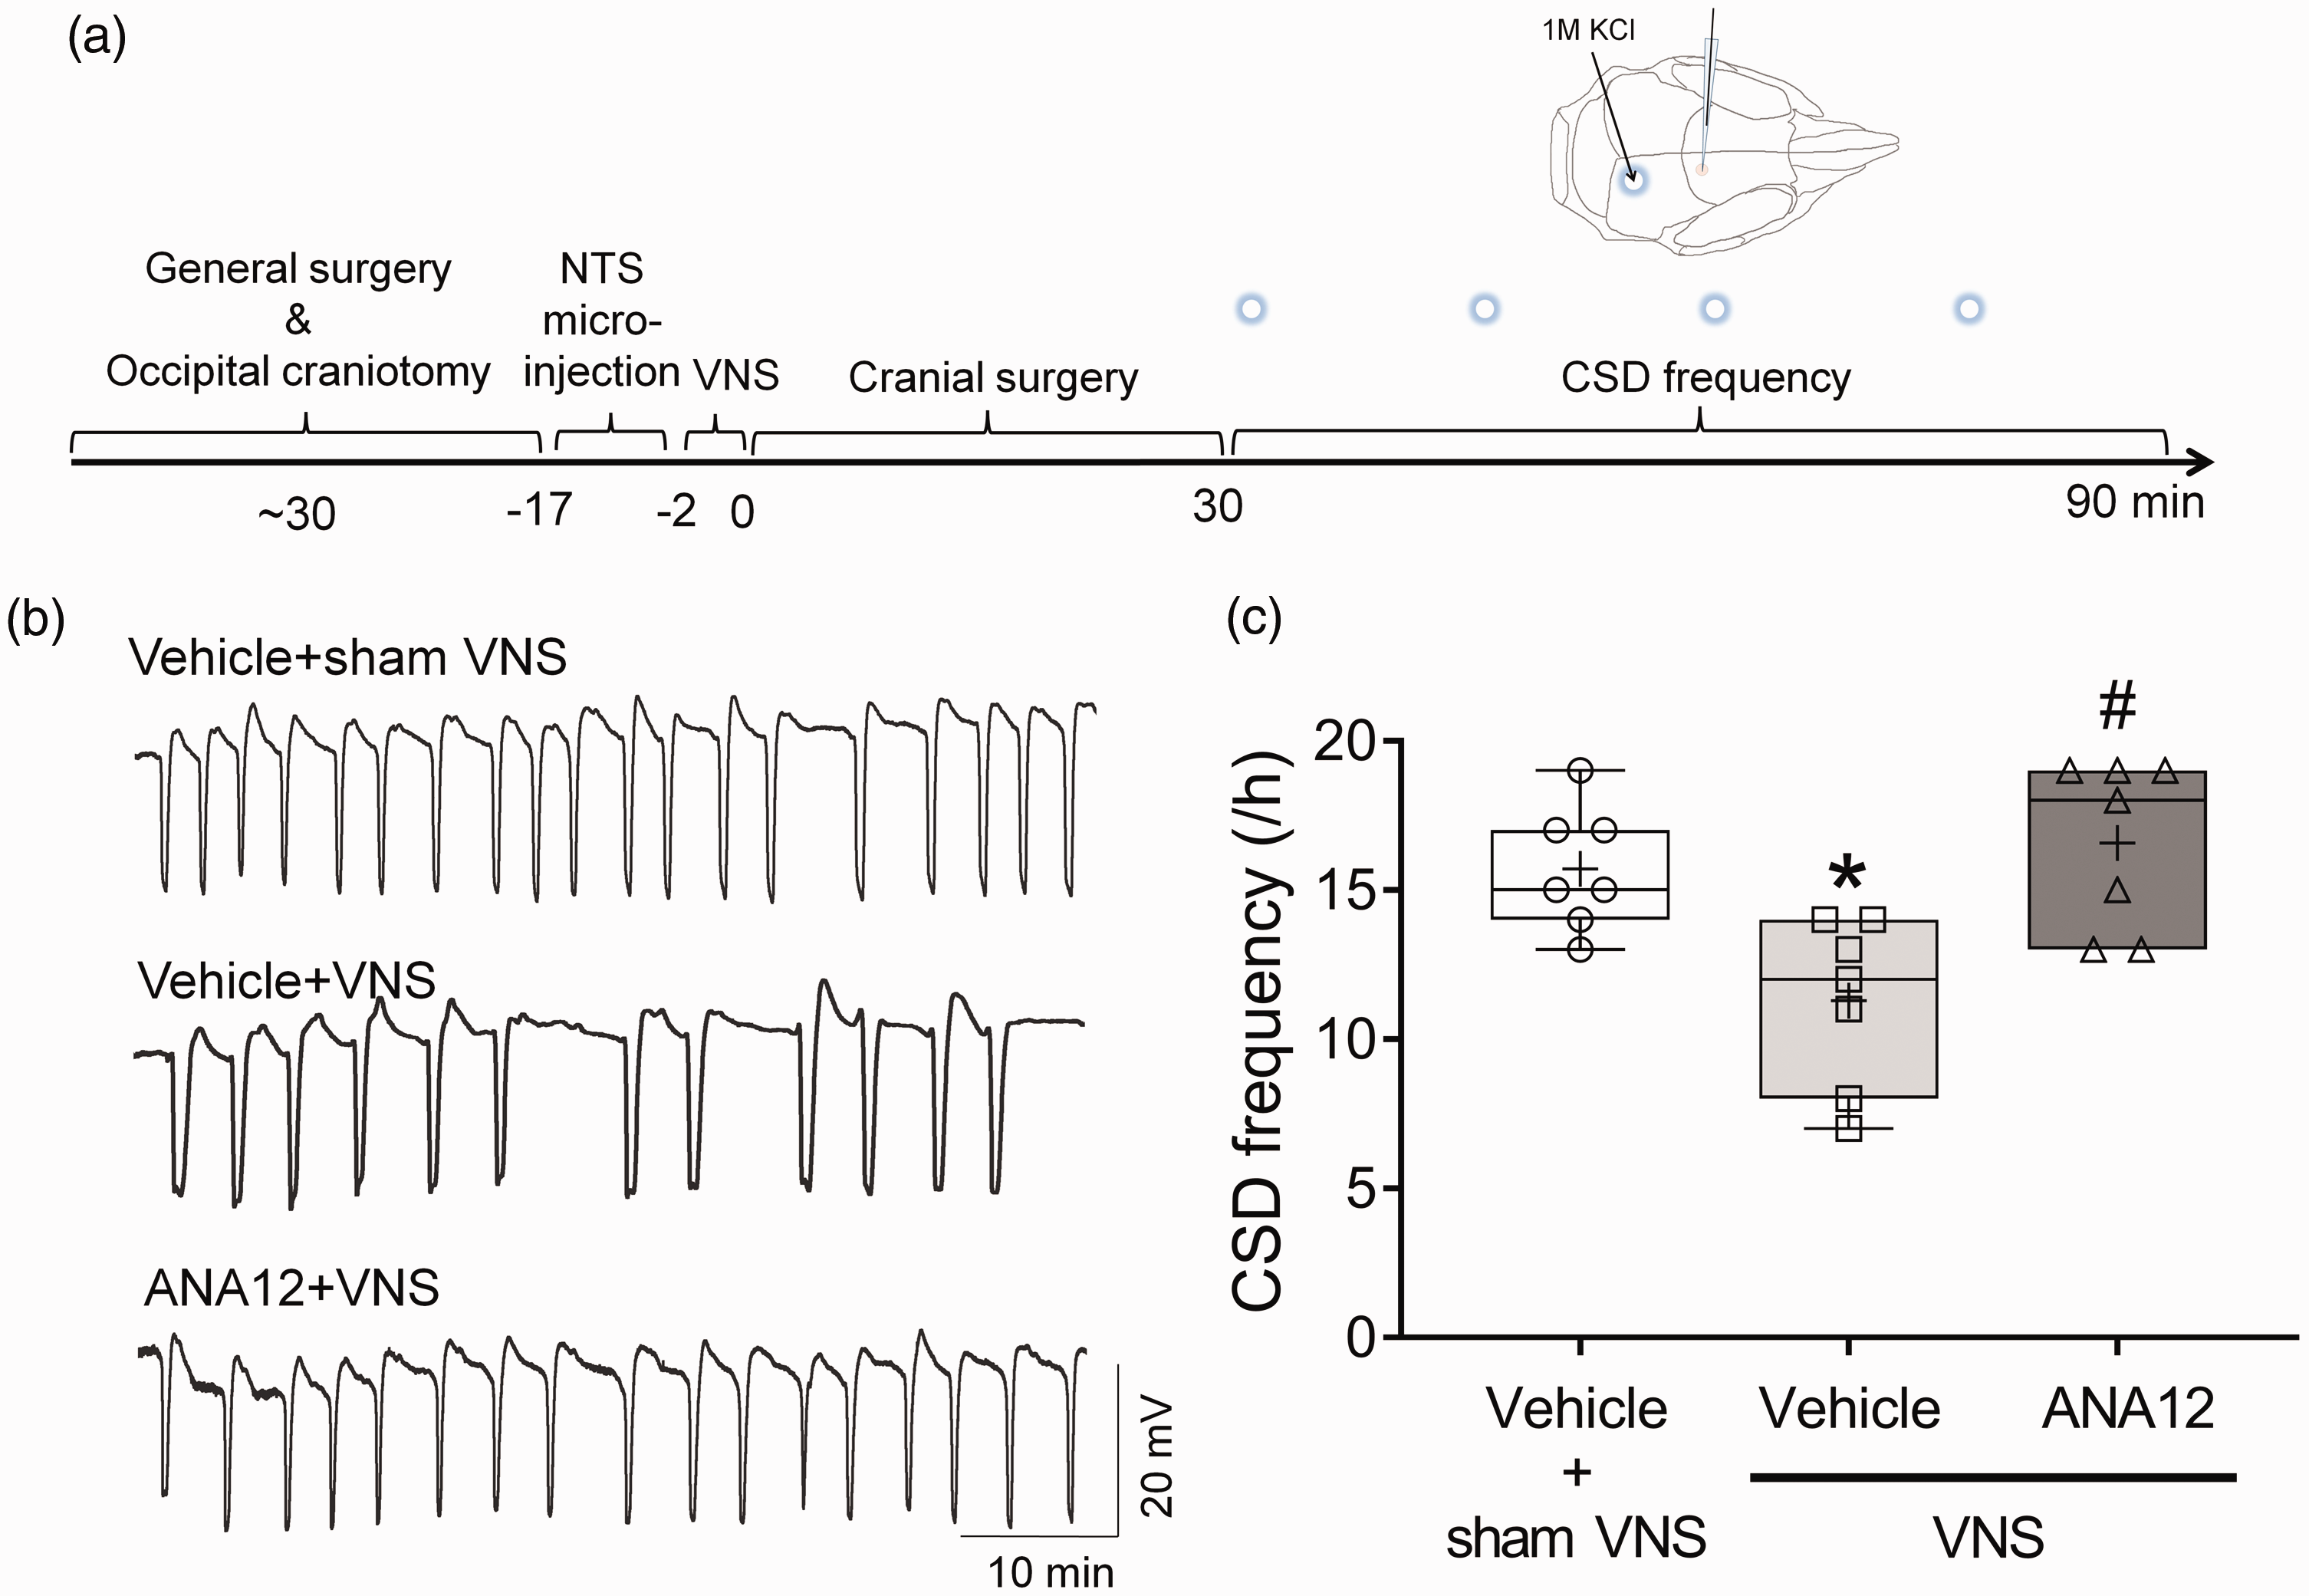
Inhibition of intra-nucleus tractus solitarius (NTS) TrkB abrogates vagus nerve stimulation (VNS) efficacy on cortical spreading depression (CSD) suppression. (a) Experimental timeline (b) The frequency of topical 1
We previously demonstrated that CSD could activate cortical neuroinflammation (15), which might mediate CSD-induced trigeminovascular activation and play a critical role in linking aura to headache. Here, we confirmed that CSD induced upregulation of cortical cyclooxygenase-2 (Cox-2) (Figure 3b) and downregulation of high mobility group box 1 (HMGB1), a nuclear protein released from cells after CSD (Figure 3c). Additionally, VNS following pretreatment with a vehicle significantly prevented CSD-induced cortical inflammation, which was reversed by pretreatment with intra-NTS microinjection of ANA12 (Figure 3d,e). These results suggest that TrkB activation in the NTS contributed to the suppressive effect of VNS on CSD-induced cortical inflammation.

Inhibition of intra-nucleus tractus solitarius (NTS) TrkB abrogates vagus nerve stimulation (VNS) efficacy on cortical spreading depression (CSD)-induced cortical neuroinflammation. (a) Experimental timeline. (b) Western blot analysis shows that CSD induced upregulation of cortical Cox-2 protein level (n = 3; *P = 0.0422, unpaired Student’s t-test) and (c) a concurrent downregulation of HMGB1 protein level (n = 3; *P = 0.0007, unpaired Student’s t-test). (d) Subsequent analysis shows that non-invasive VNS (24.4V for two minutes) suppressed CSD-induced cortical Cox-2 expression in rats administered intra-NTS microinjection of vehicles (artificial cerebrospinal fluid with 0.8% dimethylsulfoxide), which was prevented by pre-injection with the selective TrkB inhibitor ANA12 (4 pmol). (n = 7; *P = 0.0067 versus vehicle + sham stimulation + CSD group; #p = 0.0032 versus vehicle + VNS + CSD group; Kruskal–Wallis test followed by a post-hoc Dunn’s test. (e) By contrast, VNS mitigated the decreased cortical HMGB1 expression following CSD in rats administerd intra-NTS microinjection of vehicles. Notably, this mitigation was impeded by pre-injection with the selective TrkB inhibitor ANA12 (4 pmol). (n = 8; *p = 0.0008 versus vehicle + sham stimulation +CSD; #p = 0.0005 versus ANA12 + VNS + CSD group. One-way ANOVA followed by a post-hoc Bonferroni’s test). Protein intensities were normalized against β-actin. Data are presented as whisker box plots (whisker: full range; line: median; cross: mean) with all individual data displayed.
VNS activates TrkB in the NTS through glutamate receptors
Vagal afferents project to NTS using glutamatergic neurotransmission. To investigate whether VNS-activated TrkB in the NTS was mediated by glutamate receptors, we employed immunofluorescence staining to visualize the distribution of NR1 (NMDA receptor subunit1), GluR1 (AMPA receptor subunit 1) and TrkB in the NTS. The merged images showed that TrkB was co-localized with NR1 or GluR1 in the NTS (Figure 4a). Quantitative analysis revealed that, in the NTS, TrkB+ cells constituted 37.7% of all cells (TrkB+ cell/DAPI), with NR1+ cells at 48.7% (NR1+/DAPI) and GluR1+ cells at 33.14% (GluR1+/DAPI) of the total cell population. Furthermore, 35.1% of cells in the NTS were TrkB+/NR1+ cells and 27.43% were TrkB+/GluR1+ cells. In the population of TrkB+ cells, NR1+ cells accounted for 87.4% and GluR1+ cells accounted for 85.1%, respectively. Additionally, 73.3% of NR1+ cells and 87.9% of GluR1+ cells were TrkB+ (Figure 4b). After VNS, NMDAR1 and GluR1 remained unchanged in the commissural, medial and lateral subnuclei of the NTS (supplementary Figure 4). This suggests that VNS had no significant subnucleus-specific effect on glutamate receptor distribution and the proportion of p-TrkB+ and glutamate receptor+ cells in the NTS (Figure 2a,b). The distribution patterns of NMDAR1 and GluR1 (supplementary Figure 4) mirrored those of TrkB (supplementary Figure 2c). Altogether, TrkB+ cells comprised one-third of all cells in the NTS, with a majority co-localized with glutamate receptors. Notably, compared with the sham controls, VNS did not significantly affect the colocalization of TrkB and glutamate receptors in the NTS (Figure 4a,b), nor did it impact the expression of NMDAR1 and GluR1 (supplementary Figure 4).
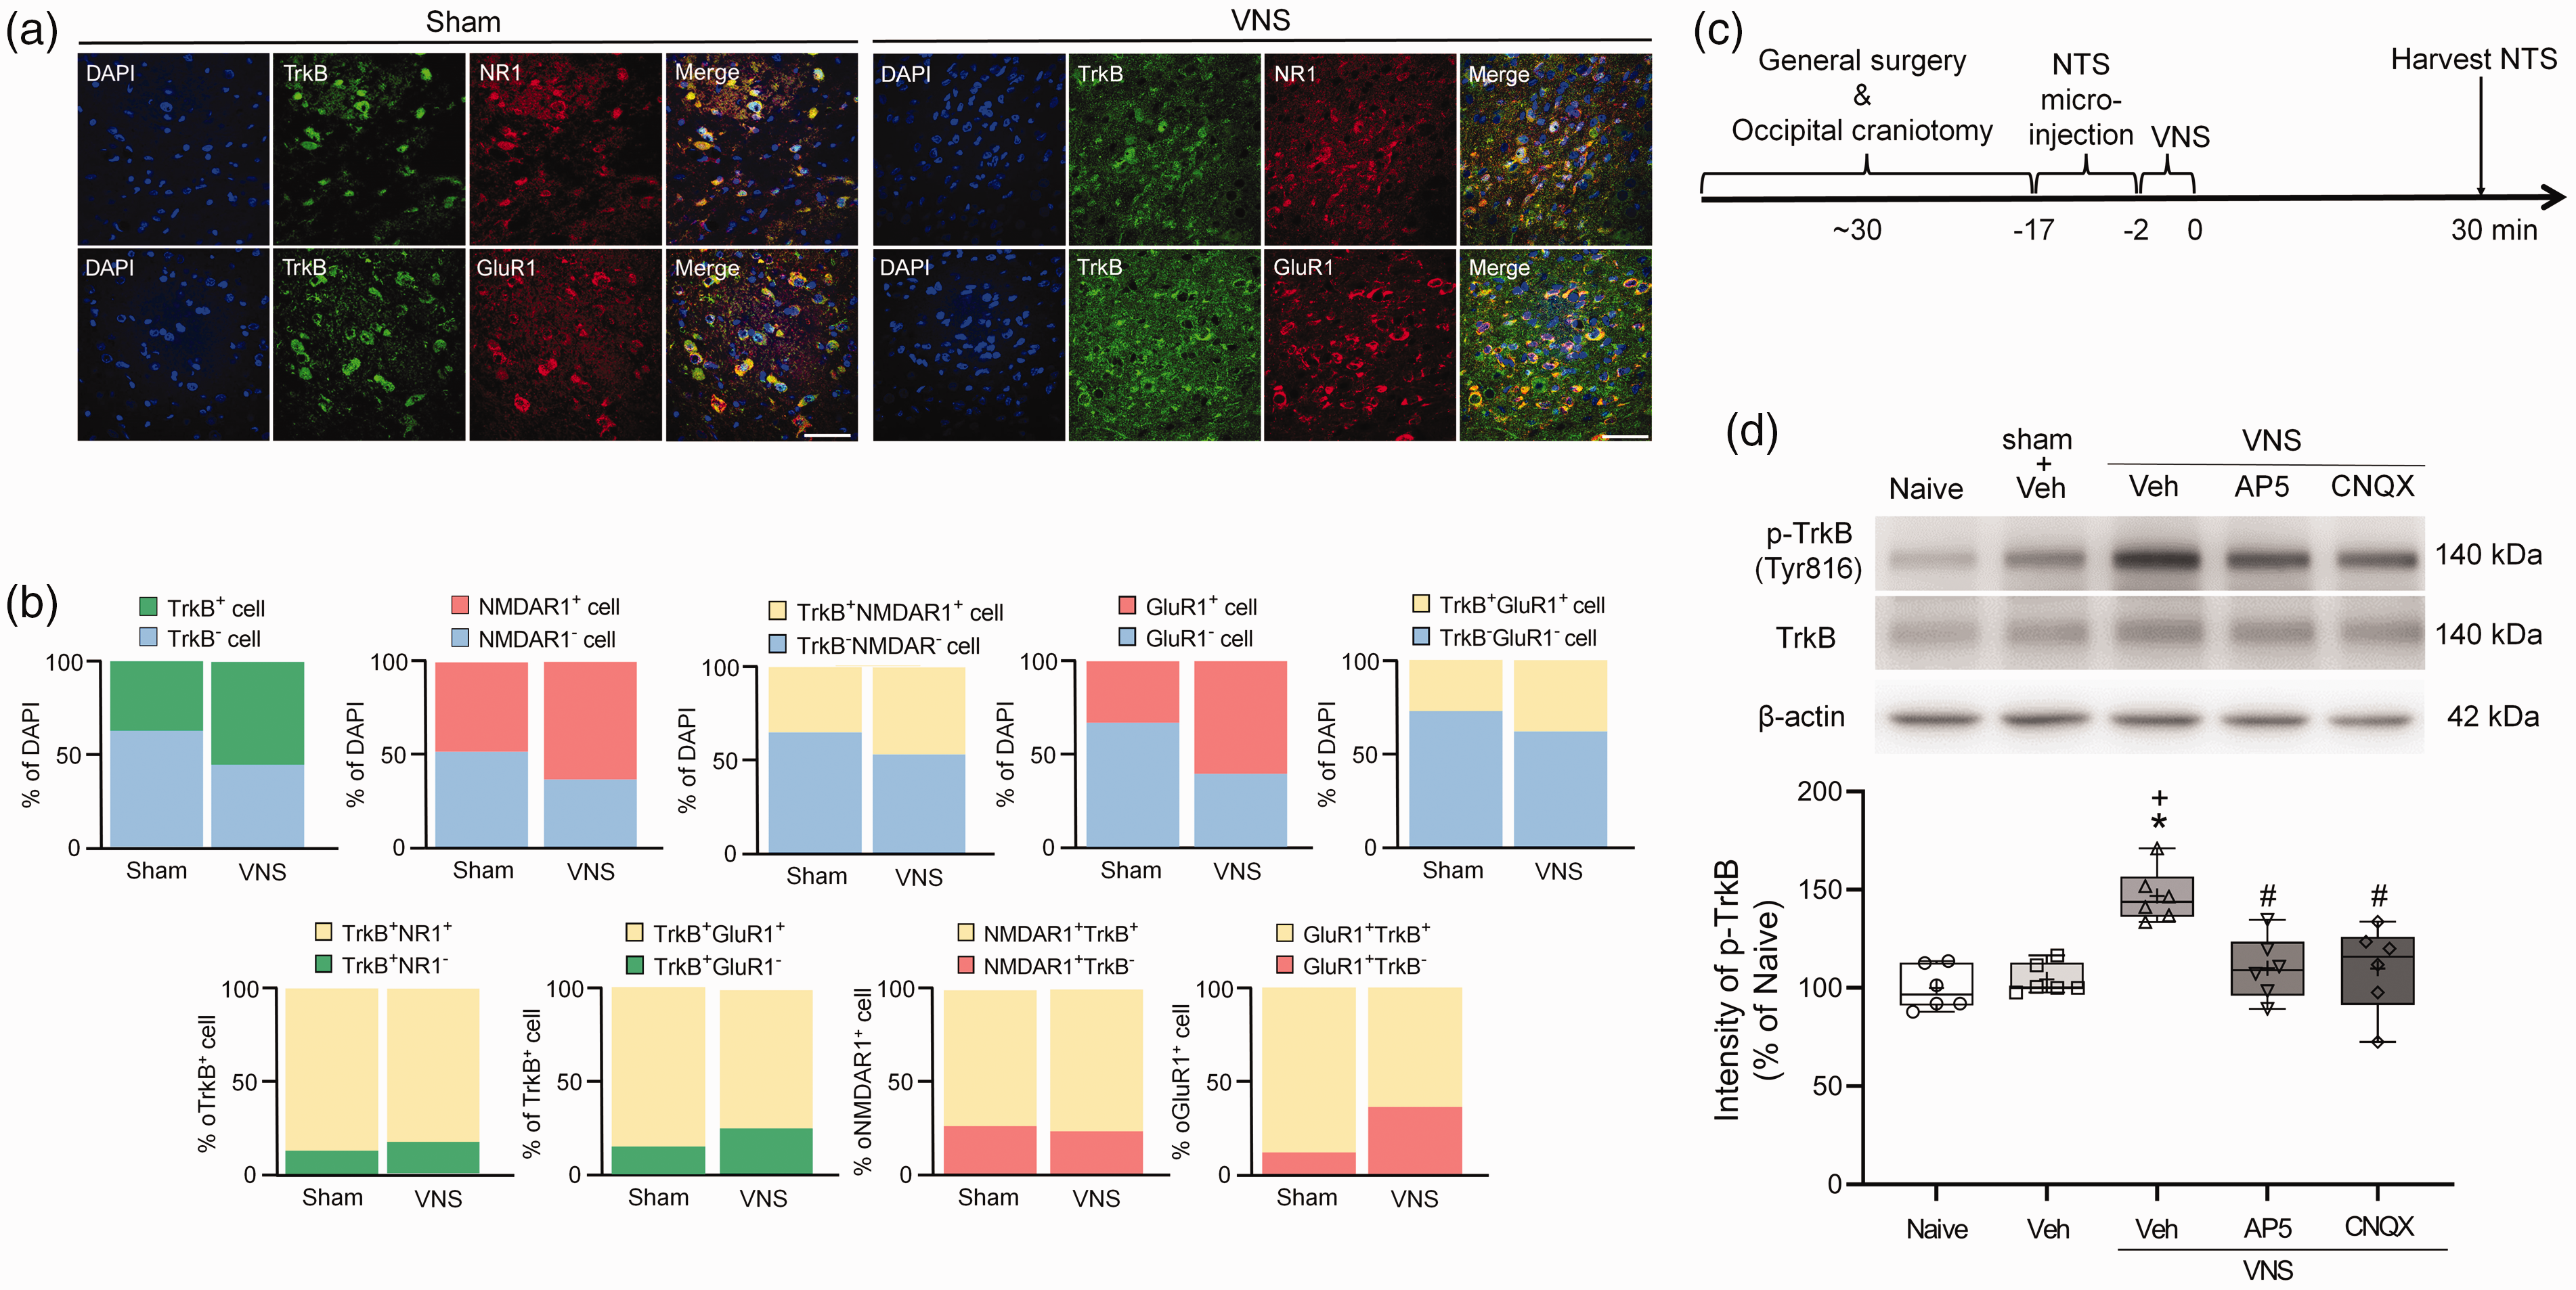
Vagus nerve stimulation (VNS) activates TrkB in the nucleus tractus solitarius (NTS) via glutamate receptor-dependent mechanism. (a) Representative images depict the co-localization of TrkB (green) with NR1 (NMDAR1, red, upper) or AMPAR (GluR1, red, lower) and the merged images in the NTS of the sham (left) and VNS 0.5 hour group (right). Scale bar = 50 μm. (b) Bar graphs illustrate the expression profiles of TrkB, NMDAR1 and GluR1 in the NTS of the sham and VNS (0.5 hour) group. The proportional bar charts display the proportion of TrkB+, NMDAR1+ and GluR1+ cells to all cells (identified by 4′,6-diamidino-2-phenylindole signal), TrkB+ cells, NMDAR1+ cells or GluR1+ cells. (c) Experimental timeline. (d) Representative western blot gels and whisker box plot (whisker: full range; line: median; cross: mean) show that VNS increased TrkB phosphorylation at Tyr816 reside in the NTS after VNS 0.5 hour (*p = 0.0001 versus naïve control; +p = 0.0004 versus sham stimulation + vehicle group), which was attenuated by bilateral pre-injection of AP5 (NMDA receptor antagonist, 1 nmol) or CNQX (AMPA receptor antagonist, 200 pmol) (#p = 0.0023 for AP5 + VNS versus vehicle + VNS group; #p = 0.0022 for CNQX + VNS versus vehicle + VNS group). n = 6; one-way ANOVA with a post-hoc Bonferroni’s test was used for analysis.
Subsequently, we investigated whether VNS activated TrkB in the NTS via glutamate receptors by pre-injecting AP5 (NMDAR antagonist) or CNQX (AMPAR antagonist) and assessing the impact of glutamate receptors blockade on VNS-increased TrkB phosphorylation at Tyr816 (Figure 4c). VNS increased TrkB phosphorylation, which was attenuated by pretreatment with AP5 or CNQX (Figure 4d), suggesting that VNS-induced TrkB activation in the NTS was mediated by NMDAR and AMPAR.
VNS activates NTS-LC/DRN axis by glutamate receptor-mediated TrkB mechanism
Previous studies have reported that VNS activates neurons in the LC and DRN (19,20) and triggers norepinephrine and serotonin release, both contributing to VNS efficacy in suppressing CSD (3). Immunohistochemistry confirmed that VNS indeed activated neurons in the LC and DRN 2 hours after VNS (supplementary Figure 5). We then investigated whether VNS activated TrkB+ cells in the NTS, which in turn projects to the LC and DRN. Intra-NTS microinjection of selective TrkB antagonist ANA12 attenuated VNS-induced c-Fos immunoreactivity in the LC and DRN. Subregion analysis revealed that the majority of the VNS-activated neurons were located in the dorsal LC (Figure 5b). These results supported our hypothesis that VNS activates neurons in the LC and DRN, depending on the activation of TrkB signaling in the NTS.

Vagus nerve stimulation (VNS) activates nucleus tractus solitarius (NTS), which in turn activates neurons in the locus coeruleus (LC) and dorsal raphe nucleus (DRN). (a) Experimental timeline. (b) Representative images and whisker box plots show intra-NTS microinjection of ANA12 (4 pmol, selective TrkB antagonist) abrogated VNS-induced c-Fos expression (red fluorescence) in the LC (green fluorescence, tyrosine hydroxylase-covered area) (n = 3; *p = 0.0324 for c-Fos+ cells in LC per 10000 μm2 by an unpaired t-test; p = 0.8537 for LC area). Subregion analysis showed c-Fos immunoreactivity in the dorsal and ventral LC of Veh + VNS and ANA12 + VNS groups. Two-way ANOVA followed by a post-hoc Tukey’s test showed that only the c-Fos+ cell number in the dorsal LC of Veh + VNS group was higher than that in the ventral LC of the ANA12+VNS group (*p = 0.0212). Intra-NTS microinjection of ANA12 also abolished c-Fos immunoreactivity (black immunoreactivity) in the DRN (n = 3; *p = 0.0407 for c-Fos+ cell in DRN by an unpaired Student’s t-test. Scale bars in immunofluorescence and immunohistochemistry images indicate 50 and 200 μm, respectively. Aq, aqueduct (Sylvius)
Discussion
We have demonstrated that VNS rapidly activates NMDAR- and AMPAR-mediated TrkB in the NTS without observable changes in BDNF expression level. This activation contributes to the effects of VNS efficacy in suppressing CSD, mitigating CSD-induced cortical neuroinflammation, and activating noradrenergic and serotonergic pathways (Figure 6). Our findings suggest that VNS activates glutamate receptor-mediated TrkB signaling in the NTS, potentially modulating serotonergic and norepinephrinergic innervation to the cerebral cortex to inhibit CSD and cortical neuroinflammation.

Schematic diagram showing the mechanisms by which vagus nerve stimulation (VNS) inhibits cortical spreading depression (CSD) and relieves headache. VNS triggers the activation of glutamate receptor-mediated TrkB in the nucleus tractus solitarius (NTS). This activation might project to the locus coeruleus (LC) and dorsal raphe nucleus (DRN), subsequently influencing the serotonergic and norepinephrinergic innervation to the cerebral cortex. As a result, VNS inhibits CSD, mitigates CSD-induced cortical neuroinflammation and subsequently reduces trigeminovascular activation. These mechanisms potentially contribute to the effectiveness of VNS in relieving headaches.
We have demonstrated for the first time that acute VNS induces neuronal TrkB activation in the NTS (Figure 1). Previous studies have reported responses to VNS: increased TrkB phosphorylation in hippocampal neurons within 2 hours (12), elevated BDNF mRNA at 3 hours (21) and BDNF-TrkB signaling activation via increased BDNF protein expression in the hippocampus between 2 and 14 days post-VNS (12,22). Interestingly, our results diverged from these findings (supplementary Figure 2F). Our findings suggest that the short duration of acute VNS treatment (0.5–2 h) might not sufficiently elevate BDNF mRNA or protein levels, TrkB expression (Figure 1a), neuronal cell number (Figure 1b) or glutamate receptor expression (supplementary Figure 3). Hence, we focused on TrkB phosphorylation in glutamate receptor-mediated responses (Figures 2 and 4). Plausibly, VNS activates BDNF-TrkB signaling in the NTS via mechanisms beyond transcriptional and translational activation, potentially involving immediate responses. For example, in vitro studies revealed rapid autocrine BDNF-TrkB signaling activation within less than one minute upon glutamate stimulation, persisting for at least 20 minutes in the stimulated spine because of NMDAR-mediated BDNF release (14). These findings are consistent with our observation regarding the temporal changes in VNS-activated TrkB in the NTS.
Our findings revealed that VNS effectively suppressed CSD throughout the recording session, suggesting that VNS efficacy preceded or coincided with CSD initiation (approximately 30 minutes, as depicted in the timeline in Figure 2a). This finding aligns with our previous studies, suggesting VNS efficacy development between 20 and 40 minutes (2). Notably, the onset of VNS efficacy correlated with peak TrkB activation, suggesting a potential preceding or concurrent relationship between TrkB activation and VNS efficacy.
Our results suggest that VNS triggers fast endogenous neuronal autocrine BDNF-TrkB signaling activation in the NTS. Previous studies have established the presence of endogenous BDNF and TrkB expression in the NTS (10). Specifically, previous investigations into TrkB protein levels revealed that TrkB protein accounts for 30 and 40.9% of cells in the NTS of P20 mice (23) and human infants (24), respectively. These findings are similar to our immunostaining results (Figure 4b). The present study confirms the presence of endogenous BDNF and TrkB expression in the NTS, with approximately one-third of NTS cells exhibiting endogenous TrkB expression, predominantly co-localized with glutamate receptors (Figure 4a,b). Additionally, a subset of VNS-activated TrkB receptors was identified in glutamatergic neurons (supplementary Figure 2d,e). This finding suggests that VNS-induced BDNF/TrkB signaling activation acts on glutamatergic neurons, potentially facilitating excitatory neurotransmission in the NTS.
The NTS primarily regulates baroreflex, using glutamate as its main neurotransmitter. Although the role of BDNF in NTS neuronal activity remains controversial, the essential role of TrkB signaling in mediating baroreflex is acknowledged (10,11). Conflicting findings in the literature have been attributed to factors such as anesthesia, the specificity of pharmacological tools and observation timing (11). Understanding of the role of BDNF-TrkB signaling in NTS, beyond its involvement in baroreflex regulation and control of food intake (25,26), remains limited. The present study, using the specific TrkB antagonist ANA12 instead of pan-tyrosine kinase inhibitors, supports the finding of Becker et al. (11) with respect to TrkB signaling in the NTS sharing an excitatory role akin to glutamate. The dose of ANA12 used in this study (200 μ
VNS exerts its anti-inflammatory effect through multiple mechanisms: reducing peripheral pro-inflammatory cytokines (27), mediating microglial status (28) and affecting the integrity of the blood–brain barrier (29). Our observation demonstrates that intra-NTS TrkB blockade almost completely blocked VNS efficacy on CSD-induced neuroinflammation (Figure 3), consistent with our previous findings (2,3). This suggests that central mechanisms predominantly drive VNS efficacy, although peripheral anti-inflammatory mechanisms cannot be excluded. Additionally, we noted that VNS decreased CGRP expression in the TG and reduced c-Fos immunoreactivity in the TNC (supplementary Figure 6), suggesting the potential of VNS to modulate the trigeminovascular system endogenously.
Previous studies demonstrate anatomical connections between the NTS, LC and DRN (5,6). NTS neurons project to the LC and DRN, displaying distinct morphological differences: rostral lateral NTS neurons are larger and fusiform, whereas caudal medial NTS neurons are smaller and multipolar (30). Despite these observed differences, the identities of these neurons remain elusive. Our findings demonstrate that neuronal TrkB activation in the NTS is modulated by glutamate receptors (Figure 4) and establish the functional connections between TrkB+ NTS neurons and LC/DRN neurons (Figure 5). Previous studies have reported contrasting effects between the dorsal and ventral LC: dorsal LC exhibited pro-nociceptive effects, whereas ventral LC exerted anti-nociceptive action. Interestingly, VNS activated neurons in both the dorsal and ventral LC, with a higher distribution of c-Fos immunoreactivity observed in the dorsal LC compared to the ventral LC. Further studies are needed to determine the neurotransmitters utilized by NTS neurons for relaying information and to elucidate the respective contributions of the dorsal and ventral LC in the efficacy of VNS.
Previous studies have unveiled a potential relationship between BDNF/TrkB signaling and migraine. Individuals with migraine, both with and without aura, exhibit lower platelet levels of BDNF compared to healthy controls (31). By contrast, a clinical study revealed increased BDNF levels in serum during migraine attacks (32). Aberrant BDNF expression might be associated with BDNF polymorphism because a clinical meta-analysis revealed the association of BDNF gene rs6265 polymorphism with migraine in the Caucasian population (33). BDNF rs6265 polymorphism (196 G/A) results in the substitution of Met for Val66 in the pro-sequence of BDNF, impairing its sorting from Golgi into secretory granules and subsequently reducing mature BDNF secretion (34,35). Neurons can release not only mature BDNF, but also immature pro-BDNF. Mature BDNF will bind to TrkB, whereas immature pro-BDNF will bind to p75, often eliciting biological functions opposite to those of TrkB (36). These results, together with our findings regarding the role of TrkB activation in CSD, suggest that TrkB might serve as a potential therapeutic target for migraine.
Several limitations are evident in our study. First, our investigation specifically concentrated on male rats because of the variability in female animals' responses linked to the estrous cycle. However, considering clinical VNS efficacy in both sexes, as discussed in our previous study (2), exploring the potential role of sex in the mechanisms underlying VNS efficacy is critical. Second, our focus on VNS-induced TrkB activation was confined to the NTS, neglecting other nuclei directly associated with nociceptor activation. Thus, the contribution of TrkB activation in other nuclei to VNS efficacy cannot be dismissed, despite the significant roles previously highlighted for the NTS, LC, and DRN in mediating VNS efficacy on CSD (3). Moreover, although BDNF is a known agonist for TrkB, it is important to note that other endogenous ligands such as zinc might also activate TrkB (37). Hence, the likelihood of VNS inducing TrkB activation through ligands beyond BDNF remains a possibility. Furthermore, technical constraints prevented us from directly examining BDNF release in vivo; however, an in vitro study established a tight correlation between postsynaptic glutamate-induced BDNF release and TrkB activation (14). Future research is necessary to confirm whether VNS-induced TrkB activation indeed originates from BDNF release. To advance translational relevance and the understanding of VNS's therapeutic potential and intra-NTS TrkB-dependent mechanism on aura and headache, future studies should explore whether post-treatment with VNS or TrkB blockade can reduce CSDs. Evaluating the impact of intra-NTS TrkB blockade on cortical norepinephrine and serotonin levels is also crucial. Finally, confirming the direct functional connectivity of the NTS-LC and NTS-DRN axis is imperative because the observed c-Fos immunoreactivity merely indicates functional correlation and not direct connectivity.
Conclusions
We demonstrate that VNS inhibits CSD by NMDAR and AMPAR-mediated TrkB activation in the NTS, which may modulate noradrenergic and serotonergic innervation to the cerebral cortex. Our results provide insight into the role of the NTS-LC/DRN axis in VNS efficacy on CSD suppression.
Clinical implications
VNS inhibits CSD and CSD-induced neuroinflammation via TrkB activation in the NTS. VNS triggers TrkB activation in the NTS through NMDA and/or AMPA receptors. VNS activates noradrenergic and serotonergic pathways via TrkB-dependent mechanism.
Supplemental Material
sj-pdf-1-cep-10.1177_03331024241230466 - Supplemental material for Vagus nerve stimulation inhibits cortical spreading depression via glutamate-dependent TrkB activation mechanism in the nucleus tractus solitarius
Supplemental material, sj-pdf-1-cep-10.1177_03331024241230466 for Vagus nerve stimulation inhibits cortical spreading depression via glutamate-dependent TrkB activation mechanism in the nucleus tractus solitarius by Tzu-Ting Liu, Shih-Pin Chen, Shuu-Jiun Wang and Jiin-Cherng Yen in Cephalalgia
Footnotes
Acknowledgements
We are grateful for an unrestricted research gift from electroCore LLC.
Author contributions
T-TL was responsible for the investigations. T-TL was responsible for writing the original draft. S-PC was responsible for the methodology. S-PC, S-JW and J-CY were responsible for reviewing and editing. S-PC, S-JW and J-CY were responsible for supervision. J-CY was responsible study conceptualization.
Data availability
Raw data are available upon reasonable request via contacting the corresponding author:
Declaration of conflicting interests
The authors declare that there are no potential conflicts of interest with respect to the research, authorship and/or publication of this article.
Ethical statement
All procedures were conducted with prior approval of Institutional Animal Care and Use Committee of National Yang Ming Chiao Tung University, Taiwan.
Funding
This work was funded by research grant from the National Science and Technology Council [MOST-110-2314-B-A49A-544 & 111-2314-B-A49-070-MY3 (to JCY); MOST-108-2314-B-010-022-MY3 & 110-2326-B-A49A-501-MY3 (to SPC); MOST 108-2321-B-010-014-MY2, 108-2321-B-010-001-, 108-2314-B-010-023-MY3, 110-2321-B-010-005- & 111-2321-B-A49-004 (to SJW)] and the Brain Research Center, National Yang Ming Chiao Tung University, from The Featured Areas Research Center Program within the framework of the Higher Education Sprout Project by the Ministry of Education in Taiwan (to SPC & SJW). We also thank the support of Yin Yen-Liang Foundation Development and Construction Plan of the College of Medicine.
Supplemental material
Supplemental material for this article is available online.
References
Supplementary Material
Please find the following supplemental material available below.
For Open Access articles published under a Creative Commons License, all supplemental material carries the same license as the article it is associated with.
For non-Open Access articles published, all supplemental material carries a non-exclusive license, and permission requests for re-use of supplemental material or any part of supplemental material shall be sent directly to the copyright owner as specified in the copyright notice associated with the article.