
Abstract
Background
Monoclonal antibodies against calcitonin gene-related peptides (CGRP) are innovative therapies for migraine treatment. Although they are clinically effective, how anti-CGRP treatment reduces migraine attacks still remains unclear.
Objective
In this observational case–control study, we aimed to apply graph theory to EEG data from 20 migraine patients and 10 controls to investigate the effects of 3 months of galcanezumab on brain connectivity.
Methods
We analyzed EEG rhythms during black-white pattern reversal stimulation with 0.5 cycle per degree spatial frequency before (T0) galcanezumab injection, as well as after 3 months (T2). EEG recordings made 1 hour after galcanezumab administration served as the control session (T1). Patients’ connectivity patterns obtained at T0, T1 and T2 were compared with normal controls.
Results
We found that galcanezumab increased network integration (with a 5% significance level corrected with the false discovery rate), changing the intensity of connections between the occipital through the frontal areas. At 3 months follow up, patients with persistent high headache intensity had a minor effect on the strength of connections (evaluated using Kendall’s rank correlation test and p < 0.05).
Conclusions
The potent anti-nociceptive action that galcanezumab exerts at a peripheral level could restore cortical connections and possibly factors predisposing to attack onset.
Introduction
In recent years, research on the pathophysiology of migraine has emphasized the importance of calcitonin gene-related peptide (CGRP) in activating trigemino-vascular system with the consequent sterile inflammation and headache. Anti-CGRP agents changed the migraine treatment scenario, giving new opportunities for resolving this invalidating disorder (1). The anti-CGRP monoclonal antibodies (CGRP-mABs) act at a peripheral level, directly blocking the CGRP (galcanezumab, fremanezumab and eptinezumab) or its receptor (erenumab). In previous studies, our group demonstrated that erenumab exerted an inhibition of A-delta-related cortical responses in the trigeminal district (2). The cortical regions devoted to trigeminal pain processing are thus modulated by the peripheral block of CGRP with a possible generalized influence on central abnormalities subtending migraine. Indeed, migraine could be considered as an ‘oscillopathy’ with different behaviors of cortical rhythms in resting state and under multimodal stimulation with respect to controls (3,4). The therapeutic modification of migraine outcome would theoretically change these abnormalities, which could in turn predispose to the triggering phenomena of the attacks, as cortical spreading depression or hypothalamic activation (5). The occipital cortex in migraine patients is particularly affected by abnormal reactivity to visual stimuli and abnormal connectivity patterns (6). In particular, the steady-state visual evoked potentials (SSVEPs) produced by a checkerboard pattern stimulation at 5 Hz and 0.5 cycle per degree of spatial frequencies were different in interictal migraine with and without aura compared to controls, as well as the second harmonic power at 10 Hz (7). Our group used an analogue type of stimulation and found a different pattern of cortical connections in migraine compared to controls, confirming abnormal networks within the occipital network in migraine patients, correlated with increased metabolism of the same areas as evaluated with functional magnetic resonance imaging (MRI) (8). Recently, we used an electrophysiological and metabolic analysis integrating high density EEG and functional near infrared spectroscopy. This type of analysis showed that, in migraine patients treated with galcanezumab, the abnormal SSVEP patterns recovered within normal ranges after 3 months of galcanezumab treatment. Galcanezumab treatment also restored the increased metabolic activity of occipital cortex (9). We assumed that the powerful antinociceptive action exerted by CGRP-mABs, could in some way reset the abnormal multimodal stimuli reactivity and especially the occipital cortex dysfunction. The evidence is in favor of the visual cortex as a functional aggregate within the paralimbic network, including the cortical areas activated in pain processing (10).
Graph theory application to the neuroscience is an innovative procedure that is being used more and more to quantitatively investigate the brain (11,12). According to this mathematical theory, the brain can be seen as a network composed of a set of nodes and links and can be investigated through a series of indicators that make it possible to study both globally and locally different properties of a complex system as the brain. Graph theory metrics such as strength, clustering coefficient and global efficiency appear to be suitable for describing the complexity of the migraine brain because they allow scientists to evaluate the intensity of network connections, the aggregation of network nodes and the network efficiency in connecting nodes. In the present study, we used EEG data acquired during a visual stimulation to build, for each subject and for each brain frequency band, a network where the electrodes represented the network nodes and the magnitude squared coherence was used to define the network links.
Studies on brain connectivity reported that migraine patients have cortical connection patterns different from those of healthy controls (13,14). However, this is the first work aiming to examine the effects of 3 months of treatment with galcanezumab on brain connectivity, applying brain networking analysis methods to EEG data. We particularly aimed to investigate the changes of the EEG perturbation under visual stimuli, which could be less influenced by the generic beneficial effect of galcanezumab with respect to resting state EEG, and rather indicate a possible reset of abnormal sensory reactivity proper of migraine (4,8). The study is of paramount importance to confirm and better understand the results obtained with standard analysis in our previous work (15) that we now reproduce in the present work, including the new subjects enrolled, so that a direct comparison with the connectivity analysis was possible. In this regard, we used graph theory to perform an explorative and unsupervised analysis aiming to understand whether graph theory could find connectivity patterns related to some beneficial effect of the therapy without imposing any constraint such as specific frequencies, time segments or locations.
Methods
Dataset
In this case–control study, performed during the routine clinical practice, we investigated the outcome of 3 months of galcanezumab therapy in drug-resistant migraine patients, comparing migraine cohort with healthy volunteers. Migraine patients and normal controls were recruited at the tertiary Headache Center of the Neurophysiopathology Unit of Bari Policlinico General Hospital from December 2020 to September 2022. Figure 1 shows the flow chart for selection of patients. Migraine patients had clinical and EEG assessment before the first galcanezumab administration (T0), 1 h after the first galcanezumab administration (T1) and after 3 months of galcanezumab therapy (T2). The recording session at T1, serving as the control, tested the effect of suggestion as a result of the drug injection. Indeed, the EEG study was conducted during routine clinical practice, according to the ethical advise not to change the therapeutic prescription and avoid placebo use in severe drug-resistant migraine.

Flow chart of patient selection criteria and final inclusion.
According to Italian rules for drugs reimbursement, only patients with high frequency drug-resistant migraine could have CGRP monoclonal antibodies prescribed. According to the Italian rules for drugs reimbursement, galcanezumab treatment could be administrated in the presence of a migraine with aura and one without aura, and also for chronic migraine diagnosis, according to the International Headache Society criteria (16), at least 8 days/migraine/month in the last 3 months, with previous and not efficacy use of amitriptyline, antiepilepticts (topiramate and/or valproate) and beta blockers (propranolol and/or metoprolol). The chronic migraine patients included were using symptomatic drugs-triptans and non-steroidal anti-inflammatory drugs for more than 10 days/month at the time of recruitment. However, no patient had been diagnosed with associated medication overuse headache and no patient was found to have temporary reduction of symptomatic drugs, therapy modifications for abuse or past detoxification treatments that could have changed migraine characteristics. Exclusion criteria for galcanezumab prescription were hypertension, ischemic heart failure, history of stroke or transient ischemic attack, thromboembolic episodes, aortic bypass or other types of vascular surgery. EEG recordings were carried out at least 24 h from the last and the next migraine attack, as verified through phone interviews. Longer migraine free periods would not have been possible in such severe patients. Finally, twenty migraine patients (11 with chronic migraine) were finally considered for the present study. Demographic and clinical data of the included patients are reported in Table 1. For each patient, headache daily records reporting days with headache and its intensity were considered (17). Intensity of headache was assessed through a numerical rating scale from 0 to 10, and frequency of headache was the mean number of days with headache in a month, computed in 3 months. We used the Italian version of MIDAS before and after 3 months of therapy with galcanezumab (18). We decided to consider the net effect of galcanezumab on migraine features, at the samew time as not considering possible changes of mood as a result of migraine improvement, detectable in longer perspective observation. We also studied the EEG data of 10 normal controls, selected among the University and Hospital staff (10% males, mean age 48.8 ± 9.9 years) who were matched for sex and age and did not have history of medical and neurological diseases. Special attention was devoted to ensure that controls subjects were not affected by any form of primary headache. The local Ethic Committee of Bari Policlinico General Hospital approved the EEG recording performed during the routine clinical observation.
Demographic and clinical data of migraine patients at the basal visit (T0) and after 3 months of galcanezumab (240 mg initial dose, 120 mg in the 2nd and 3rd month) (T2) therapy.

MA, episodic migraine without aura; CM, chronic migraine; AED, antiepileptics – topiramate and/or valproate; AD, antidepressants – amitriptyline; BB, beta blockers – propranolol or atenolol; CA, calcium channel blockers – flunarizine; TB, botulin toxin. Frequency was computed as an average over 3 months of the number of headache days per month (days/30); symptomatic drug taking was evaluated as average over 3 months of the number of days per month with acute therapy (SIM/30). Headache impact on patient’s life was measured by the Migraine Disability Assessment Score (MIDAS). Headache intensity was expressed with a Numerical Rating Scale (NRS) from 0 no pain to 10 maximal tolerable pain. For each clinical score, the mean and SD are reported. The last row shows the results of Student’s t-test between T0 (basal condition) and T2 (after 3 months of GCA treatment).
Stimulation and recording
Checkerboard patterns at a frequency of 5 Hz (10 reversal/s) were shown on a 17-inch monitor subtending 21 × 17° at a viewing distance of 90 cm during EEG acquisition. We used a spatial frequency of 0.5 cycle per degree and mean a luminance of 14 cd/m2. Two consecutive sessions of checkerboard pattern stimulation were performed, each lasting 60 s, aiming to avoid a long and demanding procedure that could have caused a migraine attack. EEG data were registered by 64 scalp electrodes, in accordance with the enlarged 10–20 system, referred to the nasion with the ground at Fpz. We used the EEG Micromed Brain Quick apparatus (Micromed System Plus; Micromed, Mogliano Veneto, Italy; http://www.micromed.eu), Impedance was below 5000 Ω, two electrodes were located above the right and left eye to acquire the EOG, and the sampling rate was 256 Hz.
EEG processing
The EEG data were processed with an automatic pipeline based on EEGLAB (v2022) running on MATLAB (19). The data were filtered between 1 and 30 Hz using a FIR filter. Next, we used the artifact subspace reconstruction method to correct continuous data and reject bad channels and data segments (20). Then, we interpolated the bad channels and re-referenced all the data to the average.
SSVEP analysis
The SSVEPs were evaluated blind for the different study phases (T0, T1 and T2). We analyzed the EEGs with the Letswave matlab tool (https://letswave.cn), removing ocular artifacts recorded on EOG channels (21), and applying a notch filter at 50 hz. Then, we computed the spectral power using the fast Fourier transform algorithm, averaging 12 samples of 10 s for the two recording sessions, and corrected the baseline in the frequency domain, using a 2–5 range of surrounding bins and subtraction operation. The power of fundamental frequency (F) at 5 Hz and double frequency (2F) at 10 Hz and a third frequency at 15 Hz (3F) were studied. We carried out a topographical analysis in the considered frequency bands, and a statistical analysis using the paired t-test between migraine groups (T0 vs. T1 and T0 vs. T2) and an unpaired t-test for controls versus migraine at T0 and T2. The unpaired t-test was employed to test possible differences between responders and non-responders at T0 and T2. Taking into consideration the pilot study and the average change in SSVEP amplitude in the considered frequencies in single channels (15), a sample size of 20 would be sufficient for 98% power with an alpha value of 0.01. To overcome the multiple comparisons problem, we performed the statistical analyses with a non-parametric cluster-based permutation approach, setting the cluster significant threshold to 0.05 and the number of permutations to 2000
Network analysis
In the present study, we built a weighted network for each subject, and this was carried out in each of the four frequency bands that we considered: delta (0.5–3.5 Hz), theta (4–7 Hz), alpha (8–12 Hz), beta (13–30 Hz). As reported in the flowchart of the Figure 2, for each processed subject’s data, EEG electrodes were used to define the network nodes and the magnitude squared coherence computed for each pair of channels was used to define network links that therefore represented the similarity of the neuronal oscillatory activity of two electrode signals.

Flowchart of the analysis pipeline. For each EEG processed signal, a weighted network was built. The electrodes were used to define the network nodes and the magnitude squared coherence was used to define the network link. Finally, different network metrics were extracted from each network, mathematically represented with a connectivity matrix.
For each subject’s brain network, mathematically represented with a connectivity matrix, we computed three different weighted metrics for each node:
Network strength si describing the intensity of the node connections;

where wij is weight corresponding to the edge between nodes i and j.
Global efficiency ei describes network integration that is the ability of the network to transfer information and communicate between nodes. The length of an edge was defined as the reciprocal of the edge weight; thus, a high coherence can be considered as a short distance;

where N is the number of network nodes and dij is the shortest distance between two nodes.
Clustering coefficient ci describes network segregation that is the degree to which nodes tend to group together and carry out specialized processes. It was computed according to Barrat definition (22):

where si is the strength of node i, aij are elements of the adjacency matrix that denote whether or not an edge exists, ki is the node degree (number of edges connected to a node i) and wij are weights. To obtain quantities that could describe each network globally, we averaged the values of each specific metric over the network nodes. Then, performing a Wilcoxon rank-sum test, we evaluated whether these metrics were significantly different (5% significance level) for the different conditions: T0, T1 and T2 and normal controls. For each comparison, we corrected for multiple comparison using Benjamini–Hochberg false discovery rate (FDR) and computed the effect size for non-parametric test given by Z/√N where Z indicates the Z statistic and N is the number of observables. Then, differences in coherence between conditions greater than the 90th percentile of the distribution of the differences were evaluated.
Finally, we computed strength, clustering coefficient and global efficiency for each subject’s brain network and, using Kendall’s rank correlation coefficient (τ), we evaluated whether these network properties were correlated with the clinical scores reported in Table 1.
Results
SSVEP results
In migraine patients, SSVEPs amplitude was reduced at T2, in comparison with T0 and T1 conditions, for the considered frequencies (F, 2F and 3F). At T0, there was a significant increase in amplitude in the main frequencies with respect to normal controls, which reverted at T2. In Figure 3, the significant p-values emerging from t-tests used to compare the different conditions (T0 vs. T2, T1 vs. T2 and T0 vs. normal controls) are shown. The global power of theta and alpha bands followed the same trend, with a significant reduction at T2 with respect to T0 and T1 on parieto-occipital electrodes (P3, P4, Pz, O1, Oz and O2, p < 0.05). In the beta band, the statistical comparison approached the statistical significance.
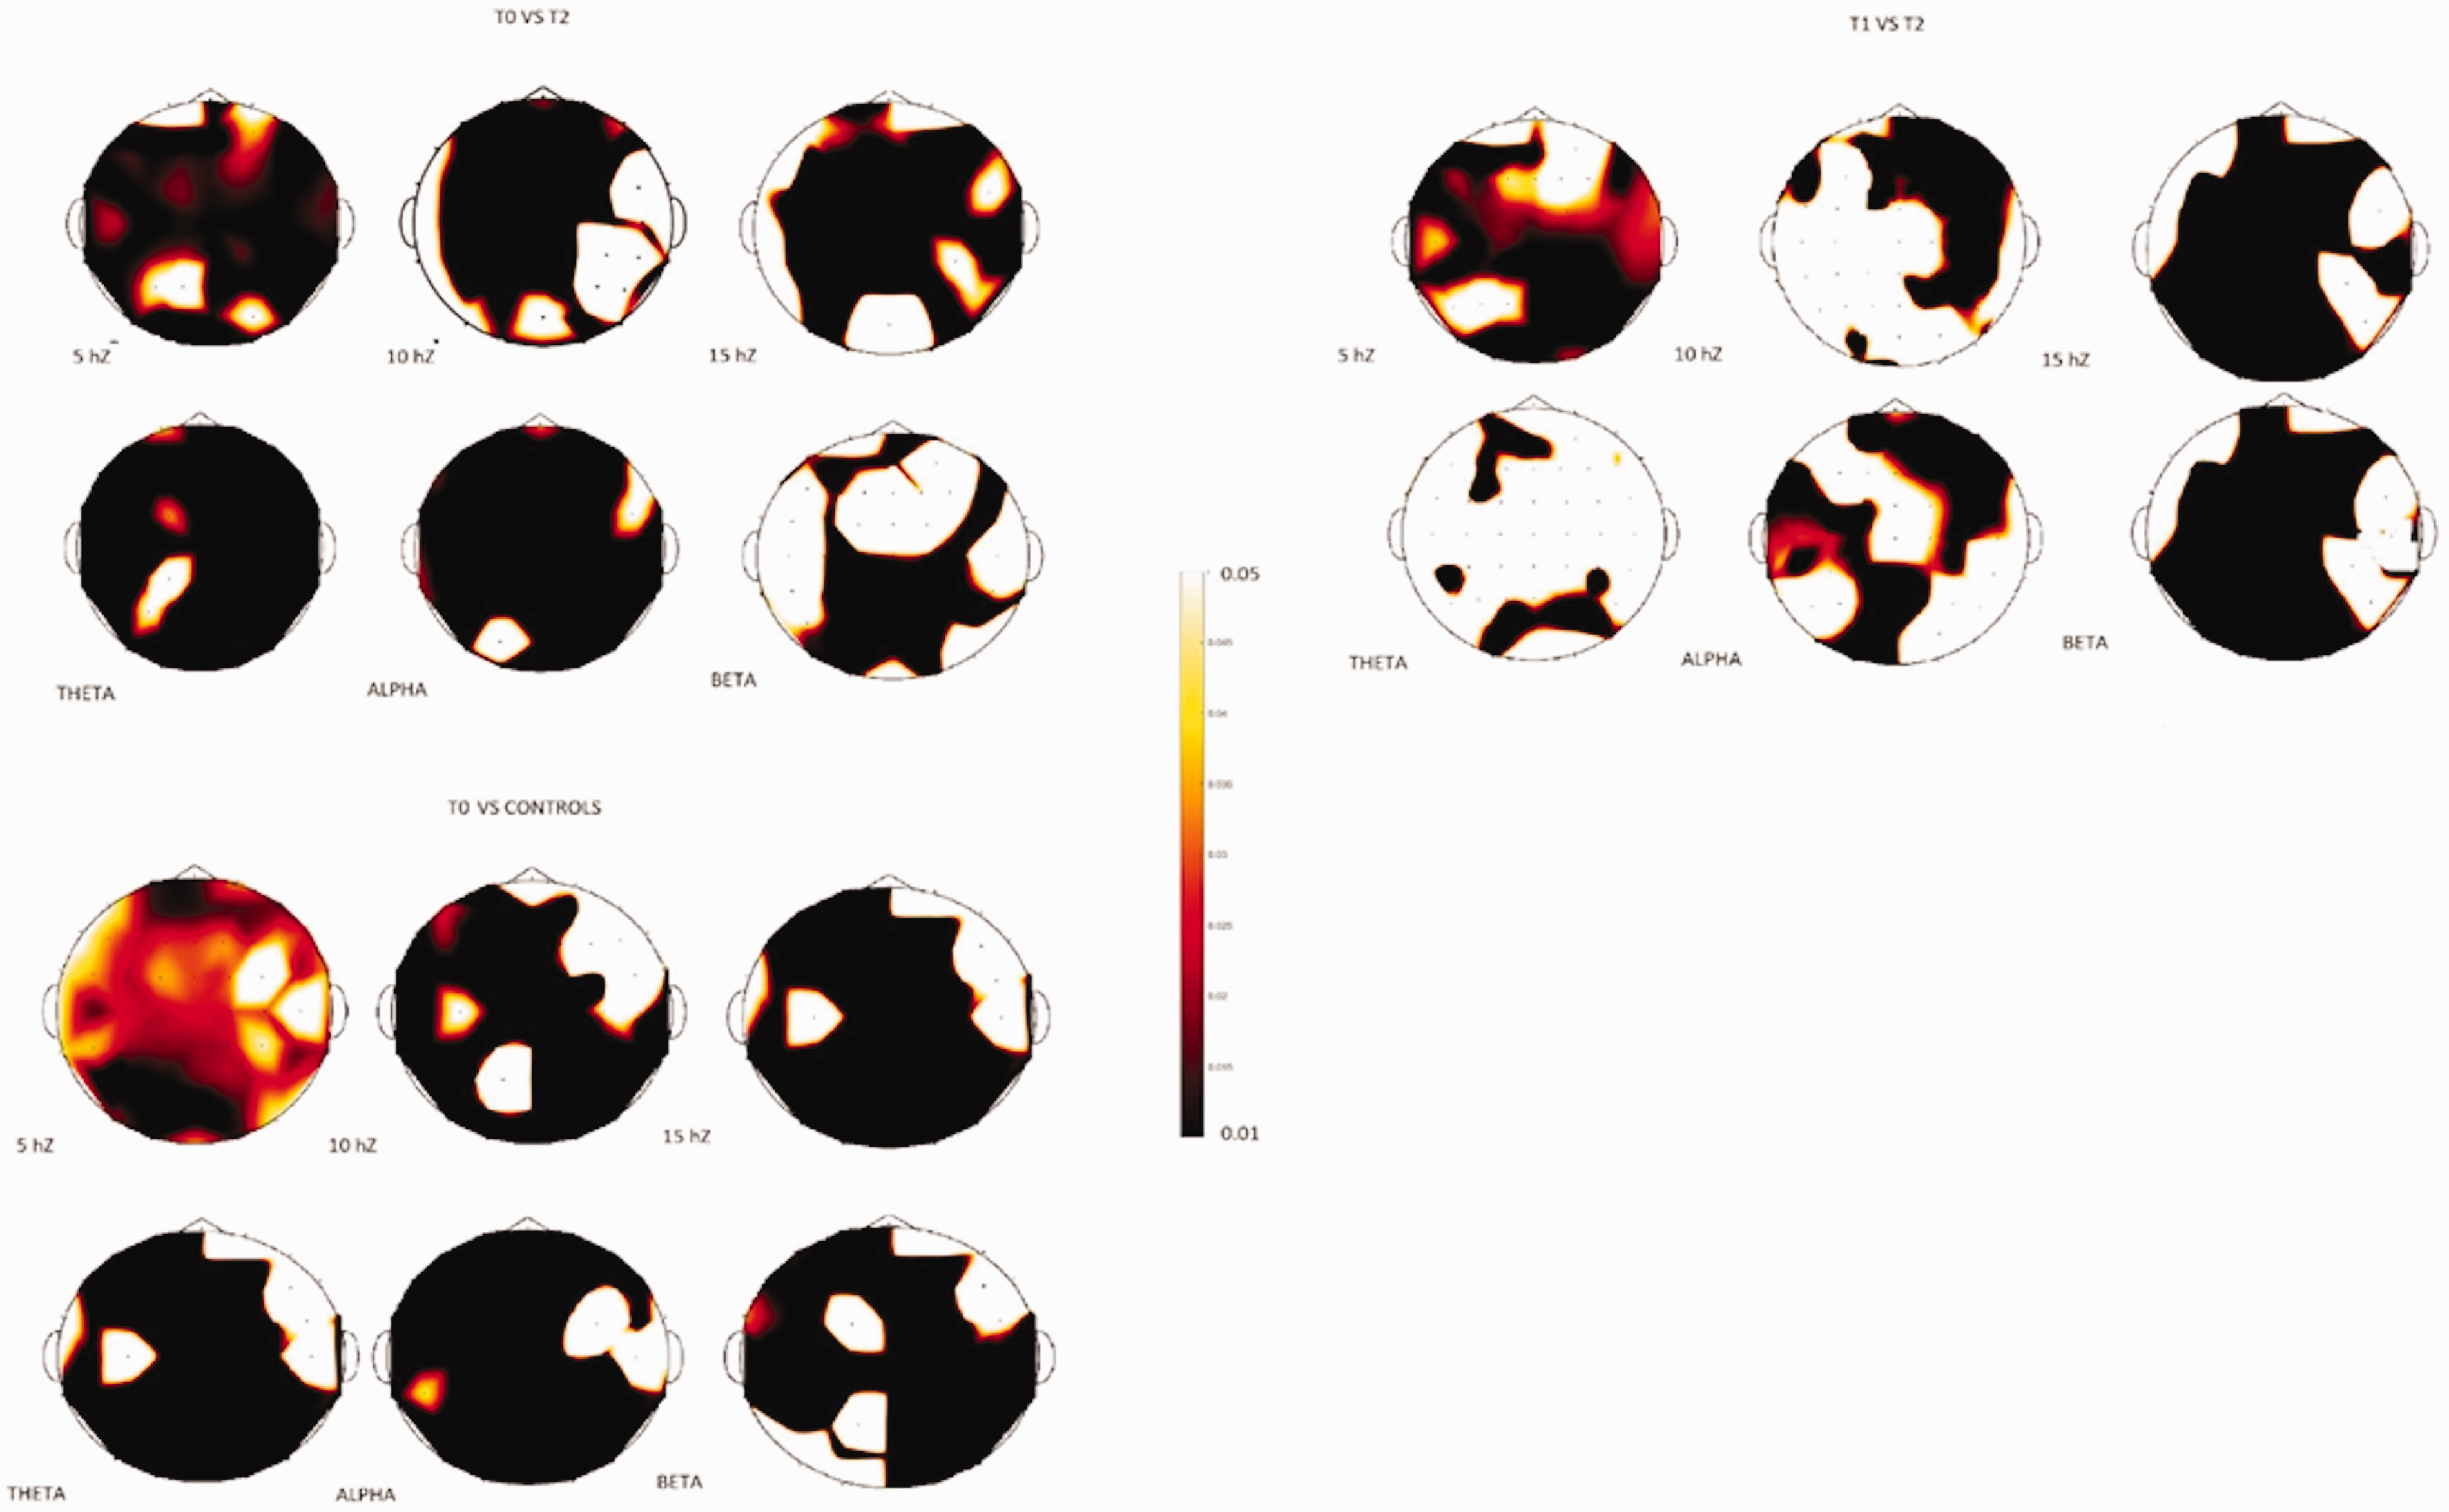
Significant p-values emerging from t-tests (cluster based permutation test) used to compare the different conditions (T0 vs. T2, T1 vs. T2 and T0 vs. normal controls) are shown. The brown color expresses the t-value corresponding to 0.01.
Figure 4 reports the grand average of SSVEPs computed, respectively, in normal controls and migraine patients on the Oz channel at T0, T1 and T2.

Grand average of steady-state visual evoked responses in 20 migraine patients in basal (T0) and after 2 hours (T1) and 3 months (T2) of galcanezumab treatment, recorded over the Oz electrode. Spectral power of 10 controls is also reported.
Thirteen patients could be considered responders for a 50% reduction of migraine frequency after 3 months from galcanezumab injection. Hoverer, all except one of them, improved their MIDAS score, and most of them showed a reduction in headache intensity, migraine frequency and use of rescue drugs.
No significant differences were detectable between responders and non-responders at T0 and T2 for SSVEP amplitude at the considered frequencies.
Network analysis results
Network metrics showed significant differences only in the theta and alpha frequency bands. Figure 5 reports strength, clustering coefficient and global efficiency for the different conditions in these two bands.

Mean strength, mean clustering coefficient and mean global efficiency for the different conditions, T0, T1, T2 and normal controls (C), in the theta and alpha frequency bands. *Results of the Wilcoxon rank-sum test (Table 2).
For both frequency bands, strength and clustering coefficient are significantly lower for migraine patients at T2, and global efficiency is significantly greater for controls and migraine patients at T2 (5% significance level). In other words, for both frequency bands, galcanezumab has the effect of increasing network integration and decreasing node coherence and network segregation. Figure 6 shows the differences in coherence between T0 and T2, T1 and T2, and T0 and T1 in the theta and alpha frequency bands. The differences between T0 and T2 and T1 and T2 tend to be more intense and more numerous and, for these differences, the more intense links tend to connect the frontal and the occipital cortex.

Differences in coherence between conditions (T0–T2, T1–T2 and T0–T1) greater than the 90th percentile of the distribution of the differences for theta band (top row) and alpha band (bottom row).
Statistical analysis
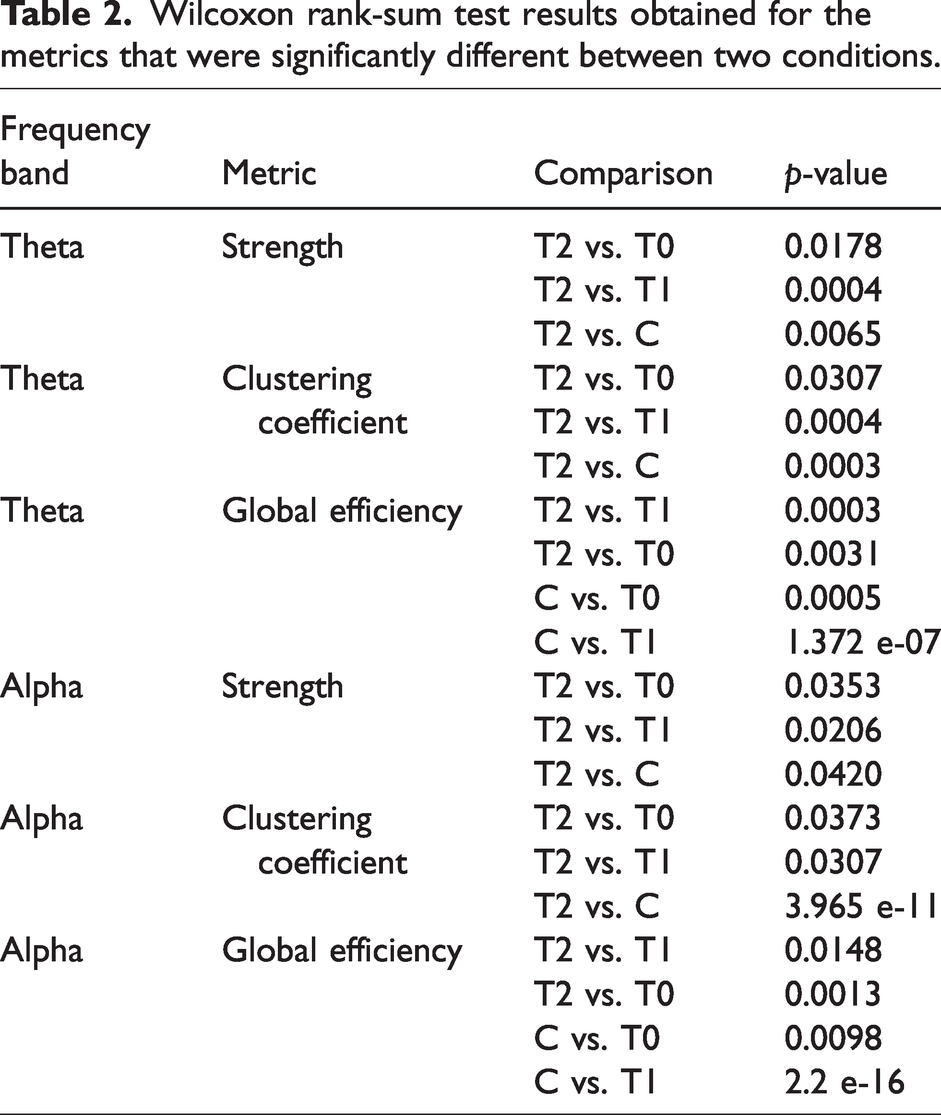
Table 2 shows the p-values of the significant results obtained with the Wilcoxon rank-sum test. For the different comparisons, we found an effect size greater than 0.75. We used Benjamini–Hochberg FDR as correction for multiple comparisons and found that the significant results obtained, before the FDR correction, are also maintained after FDR correction (p < rank ∗N−1 ∗ α, where N is the number of multiple comparisons, α = 0.05 is the threshold for the overall discovery rate, and rank is the index from 1 to N indicating the position of the p-values ordered from the smallest to the largest).
Wilcoxon rank-sum test results obtained for the metrics that were significantly different between two conditions.
Correlations between network analysis results and clinical data
We found no significant differences in network matrices between responders and non-responders. From Kendall’s rank correlation tests between network metrics and the clinical scores, we found that, at T2, the strength is correlated with the Numerical Rating Scale for both frequency bands (theta band: p = 0.0363, τ = 0.5360; alpha band: p = 0.0444, τ = 0.4690) and, at T0, the global efficiency is anti-correlated with SIM/30 only for the theta band (p = 0.0363, τ = 0.4767).
Discussion
In the present study, we utilized graph theory metrics to investigate the effects of 3 months of therapy with galcanezumab on migraine patients’ brain connectivity and to compare this with normal controls’ brain connectivity. The basal EEG analysis confirmed an increased visual reactivity in migraine patients in basal condition, which reverted after 3 months of galcanezumab therapy. In the theta and alpha bands, including the critical frequencies 5 and 10 Hz, we found that, after 3 months of treatment, network integration significantly increases, and node coherence and network segregation significantly decrease (p < 0.05). The main results are discussed below.
Basal effect of galcanezumab on SSVEPs
In accordance with our pilot study (15), the enlargement of the study group confirmed that 3 months of CGRP inhibition resolved the abnormal visual reactivity in migraine patients. This is not directly linked to the antinociceptive effect of galcanezumab at peripheral level, but the hypothesis about a reset of abnormal brain oscillations as a result of a potent inhibition of cortical areas receiving signals from the trigeminal afferents could be confirmed, also in accordance with functional MRI data (23).
Studies about an effect of mABS on central symptoms of migraine have been recently published (24,25), all suggesting that a proficient and specific trigeminal inhibition could in turn reset the abnormal reactivity of cortical areas potentially implicated in prodromal phenomena.
Effect on connectivity patterns
The beneficial effect of galcanezumab appears to be a result of the increase in the global efficiency of the network because it is the only metric at T2 that is significantly different from T1 and T0 and is very similar to the normal controls. The fact that the theta and alpha bands include, respectively, the stimulation frequency (5 Hz) and its double (10 Hz) explains why we obtained significance only for these. The beta band did not show relevant changes in EEG connectivity, in accordance with the lack of significant effect on total spectral power. The differences in coherence between T0 and T2 and T1 and T2 tend to be more intense and more numerous than the differences between T0 and T1, in agreement with our previous work (15). We observed that the main effect of galcanezumab consisted of an enrichment of communication and coherence between the occipital and the frontal and partly the limbic networks, which could be involved in the processing of trigeminal noxious signals. In a previous study, we observed that migraine patients had different connectivity patterns within the cortical networks receiving painful stimuli compared to normal controls (26). Patients with migraine had more active communications among cortical regions involved in painful stimuli processing, and the strength of cortical connections corresponded to the pattern of reduced habituation to repetitive stimuli (14,26). The same network analysis obtained during the same visual stimulation as that used for the present study confirmed increased information transfer from the occipital cortex toward the fronto-central regions (8). We can assume that the reduced activation of cortical areas involved in pain processing could also reset the abnormal communications with the occipital cortex, for an indirect effect of galcanezumab, as a result of its potent anti-nociceptive effect. We cannot determine whether this effect was caused by a generic improvement of the clinical condition and consequent brain wellbeing, or by the beneficial effect of the antinociceptive action of galcanezumab, with a change in connectivity within the so called pain matrix and its connections with other brain regions having a potential role in migraine generation. Recent MRI studies on resting-state functional connectivity and BOLD (i.e. blood-oxygen-level-dependent) measurements in response to moderately painful heat stimulation in patients treated with erenumab, showed that, in responders, there was a different response within the network elaborating pain stimuli (27). These studies are in favor of connectivity changes within the pain-related cortical areas, coherent with the therapeutic response. Unfortunately, to the best of our knowledge, no study has examined the changes induced by other preventive drugs on connectivity patterns in migraine, and so we cannot establish whether the beneficial effects of the CGRP antagonists are generic modifications as a result of the improvement of the disease or a specific action linked to the specific antinociceptive properties.
We found that network strength (S), which is the intensity of the node connections, and the clustering coefficient, which is the degree to which nodes tend to cluster together and perform specialized processes, clearly changed 3 months after galcanezumab therapy, differently from the basal and T1 conditions, as well as from controls. We can assume that the intensity and modality of node connections would change for the effect of therapy in a way that favored the restoration of global efficiency, with a reorganization of networks functional to a global improvement of communication among cortical areas.
We also observed a light short-term effect of galcanezumab, evaluated in the T1 condition, with respect to improving the coherence within the frontal networks. We used the EEG evaluation after 1 hour of galcanezumab injection, to test the effect of the suggestion. Indeed, this was an observational study conducted within the clinical practice, and so we were not allowed to use placebo. The mild improvement of coherence within the frontal regions at T1 would be the result of a psychological and cognitive reaction to the drug effect expectation because studies indicate that the time to reach maximum serum concentration of galcanezumab is 5 days (from 7–14 days) (28), with clinical effects after at least 1 month of therapy (29).
Correlation with clinical efficacy
Although we had seven patients with less than 50% reduction of headache frequency, all patients except one had on average an improvement of migraine disability and headache intensity, in agreement with the efficacy of galcanezumab after 3 months of first injection (30).
The quite uniform efficacy of galcanezumab among patients could justify the lack of correlation between the improvement of global efficiency and most of the migraine scores, as well as the lack of differences in connectivity and SSVEP amplitude between responders and non-responders. However, the only correlation that we found between the strength of connections and headache intensity at T2 might indicate that a minor anti-nociceptive effect could also reduce the influence that cortical areas receiving noxious trigeminal stimuli were able to exert on the connections network. Accordingly, patients with less frequent use of symptomatics after galcanezumab therapy improved more evidently in global efficiency. These correlations, although not exhaustive regarding a direct effect of CGRP inhibition in normalizing cortical networking, could support the hypothesis that an efficient and specific antinociception, whenever wielded in the periphery, could potentially act on the complex brain dysfunctions predisposing to attack onset (4,31).
Limitations
As also specified in our pilot study (15), we did not have ethical permission for a placebo because of the severe form of migraine that affected patients. The test after 1 hour could detect the influence of suggestion on EEG features, and certainly not the clinical placebo effect, which could help to determine whether the subjective improvement could contribute at least in part to restoring the abnormal EEG patterns
Conclusions
In the present study, we provide evidence about a normalizing effect on index of brain connectivity and modality of cortical network in migraine patients after 3 months of galcanezumab therapy.
Although we cannot exclude that this return to normal visual response and normal cortical connections among visual areas and fronto-central areas could be an effect of global clinical improvement, the hypothesis that a potent and specific anti-nociceptive action could restore the abnormal brain oscillations and connectivity further supports the potential disease-modifying properties of CGRP antagonists.
Clinical implications
Galcanezumab reverted abnormal visual evoked responses and brain networking among occipital and frontal regions. The evidence that an effective and specific anti-nociceptive action could restore the abnormal brain oscillations and connectivity further supports the potential disease-modifying action of CGRP antagonists.
Footnotes
Data availability
EEG data and analysis are accessible from the corresponding author upon reasonable request.
Declaration of conflicting interests
The authors declared that there are no potential conflicts of interest with respect to the research, authorship, and/or publication of this article.
Ethical statement
The Ethic Committee of Bari Policlinico General Hospital approved the EEG recording performed during the routine clinical observation.
Funding
This work was supported by #NEXTGENERATIONEU (NGEU) and funded by the Ministry of University and Research (MUR), National Recovery and Resilience Plan (NRRP), project MNESYS (PE0000006) – A Multiscale integrated approach to the study of the nervous system in health and disease (DN. 1553 11.10.2022).