
Abstract
Introduction
Triggers, premonitory symptoms and physiological changes occur in the preictal migraine phase and may be used in models for forecasting attacks. Machine learning is a promising option for such predictive analytics. The objective of this study was to explore the utility of machine learning to forecast migraine attacks based on preictal headache diary entries and simple physiological measurements.
Methods
In a prospective development and usability study 18 patients with migraine completed 388 headache diary entries and self-administered app-based biofeedback sessions wirelessly measuring heart rate, peripheral skin temperature and muscle tension. Several standard machine learning architectures were constructed to forecast headache the subsequent day. Models were scored with area under the receiver operating characteristics curve.
Results
Two-hundred-and-ninety-five days were included in the predictive modelling. The top performing model, based on random forest classification, achieved an area under the receiver operating characteristics curve of 0.62 in a hold-out partition of the dataset.
Discussion
In this study we demonstrate the utility of using mobile health apps and wearables combined with machine learning to forecast headache. We argue that high-dimensional modelling may greatly improve forecasting and discuss important considerations for future design of forecasting models using machine learning and mobile health data.
Introduction
Migraine is the leading cause for disability in the age range of 15–55 (1) and almost all sufferers experience functional impairment during the attack (2). The disorder is for many unpredictive and the uncertainty of when a new attack occurs is associated with anxiety and further functional impairment (3). The usual treatment strategy for migraines is to abort attacks after their occurrence or commence preventative treatments in order to reduce the frequency of attacks (4). In addition, so-called preemptive treatment—in which drugs are administered specifically on days with increased risk of headache—is a promising option (5). The notion of preemptive treatment is further supported by the fact that abortive treatment seems to be more effective if administered early in the course of an attack (6). It is therefore of great interest to be able to predict the onset of a migraine headache.
Triggers and premonitory symptoms preceding migraine headache have been extensively studied and are suggested to be good predictors for attacks by several researchers (5,7–10). Triggers are defined as endogenous or exogenous events associated with an increased probability of attack within a short time window, while premonitory symptoms are cognitive, behavioral, sensory or physical symptoms or factors preceding the attack by up to 48 hours (8,11). However, both are elusive, reliant on subjective reporting and prone to methodological issues (8). In addition to the subjective changes several neurophysiological changes occur in premonitory phase of the migraine attack (12). Even easily accessible physiological changes, reflecting altered autonomic tone, seem to precede the migraine attack (13). The emergence of mobile health (mHealth) apps and wearables allows for effective capture of both the headache characteristics, the premonitory symptoms and the physiological changes. Nevertheless, at present, there is limited utilization of the premonitory biophenotype to forecast migraine attacks.
Owing to the complex underlying neurobiology, it is probable that sophisticated models are required to accurately forecast migraine attacks (8,9). High-dimensional machine learning models are able to handle a wide array of covariates (features) meaning they can absorb and utilize the complex biological and physiological changes preceding an attack, thus yielding greater accuracy. The aim of this study was to explore the utility of machine learning models to predict headache attacks based on headache diary entries combined with physiological measurements from wireless wearable sensors.
Methods
Study design and participants
The data for this exploratory machine learning analysis was collected in a prospective development and usability study at St. Olavs University Hospital in Trondheim, Norway, from December 2019 to March 2020. The results of the development and usability is reported elsewhere (14). We here present the results of an exploratory machine learning analysis utilizing data from the development and usability study.
Eighteen adults with migraine were recruited from the outpatient headache clinic and from the local community using the hospital intranet and advertisement in the news. All diagnoses were confirmed by a consultant neurologist with headache expertise. Participants completed four weeks of headache diary entries and self-administered biofeedback training on an app connected to wearable wireless sensors. The collected data was used to make predictive models to forecast headache. The study was approved by the regional committee for medical and health research ethics (REK Midt 7166) and the Norwegian Medicines Agency for trials of medical equipment (19/11730-9).
Inclusion criteria were age between 18 and 65 years; migraine with or without aura diagnosed according to the International Classification of Headache Disorders 3 (15); two to eight attacks per month; experience with using an iPhone® (Apple Inc.); and signed written informed consent. No inclusion criterion of number of headache days was made, thus both individuals with a retrospective history of episodic and chronic migraine were eligible for inclusion. Exclusion criteria were lack of proficiency in the Norwegian language; reduced vision, hearing, or sensibility to a degree that hampered study participation; or if they had any serious neurological or psychiatric disorders.
Dataset and data pre-processing
The Cerebri app (Nordic Brain Tech AS, Oslo, Norway) was used as biofeedback setup prompting participants to complete a headache diary entry and a 10-minute biofeedback session daily. Users were free to complete the biofeedback session and diary entry at any timepoint during the day regardless of the presence of headache. However, the diary entry had to be completed to start a biofeedback session. The app included a daily reminder as a pop-up message that could be set at a timepoint specified by the user. The headache diary assessed presence of headache (not distinguishing between migraines and non-migraine headaches), peak headache intensity, average headache intensity, impact on daily functioning, use of abortive medication, the presence of 13 predefined premonitory symptoms and the amount of sleep and exercise within the last 24 hours. Migraine headaches versus non-migraine headaches were not recorded. During the biofeedback session a small surface electromyography sensor was used for measuring muscle tension from the upper trapezius muscle fibers, and a combined thermistor and photoplethysmography was attached to the right index finger to measure peripheral skin temperature and heart rate. Sensors transmitted signals to the app via Bluetooth® Smart.
We calculated the session-wise maximal and minimal heartrate, temperature, and SEMG-voltage as the median of the ten lowest and ten highest data samples during each biofeedback session. We also calculated the mean heartrate, mean temperature and the root mean square SEMG-voltage for each session. The full list of covariates (features) is provided in online Supplementary Material 1.
Primary outcome
The primary outcome was a dichotomized presence or absence of any headache the day following a complete headache diary entry and a completed biofeedback session. Samples with a missing diary entry the day after a completed diary entry and biofeedback session were removed from the dataset as these did not enable prediction.
Predictive modelling
The predictive models were constructed and evaluated by applying several standard machine learning architectures, including logistic regression; support vector machines; random forest classifiers; gradient boosting machines; adaptive boosting and extreme gradient boosting. We split the dataset in a randomized manner into stratified training, validation, and test sets, with a 4:1 ratio training to test, and a 4:1 ratio training to validation. The stratification divided individuals so that no individual had samples in more than one of the training, validation, and test sets. Partitions were kept separate during training. Data was scaled by subtracting the mean and dividing by the standard deviation.
We modelled all features and optimized model hyperparameters with a three-fold cross-validation Bayesian search strategy with 50 iterations (16). Online Supplementary Material 2 summarizes the hyperparameter tuning. All models were trained on the training set and performance was continuously evaluated on the validation set. The average area under the receiver operating characteristics curve (AUC) was used as a scoring metric. The top performing model was decided based on a combination of cross-validated and validation set performance and was finally applied on the test set to quantify out-of-sample AUC. We also report out-of-sample accuracy, sensitivity and specificity.
For the top performing model, we calculated shapley values and constructed a SHAP (Shapley Additive exPlanations) summary plot. SHAP is a framework utilizing shapley values to explain machine learning model predictions (17). SHAP assigns each feature an importance value, which enables interpretation of how each feature contributes towards a particular prediction. The values can be summarized in a plot visualizing to what extent each feature contributes positively or negatively towards the prediction.
To evaluate the impact of model dimensionality the top performing model was entered into a recursive feature elimination with a three-fold cross-validation (RFECV). The RFECV performs a stepwise removal of features based on importance until performance increase no longer is achieved. We report the optimal number of features and visualize the impact of model dimensionality on a line plot.
We also constructed a calibration plot for the top performing model. Calibration plots are useful for evaluating machine learning classification problems. Forecasting headache is a classification problem with a binary outcome (absence or presence of headache), but we also investigated how confident the predictions are. Classification models usually provide probability estimates, in addition to the class prediction, which can be plotted against the true outcomes to visualize the confidence of the predictions. The calibration plot was constructed using the training data and the probability estimates were categorized into 10 bins.
This is the primary machine learning analysis of data collected in this study. A priori we planned for exploratory modelling of headache forecasting. Data were reported as means, standard deviations (SD), medians and interquartile ranges (IQR). All statistical analyses were performed, and figures were made using Python v3.10 (Python Software Foundation) with the following open-source packages: matplotlib 3.6.1; numpy 1.23.4; pandas 1.5.0; scikit-learn 1.1.2; scikit-optimize 0.9.0; seaborn 0.12.0 and shap 0.41.0.
Results
Participants and demographics
Eighteen participants were recruited and completed a total of 438 headache diary entries and 391 biofeedback session. There was a total of 388 days with both a complete headache diary entry and biofeedback session data. Among these 93 days were not followed by a headache diary entry the next day, and thus removed from the dataset. Data from one participant was not available for analyses because of unsuccessful transfer of headache diary entries and biofeedback session data to the data storage server. Patient demographics are summarized in Table 1.
Patient demographics.

Predictive modelling performance
Two-hundred-and-ninety-five headache diary entries and biofeedback sessions with a headache diary entry the following day were included in the predictive modelling. The top model was the random forest classifier with a mean cross-validated AUC of 0.68 (0.01) and a validation set AUC of 0.56. The gradient boosting classifier performed nearly identical with a mean cross-validated AUC of 0.68 (0.02) and a validation set AUC of 0.55). The random forest model achieved an AUC of 0.62 in the out-of-sample test set (Figure 1). Accuracy, sensitivity, and specificity of the random forest model was 0.56, 0.0 and 1.0 respectively. Accuracy for each of the three individuals in the test set was 0.56, 0.27 and 0.69. The test set AUC, accuracy, sensitivity, and specificity of the gradient boosting model was 0.62, 0.62, 0.21 and 0.95 respectively. The respective cross-validated AUC for the other models were: logistic regression 0.67 (0.03); support vector machines 0.70 (0.04); adaptive boosting 0.65 (0.05); extreme gradient boosting 0.66 (0.05).

Receiver operating characteristics curve for the best model based on random forest classifier. Out-of-sample performance on the test set scored an AUC of 0.62 (blue line). The dark gray line represents the mean ROC curve of the three-fold cross validation with ±1 standard deviation as the shaded gray area. The out-of-sample performance was faithful to the training. The dotted red line represents AUC for classification by chance given a random and equal distribution of headache days. ROC = receiver operating characteristics; AUC = area under the curve.
The RFECV found the best performance to be achieved when including all features. However, only minimal improvement in model performance was seen from approximately 15 features and upwards. Online Supplementary Material 3 is a line plot demonstrating the model performance relative to number of included features.
The contributions of the different features on model prediction are visualized in the SHAP summary plot (Figure 2). Almost all features contributed to some degree towards the predictions, and both self-reported and physiological measurements had significant SHAP values. Figure 3 is a calibration plot indicating the confidence of the predictions.

SHAP summary plot. The figure visualizes contributions of the different features towards a prediction. A positive SHAP value means a positive impact on the model, leading the model to predict a headache. Prescence of binary features such as premonitory symptoms are indicated by a high feature value (red dot). Similarly, for the continuous features, large values (e.g. many hours of sleep or a high headache intensity) are indicated by bright red color.
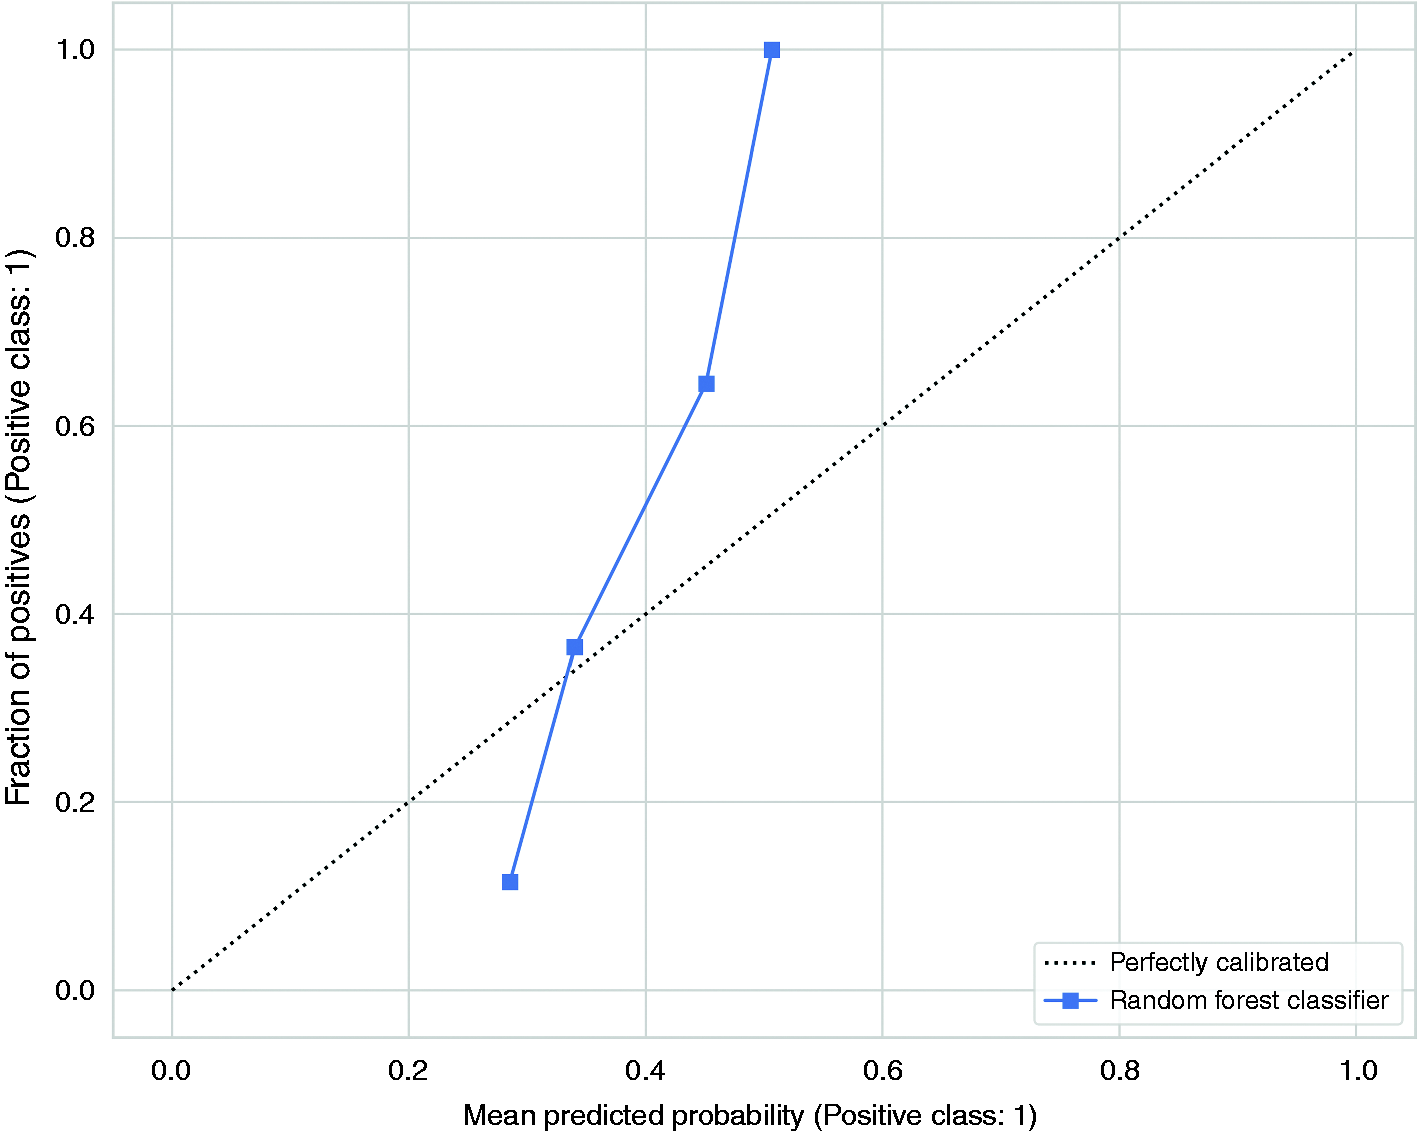
The calibration plot visualizes the accuracy of the model’s predictions. The predicted probabilities are divided into 10 bins and the means of each bin is plotted against the true values of these predictions. A perfectly calibrated model the probability estimates should correspond to the fraction of true outcomes. This means that among the samples in which the probability estimates of having a headache is approximately 0.3, the proportion of actual headache days should be approximately 0.3. The model has a small range of probability estimates and poor calibration, indicating low confidence in the predictions.
Discussion
Principal findings
Using data from a study of self-administered app-based migraine biofeedback training and daily headache diary entries, we have demonstrated a proof-of-concept for forecasting individual headache days with machine learning. The model correctly predicts the absence or presence of a headache the next day, on almost two out of three occasions in unseen individuals. Self-reported headache parameters, premonitory symptoms, and physiological measurements all play a significant role in forecasting headaches. With future refinement, high-dimensional machine learning models are likely to forecast headaches days in individuals with migraine with high accuracy.
Interpretation
The machine learning models presented in this paper serve as an essential proof-of-concept for using machine learning to forecast headaches from easily accessible mHealth data but should be interpreted with caution for several reasons. Firstly, the sample size is small for machine learning. We included almost 300 samples in the models, which provided decent power for preliminary analyses. Despite weak evidence (18), a common rule-of-thumb is to include at least ten events per variable for logistic regression, a criterion our models nearly meet. Secondly, the model assumes a generalized framework of mechanisms underlying the occurrence of headache attacks. Assuming such a homogeneity might not be the correct approach when forecasting headaches at the individual level, as individual patterns may contain information that is lost within a generalized framework. Indeed, the discrepancy in prediction accuracy among the individuals in the test set underpins such a heterogeneity and a larger sample size and longer observation period would be necessary for more precise individualized predictions. Moreover, not distinguishing between headache attacks is likely to have hampered predictions as migraine and non-migraine attacks have varying premonitory symptoms and physiological properties. Nonetheless, we kept individuals strictly separated between the training and test sets. This mitigates data leakage and overfitting, and increases generalizability with a robust out-of-sample estimate. Thirdly, the calibration plotting suggests low confidence in the predictions underpinning the fragility of a model built on limited data. Finally, our input covariates most likely do not capture the full predictive capacity biologically feasible. There is likely a wide range of other valuable features that may improve future models.
Despite these drawbacks, the main contribution of this work lies in demonstrating the importance of high-dimensional modelling of mHealth data to forecast migraine. The large number of features considered important by the model, illustrated by the SHAP plot and the RFECV curve, underpins that complex patterns within a wide array of factors is required for accurate predictions. One can note that both the premonitory symptoms, today’s headache characteristics and today’s biofeedback measurements all contribute to predicting tomorrow’s headache. The most important features were premonitory symptoms of craving, swelling and feeling cold, the amount of sleep, the presence and intensity of headache, how much the headache affected daily functioning, the length of the biofeedback session, and mean heartrate. This stands in contrast with a common patient belief that unitary factors often trigger migraine attacks (19,20). Of note, having a headache one day is a strong predictor for having headache the next day, which is not surprising given the fact that migraine attacks often span consecutive days. However, the small sample size of this study means that interpreting individual features and their direct relevance and causality towards the prediction should be done with great caution.
The literature supports that both self-reported data, physiological measurements and external data can be used in headache forecasting. An important study by Houle et al. (10) looked into predicting headaches based on self-reported perceived stress. Perceived stress has received attention as an important trigger associated with the onset of headache (20–22). In the study, a low-dimensional model using today’s level of stress combined with the presence/absence of headache was able to predict headache tomorrow with an out-of-sample AUC of 0.65. The models presented in this paper display similar performance. However, our model has a much smaller sample size but higher complexity indicating the value of high-dimensional modelling for high forecasting accuracy. Houle et al. (10) conclude that their model has a very promising utility in predicting the future occurrence of migraine attacks. Our findings corroborate this and serve as additional evidence for forecasting migraine attacks.
The feasibility of using headache diary apps and wearable biosensors for headache prediction has also been demonstrated in several studies. In a study by Connelly and Boorigie (23) it was shown that children with migraine could use their smartphone to routinely report headaches and daily activities, while wearables could provide passive data monitoring for the majority of the day on most days. The authors conclude that such methods for data capture should be suited for machine learning analytics, and should indeed be considered when designing future studies. A study by Siirtola and colleagues (24) demonstrated that sleep time data collected with a wearable sensor could be used to predict migraine attacks the next day at the individual level. Together with our findings, these studies support the use of wearables in migraine forecasting.
In addition, several studies for prediction of migraine attacks have been carried out by Pagán and colleagues (25–27). While the studies mainly focus on simulations and technological and methodological development, they propose several concepts worth considering for future forecasting models. In the studies two patients were included for continuous 24-hour monitoring of heart rate, electrodermal activity, skin temperature and peripheral capillary oxygen saturation. The researchers suggest that, based on these features, the migraine attack has a predictive horizon limited to 40 minutes. The findings are not directly comparable to ours, but they support that simple physiological measurements should be used, and that continuous monitoring may improve accuracy.
When further developing forecasting models there is a wide range of predictors that should be taken into consideration. To date, potential predictors seem to fall in one of three categories: self-reported and behavioral predictors; biomarker and physiological predictors; and extra-individual predictors (5,28). Self-reported predictors such as triggers and premonitory symptoms are generally considered important in forecasting models (8–10). In spite of this, we made a choice to leave out triggers, partly to reduce the number of questions in the diary, and partly because triggers appear somewhat less reliable than premonitory symptoms in forecasting attacks (8). Indeed, a study by Holsteen and colleagues found that self-reported triggers included in a multivariable forecasting model only performed slightly better than chance (29). Nonetheless, it is conceivable that our model could have benefited from including triggers as they add to the complex high-dimensional space the underlies forecasting. Future studies should include triggers as a part of comprehensive electronic diaries because we do not have the evidence to discard their utility. One should also carefully distinguish between different headache types and attacks as the variance in their premonitory symptoms and trigger will influence predictions. Such a distinction will allow for separate predictive models of migraine versus non-migraine attacks which could improve performance. Next, evidence on biomarkers and physiological changes occurring in the premonitory migraine phase is growing (12). This group of predictors includes a wide variety of factors, from simple heart rate measurements to complex neuroimaging biomarkers. One example is a study in which continuous wireless electroencephalography identified significant changes in delta and beta waves in the hours preceding attacks (30). Another example is a functional MRI study showing that the distance to the next headache attack is predictable by the signal intensities in the trigeminal spinal nuclei in the preictal phase (31). In addition, continuous data monitoring and sleep time data, as discussed above, also provides predictive value (23,24). While these biomarkers and physiological measurements are less accessible than simple self-reporting predictors; they suggest that we should look for a broad variety of biomarkers and phenotypic features to include in high-dimensional models forecasting migraine attacks. Finally, extra-individual predictors include factors not influenced by the individual such as weather changes, pollen, and air pollution (32). Such factors can easily be captured and temporally integrated with the other factors.
Successfully predicting migraine attacks has several benefits. First, there is a substantial benefit for both the individual and society as one could reduce disease burden, reduce anxiety about the unpredictability of attacks, and aid in self-management of migraine. Second, predicting an attack allows the patient to take precautionary measures, administer abortive medication at the right time, which is shown to be more effective, or choose preemptive treatment (6,8). Still, one should keep in mind that a high forecasting accuracy (AUC > 0.80) would be required for individuals with high-frequency headache to avoid medication overuse headache, because a low specificity would increase the rate of false positive drug administrations (5). Third, even though there is a belief among some patients and health care provides that attacks are predictable based on subjective factors—few actually predict correctly. In one study, only 4% of participants were able to predict the exact date of their next attack (33), despite the fact that every second patient can accurately predict the time of day or location of the attack (34). Finally, in a thematic qualitative analysis of the usability findings in this study, we have identified that forecasting attacks is one of the primary desires for an app-based treatment for migraine patients, indicating that there is a desire in the migraine population for forecasting tools (14).
Limitations
Several limitations are discussed in the interpretation of our findings, including the small sample size, the limitations of a generalized model for individual prediction, the absence of potentially important features, and the uncertainty of the estimated SHAP values and feature contributions. In addition, the study is limited by factors regarding the study population and data collection. The study population was based on a convenience sample from a tertiary headache clinic, not necessarily representative of the general migraine population. We also recruited only one male participant and it is conceivable that physiological properties correlating to sex could impact the model. Data was collected through an app-based headache diary that has not undergone formal validation, and all diary entries were completely unsupervised. The participants only used the equipment for a month, a shorter time period than recommended by IHS guidelines (35), and usability problems and acquiescence bias may all have affected the data collection. Together, these limitations reduce data size, reduce data fidelity and reliability and thereby likely decrease the prediction accuracy. Despite all limitations, the work presented here is the most complex forecasting model based on self-reporting and simple physiological measurements to date. Further research is certainly warranted.
Conclusion
In this study, we developed a proof-of-concept machine learning model to forecast headache with data from a headache diary app and wearables. With this model we demonstrate that high-dimensional models have the potential for high forecasting accuracy. Further research using a rich dataset of self-reporting data, objective biomarkers, and external data is likely to produce forecasting models with high predictive accuracy.
Clinical implications
Mobile phone apps and simple wearables can be used to capture data relevant for headache forecasting. Self-reported headache symptoms, premonitory symptoms and physiological measurements can be used to forecast headaches with machine learning.
Supplemental Material
sj-jpg-1-cep-10.1177_03331024231169244 - Supplemental material for Forecasting migraine with machine learning based on mobile phone diary and wearable data
Supplemental material, sj-jpg-1-cep-10.1177_03331024231169244 for Forecasting migraine with machine learning based on mobile phone diary and wearable data by Anker Stubberud, Sigrid Hegna Ingvaldsen, Eiliv Brenner, Ingunn Winnberg, Alexander Olsen, Gøril Bruvik Gravdahl, Manjit Singh Matharu, Parashkev Nachev and Erling Tronvik in Cephalalgia
Supplemental Material
sj-pdf-2-cep-10.1177_03331024231169244 - Supplemental material for Forecasting migraine with machine learning based on mobile phone diary and wearable data
Supplemental material, sj-pdf-2-cep-10.1177_03331024231169244 for Forecasting migraine with machine learning based on mobile phone diary and wearable data by Anker Stubberud, Sigrid Hegna Ingvaldsen, Eiliv Brenner, Ingunn Winnberg, Alexander Olsen, Gøril Bruvik Gravdahl, Manjit Singh Matharu, Parashkev Nachev and Erling Tronvik in Cephalalgia
Footnotes
Declaration of conflicting interests
The authors declared the following potential conflicts of interest with respect to the research, authorship, and/or publication of this article: NTNU and St. Olavs Hospital, Trondheim University Hospital may benefit financially from the commercialization of the proposed treatment through future possible intellectual properties. This may include financial benefits to the authors of this article.
Anker Stubberud is a co-founder of the Nordic Brain Tech AS, a spin-off company that was established based Cerebri biofeedback concept used in this and previous studies at the NTNU Norwegian University of Science and Technology. Stubberud is a co-inventor of Cerebri and may benefit financially from a license agreement between Nordic Brain Tech AS and NTNU Norwegian University of Science and Technology.
Sigrid Hegna Ingvaldsen, Eiliv Brenner and Ingunn Winnberg declare no potential conflicts of interest concerning the research, authorship, or publication of this article.
Alexander Olsen is a co-founder of the Nordic Brain Tech AS, a spin-off company that was established based Cerebri biofeedback concept used in this and previous studies at the NTNU Norwegian University of Science and Technology. Olsen is a co-inventor of Cerebri and may benefit financially from a license agreement between Nordic Brain Tech AS and NTNU Norwegian University of Science and Technology.
Gøril Bruvik Gravdahl, Manjit Matharu and Parashkev Nachev declare no potential conflicts of interest concerning the research, authorship, or publication of this article.
Erking Tronvik is a co-founder of the Nordic Brain Tech AS, a spin-off company that was established based Cerebri biofeedback concept used in this and previous studies at the NTNU Norwegian University of Science and Technology. Tronvik is a co-inventor of Cerebri and may benefit financially from a license agreement between Nordic Brain Tech AS and NTNU Norwegian University of Science and Technology.
Funding
The authors disclosed receipt of the following financial support for the research, authorship, and/or publication of this article: The study received funding for cooperative projects between the Department of Neuromedicine and Movement Science and Department of Psychology NTNU Norwegian University of Science and Technology.
References
Supplementary Material
Please find the following supplemental material available below.
For Open Access articles published under a Creative Commons License, all supplemental material carries the same license as the article it is associated with.
For non-Open Access articles published, all supplemental material carries a non-exclusive license, and permission requests for re-use of supplemental material or any part of supplemental material shall be sent directly to the copyright owner as specified in the copyright notice associated with the article.