
Abstract
Objectives
To assess the cost-effectiveness of erenumab 140 mg (“erenumab”) for the prophylactic treatment of episodic migraine and chronic migraine.
Study design
A hybrid Monte Carlo patient simulation and Markov cohort model was constructed to compare erenumab to no preventive treatment or onabotulinumtoxinA among adult ( ≥ 18 years) patients with episodic migraine and chronic migraine who failed prior preventive therapy from the US societal and payer perspectives.
Methods
Patients entered the model one at a time and were assigned to a post-treatment monthly migraine day category based on baseline monthly migraine days and treatment effect. Using monthly cycles, patients were followed for 2 years and accumulated costs and utilities associated with their post-treatment monthly migraine days. The primary outcome included the incremental cost-effectiveness ratio presented as cost per quality-adjusted life year gained.
Results
With an annual drug price of erenumab of $6900, treatment with erenumab in the societal perspective ranges from a dominant strategy versus no preventive treatment among chronic migraine patients to an incremental cost-effectiveness ratio of $122,167 versus no preventive treatment among episodic migraine patients. When excluding indirect costs (i.e. payer perspective), the incremental cost-effectiveness ratios are cost-effective among chronic migraine patients ($23,079 and $65,720 versus no preventive treatment and onabotulinumtoxinA, respectively), but not among episodic migraine patients ($180,012 versus no preventive treatment). Model results were sensitive to changes in monthly migraine days, health utilities, and treatment costs.
Conclusion
The use of erenumab may be a cost-effective approach to preventing monthly migraine days among patients with chronic migraine versus onabotulinumtoxinA and no preventive treatment in the societal and payer perspectives, but is less likely to offer good value for money for those with episodic migraine, unless lost productivity costs are considered.
Keywords
Introduction
Migraine is a common, neurological disorder frequently accompanied with pain, light sensitivity, sound sensitivity, vomiting, or nausea (1). The condition affects approximately 14.7% of the world's population and is associated with a significant burden (2). Migraine is more common among certain populations, specifically women and individuals between 35 and 45 years old (3). Migraine patients can be further classified into episodic and chronic migraine (EM and CM, respectively) populations. Individuals with 0 to 14 headache days per month on average, approximately 90% of all patients with migraine, are classified as EM, while the remaining 10% are classified as CM and experience an average of 15 or more headache days per month (4,5).
The economic burden of migraine to healthcare systems, patients, and employers is substantial. Using administrative claims data, several authors found higher annual direct medical costs among patients with migraine compared to matched patients without migraine; more specifically, the authors found all-cause healthcare costs to range between 1.6 and 2.5 times greater among patients with migraine (6,7). Given the relatively young age of the affected population (8,9), migraine also results in substantial indirect costs in the form of disability and lost work productivity. Based on data from the 2006 AMPP follow-up study, individuals with transformed migraine/CM reported an average of 15 headache days in the past month, 21 hours per month lost to reduced productivity, and 7 hours per month lost to absenteeism (8). Moreover, indirect costs arising from lost productivity represent approximately 36–56% of total costs among EM patients and 40–70% of total costs among CM patients (8,10), demonstrating a higher indirect cost burden among CM patients (11–13).
Pharmacologic treatment of migraine falls into two categories: Acute or preventive. Many options have focused on the treatment of acute attacks; however, the American Academy of Neurology and the Canadian Headache Society support the use of preventive therapies as well (14,15). Preventive therapies, which have the goal of reducing the frequency, duration, and severity of future migraine headaches, have been demonstrated to significantly reduce the rate of headache days among migraine patients (16–19). According to the American Academy of Neurology, strong evidence supports the use of beta-blockers and anti-epileptic therapies, among others, as preventive medications for migraine and as such, these therapies are frequently used as first-line medications in EM (14,15) and have been used off-label in CM. While these therapies have been shown to be cost-effective in preventing migraine attacks (20), they have also been associated with adverse events and suboptimal adherence rates (21,22). Moreover, onabotulinumtoxinA was approved for the prophylactic treatment of CM in 2010 (23) and has been shown to be clinically efficacious (19) and cost-effective (24) in this indication.
The use of erenumab at a dose of 140 mg, a treatment targeting the calcitonin gene-related peptide (CGRP) receptor, is supported by two clinical trials. In an EM population, Goadsby et al. found patients treated with erenumab to experience a significant reduction in monthly migraine days (MMDs) from baseline to months 4 through 6 compared to patients treated with placebo while maintaining a similar safety profile. Additionally, 50.0% of patients treated with erenumab versus 26.6% of patients treated with placebo experienced a 50% or greater reduction in MMDs (17). For the EM population, the baseline number of MMDs per month was approximately eight for both groups. In a CM population, Tepper et al. found erenumab to significantly reduce the mean number of MMDs from baseline to weeks 9–12 and maintain a similar safety profile compared to a placebo population. In the active treatment group, the mean reduction of MMDs was 6.6, while placebo reduced the mean number of MMDs by 4.2. For the CM population, the baseline number of MMDs per month was approximately 18 for both groups (16).
The objective of this study is to understand the cost-effectiveness of erenumab 140 mg (“erenumab”) compared with no preventive treatment (NPT) or onabotulinumtoxinA for the prophylactic treatment of EM and CM.
Methods
Model overview
A hybrid Monte Carlo patient simulation and Markov cohort model was constructed to compare erenumab to NPT or onabotulinumtoxinA among adult ( ≥ 18 years) patients with EM and CM who failed prior preventive therapy from both the US societal and payer perspectives. The reasons for evaluating both perspectives were threefold. First, the societal perspective reflects the working age of the EM and CM populations (8,9), for which migraines impact missed work days and lost work productivity. Second, this approach is consistent with prior cost-effectiveness analyses in migraine prophylaxis, in which the societal and payer perspectives were reported as dual reference case analyses (20,25). Third, the recommendations made by the Second Panel on Cost-Effectiveness in Health and Medicine suggest that all cost-effectiveness analyses report the societal perspective as a reference case (26).
Through Monte Carlo simulation methods, patients entered the model one at a time (27) and were assigned to a post-treatment MMD category based on baseline MMDs and treatment effect. The model used monthly cycles based on the length of the erenumab pivotal clinical trials (16,17). Patients were followed for a period of 2 years in the base case, consistent with the short-term duration of other published economic models (20,24,25,28,29), and accumulated costs and utilities associated with their post-treatment MMDs. The primary outcome of the model included the incremental cost-effectiveness ratio (ICER) presented as cost per quality-adjusted life year (QALY) gained. The model was programmed in Microsoft Excel 2016.
Model structure
The model consisted of two cohorts, one with EM and a second with CM. Patients in both cohorts must have failed at least one previous preventive therapy prior to model entry since CGRP pathway antagonists are expected to be used as second-line therapies due to the expected high cost of CGRP pathway antagonists. Patients in the EM cohort must have had between 4 and 14 MMDs at baseline, while patients in the CM cohort must have had at least 15 MMDs at baseline. The model compared erenumab to NPT in the EM and CM cohorts; given that onabotulinumtoxinA is approved for the indication of CM (23), erenumab was additionally compared to onabotulinumtoxinA in the CM cohort.
The model was constructed based on the primary efficacy endpoint in the erenumab pivotal studies in EM and CM (16,17), which included the change from baseline to the end of the double-blind phase in the mean number of MMDs per 28 days. Following model entry, patients received a one-time treatment benefit resulting in a number of MMDs at the end of the first one-month cycle. The one-time treatment benefit is based on the time to response in the erenumab pivotal clinical trials, wherein an initial response to treatment was observed at month 1 of the trial and sustained or moderately improved through the end of the trial (16,17). Additionally, in an OLE study of erenumab 70 mg, Ashina et al. observed a sustained response to erenumab from week 12 of the phase 2 clinical trial through week 60 of the open-label follow-up (30); the model assumes that this sustained response would also be observed in patients receiving erenumab 140 mg. Costs and utilities were assigned based on the number of MMDs at the end of the first cycle, which were held constant in subsequent cycles due to the absence of long-term efficacy data.
Patient flow
At model entry, patients were assigned a baseline number of MMDs from a sampled distribution (mean and standard deviation [SD]) from the erenumab and onabotulinumtoxinA clinical trials and entered the model one at a time to receive erenumab, NPT, or onabotulinumtoxinA (in the CM cohort only) in separate simulations. The mean age and sex distribution were derived and pooled from the erenumab and onabotulinumtoxinA clinical trials (EM: 40.9 years and 85.6% female; CM: 41.9 years and 84.0% female). Following receipt of therapy at the start of cycle 1, patients were assigned a change from baseline in MMDs based on a sampled distribution (mean and SD) from the erenumab and onabotulinumtoxinA clinical trials. Based on each simulated patient's baseline MMDs and change in MMDs from baseline, the post-treatment number of MMDs at the end of cycle 1 was calculated and patients were aggregated into the following MMD categories for the EM and CM cohorts: EM 0–3 MMDs, 4–9 MMDs, and 10–14 MMDs; CM 15–19 MMDs, 20–23 MMDs, and 24–30 MMDs. Costs and utilities were applied to each post-treatment aggregated MMD category. At the end of cycle 1, patients were assigned a probability of treatment discontinuation and death. Patients who survived in cycle 1 continued to the next model cycle.
Following cycle 1 (i.e. in cycles 2+), patients in the erenumab arm (EM and CM cohorts) and onabotulinumtoxinA arm (CM only) who remained alive and did not discontinue therapy at the end of cycle 1 maintained the MMDs simulated in cycle 1. This assumption is consistent with an open-label extension (OLE) study, in which erenumab 70 mg patients with EM were followed for an additional year beyond the completion of the erenumab EM phase 2 clinical trial and maintained their post-treatment change from baseline in MMDs from the parent study for 48 weeks (30). Patients who discontinued treatment with erenumab or onabotulinumtoxinA maintained their simulated number of MMDs, since efficacy data were derived from the intent-to-treat populations of the clinical trials, which already accounted for the impact of treatment discontinuation on efficacy. Patients in the NPT arm (EM and CM cohorts) maintained the simulated baseline MMDs at the beginning of cycle 1 for the duration of the model time horizon, up until death. A visual representation of the model process for the EM and CM cohorts can be found in Figure 1.
Model process for erenumab, onabotulinumtoxinA, and NPT among patients with EM and CM who failed prior preventive therapy.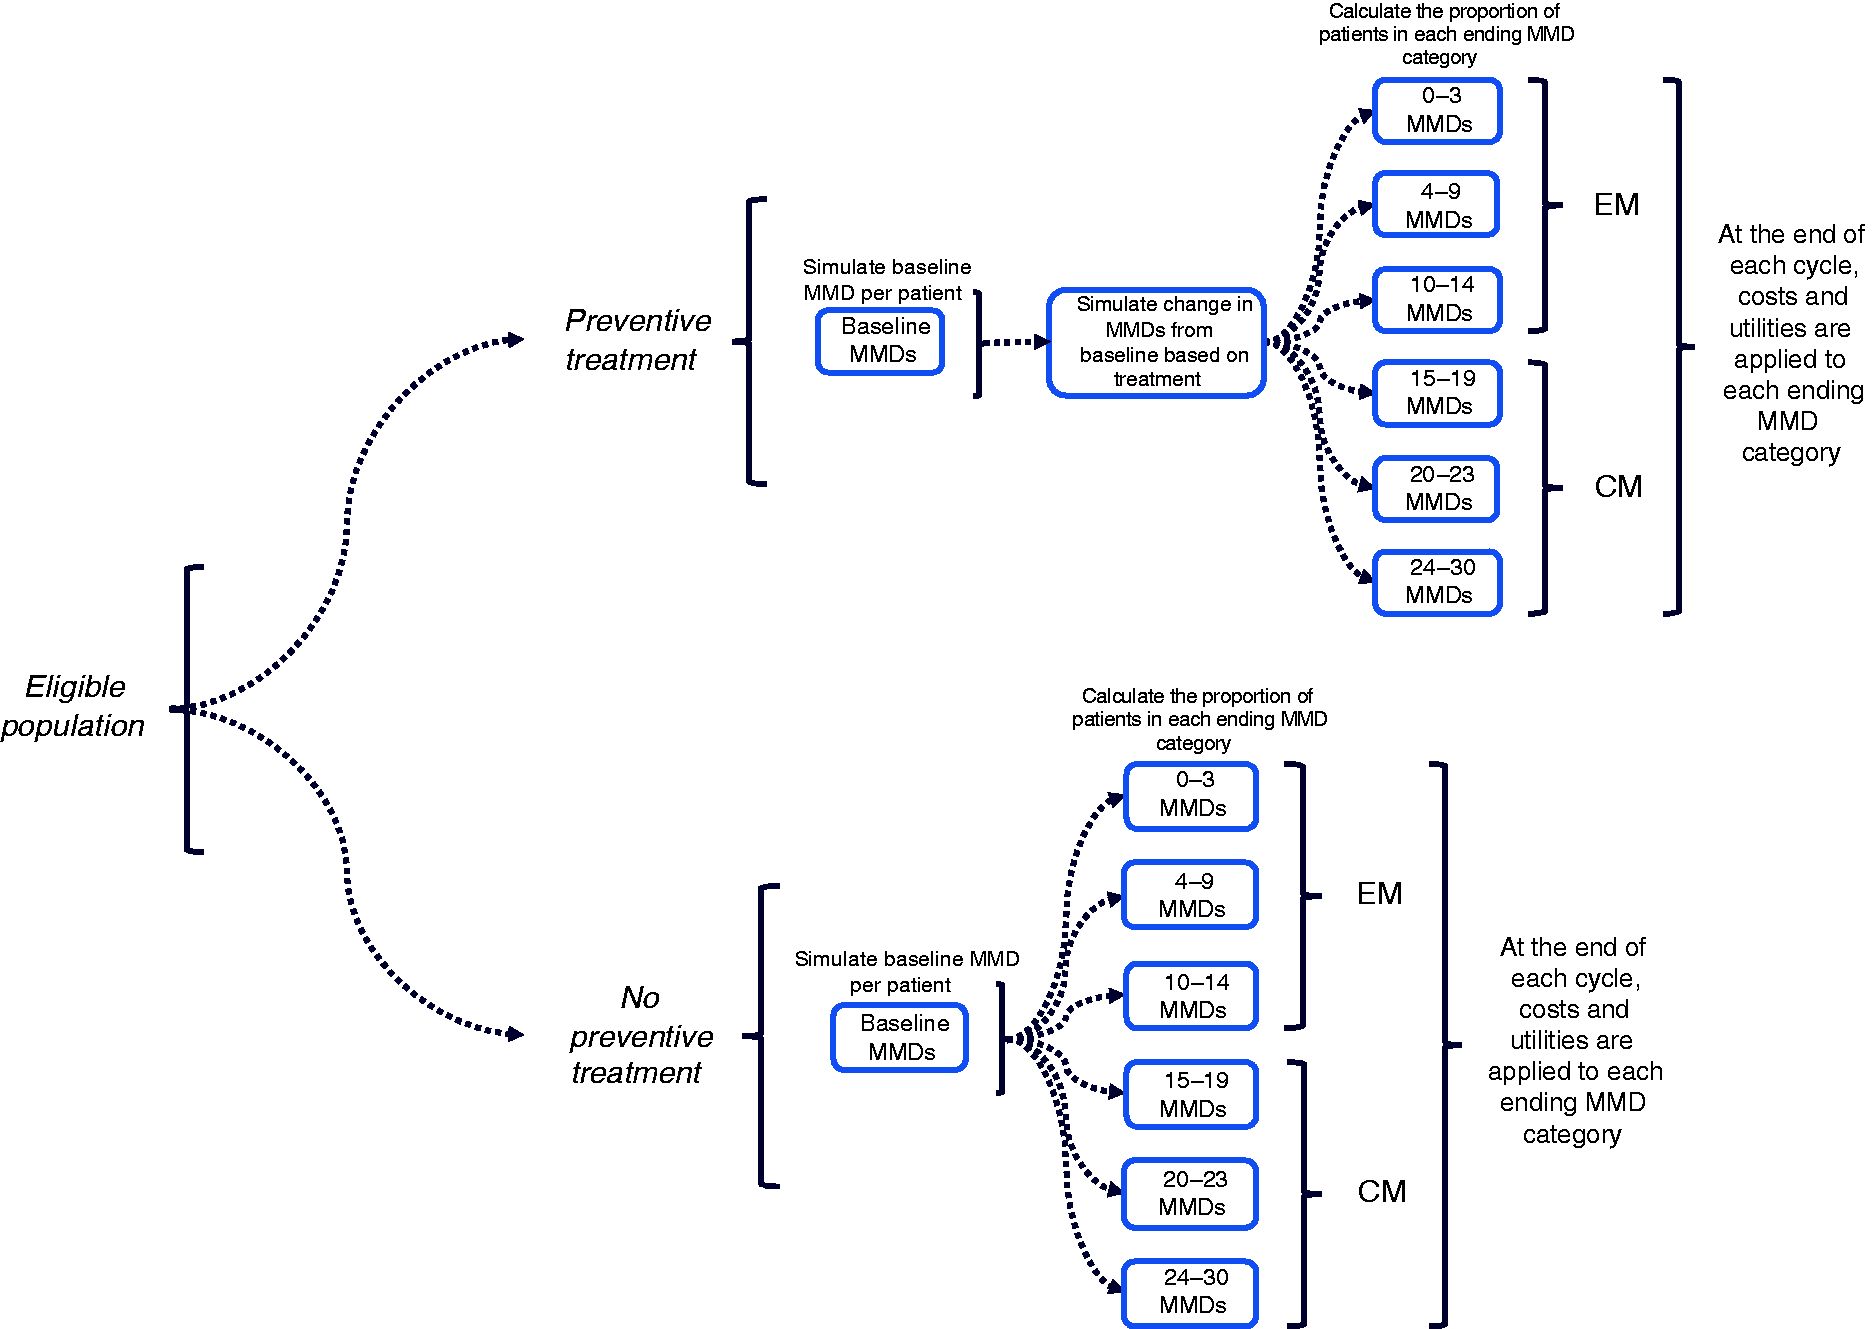
In addition to simulating a baseline MMD value for each patient, the model simulated a baseline number of acute medication days per month based on the reported mean (SD) baseline number of acute medication days in the clinical trials. The percent reduction in MMDs for erenumab and onabotulinumtoxinA was then applied to this simulated baseline acute medication days to impute the post-treatment number of acute medication days. In a hypothetical example, a 25% change in MMDs from baseline was applied to four baseline acute medication days to estimate three post-treatment acute medication days. The simulated baseline number of acute medication days for NPT was assumed to be constant, since NPT was assumed to not reduce MMDs (i.e. no treatment effect associated with NPT).
Patients were tracked throughout the model and were assigned literature-based costs and utilities associated with their MMD category. Costs and utilities were then aggregated at the end of each cycle and throughout the model time horizon.
Model inputs
Model parameters.

Note: EM: episodic migraine; CM: chronic migraine; PSA: probabilistic sensitivity analysis; SD: standard deviation; MMD: monthly migraine day; USD: US dollar; NSAIDs: nonsteroidal anti-inflammatory drugs; ED: emergency department; NA: not applicable.
Estimates that were derived from the original source.
Estimates that were varied in the patient simulation, assuming a normal distribution.
Values varied in the PSA were sampled from the distributions noted in the table and further defined by alpha and beta estimates, which were derived from the mean and SD or standard error (SE). For estimates with no SD or SE, we assumed the mean. For a complete list of alpha and beta values used in the PSA, please see Appendix Table 2.
Clinical parameter estimates
Data for baseline MMDs and change from baseline in MMDs were obtained from the erenumab EM and CM clinical trials (16,17) as well as from the onabotulinumtoxinA CM clinical trial (19). While the pivotal studies of erenumab consisted of all-comer patients including those newly-treated with preventive therapy, a proportion of patients in both the EM and CM populations had experienced prior treatment failure with a prophylactic (26% and 66% in EM and CM, respectively) (16,17). Sub-group analyses of the clinical trials were conducted to assess the efficacy of erenumab 140 mg among patients with EM and CM who failed at least one prior preventive therapy; the results indicated a more pronounced change from baseline associated with erenumab 140 mg relative to the respective placebo arms when compared to the relative differences from the pivotal studies (31). Since the findings from the sub-group analyses were not published in peer-reviewed journals, efficacy data for erenumab 140 mg from the pivotal studies were applied to the model population, leading to a more conservative approach.
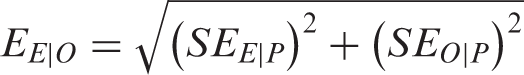
Efficacy data from the NPT arm of the model were obtained from the placebo groups of the erenumab pivotal studies in EM and CM (16,17), while efficacy data from the onabotulinumtoxinA pivotal study were used (19). Derived estimates for the mean change in MMDs from baseline for erenumab compared to onabotulinumtoxinA were estimated via an indirect treatment comparison that applied Bucher's method (32). Under Bucher's method, the placebo groups from both the erenumab and onabotulinumtoxinA pivotal trials were pooled. The mean change in MMD for erenumab versus placebo was calculated as the weighted average of the mean MMD measures of the included clinical trials that compared erenumab to placebo. The mean change in MMD for onabotulinumtoxinA versus placebo was estimated similarly. The indirect estimate of erenumab versus onabotulinumtoxinA was based on the paired comparisons of the mean MMD estimates per the following:

Treatment discontinuation
Data regarding rates of treatment discontinuation for the first 6 months following treatment initiation were available from the erenumab pivotal trials in EM and CM and the pivotal trial of onabotulinumtoxinA. All cause-related discontinuation rates from these trials were applied to cycles 1–6 of the model. However, long-term data regarding rates of treatment discontinuation for erenumab 140 mg and onabotulinumtoxinA are lacking. As a result, assumptions were made using data from the OLE study of erenumab 70 mg for model cycles 7+. In particular, for erenumab 140 mg, NPT, and onabotulinumtoxinA, the model estimated a discontinuation rate for cycles 7 + based on the ratio of discontinuation of erenumab 70 mg in the OLE study to the rate of discontinuation of erenumab 70 mg in the EM and CM pivotal trials. This ratio was then applied to erenumab 140 mg and onabotulinumtoxinA discontinuation rates from their respective pivotal trials; the ratio was applied to the pooled placebo arms from the erenumab 140 mg and onabotulinumtoxinA pivotal trials for the NPT arm of the model. All discontinuation rates were normalized to monthly rates using the DEALE method (33,34).
Health-related quality of life
Health utility data were derived from the International Burden of Migraine Study (IBMS), a cross-sectional, web-based, observational survey conducted in 10 countries to ascertain the burden of individuals with EM and CM (9). Outcomes included healthcare resource utilization, health-related quality of life (HRQoL), headache-related disability, lost work productivity, anxiety and depression. HRQoL was assessed via the EuroQol five dimensions (EQ-5D) and utility results were presented by MMD category (i.e. 0–3, 4–9, 10–14, 15–19, 20–23, 24+) (9,35).
Direct and indirect costs
Direct preventive treatment costs
Patients in the erenumab or onabotulinumtoxinA arms were assigned a monthly treatment cost up until the earliest of end of the model time horizon, treatment discontinuation, or death. Patients discontinuing erenumab or onabotulinumtoxinA were assigned a monthly treatment cost associated with NPT up until the earlier of end of the model time horizon or death. The annual cost of erenumab was $6900 (a monthly cost of $575), which was based on the US list price (36). The monthly cost of onabotulinumtoxinA was $310.52, which was obtained from public sources (37), and the monthly cost of NPT was assumed to be $0. In addition to drug costs, the cost of administration of erenumab was assumed to occur in cycle 1 only for patient education purposes and was based on one physician office visit (CPT code 99213: $73.93) (38). Similarly, the administration cost associated with onabotulinumtoxinA was $149.30 based on a single physician office visit for chemodenervation and was assigned to each quarterly administration.
Direct acute treatment and healthcare service costs
Acute medications included the use of acetaminophen, anti-emetics, ergotamines, NSAIDs, opioids, and triptans. The proportion of patients with EM and CM using each type of acute medication was obtained from published literature (39). The daily cost of each acute medication was based on the maximum daily dose and published drug prices (37,40). A weighted average of acute medication costs (i.e. proportion of each acute medication multiplied by daily costs) were estimated separately for the EM and CM cohorts, and were multiplied by the number of MMDs requiring acute medications.
In addition to acute medications, the use of acute medical services was estimated and included in the model. Since published estimates of acute medical services are indicated per migraine attack (25,41–43), we assumed one attack per MMD. The probabilities of a physician visit per attack, ED visit per attack, and hospitalization per attack were obtained from the published literature (25,41–43), and were multiplied by each patient's simulated MMDs to obtain the estimated resource use in a cycle. The estimated resource utilization was then multiplied by the cost per attack (44) to obtain each patient's direct medical (non-pharmacy and non-administration) costs per cycle, which were subsequently summed across cycles.
AE-related costs
The most common types of AEs reported in the pivotal studies of erenumab included nasopharyngitis, upper respiratory tract infection, sinusitis, constipation, arthralgia, and injection-site pain (16,17), and were assumed not to influence healthcare resource utilization. Moreover, the rate of serious AEs from the pivotal studies of erenumab was found to be low (16,17). As such, the costs and disutilities associated with AEs were not included in the model, which was consistent with other published models (20,24,25).
Indirect costs
In the societal perspective, indirect costs were estimated in terms of work productivity lost, estimated based on the number of hours of lost work associated with an MMD. Based on previous literature, three lost hours of work per attack were assumed (25); similar to the estimation of the use of acute medical services, each MMD in the model was assumed to be an attack. The number of total work hours lost per model cycle, estimated by multiplying the lost hours per attack by the number of simulated MMDs at the patient level, was multiplied by the mean 2017 private sector hourly wage in the US (45) to obtain the total cost of work loss. Only those EM and CM patients participating in the workforce were considered (39); additionally, the total cost of work loss was normalized for full-time workers (proportion of EM and CM patients who were full-time workers multiplied by five out of seven working days per week) and part-time workers (the proportion of EM and CM patients who were part-time workers multiplied by 2.5 out of seven working days per week) (39).
All cost input values were inflated to 2017 USD using the medical care component of the Consumer Price Index.
Mortality
It was assumed that the treatments in the model did not have an impact on mortality. As a result, age- and sex-specific all-cause mortality rates were derived from the 2014 Center for Disease Control and Prevention (CDC) US life tables from the National Vital Statistics Reports for both EM and CM cohorts (46). Annual mortality rates were converted to monthly rates using the DEALE method (33,34).
Discounting
A 3.0% annual discount rate was assumed. This was converted to a monthly rate and applied to utilities and costs for each monthly cycle using the DEALE method (33,34).
Model outcomes
Model outcomes were evaluated over a 2-year time horizon in the base case. Total direct medical costs, along with disaggregated results, and total indirect costs from work productivity loss were estimated for each treatment arm in the model. Additionally, cumulative QALYs were estimated, which were calculated based on the quantity of life lived as well as the quality of life lived as estimated by EQ-5D scoring from the IBMS. ICERs were expressed as the cost per QALY gained and were estimated by dividing the difference in total costs between erenumab and each comparator by the difference in QALYs between erenumab and the comparator. ICERs were presented for the US payer and societal perspectives for the EM and CM cohorts.
Sensitivity analyses
To test the robustness of the base case results, multiple one-way sensitivity analyses (OWSA) were conducted. Model parameters tested included change in MMDs for erenumab and onabotulinumtoxinA, health utilities, erenumab and onabotulinumtoxinA drug prices, acute medication costs associated with EM and CM, EM and CM employment rates (labor force participation rates, proportion of full-time and part-time workers), hourly wage, and work hours lost per attack, and were varied by 15% above and below the base case input values.
Incremental base-case and scenario model results for patients with EM and CM who failed prior preventive therapy.

EM: episodic migraine; CM: chronic migraine; NPT: no preventive treatment; QALYs: quality-adjusted life-years; ICER: incremental cost-effectiveness ratio.
Note: Costs and QALYs were discounted at a 3.0% annual rate; costs presented in 2017 USD.
Scenario analyses
Several scenario analyses were conducted to assess the impact of alternative assumptions on the ICERs. While the base case analysis applied discontinuation rates from the erenumab 70 mg OLE study to model cycles 7+, the first scenario applied discontinuation rates from the pivotal studies to the entire model horizon. A second scenario analysis was conducted that limited the model time horizon to one year, given the absence of long-term efficacy and discontinuation data. A third scenario analysis was conducted that expanded the model time horizon from 2 years in the base case to 5 years in the scenario analysis. A fourth scenario analysis was conducted that assumed US public sector wages compared to private sector wages assumed in the base case. A fifth and final scenario analysis was conducted that assumed 50% of CM patients receiving erenumab and 50% of CM patients receiving onabotulinumtoxinA discontinued treatment at the end of year 1. This positive “stopping rule” scenario is based on observational data from the use of onabotulinumtoxinA indicating that CM improves within 1 year to the extent that patients no longer require preventive treatment (49,50). Also among CM patients, erenumab was compared to NPT assuming 50% of CM patients receiving erenumab and 0% of CM patients receiving NPT discontinued treatment at the end of year 1. We assumed a 0% stopping rule for NPT because these patients could not transition to subsequent preventive therapy. Similar scenario analyses have previously been conducted in cost-effectiveness analyses of preventive medication use in migraine (24).
Results
Base-case results
EM cohort
Base-case results were generated for the EM cohort, relative to NPT, from the US societal and payer perspectives over a 2-year time horizon (Table 2). Treatment with erenumab was associated with an increase in QALYs gained of 0.04 per patient in both societal and payer perspectives. Additionally, treatment with erenumab was associated with an increase in costs of $4500 per patient in the societal perspective, which resulted in an ICER of $122,167 per QALY gained. Similarly, in the payer perspective, treatment with erenumab was associated with an increase in costs of $6630 per patient which resulted in an ICER of $180,012 per QALY gained. Disaggregated cost results can be found in Figure 2.
Base-case per patient direct and indirect costs (2017 USD) for patients with EM and CM who failed prior preventive therapy.
CM cohort
Base-case results were also generated for the CM cohort from the US societal and payer perspectives over a 2-year time horizon (Table 2). Treatment with erenumab was associated with increases in QALYs gained of 0.03 and 0.10 per patient compared to onabotulinumtoxinA and NPT, respectively. In the societal perspective, treatment with erenumab was associated with increases in costs of $478 per patient compared to onabotulinumtoxinA, but cost savings of $1949 per patient compared to NPT resulted in an ICER of $15,360 per QALY gained compared to onabotulinumtoxinA and a dominant strategy compared to NPT (cost saving and more clinically effective). When considering the payer perspective, treatment with erenumab was associated with increases in costs of $2046 and $2319 per patient compared to onabotulinumtoxinA and NPT, respectively, resulting in ICERs of $65,720 and $23,079 per QALY gained, respectively. Disaggregated cost results can be found in Figure 2.
Sensitivity analyses
One-way sensitivity analysis
One-way sensitivity analyses model results for patients with EM and CM who failed prior preventive therapy.

EM: episodic migraine; CM: chronic migraine; NPT: no preventive treatment; QALYs: quality-adjusted life-years; ICER: incremental cost-effectiveness ratio.
Note: Costs and QALYs were discounted at a 3.0% annual rate; costs presented in 2017 USD.
Probabilistic sensitivity analysis
PSA were conducted to estimate the probability of simulations meeting WTP thresholds at $50,000, $100,000 and $200,000 per QALY gained from both the societal and payer perspectives; PSA results presented in the text below are from the societal perspective, while cost-effectiveness acceptability curves and cost-effectiveness planes for both perspectives are presented in the Supplementary material. In the EM cohort, erenumab versus NPT was cost-effective in 38%, 86% and 95% of simulations at WTP thresholds of $50,000, $100,000, and $200,000 per QALY gained, respectively. In the CM cohort, erenumab versus onabotulinumtoxinA was cost-effective in 99%, 99%, and 99% of simulations at WTP thresholds of $50,000, $100,000, and $200,000 per QALY gained, respectively. Compared to NPT for patients with CM, erenumab was cost-effective in 99%, 99%, and 99% of simulations at WTP thresholds of $50,000, $100,000, and $200,000 per QALY gained, respectively.
Scenario analyses
A first scenario analysis was conducted to apply treatment discontinuation rates from the pivotal studies to the entire model horizon. The ICER did not substantially change, under both the societal and payer perspectives (Table 2).
A second scenario analysis was conducted that limited the model time horizon to one year (Table 2). In both EM and CM, the ICER increased when erenumab was compared to NPT, likely due to a decrease in the incremental QALYs of erenumab over NPT. In CM, treatment with erenumab became a dominant strategy in the societal perspective when compared to onabotulinumtoxinA, which was due to cost-savings experienced by erenumab patients, while the incremental QALYs were on par with the 2-year time horizon.
A third scenario analysis was conducted that extended the model time horizon from 2 years in the base case to 5 years in the scenario analysis (Table 2). In the EM cohort, extending the model time horizon to 5 years resulted in an ICER of $40,255 for erenumab versus NPT in the societal perspective, and an ICER of $98,110 for erenumab versus NPT in the payer perspective. In the CM cohort, extending the model time horizon resulted in ICERs of $30,046 and $80,455 for erenumab versus onabotulinumtoxinA from the societal and payer perspectives, respectively. When comparing erenumab to NPT, the extended time horizon resulted in erenumab dominating NPT from the societal perspective (cost-saving and clinically more effective) and an ICER of $4091 from the payer perspective. Extending the time horizon resulted in lower ICERs in the societal and payer perspectives for the EM cohort and comparable ICERs in the societal and payer perspectives for the CM cohort.
A fourth scenario analysis was conducted that assumed US public sector wages compared to the private sector wages assumed in the base case (Table 2). The ICER did not substantially change in either the EM or CM cohorts.
A fifth and final scenario analysis was conducted that assumed 50% of CM patients receiving erenumab and 50% of CM patients receiving onabotulinumtoxinA discontinued treatment at the end of year 1 (Table 2). In the CM cohort, assuming a 50% positive stopping rule resulted in erenumab dominating onabotulinumtoxinA in the societal perspective and an ICER of $10,083 when comparing erenumab to onabotulinumtoxinA in the payer perspective. Erenumab dominated NPT from both the societal and payer perspectives under this scenario.
Discussion
Summary
In this analysis, we developed and implemented a hybrid Monte Carlo patient simulation and Markov cohort to evaluate the cost-effectiveness of erenumab for the preventive treatment of EM and CM. Based on an annual drug price of erenumab of $6900, our findings suggest that treatment with erenumab in the societal perspective ranges from a dominant strategy versus NPT among CM patients to an ICER of $122,167 per QALY gained versus NPT among EM patients. This range falls within the US-centric cost-effectiveness threshold range of $50,000 – $175,000 per QALY gained as described in the Institute for Clinical and Economic Review's Value Assessment Framework (47), suggesting that erenumab may represent reasonable value for money. When excluding productivity-related costs, the ICERs appear to be cost-effective among CM patients ($23,079 and $65,720 per QALY gained versus NPT and onabotulinumtoxinA, respectively), but not among EM patients ($180,012 per QALY gained versus NPT).
Sensitivity analyses demonstrated reasonable robustness when varying inputs in a deterministic or probabilistic manner; only the change in MMDs, health state utilities, erenumab treatment cost, and onabotulinumtoxinA treatment cost (when applicable) had a substantial impact on model results. In scenario analyses, only alternative model time horizons (1 year, 5 years) had an impact on ICERs for the EM cohort.
Comparison to other literature
There are few published cost-effectiveness models in preventive migraine therapy. Lipton et al. conducted a Markov health state transition model to estimate a value-based price (VBP) range for erenumab in migraine prevention (51). The VBP is defined as the price a manufacturer could charge to achieve pre-defined WTP thresholds. When comparing erenumab to NPT in the societal perspective, the authors found incremental differences in QALYs of 0.1849 and cost savings of $8482 over a 10-year model time horizon. Additionally, when using thresholds of $100,000 – $200,000 per QALY gained, Lipton et al. found an annual price of erenumab in the range of $14,238 – $23,998 in the societal perspective and $7,445 – $13,809 in the payer perspective. However, the results from the Lipton et al. analysis are not directly comparable to the findings from our model due to a number of structural differences in the underlying model design. First, the Lipton et al. analysis modeled MMD frequency as a continuous outcome based on patient-level data from the erenumab pivotal trials and utilized the absolute treatment effects from the same trials, whereas our model simulated MMD frequency using the average placebo-adjusted estimates from the erenumab pivotal trials. Second, while Lipton et al. independently modeled EM and CM cohorts, the outcomes (including the value-based price) were combined based on a distribution of EM and CM among all treated migraine patients, with greater emphasis given to the CM cohort (67% CM vs. 33% EM). In contrast, our model did not combine the results for the EM and CM cohorts. Finally, Lipton et al. analyzed a 10-year time horizon, whereas we analyzed a 2-year time horizon in the base case and a 5-year time horizon in a scenario analysis.
Another published cost-effectiveness model in migraine prevention compared onabotulinumtoxinA to NPT among patients with CM over a 2-year model time horizon (24). Using the payer perspective, the authors found incremental QALYs of 0.09 and incremental costs of £1367 (approximately $2300 in 2017 USD); comparing erenumab to NPT in the payer perspective, we found both a similar QALY differential and a similar cost differential (QALY differential of 0.10 and cost differential of $2319 in our analysis), yielding a slightly lower ICER ($23,079 per QALY gained in our analysis versus $25,000 per QALY gained in Batty et al.).
Limitations
Our study was not without limitations. First, the model was constructed based on primary efficacy data from the EM and CM pivotal trials of erenumab, which consisted of a mixed population of patients newly-initiating preventive treatment as well as those who previously failed at least one preventive treatment. At the time of model development, clinical trial data only among a refractory population did not exist in publication form, and therefore were not incorporated. Second, there is limited data from randomized, double-blind, placebo-controlled clinical trials beyond week 24 in EM and week 12 in CM. This limitation necessitated assumptions regarding the duration of treatment effect beyond the clinical trial duration. Future longer-term evaluations of preventive therapies in both EM and CM will allow for a more precise evaluation of the cost-effectiveness of erenumab. Third, health utility data were derived from IBMS and were assessed via the EQ-5D. While clinical trials of erenumab collected data on the Migraine Specific Questionnaire (MSQ) version 2.1, a disease-specific QOL survey instrument which could be mapped to the EQ-5D to obtain health utilities (52), the clinical trials of onabotulinumtoxinA did not include the same. This prevented utility derivation from migraine-specific QOL scales, which help ensure sensitivity to changes in health status and disease severity (53); as a result, relying on generic HRQoL scales may have led to more conservative differences in QALYs between erenumab and the comparators. Finally, simplifying assumptions were made regarding the discontinuation of erenumab and onabotulinumtoxinA. Primarily, discontinuation rates were derived from clinical trials and patients transitioned to NPT following discontinuation, neither of which may reflect real-world clinical practice; however, sensitivity and scenario analyses adjusting the rate of discontinuation did not have a large impact on model results.
Conclusion
This analysis provides a cost-effectiveness evaluation of a new prophylactic therapy for EM and CM from both the US societal and payer perspectives. The use of erenumab may be a cost-effective approach to preventing MMDs among patients with CM versus onabotulinumtoxinA and NPT in the societal and payer perspectives, but is less likely to offer good value for money for those with EM, unless lost productivity costs are considered.
Footnotes
Clinical implications
The annual economic burden of migraine in the US is high, with indirect costs due to lost productivity accounting for 36–56% of these costs among patients with episodic migraine (EM) and 40–70% of these costs among patients with chronic migraine (CM). First-line preventive medications in EM have been associated with adverse events and suboptimal adherence rates (e.g. propranolol, topiramate); onabotulinumtoxinA was approved for the preventive treatment of CM and has been shown to be clinically efficacious and cost-effective in this indication. Cost-effectiveness analyses were conducted to compare a novel CGRP receptor (erenumab 140 mg) with no preventive treatment (NPT) or onabotulinumtoxinA for the prophylactic treatment of EM and CM in both the US societal and payer perspectives. Our findings suggest that the use of erenumab may be a cost-effective approach to preventing monthly migraine days among patients with CM versus onabotulinumtoxinA and NPT in the societal and payer perspectives, but is less likely to offer good value for money for those with EM, unless lost productivity costs are considered.
Declaration of conflicting interests
The authors declared no potential conflicts of interest with respect to the research, authorship, and/or publication of this article.
Funding
The authors disclosed receipt of the following financial support for the research, authorship, and/or publication of this article: This study was sponsored by Amgen Inc. Matthew Sussman, Jennifer Benner, and Joseph Menzin are employees of and Peter Neumann is a consultant to Boston Health Economics, Inc. and were paid consultants to Amgen Inc. in connection with the study and development of this research article.
Supplemental Material
References
Supplementary Material
Please find the following supplemental material available below.
For Open Access articles published under a Creative Commons License, all supplemental material carries the same license as the article it is associated with.
For non-Open Access articles published, all supplemental material carries a non-exclusive license, and permission requests for re-use of supplemental material or any part of supplemental material shall be sent directly to the copyright owner as specified in the copyright notice associated with the article.