
Abstract
Background
Patients with familial hemiplegic migraine type 2 (FHM2) have a mutated ATP1A2 gene (encoding Na+,K+-ATPase α2 subunit) and show prolonged migraine aura. Cortical spreading depression (CSD), which involves mass depolarization of neurons and astrocytes that propagates slowly through the gray matter, is profoundly related to aura.
Methods
In two types of Atp1a2-defective heterozygous mice, Atp1a2tm1Kwk (C-KO) and Atp1a2tm2Kwk (N-KO), the sensitivity and responsiveness to CSD were examined under urethane anesthesia.
Results
In both cases, heterozygotes exhibited a low threshold for induction of CSD, faster propagation rate, slower recovery from DC deflection, and profound suppression of the electroencephalogram, compared to wild-type mice. A high dose of KCl elicited repeated CSDs for a longer period, with a tendency for a greater frequency of CSD occurrence in heterozygotes. The difference of every endpoint was slightly greater in N-KO than C-KO. Change of regional cerebral blood flow in response to CSD showed no significant difference.
Conclusion
Heterozygotes of Atp1a2-defective mice simulating FHM2 demonstrated high susceptibility to CSD rather than cortical vasoreactivity, and these effects may differ depending upon the knockout strategy for the gene disruption. These results suggest that patients with FHM2 may exhibit high susceptibility to CSD, resulting in migraine.
Introduction
Familial hemiplegic migraine (FHM) is an autosomal dominant subtype of migraine with aura, and the diagnosis requires at least one first- or second-degree relative with migraine aura including motor weakness. Long-lasting aura consisting of reversible symptoms such as motor weakness and visual and sensory disturbances is characteristic of FHM patients (1). At present, FHM is divided into three types, based on the genetic alterations (2); type 1 has a mutation in CACNA1A (coding for α1a subunit of CaV2.1 calcium channel) on chromosome 19, type 2 has a mutation in ATP1A2 (coding for α2 subunit of Na+,K+-ATPase) on chromosome 1 and type 3 has a mutation in SCN1A (coding for an α subunit of NaV1.1 sodium channel) on chromosome 2. Patients with FHM2 caused by point mutations in ATP1A2 (3,4) show prolonged aura symptoms that are frequently associated with hyperperfusion and middle cerebral artery vasodilation (5) or partially reversible cortical metabolic dysfunction (6).
Human studies have indicated that cortical spreading depression (CSD) or CSD-like events within the occipital cortex may generate visual aura (7). Moreover, CSD activates trigeminovascular pathways in experimental animals (8), and optogenetically elicited CSD results in transient and unilateral suppression of motor function in freely moving mice, with a prolonged reduction of spontaneous active behavior (9). Indeed, S218L Cacna1a-mutated mice mimicked the clinical features of FHM1 and exhibited high sensitivity to CSD with an increased propagation velocity and high frequency of multiple CSD events after a single stimulus (10). Abnormal synaptic Ca2+ homeostasis and morphology were demonstrated in these FHM1 model mice, suggesting that chronic neurodegenerative changes may contribute to an enhanced vulnerability to ischemia in migraineurs (11). Thus, exploring the mechanism of FHM by using genetically modified mice may contribute to our understanding of the mechanism of common migraine.
The α2 isoform of Na+,K+-ATPase is mainly expressed in astrocytes and is important for K+ clearance after neuronal activation and uptake of neurotransmitters (12,13). Some mice genetically modified in the Atp1a2 coding region mimic the symptoms of FHM2 patients and show abnormal behavior (14–17). We previously established two lines of mice with a defective α2 subunit at the C-terminal portion, Atp1a2tm1Kwk (C-KO) (15), or at the N-terminal portion, Atp1a2tm2Kwk (N-KO) (18), and we reported the results of analysis of the two strains (see review (19)). Homozygous mutant mice die just after birth because of asphyxia, although they show apparently normal appearance (15,16,18). In this study, to clarify the pathogenesis of FHM2, we examined the sensitivity and responsiveness to CSD of the adult mice of these two lines, and we compared heterozygous and wild-type mice to elucidate the mechanisms involved.
Materials and methods
General procedures
Animals were used with the approval (No.09058) of the Animal Ethics Committee of Keio University (Tokyo, Japan), and all experimental procedures were in accordance with the university’s guidelines for the care and use of laboratory animals. We used C-KO heterozygotes in which a neomycin-resistance (neo) gene cassette was inserted in exon 21 of Atp1a2 (15) and N-KO heterozygotes (HT) in which a neo gene cassette was inserted in exon 2 (18), together with their wild-type (WT) littermates for comparison. Male mice of 9–11 weeks were used. In total, 48 mice were used for the experiment. Eight mice could not continue to protocol 2 (see below) because of exacerbation of their physiological condition. Another three mice (C-KO HT, N-KO HT and N-KO WT) were excluded because of death or decrease of ABP during the experimental procedures (protocol 1). Mice were housed under diurnal lighting in an air-conditioned room at a temperature of 23.0 ± 1.0℃ and humidity of 55 ± 7%, and were allowed food and tap water ad libitum.
Animals were anesthetized with urethane (1.1 g/kg of body weight, intraperitoneally) and additional doses were administered after protocol 1 (see below) and/or as required to maintain the depth of anesthesia, which was assessed in terms of stable physiological parameters and body movements. Each mouse was fixed to a head-holder (SG-4N modified to be flexible around the horizontal axis; Narishige Scientific Instrument Laboratory, Tokyo, Japan) and was intratracheally intubated to provide artificial ventilation with a small animal ventilator (SAR-830/AP, CWE, Inc., Ardmore, PA, USA) and to monitor endtidal CO2 with a CO2 analyzer (microCapStar, CWE, Inc.). Endtidal CO2 level was maintained constant by adjusting the ventilation volume and rate. Systemic arterial blood pressure (SABP) and heart rate (HR) were monitored with a non-invasive blood pressure monitor (MK-2000ST, Muromachi Kikai Co. Ltd, Tokyo, Japan) at the tail. Body temperature was maintained at around 37℃ with a heating pad and thermo-controller (BWT-100, Bioresearch Center Co., Ltd., Nagoya, Japan).
Measurement of DC potential and rCBF
Two direct current (DC) potential electrodes (EEG-5002Ag, Bioresearch Center Co., Ltd.) and the probes (BF52, Advance Co., Ltd., Tokyo, Japan) of a laser Doppler flowmeter (LDF) (ALF 21, Advance Co., Ltd.) were positioned on the dura and on the skull, respectively, of both hemispheres. DC potential was applied at 1-100 Hz and digitized at 1 kHz with a differential headstage and differential extracellular amplifier (Model 4002 and EX1; Dagan Co., Minneapolis, MN, USA). Continuous recordings of DC potential, regional cerebral blood flow (rCBF) and endtidal CO2 level were stored on a multi-channel recorder (PowerLab 8/30; ADInstruments Pty Ltd, Dunedin, New Zealand) and LabChart software (ADInstruments Pty Ltd) was used for off-line analysis as described previously (20). A schematic of the positions of the DC potential electrodes, LDF probes, and small windows for KCl application is shown in Figure 1(a). It is well established that CSD does not propagate from one hemisphere to the other. Therefore, we evaluated the profile of CSD susceptibility separately in the two hemispheres.
Experimental set-up and typical recordings. (a) Fixed positions of electrodes for DC potential, probes for laser Doppler flowmetry, and KCl application sites on the skull. (b) Typical recordings of DC potential, EEG and rCBF in both hemispheres during protocol 1. KCl solution at the indicated concentration was applied at the arrowhead. (c) Typical recordings of DC potential recorded at the distal portion and rCBF of both hemispheres during protocol 2. KCl (0.3 M) was applied on both hemispheres at the arrowhead.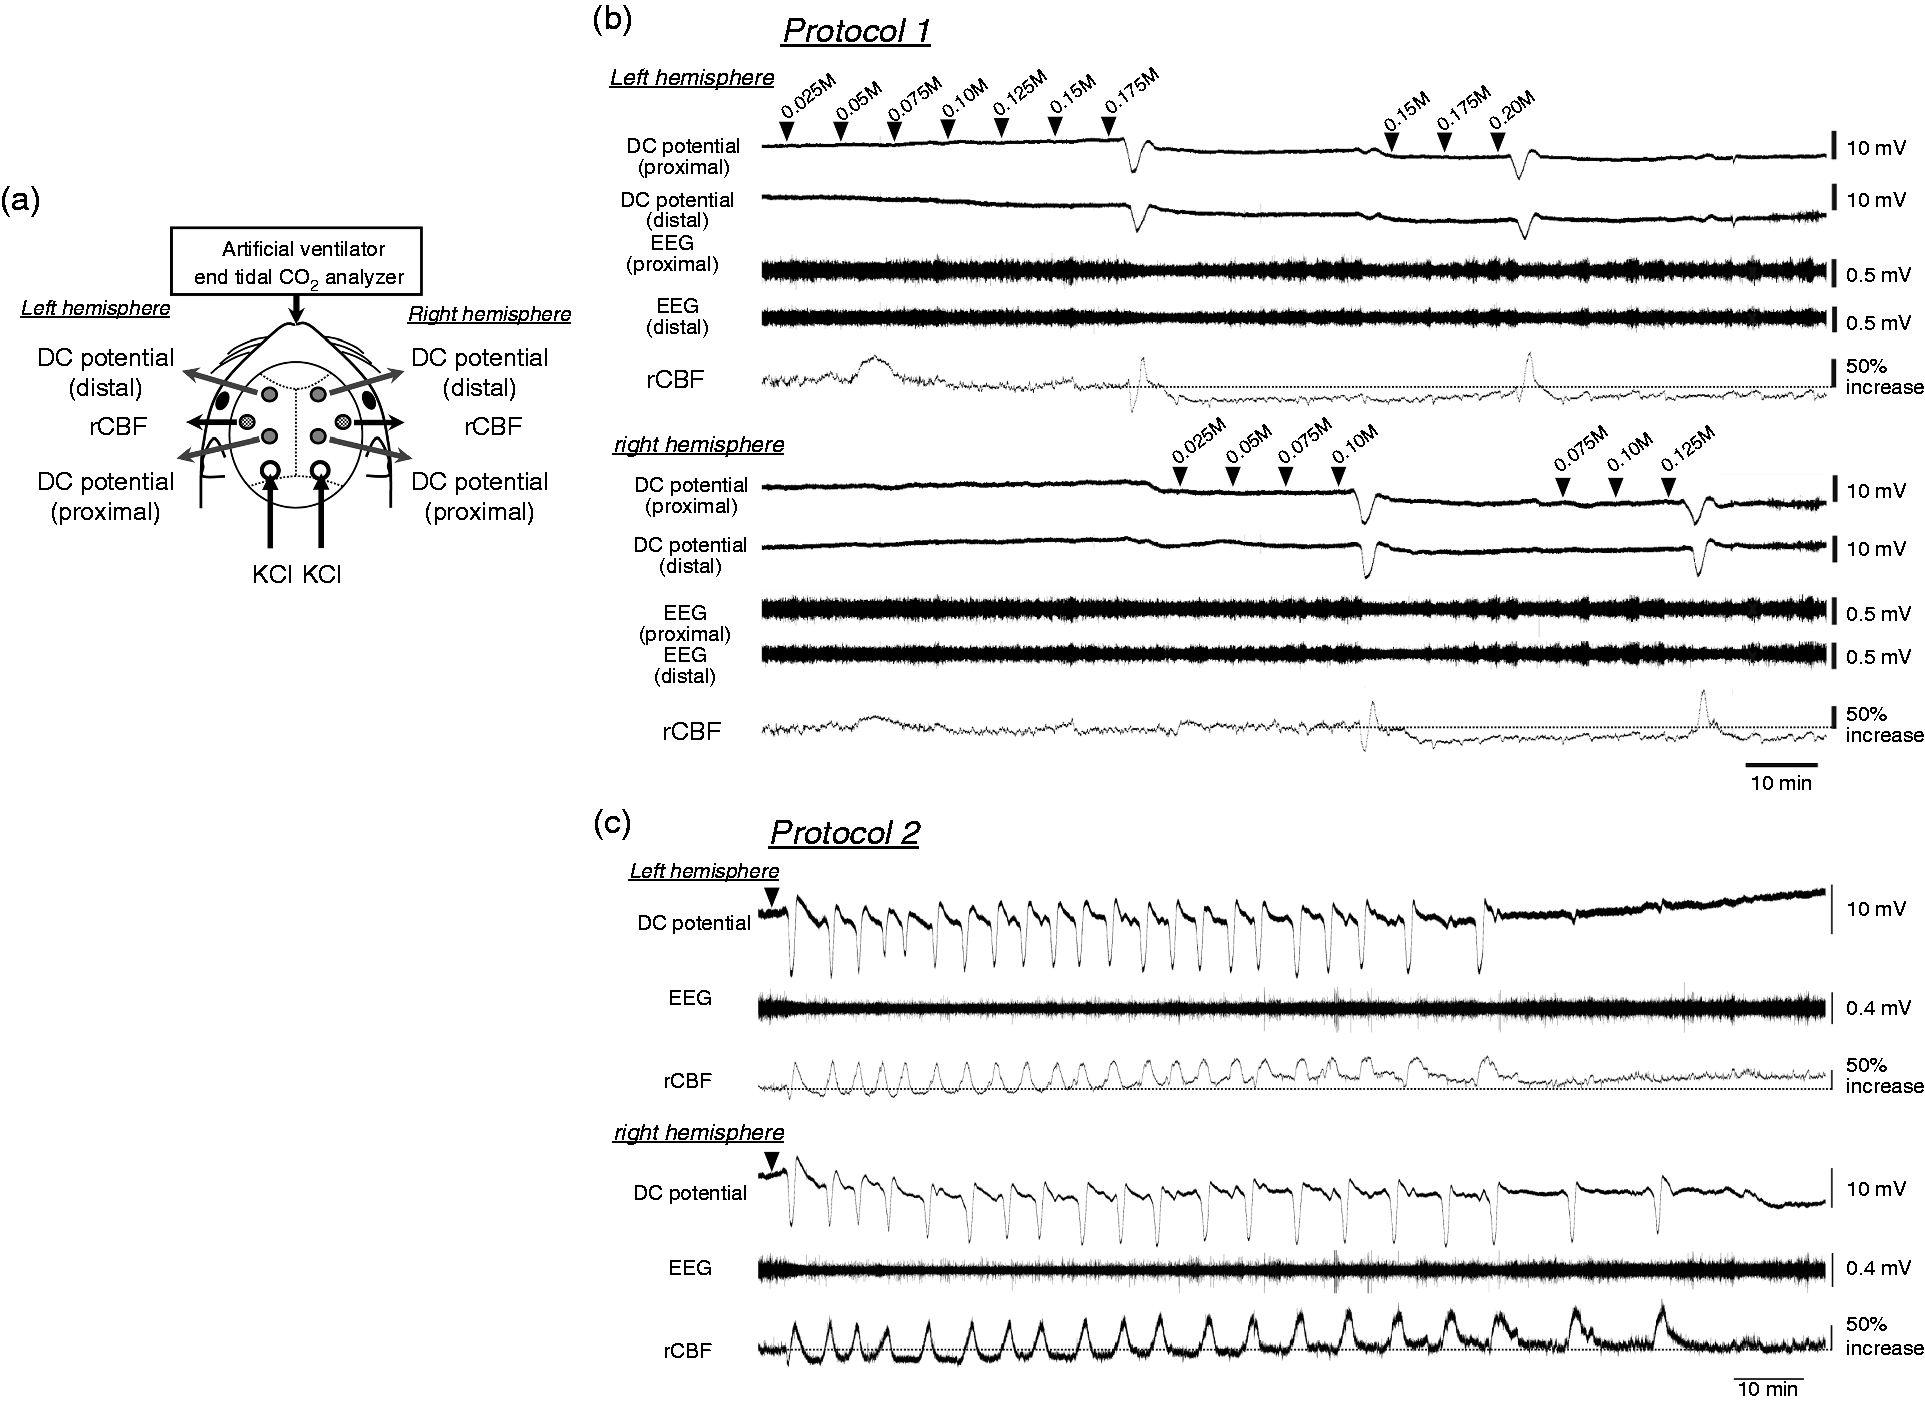
Protocol 1: Evaluation of threshold of CSD
The dura in the occipital holes for KCl application was slightly incised. After confirmation that no CSD episode had occurred for at least 30 min and all parameters had remained stable for at least 10 min, a 5 µl aliquot of 0.025 M KCl solution was dropped into the hole, followed by further aliquots with concentrations increasing successively by 0.025 M, at intervals of at least 5 min. The concentration in which CSD first occurred was considered as the CSD threshold (21). The procedure was repeated at the other hemisphere. Then, the evaluation was performed again from a lower concentration than the previous threshold (Figure 1(b)). The average of the two trials was considered as the threshold for each hemisphere.
Protocol 2: Evaluation of occurrence of CSD
At more than 1 hour after protocol 1, and when all parameters had remained stable for at least 10 min, 0.3 M KCl (10 µl) was dropped onto both sides (Figure 1(c)). CSD was elicited independently in both hemispheres; therefore, the data were separately evaluated. The repeated CSD was determined to have ended when no further CSD occurred during more than twice the interval between the previous two CSDs.
Data analysis
CSD profiles (propagation velocity, DC potential decrease, full width at half maximum (FWHM) and rCBF change) were evaluated for CSD elicited by KCl application according to protocol 1. CSD propagation velocity was calculated from the time-lag and distance between the proximal and distal electrodes. Maximum decrease of DC potential and FWHM were determined from the curves recorded at the distal electrode, because the basal level recorded at proximal electrodes may be affected by infiltrated potassium ions. Propagation velocity, maximum decrease of DC potential and FWHM were determined by averaging the results of the two trials in each hemisphere. Initial decrease and transient increase of rCBF were evaluated for the first CSD, because subsequent CSDs elicited only an increase, as seen in protocol 2. DC potential and rCBF were averaged for every 5 seconds and temporally averaged with a criterion time when the value fell below the pre-KCl average minus twice the standard deviation (SD) for protocol 1. For protocol 2, rCBF was temporally averaged with a criterion time when rCBF reached the minimum during the hypoperfusion phase at the initial CSD and when it reached the maximum during the hyperperfusion phase of subsequent CSD.
Sustained CSD effects (electroencephalogram (EEG) suppression and oligemia) were evaluated for single CSD elicited by KCl application or dura incision. EEG was obtained from the DC potential signal by digital filtering with a bandpass at 5–20 Hz as previously described (22). Root-mean-square values of EEG and rCBF were obtained for every 60 seconds, represented relative to the pre-CSD level and temporally averaged with a criterion time when the DC potential began to decrease. Maximum decreases of EEG and rCBF were evaluated for each animal.
All data are reported as means ± SD. HT and WT were compared using a 2-tailed t-test. A p-value of <0.05 was considered statistically significant.
Results
CSD responsiveness
Physiological parameters before/after CSD evaluation (Protocol 1) and before/after 0.3 M KCl application (Protocol 2).

SABP: systemic arterial blood pressure; HR: heart rate.

Summary of the CSD profile (protocol 1). (a) KCl concentration that elicited first CSD (CSD threshold). (b) Propagation velocity calculated from the distance and the time difference of two recordings of DC potential. (c) Temporal average of DC potential recorded at the distal electrode. Time 0 was set at the beginning of DC potential decrease. Heterozygotes (HT) are indicated in black and wild type (WT) in gray, and error bars show standard deviations. (d) The maximum difference of DC potential deflection recorded at the distal electrode. Heterozygotes (HT) are indicated in black and wild type (WT) in gray. (e) Full width at half maximum (FWHM) of DC potential deflection curve recorded at the distal electrode. (a–e) Black columns/lines show HT, gray columns/lines show WT, filled columns show C-KO, and shaded columns show N-KO. Data are mean ± SD. p-values between HT and WT were evaluated with a 2-tailed t-test and * and ** indicate statistically significant differences of p < 0.05 and p < 0.01, respectively.
The temporal average of DC potential was quite similar in both WT and HT mice (Figure 2(c)). The maximum decrease of DC potential was not significantly different between HT and WT (C-KO, p = 0.30; N-KO, p = 0.38) (Figure 2(d)); however, FWHM was significantly longer in HT N-KO mice (C-KO, p = 0.33; N-KO, p = 0.004) (Figure 2(e)). Namely, mass depolarization by CSD may be equivalent in the two lines, but recovery from depolarization may be slower in HT N-KO mice.
Electrophysiological effect of CSD
EEG was suppressed immediately after the first CSD passed and then gradually recovered (Figure 3(a)). Maximum EEG suppression was significantly larger in HT N-KO mice (C-KO, p = 0.91; N-KO, p = 0.01) (Figure 3(b)).
Electrophysiological changes of EEG evaluated as the root-mean-square value of digitally filtered DC potential recording after single CSD elicitation. (a) Temporal average for every 1 min after single CSD. Heterozygotes (HT) are indicated in black and wild type (WT) in gray, and error bars show standard deviations. (b) Maximum decrease of EEG just after CSD. Black columns/lines show HT, gray columns/lines show WT, filled columns show C-KO and shaded columns show N-KO. Data are mean ± SD. p-values between HT and WT were evaluated with a 2-tailed t-test and * indicates a statistically significant difference (p < 0.05).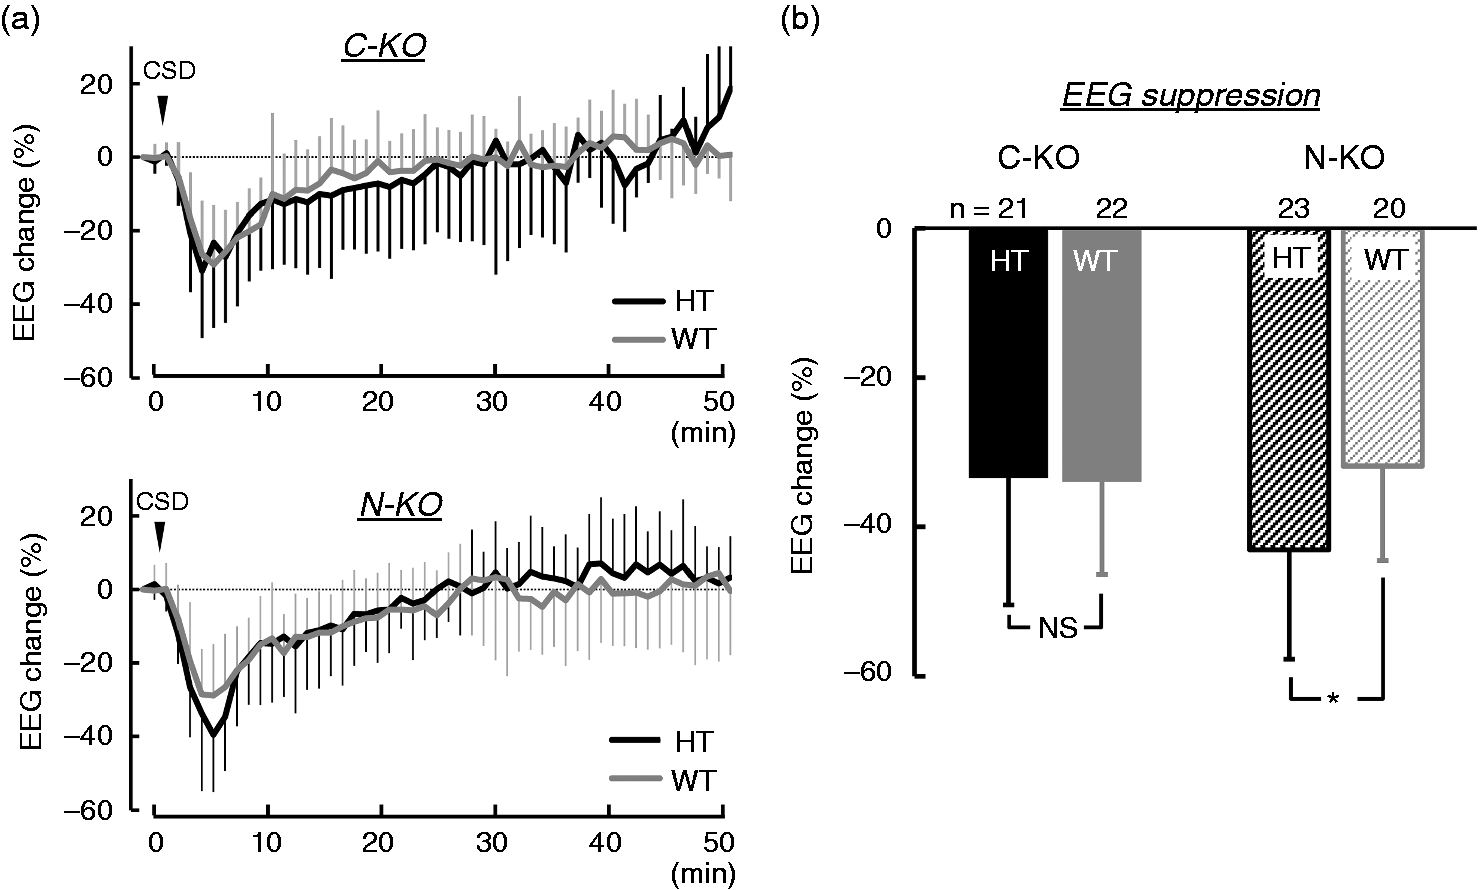
Effects on rCBF
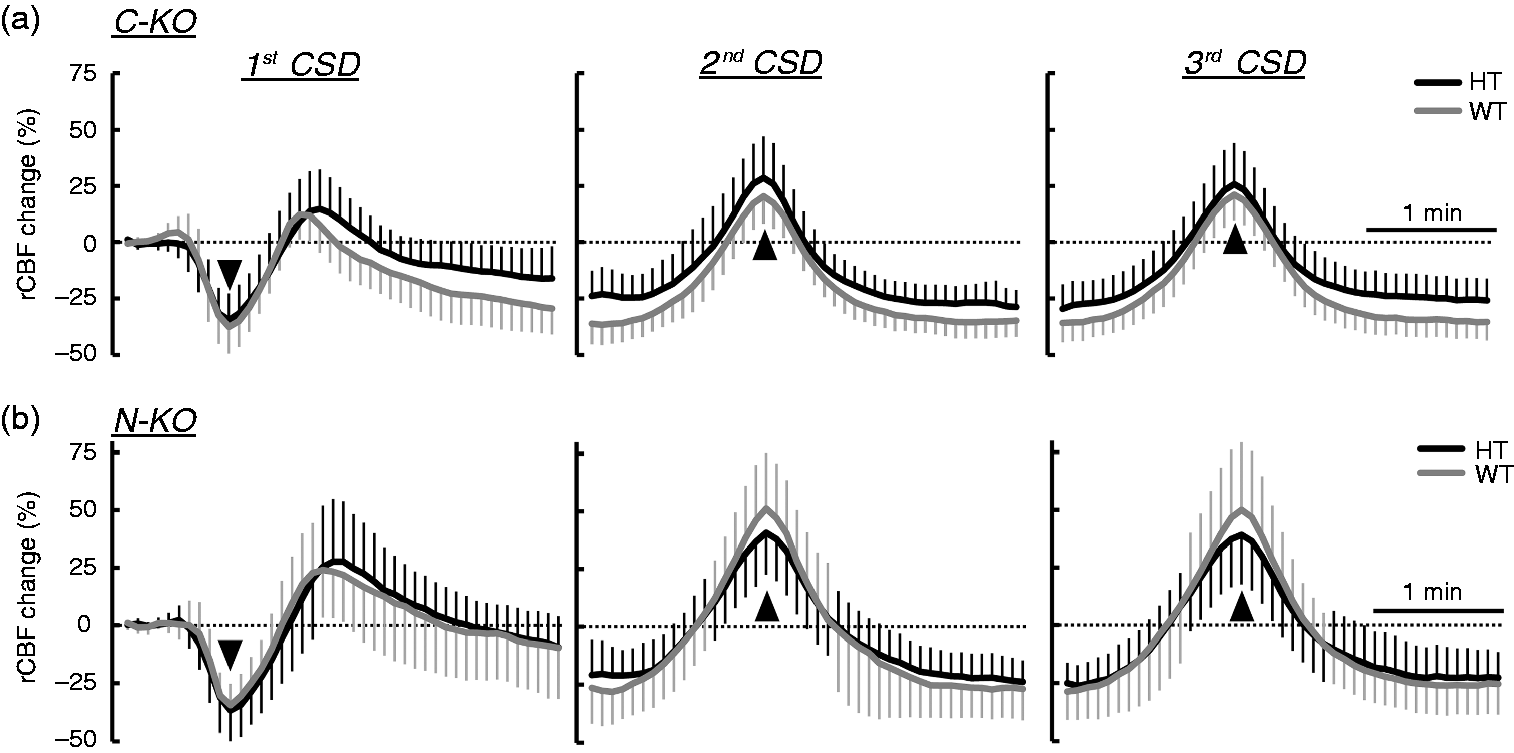
The initial decrease of rCBF elicited by first CSD seemed to be similar in the two lines (C-KO, p = 0.89; N-KO, p = 0.65) (Figure 4(a) and 4(b)). The subsequent increase of rCBF was slightly larger in HT than in WT, but this difference was not significant (C-KO, p = 0.094; N-KO, p = 0.34) (Figure 4(a) and (c)). Post-CSD oligemia followed the hyperperfusion, and then gradually recovered, but the temporal changes were almost the same, and the maximum extents of decrease were comparable (C-KO, p = 0.32; N-KO, p = 0.16) in HT and WT (Figure 4(d) and (e)).
Changes of rCBF in response to single CSD. (a) Temporal average of rCBF evaluated for every 5 sec in response to first CSD. Time 0 were set at the reversal point to the initial decrease. (b) Maximum decrease of rCBF just after CSD elicitation. (c) Maximum increase of rCBF following the initial decrease. (d) Temporal average of rCBF evaluated for every 1 min in response to single CSD. Time 0 was set at the beginning of the DC potential decrease. (e) Maximum decrease of rCBF during post-CSD oligemia. (a), (d) Heterozygotes (HT) are indicated in black and wild type (WT) in gray, and error bars show standard deviations. (b), (c), (e): Black columns show HT, gray columns show WT, filled columns show C-KO, and shaded columns show N-KO. Data are mean ± SD. p-values of differences between HT and WT were evaluated with a 2-tailed t-test.
Effects of single application of 0.3 M KCl
Single application of 0.3 M KCl elicited slightly more frequent CSDs, but the effect was not significant (C-KO, p = 0.12; N-KO, p = 0.47) (Figure 5(a)). The duration until the end of the repeated CSD was significantly prolonged in HT N-KO only (C-KO, p = 0.76; N-KO, p = 0.03) (Figure 5(b)). Temporal changes in rCBF were quite similar between HT and WT, whereas post-CSD oligemia was mild in HT C-KO (C-KO, p = 0.004; N-KO, p = 0.89) (Figure 6).
Elicitation of repetitive CSD by single application of 0.3 M KCl. (a) Frequency of CSD elicitation. (b) Duration to the end of CSD. Black columns show heterozygotes (HT) and gray columns mean wild type (WT), and filled columns mean C-KO and shaded columns show N-KO. Data are mean ± SD. p-values of differences between HT and WT were evaluated with a 2-tailed t-test and * indicates a statistically significant difference (p < 0.05). Temporal change of rCBF during repetitive CSD after 0.3 M KCl application. Time 0 were set at the maximum change, as shown by the arrowheads. (a) C-KO. (b) N-KO. Heterozygotes (HT) are indicated in black and wild type (WT) in gray, and error bars show standard deviations.
Discussion
Na+,K+-ATPase α2 subunit-knockout mice appeared to be more susceptible to CSD, and the difference of most parameters measured in this experiment was larger in N-KO mice than in C-KO mice. CSD threshold has been examined using the electrical induction technique in mouse models of FHMs (10,16,23–25). In addition, alteration of the CSD threshold was demonstrated by application of stepwise-increasing K+ concentrations during the natural estrous cycle in female mice (21), and a lower threshold was observed in female rats after injection of various concentrations of KCl, as well as in response to electrical stimulation (26). Thus, the results obtained from studies using electrical stimulation and KCl application appear to be consistent. Notably, the observations of low threshold of CSD and acceleration of propagation with little effect on induction of repetitive CSD in the present study are consistent with findings in knock-in mice carrying the human W887R mutation in the ATP1A2 orthologous gene (16). Our results thus support the idea that susceptibility to CSD is increased in FHM2. Furthermore, we demonstrated delayed recovery from mass depolarization (manifested as elongation of FWHM of DC potential deflection) and larger neuronal suppression after CSD passage (manifested as EEG suppression in HT), which do not conflict with the findings of a previous study demonstrating prolonged recovery of the electrocorticography signal after CSD in heterozygous α2+/G301R knock-in mice (14).
In adult HT mice, excitotoxity in the amygdala and piriform cortex was not observed as in homozygous neonates, but neural activity seemed to be enhanced in regions associated with fear/anxiety, learning/memory deficits, and reduced locomotor activity (15–17). The expression of Na+,K+-ATPase α2 subunit protein was reduced in Atp1a2+/R887 knock-in heterozygous embryos (16), whereas no apparent difference in protein expression or levels of neurotransmitters such as glutamate and GABA was observed between HT and WT in our models (15,18). Na+,K+-ATPase is important in clearance of extracellular potassium during neuronal activity, as well as released glutamate in the synaptic cleft, either alone and/or in cooperation with other transporters such as glutamate transporters, sodium/calcium exchanger and potassium/chloride cotransporter (15,18,27,28). At least in part, reduced extracellular potassium clearance may influence CSD susceptibility, delay of recovery from mass depolarization, and acceleration of CSD propagation. However, interaction with other components is also likely to play an important role in the integrated response. Na+,K+-ATPase α2 subunit binds sodium, potassium and ATP, and utilizes ATP hydrolysis to extrude sodium ions, thereby providing the sodium gradient that is essential for the transport of glutamate. Glutamate is one of triggers of CSD and promotes its propagation (29). The onset and propagation of CSD seem to be determined by the time courses of the concentrations of excitatory substances such as potassium and glutamate, and depend upon the concentration threshold for excitation, release rate, removal rate and effective diffusion constant (30). In fact, impaired glutamate transport and increased responsivity to acoustic stimuli (attributed to glutamate system defects) as well as reduced α2 protein levels in various area of brain were demonstrated in heterozygous α2+/G301R knock-in mice (14). Thus, insufficient activity of Na+,K+-ATPase may reduce clearance of synaptic glutamate and/or K+ in astrocytic pumps, resulting in high responsiveness to CSD and/or rapid propagation of CSD.
At least 81 mutations in ATP1A2 are known, and some of them are associated with non-hemiplegic migraine phenotypes and conditions other than FHM, such as cerebellar problems, childhood convulsions, epilepsy, and mental retardation, as reviewed by Friedrich et al. (12). Variation of the crystal structure of Na+,K+-ATPase and various alterations of cellular functions such as cation transport and enzyme turnover were demonstrated in Xenopus oocytes, and those were dependent on a subset of mutated residues (31). The results in this study, demonstrating a susceptibility difference between C-KO and N-KO mice, may indicate that the symptoms of mutant animals depend upon the residual gene function, such as dominant negative effect, which would be dependent upon the site of the deletion.
The role of CBF in FHM patients remains controversial. For instance, prolonged aura symptoms were frequently associated with hyperperfusion and middle cerebral artery vasodilation in FHM2 (5), and dysfunction of cortical metabolism coupling with CBF in FHM2 (6) and in FHM1 (32). Furthermore, blood-brain barrier opening may affect vasogenic delayed cortical edema in FHM2 (33). On the other hand, CSD causes drastic changes in microcirculation and metabolism (34,35), produces a decrease in vascular reactivity, and plays a significant role in disrupting neurovascular coupling during post-CSD oligemia (36). In this study, we found little difference in the rCBF response to CSD, in accordance with a previous study (14). Furthermore, there were no significant differences of rCBF change and long-lasting EEG suppression and recovery between HT and WT. However, the possibility that neurovascular coupling is disrupted and/or the possibility of a delayed effect of CBF changes cannot be excluded.
High susceptibility to CSD, increased propagation velocity and frequent induction of multiple CSD have been demonstrated in Cacna1a-defective mice, developed as a model of FHM1 (10, 25, 37). FHM1 and FHM2 mutations both render the brain more susceptible to CSD, by causing either excessive synaptic glutamate release (FHM1) or decreased removal of K+ and glutamate from the synaptic cleft (FHM2) (16, 28). Thus, these model mice may be valuable tools for studying the mechanisms of various brain diseases, including migraine, seizure, ataxia, and cerebral edema.
Article highlights
Heterozygotes of Atp1a2-defective mice have a low threshold for induction of cortical spreading depression (CSD), faster propagation rate of CSD, slower recovery from DC potential deflection and profound suppression of the electroencephalogram, compared to wild-type mice. Differences in these endpoints are dependent upon the deletion strategy of the gene. Characteristics of regional cerebral blood flow changes induced by CSD are similar in heterozygotes and wild-type mice.
Footnotes
Acknowledgements
The authors would like to thank Dr Haruki Toriumi and Dr Taeko Ebine from Keio University for their technical assistance in this study. MU and KI made substantial contributions to the conception, design, acquisition of the data and drafting manuscript. MU, KI, and KK contributed to the analysis and interpretation of the data. All authors fully agree with the interpretation of the data and approved the manuscript to be published.
Declaration of conflicting interests
The authors declared no potential conflicts of interest with respect to the research, authorship, and/or publication of this article.
Funding
The authors disclosed receipt of the following financial support for the research, authorship, and/or publication of this article: This work was supported by JSPS KAKENHI Grant Numbers 26350981 (Unekawa M), 26461284 (Ikeda K), 15K06760 (Tomita Y), 16K08629 (Kawakami K) and 22390182 (Suzuki N).