
Abstract
Objective
After sumatriptan was approved by the Food and Drug Administration in 1992, triptans became first-line anti-migraine therapies. Rapidly rising triptan expenditures, however, led payers, including Medicaid, to implement cost-containment policies. We describe triptan utilization and reimbursement trends in Medicaid.
Methods
Using national summary files for outpatient drug utilization, utilization and expenditure data from 1993 to 2013 were extracted and summed for all triptan national drug codes reimbursed by Medicaid. Data were collected separately for tablets, injections and sprays.
Results
The number of triptan prescriptions increased from 87,348 in 1993 to 0.9 million in 2004; fell to 0.4 million in 2009; rose to 1 million in 2011; and rose 1.2 million in 2013. In 2013, Medicaid spent $96.8 million on triptans: 74.4%, 18.4% and 7.2% for tablets, injections and sprays, respectively. Average reimbursement per prescription was $54 for tablets, $351 for injections and $235 for sprays in 2013. From 1993 to 2013, sumatriptan was the most widely prescribed among the triptans.
Conclusions
The substantial increase in triptan prescriptions from 2009 to 2011, without being convincingly explained by either rising migraine prevalence or rising Medicaid enrollment, is suggestive of reduced access to these medications prior to 2009. Cost-containment policies may have inadvertently prevented Medicaid migraineurs from obtaining appropriate pharmacotherapy.
Prior presentations
An earlier version of this paper was presented as a poster at the Annual Meeting of the International Society for Pharmacoeconomics and Outcomes Research, Philadelphia, PA, May 2015, where it received a finalist award.
Introduction
Migraine is a chronic neurological disorder characterized by recurrent episodic attacks of moderate to severe headaches (1–3). Migraine headaches are often accompanied by nausea, vomiting, sensitivity to light or sound and usually target just one side of the head (4). The burden of migraine headaches is substantial. The pain of a typical migraine headache can last from several hours to several days (5). In the United States, it is estimated that 11.7% of the population suffers from migraine headaches, although females suffer disproportionately more than males (a 17.1% prevalence rate for females versus a 5.6% rate for males) (6). The annual cost of migraine in the United States was recently estimated at $23 billion, including $11 billion in direct medical costs of migraine treatment and $12 billion in lost productivity (values in 2004 US dollars) (7,8).
Triptans reimbursed by US Medicaid programs: 1993–2013.
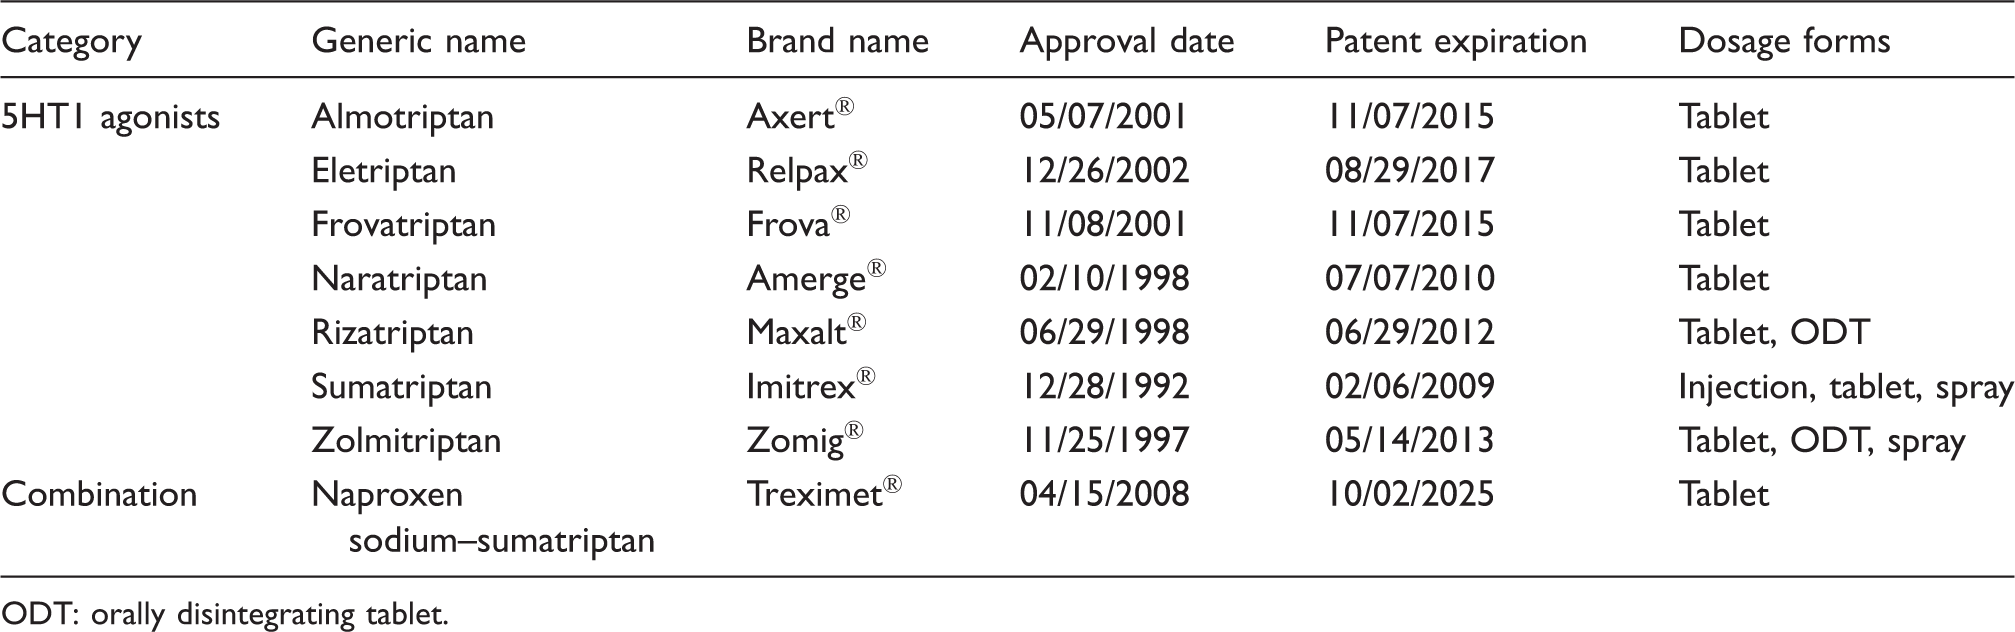
ODT: orally disintegrating tablet.
Medicaid is the largest US public health insurance program for nonelderly individuals, and covered nearly 70 million Americans in 2015 (11). All state Medicaid programs have a prescription drug benefit as well as a disproportionate share of female beneficiaries (12); hence, millions of migraineurs were covered by Medicaid over the last two decades. Moreover, although incidence and prevalence rates are not available specifically for the Medicaid population, there is some indication that lower-income individuals suffer severe headaches and migraines disproportionately. In 2011, whereas only 12.7% of adults with incomes at 400% or more of the poverty level reported suffering from a severe headache or migraine within the last 3 months, those percentages were 23.7% and 20.7% for individuals with incomes below 100% of the poverty level and between 100% and 199%, respectively (13).
Because of the relatively large number of migraineurs, coupled with rapidly rising triptan prices, state Medicaid programs were reluctant to provide carte blanche triptan coverage. Depending on the state, different triptans appeared on different state preferred drug lists (PDLs), while other drugs in the drug class required prior authorization (PA), reducing the number of treatment options available. In 2005, the Minnesota Medicaid program, for example, covered only branded zolmitriptan and branded rizatriptan (14), while the Wisconsin program covered only branded naratriptan, branded almotriptan and branded sumatriptan (15). Once the patent on branded sumatriptan expired in 2009, the states’ PDLs changed considerably. In 2014, for most states, only generic versions of the triptans were covered. Only a few states covered branded triptans, albeit with quantity restrictions (16,17).
The objective of this study was to track the utilization of triptans by Medicaid beneficiaries and the spending on triptans by Medicaid over the last 20 years. We also studied the trend in spending per prescription. Although several previous studies have looked at the cost of migraine drugs (7,18,19), no study has looked specifically at Medicaid beneficiaries and the cost to a large public insurance program.
Methods
A retrospective, descriptive study was conducted. Utilization and reimbursement data from the first (calendar) quarter of 1993 through to the last quarter of 2013 for outpatient prescriptions were collected from the national summary files of the Medicaid State Drug Utilization Data, which are publicly available and provided by the Centers for Medicare and Medicaid Services (20). These files aggregate data obtained from 50 Medicaid programs: those of all states, except Arizona (which is 100% managed care without a pharmacy-benefit carve out), plus the District of Columbia (20). The files contain neither demographic nor clinical information about beneficiaries; hence, they can give us no insight into the characteristics of those who take anti-migraine medication.
From the database, data were collected for each national drug code (NDC) drug form reimbursed by Medicaid for all of the triptans listed in Table 1 by searching the database for all relevant generic and brand names. The first five digits of the NDC identified the manufacturer of the drug, and the remaining digits indicated a specific drug product by strength, dose formulation and packaging (21). The dosage forms – (non-orally disintegrating) tablets (referred to simply as “tablets” in our analysis), orally disintegrating tablets (ODTs), injections and sprays – were then identified using the FDA’s NDC Directory (22). Due to the length of the study period, some of the NDCs were discontinued and had to be validated using alternative government sources (23,24). In addition to NDC and drug name, each data record included the year and quarter of Medicaid expenditure, the number of pharmacy prescription claims, the number of units (e.g., individual tablets) and total (pre-rebate) pharmacy reimbursement amount, which included both the drug cost and dispensing fee (21). Over most of the time period, manufacturers of innovator (brand name) drugs were required to pay 15.1% of the average manufacturer price as a rebate to Medicaid (25), although many states had a supplemental rebate program as well, bringing the rebate average, as a percentage of total Medicaid spending across all drugs, up to approximately 25% in 2005 (26). One of the provisions of the Patient Protection and Affordable Care Act of 2010 increased the federally mandated rebate percentage to 23.1% for brand name drugs (27). The database contains no information about triptan rebates.
In this study, the quarterly (and annual) numbers of prescriptions, as well as Medicaid expenditures, were summed separately for each of the dosage forms for every triptan in the study. Per-prescription payments were computed simply as expenditures divided by prescriptions. Most likely due to some confusion surrounding the transition of beneficiaries who were dually eligible for Medicaid and Medicare to Medicare Part D starting in January 2006, data were sometimes unreliable for 2006 and 2007. Hence, some of the data for those 2 years were imputed by averaging the values for quarters before and after the quarters for which coding errors were detected. However, because of the long time series, which started years before 2006 and ended long after 2007, we do not expect the overall conclusions of our work to be affected.
All data analyses were undertaken with SAS Version 9.2 (SAS Institute, Inc., Cary, NC) and Microsoft Excel 2010 (Microsoft, Redmond, WA). Because of the public nature of the database and the lack of information on Medicaid beneficiaries themselves, the research did not require review and approval by the Institutional Review Board at the University of Cincinnati.
Results
Annual summary data for Medicaid spending on triptans: 1993–2013.

ODT: orally disintegrating tablet.
Annual Medicaid spending per triptan prescription: 1993–2013.

ODT: orally disintegrating tablet.
In Figures 1 and 2, quarterly utilization and quarterly reimbursement, respectively, are shown for several of the individual triptans (all formulations together). Sumatriptan was the most prescribed drug for Medicaid patients from 1993 to 2013. Up until 2005, an upward trend in sumatriptan utilization and reimbursement is depicted. In 2005, Medicaid reimbursed pharmacies for over 125,000 prescription claims per quarter (Figure 1), resulting in per-quarter spending in that year of over $20 million for that one drug (Figure 2). From 2005 to 2009, the use of and payment for sumatriptan decreased down to approximately 30,000 prescriptions per quarter, at a cost to Medicaid of approximately $7 million per quarter. Starting in 2009, there was a reversal in this trend, with a substantial upward trend in utilization and a (less substantial) upward trend in reimbursement for sumatriptan.
Number of triptan prescription claims (all formulations) reimbursed by Medicaid: 1993 quarter 1–2013 quarter 4. Medicaid reimbursement for triptan prescription claims (all formulations) in millions of US dollars: 1993 quarter 1–2013 quarter 4.

The utilization and reimbursement market shares of the other triptans were much lower during these two decades. At its highest utilization, there were 50,000 prescription claims reimbursed by Medicaid for rizatriptan per quarter in 2011 and approximately 35,000 claims per quarter by the end of 2013. There were fewer than 15,000 claims processed per quarter for third-ranked eletriptan at the end of the study period. In 2013 quarter 4, Medicaid spent approximately $4 million on rizatriptan and $3.4 million on eletriptan, which is approximately the same amount as it spent on almotriptan, frovatriptan, naratriptan, zolmitriptan and naproxen sodium–sumatriptan combined (Figure 2).
Figure 3 depicts the quarterly trend in the per-prescription reimbursement for the individual triptans (oral tablets only). After the entry of the sumatriptan tablet at $117.51 per prescription, the other triptans followed at slightly lower price points. All triptan tablet prescriptions, however, rose in price over time until the entry of generic versions of the drugs. Both rizatriptan and frovatriptan reached a per-prescription reimbursement of over $300, while a prescription of zolmitriptan cost Medicaid over $350 in 2013. In Figure 3, we see a significant drop in per-prescription spending first for sumatriptan in 2009, followed by naratriptan, then rizatriptan and then zolmitriptan as patents expired. By 2013 quarter 4, Medicaid spent approximately $25 per generic sumatriptan prescription. At that time, it cost Medicaid approximately $60 per prescription for generic naratriptan and generic rizatriptan.
Medicaid per-prescription reimbursement for triptan tablet prescription claims in US dollars: 1993 quarter 1–2013 quarter 4.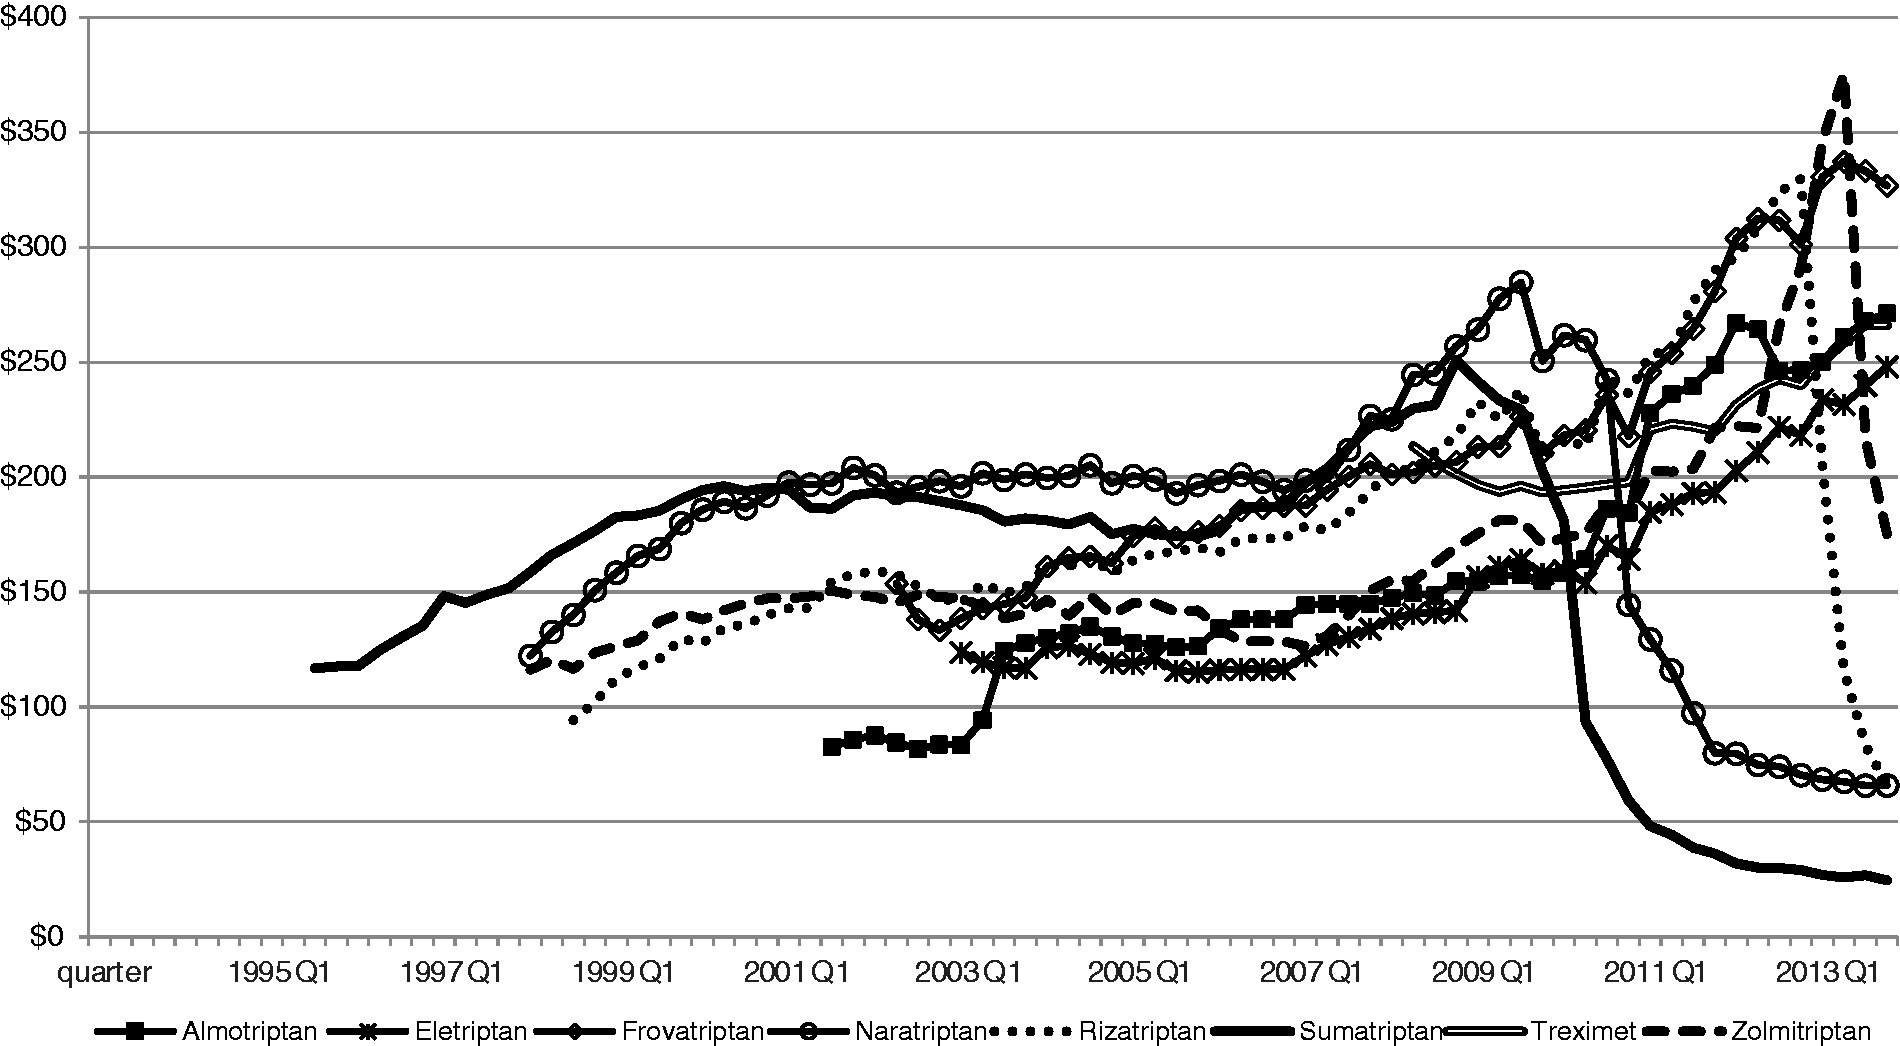
Discussion
Triptan expenditures
Our results indicate that spending on triptans by Medicaid increased from $7.2 million in 1993 to $96.8 million in 2013 (a more than 1200% increase), peaking at $152.8 million in 2004. Some of this increase was due to rising utilization, some due to rising prices for all of the drug formulations and some due to the addition of ODTs and sprays with more rapidly increasing prices than tablets. Despite this steep increase, the total spending by Medicaid on triptans in 2013 represented less than 0.5% of its total spending (of over $20 billion) (28) on outpatient drugs.
Nevertheless, rapidly rising triptan costs to Medicaid programs led to the adoption of PA programs in many states with the goal of cost containment. PA policies have been shown to be effective for reducing drug costs for various drug classes, including nonsteroidal anti-inflammatory drugs and proton pump inhibitors (29–31). The concern, however, is that the policies impede access to medications, affecting the quality of patient care, especially for vulnerable populations (31–34). Perhaps the most studied Medicaid PA policies have been those associated with atypical antipsychotics because of the large number of individuals with schizophrenia and bipolar disorder covered by Medicaid. Indeed, Medicaid spent $5.4 billion on atypical antipsychotics in 2005 (35). Results have been mixed, although many studies have found adverse patient outcomes such as declines in the use of antipsychotics, increases in emergency department visits and hospitalizations and increases in incarcerations following PA implementation (36–44).
Triptan prices
Average Medicaid spending per prescription increased rapidly over time. Rising drug prices were directly responsible. Whereas the consumer price index increased 61.2% from 1993 to 2013 (45), reimbursement per prescription for triptan injections rose 322.9% over the same time period. Over shorter time periods for ODTs and sprays, per-prescription spending increased 152.1% and 146.2%, respectively. From 1995 to 2008, there was an 80.3% increase in spending per triptan tablet prescription.
For tablets, the entry of generic manufacturers of oral sumatriptan in 2009 put an end to the observed upward trend, as competition brought down the price of generic oral sumatriptan and as state Medicaid programs switched away from branded sumatriptan with swift generic uptake. Similar declines were seen for per-prescription spending on naratriptan, rizatriptan and zolmitriptan as generic versions of these drugs became available. However, despite the availability of a generic sumatriptan injection as well in 2009, the price per injection prescription continued to rise. Medicaid and other payers experienced no price relief, a phenomenon that is seen in a number of other injectable drug markets as well (46).
Triptan utilization
Every year from 1995 to 2004, the total number of annual prescriptions rose over the previous year, reaching a peak of 906,466. Whereas some of this increase can be explained by an increase in Medicaid enrollment, some is attributable to a switch away from older migraine medications such as the ergot derivatives. Then, for the next 5 years, utilization decreased, reaching a low of 413,646 triptan prescriptions reimbursed by Medicaid in 2009. One reason for this decline is that, beginning in January 2006, the dual Medicaid–Medicare-eligible patients were transferred to the Medicare Part D pharmacy benefit program. Moreover, in response to the steeply rising costs of the triptans, as well as other drugs, many states were strengthening cost-containment policies over this period, reducing choice and quantity (47). (Because each of the 50 different state Medicaid programs had its own triptan policies and could potentially change those policies periodically over the long time period being analyzed, collecting information on all policy changes proved intractable.) Finally, the FDA issued an alert related to triptans in 2006, indicating a potentially life-threatening adverse effect with concomitant use of triptans and selective serotonin reuptake inhibitors or selective serotonin/norepinephrine reuptake inhibitors, which are two classes of antidepressants (48).
Then, from 2009 to 2011, utilization of triptans increased by an astonishing 146.9%. In attempting to explain such a substantial increase, one possibility is that migraine prevalence expanded over this 2-year period. However, Lipton and colleagues found that, prior to 2007, the epidemiological profile of migraine had remained stable for 15 years, with no evidence of rising prevalence (6). Moreover, there is no suggestion in the literature that prevalence has risen since 2007, nor in any case could a small increase account for much of this large rise in utilization. Another potential explanation for some of the increased utilization is that, between 2009 and 2011, there was increasing awareness and diagnosis of migraine (6), although it is likely that any increase in awareness would have been gradual rather than sudden. Furthermore, the triptans had been available for over a decade and a half by 2009. There was some increase in Medicaid enrollment during this period, which followed the most recent economic recession (December 2007–June 2009). Between June 2009 and June 2010, Medicaid enrollment rose by 7.2%, followed by a 4.8% increase between June 2010 and June 2011 (49). Again, however, these relatively small increases could not be responsible for the spectacular rise in triptan utilization. Finally, there is no evidence to suggest a changing Medicaid beneficiary distribution with a higher percentage of migraineurs (e.g., a higher proportion of women) over this period.
The most convincing explanation for the abrupt rise in utilization between 2009 and 2011 is that as the patents for sumatriptan and naratriptan expired in 2009 and 2010, respectively, most states changed their PDLs to include the generic, rather than branded triptans. Without the restrictive PA requirements, more migraineurs were able to obtain treatment, calling into question the treatment of migraine patients before patent expiration. The evidence points to the possibility that Medicaid migraineurs were underserved prior to 2009. Their most probable recourse was to turn to nonspecific migraine treatments, including aspirin, acetaminophen, nonsteroidal anti-inflammatory drugs, opiates (although heavily regulated themselves) or combination analgesics (3). This hypothesis is consistent with the results of Wilper and colleagues, who studied the impact of insurance status on migraine care in the USA from 1997 to 2007. After controlling for other factors, they found that migraineurs with no insurance or Medicaid were significantly less likely than the privately insured to receive abortive or prophylactic migraine therapy in physicians’ offices (50). To the extent that PA and other cost-containment policies made it difficult for Medicaid migraineurs to obtain triptan prescriptions over the last 20 years, questions are raised about fair and equitable treatment and medication access.
Sumatriptan dominated the Medicaid market during our study period. This result was consistent with national trends, although not necessarily with the evidence from clinical trials and other studies (51,52). National retail sales of branded oral sumatriptan increased from $858.2 million in 2006 to $972.8 million in 2008 (53). In keeping with the drop in Medicaid spending in 2009, the drop in retail sales of sumatriptan was substantial: down to $161.2 million in 2009 (53). The high market share that sumatriptan enjoyed over the two decades analyzed may be explained by a first-in-class advantage coupled with high promotion expenditures (GlaxoSmithKline started its direct-to-consumer advertising campaign for branded sumatriptan in 1998 and spent $82 million on sumatriptan advertising in 2005) (54), along with the lackluster evidence regarding the superior effectiveness or safety of any of the other triptans that followed sumatriptan into the market (51,52). Tablets dominated the Medicaid market as well over the last two decades due to their lower cost, additional convenience and fewer side effects relative to injections (55).
Limitations
First, patient-specific information was not available in the database; thus, it was not possible to determine indication for medication use or whether utilization of the triptans among Medicaid beneficiaries was appropriate, excessive or insufficient. Second, for both 2006 and 2007, many of the spending and utilization values had coding errors, requiring imputation of some of the 2006 and 2007 values. Third, all data are pre-rebate and so overstate actual acquisition costs to US Medicaid programs to some degree (which we cannot measure). Bias introduced by this omission is most likely minimal, however, because of our focus on trends over time. Furthermore, the implications of this study do not generalize to the US population, and although we have relied on a prescription as the unit of observation for this study, we realize that its meaning varied depending on medication and administration. However, further disaggregation of prescriptions into units (e.g. tablets) was beyond the scope of this study.
Not all Medicaid spending on and utilization of triptans were captured in the database. Drugs purchased by Medicaid managed-care organizations, which did not qualify for the Medicaid Rebate Program, were not included. Whereas in 1991 only 9.5% of the Medicaid beneficiaries were enrolled in managed-care plans, by 1996, 40.1% were in managed care (56). In 2010, 71.5% of beneficiaries were in managed care (57). However, not all managed-care organizations managed the drug benefit for their Medicaid patients. To the extent that Medicaid pharmacy carve outs continued to report their drug utilization to Medicaid, we were able to keep track of utilization and reimbursement. Nevertheless, “carving in” and “carving out” over time were unobservable in the data, so it was impossible to distinguish between actual changes in utilization and spending and changes in shares of prescriptions that were eligible for manufacturer rebates.
The movement of dual eligibles to Medicare Part D in 2006 was certainly responsible for some of the drop in spending for the next few years, as it was for Medicaid spending overall for prescription drugs (28). However, unlike many other diseases, which affect the elderly disproportionately, migraineurs have a younger age profile. According to Stewart and colleagues, most people will contract migraine before the age of 35; the median age of onset is 25 years among women and 24 years among men (58). Hence, a younger-age Medicaid population post-2006 should still have included the majority of people suffering from migraines.
Conclusion
In 2013, Medicaid spent (before rebates) $96.8 million on 1.2 million pharmacy prescription claims for triptan drugs, a class of drugs that clearly revolutionized the treatment of migraine headaches, bringing substantial relief to migraineurs. Because of the rapidly escalating costs over most of the last two decades, however, state Medicaid programs limited prescription choice and quantity through cost-containment efforts. Evidence of the policies’ apparent success was the substantial increase in utilization from 2009 to 2011 following patent expiration for sumatriptan and naratriptan, calling into question whether Medicaid migraineurs had adequate access to the triptans up until just a few years ago.
Key findings
Medicaid spent $96.8 million on triptans in 2013, less than 0.5% of its total outpatient drug spending. Branded and then generic sumatriptan dominated the Medicaid market from 1993 to 2013, while tablets were more widely used than injections or sprays. From 1993 to 2009, Medicaid spending per triptan prescription rose at a rate that substantially outpaced the consumer price index. Per-prescription spending on sumatriptan, naratriptan, rizatriptan and zolmitriptan fell as generic versions of these drugs became available from 2009 to 2013. The 146.9% rise in triptan utilization from 2009 to 2011 is suggestive of reduced access to triptans by Medicaid beneficiaries prior to 2009.
Footnotes
Authors’ contributions
JJG and YX conceived of and designed the study. YX assembled the data, conducted the statistical analysis and wrote the first version of the manuscript. CMLK provided guidance on methods, statistics and interpretation of results. PRW provided clinical expertise. CMLK and PCH closely edited the manuscript.
Acknowledgements
We would like to thank Chien-Hsiang Chiu for his helpful contributions to an earlier version of this project.
Declaration of conflicting interests
The authors declared the following potential conflicts of interest with respect to the research, authorship, and/or publication of this article: Ms Xia was a full-time doctoral student in Pharmacy Practice and Administrative Sciences, James L Winkle College of Pharmacy, University of Cincinnati Academic Health Center, when this research was conducted. She asserts no conflict of interest with respect to her employment at Medtronic.
Funding
The authors received no financial support for the research, authorship and/or publication of this article.