
Abstract
Background
There has been intensive debate whether migraine with aura (MA) and migraine without aura (MO) should be considered distinct subtypes or part of the same disease spectrum. There is also discussion to what extent migraine cases collected in specialised headache clinics differ from cases from population cohorts, and how female cases differ from male cases with respect to their migraine. To assess the genetic overlap between these migraine subgroups, we examined genome-wide association (GWA) results from analysis of 23,285 migraine cases and 95,425 population-matched controls.
Methods
Detailed heterogeneity analysis of single-nucleotide polymorphism (SNP) effects (odds ratios) between migraine subgroups was performed for the 12 independent SNP loci significantly associated (p < 5 × 10⁻⁸; thus surpassing the threshold for genome-wide significance) with migraine susceptibility. Overall genetic overlap was assessed using
Results
Significant heterogeneity of SNP effects (phet < 1.4 × 10⁻³) was observed between the MA and MO subgroups (for SNP rs9349379), and between the clinic- and population-based subgroups (for SNPs rs10915437, rs6790925 and rs6478241). However, for all 12 SNPs the risk-increasing allele was the same, and SECA found the majority of genome-wide SNP effects to be in the same direction across the subgroups.
Conclusions
Any differences in common genetic risk across these subgroups are outweighed by the similarities. Meta-analysis of additional migraine GWA datasets, regardless of their major subgroup composition, will identify new susceptibility loci for migraine.
Introduction
There has been extensive discussion in the migraine field concerning whether migraine with aura (MA) and migraine without aura (MO) are distinct subtypes or part of the same disease spectrum (1–4). Similar discussions concern how migraine cases ascertained from headache clinics compare to cases drawn from the general population, and how female migraine cases compare to male cases. In the current genomic age, a particularly important question is whether these major migraine subgroups have predominantly similar or distinct genetic aetiologies.
Results from the latest International Headache Genetics Consortium (IHGC) genome-wide association (GWA) meta-analysis of 23,285 migraine cases and 95,425 controls of European ancestry identified 142 single-nucleotide polymorphisms (SNPs) at 12 loci significantly associated (p < 5 × 10⁻⁸; thus surpassing the threshold for genome-wide significance) with migraine susceptibility. In addition, 1168 SNPs at 134 loci showed suggestive association (p < 1 × 10⁻⁵) with migraine (5). In the original study, SNP effect (odds ratio (OR)) heterogeneity (Cochran’s Q) and two-tailed binomial tests were utilised to assess whether the effect size of the 146 index (i.e. most strongly associated independent) SNPs significantly differed between the MA and MO, clinic- and population-based, and female and male subgroups. Although minimal SNP effect heterogeneity was observed at the 146 loci, subgroup comparisons for the genome-wide significant loci indicated the effect sizes were predominantly larger in the MO cases compared to MA cases, larger in the clinic-based compared to population-based cases, and remarkably similar in female and male cases. These results held for the clinic- versus population-based and female versus male case comparisons for the 146 index SNPs. Analysis of the 146 index SNPs with concordant effect directions in the MA and MO subgroups showed that only 49% had a larger effect size in MO cases compared to MA cases, which does not differ significantly from that expected by chance (two-tailed binomial test p = 0.93). However, given these 146 index SNPs were identified via a fixed-effect meta-analysis (which assumes that the true effect is the same in all studies), it is not surprising minimal heterogeneity was observed at these loci.
To more thoroughly assess the overall genetic overlap between these major migraine subgroups, we extend the analyses to SNP effects covering the entire autosome utilising our recently developed web-based application (SECA) to perform
Methods
Ethics statement
For all study cohorts, participation was based on informed consent. Each study was approved by local research ethics boards in the country where the study cohort was collected. See the original publication of the IHGC GWA meta-analysis for full details of ethics and consent procedures in each study cohort (5).
Cohorts and sample collection
The IHGC GWA meta-analysis utilised SNP marker data from 23,285 cases with migraine and 95,425 controls of European ancestry from 29 studies, including five clinic-based studies, mainly compared to population-matched control samples with unknown migraine status, as well as 13 population-based cohorts (5). To facilitate comparison of relative subgroup size and power, the effective sample size (Neff) = 4/(1/Ncases + 1/Ncontrols) was calculated (7). For a subset of the cohorts sufficiently detailed phenotype information was available to allow sub-classification into either of the two migraine subtypes, migraine with aura (MA: 5118 cases versus 74,239 controls, Neff = 19,152) or migraine without aura (MO: 7107 cases versus 69,427 controls, Neff = 25,788). The GWA data were also grouped into clinic-based (5175 cases versus 13,972 controls, Neff = 15,105) versus population-based (18,110 cases versus 81,453 controls, Neff = 59,264), and females-only (20,202 cases versus 63,593 controls, Neff = 61,326) versus males-only (3083 cases versus 31,832 controls, Neff = 11,243). For more detailed descriptions of the cohorts, please see the original report (5).
GWA results
Genome-wide SNP genotyping was performed independently in each cohort with the use of various standard genotyping technologies, and imputed for each study with reference to HapMap release 21 or 22 CEU phased genotypes (8). Each study contributed summary statistic data from an association analysis performed using a frequentist additive model based on estimated SNP allelic dosages, adjusting for gender. SNPs were filtered on a per-study level based on inclusion criteria of minor allele frequency (MAF) >0.1% and imputation quality measures of IA > 0.6 (IMPUTE 2) (9) or r2 > 0.3 (MaCH) (10). In the meta-analysis, combined association data for 3,015,196 unique imputed and genotyped autosomal SNPs were analysed in a fixed-effect model using GWAMA (11). Inconsistent SNP results were filtered out if they produced a very large heterogeneity coefficient (I2 > 75%) or were present in less than five studies. Less than 2% of SNPs produced I2 > 75%. There was little evidence of population stratification at the study level (genomic inflation factors, λ ≤ 1.1), while moderate, but expected inflation was observed at the meta-analysis level (λ = 1.13) (12). For a complete description, see the original publication of the 2013 IHGC migraine GWA meta-analysis (5).
SNP effect heterogeneity analysis
Cochran’s Q heterogeneity statistics and p values (Phet) were estimated via fixed-effect meta-analysis of the OR and 95% confidence interval (95% CI) for each SNP using GWAMA (11). Heterogeneity p values (phet) were estimated within and between the MA and MO, clinic- and population-based, and female and male subgroups. When the number of studies combined is small (<10) (13), the test has low power to detect heterogeneity if present, while if the number of studies is large, the test is likely to indicate heterogeneity, even if the absolute magnitude of the variability is unimportant (14). Considering the large number and size of the individual migraine GWA studies, we used phet ≤ 0.05 to indicate nominal evidence for SNP effect heterogeneity.
SECA approach
To assess the overall genetic overlap between the MA and MO, clinic- and population-based, and female and male subgroups, SECA (6) compared three sets of two (i.e. (MA, MO), (clinic-based, population-based) and (females, males)) GWA summary results, each containing five essential columns: i) reference SNP cluster ‘rs’ identification (ID) (SNP), ii) effect allele (EA), iii) non-effect allele (NEA), iv) p value from association test (p), and v) OR for the EA relative to the NEA. To ensure consistency across the subgroup comparisons, only SNPs passing quality control (QC) in all subgroups were utilised (n = 1,680,313).
SECA first aligned the SNP effects across the two GWA study summary results (dataset1, dataset2) to the same EA, and extracted a subset of independent SNPs via ‘p value informed’ linkage disequilibrium (LD) clumping using the PLINK program (15). The approach iterates from the first to last SNP on each chromosome sorted from smallest to largest p value in dataset1 (P1) that has not already been clumped (denoting this as the index SNP) and formed clumps of all other SNPs that are within 1 Mb and in LD (r2 > 0.1) with the index SNP based on HapMap2 genotype data. A second round of LD clumping was performed to clump any of the round 1 index SNPs within 10 Mb of each other to account for long-range LD (r2 > 0.1). The approach identifies the subset of independent SNPs with the most significant association p values (P1) in dataset1.
Restricting to SNPs associated with p1 ≤ (0.01, 0.05, 0.1, 0.2, 0.3, 0.4, 0.5, 0.6, 0.7, 0.8, 0.9, 1.0) in dataset1, SECA performed Fisher’s exact statistical tests using the R statistical package (16) to determine whether there is an excess of SNPs where the effect directions (OR) are concordant across dataset1 and dataset2 for the subset of SNPs associated with p2 ≤ (0.01, 0.05, 0.1, 0.2, 0.3, 0.4, 0.5, 0.6, 0.7, 0.8, 0.9, 1.0) in dataset2. For each of the 144 SNP subsets (generated using these 12 × 12 p value threshold combinations), Fisher’s exact statistical tests of SNP effects in dataset1 (i.e. OR1) and dataset2 (OR2) were performed on 2 × 2 tables containing the number of SNPs with OR1 < 1 and OR2 < 1, OR1 ≥ 1 and OR2 < 1, OR1 < 1 and OR2 ≥ 1, and OR1 ≥ 1 and OR2 ≥ 1. The proportion of SNP subsets with concordant (Fisher’s test (ORFT) ≥ 1) and discordant (ORFT < 1) SNP effects, together with an empirical p value adjusted for testing all 144 subsets (pFTsig-permuted), was calculated via permutation (1000 replicates) for the observed number of subsets (nFTsig) with nominally significant concordance (ORFT ≥ 1 and pFT ≤ 0.05). A permuted p value was also estimated for the single most significant concordant test (pFTmin-permuted). The permutation procedure first created uncorrelated datasets by randomly shuffling the observed SNP effect (OR1) and corresponding p value (p1) between SNPs in dataset1, and then repeats the analysis of the 144 SNP subsets. The SECA web-based application performs numerous other analyses – including pleiotropy tests agnostic to SNP effect direction, Q-Q and true discovery rate (TDR) plots, and ‘pleiotropy-informed’ conditional false discovery rate (FDR) results for dataset2 p values conditioned on dataset1 p values (6) – but here we report results only from the primary SNP effect concordance tests.
Comparison of SNP effect magnitude
An effectively random subset of independent SNPs were identified using an LD clumping approach analogous to above, except p values (p1) were dummy-coded as 0.5 during the clumping rounds. SNP effect comparisons were performed for SNPs with concordant effects in the MA and MO, clinic- and population-based, and female and male subgroup pairs. Exact binomial statistical tests using the R statistical package (16) were performed to determine whether there was an excess proportion of SNPs with effect magnitudes larger in one subgroup (than the null proportion of 0.5) for the random subset of independent SNPs.
The global distribution of effect heterogeneity for the random subset of independent SNPs was also examined by generating Q-Q plots for Cochran’s Q p values (phet). Q-Q plots were constructed by ranking the p values from smallest to largest (the ‘order statistics’) and plotting them against their expected values under the null hypothesis of no association (sampled from the known chi-squared distribution). Deviations above the line of equality (drawn in white) indicate a preponderance of smaller phet values. To aid interpretation we have also calculated 95% confidence envelopes (shaded grey in all Q-Q plots). These are formed by calculating, for each order statistic, the 2.5th and 97.5th centiles of the distribution of the order statistic under random sampling and the null hypothesis.
Results
SNP associations results for the 12 genome-wide significant loci reported in Anttila et al. (2013) (5).

SNP: single nucleotide polymorphism; rsID: reference SNP cluster identification; Chr.: chromosome; Position (bp): genomic position (base pairs) relative to hg19; RA: risk allele; OA: other allele; OR (95% CI): odds ratio and 95% confidence interval for the RA; passoc: p value for allelic association; phet: p value for Cochran’s Q heterogeneity test; MO: migraine without aura.
SNP association results in all 2013 IHGC samples.

SNP: single nucleotide polymorphism; rsID: reference SNP cluster identification; IHGC: International Headache Genetics Consortium; RA: risk allele; OA: other allele; OR (95% CI): odds ratio and 95% confidence interval for the RA; passoc: p value for allelic association; phet: p value for Cochran’s Q heterogeneity test.
SNP association results in migraine with aura (MA) compared to migraine without aura (MO) samples.

SNP, single nucleotide polymorphism; rsID: reference SNP cluster identification; RA, risk allele; OR (95% CI): odds ratio and 95% confidence interval for the RA; passoc: p value for allelic association; phet: p value for Cochran’s Q heterogeneity test. Meta-analysis, fixed-effect meta-analysis of the MA and MO OR and 95% CI.
SNP association results in clinic-based compared to population-based samples.

SNP: single nucleotide polymorphism; rsID: reference SNP cluster identification; RA: risk allele; OR (95% CI): odds ratio and 95% confidence interval for the RA; passoc: p value for allelic association; phet: p value for Cochran’s Q heterogeneity test. Meta-analysis, fixed-effect meta-analysis of the clinic- and population-based OR and 95% CI.
SNP association results in females compared to males.
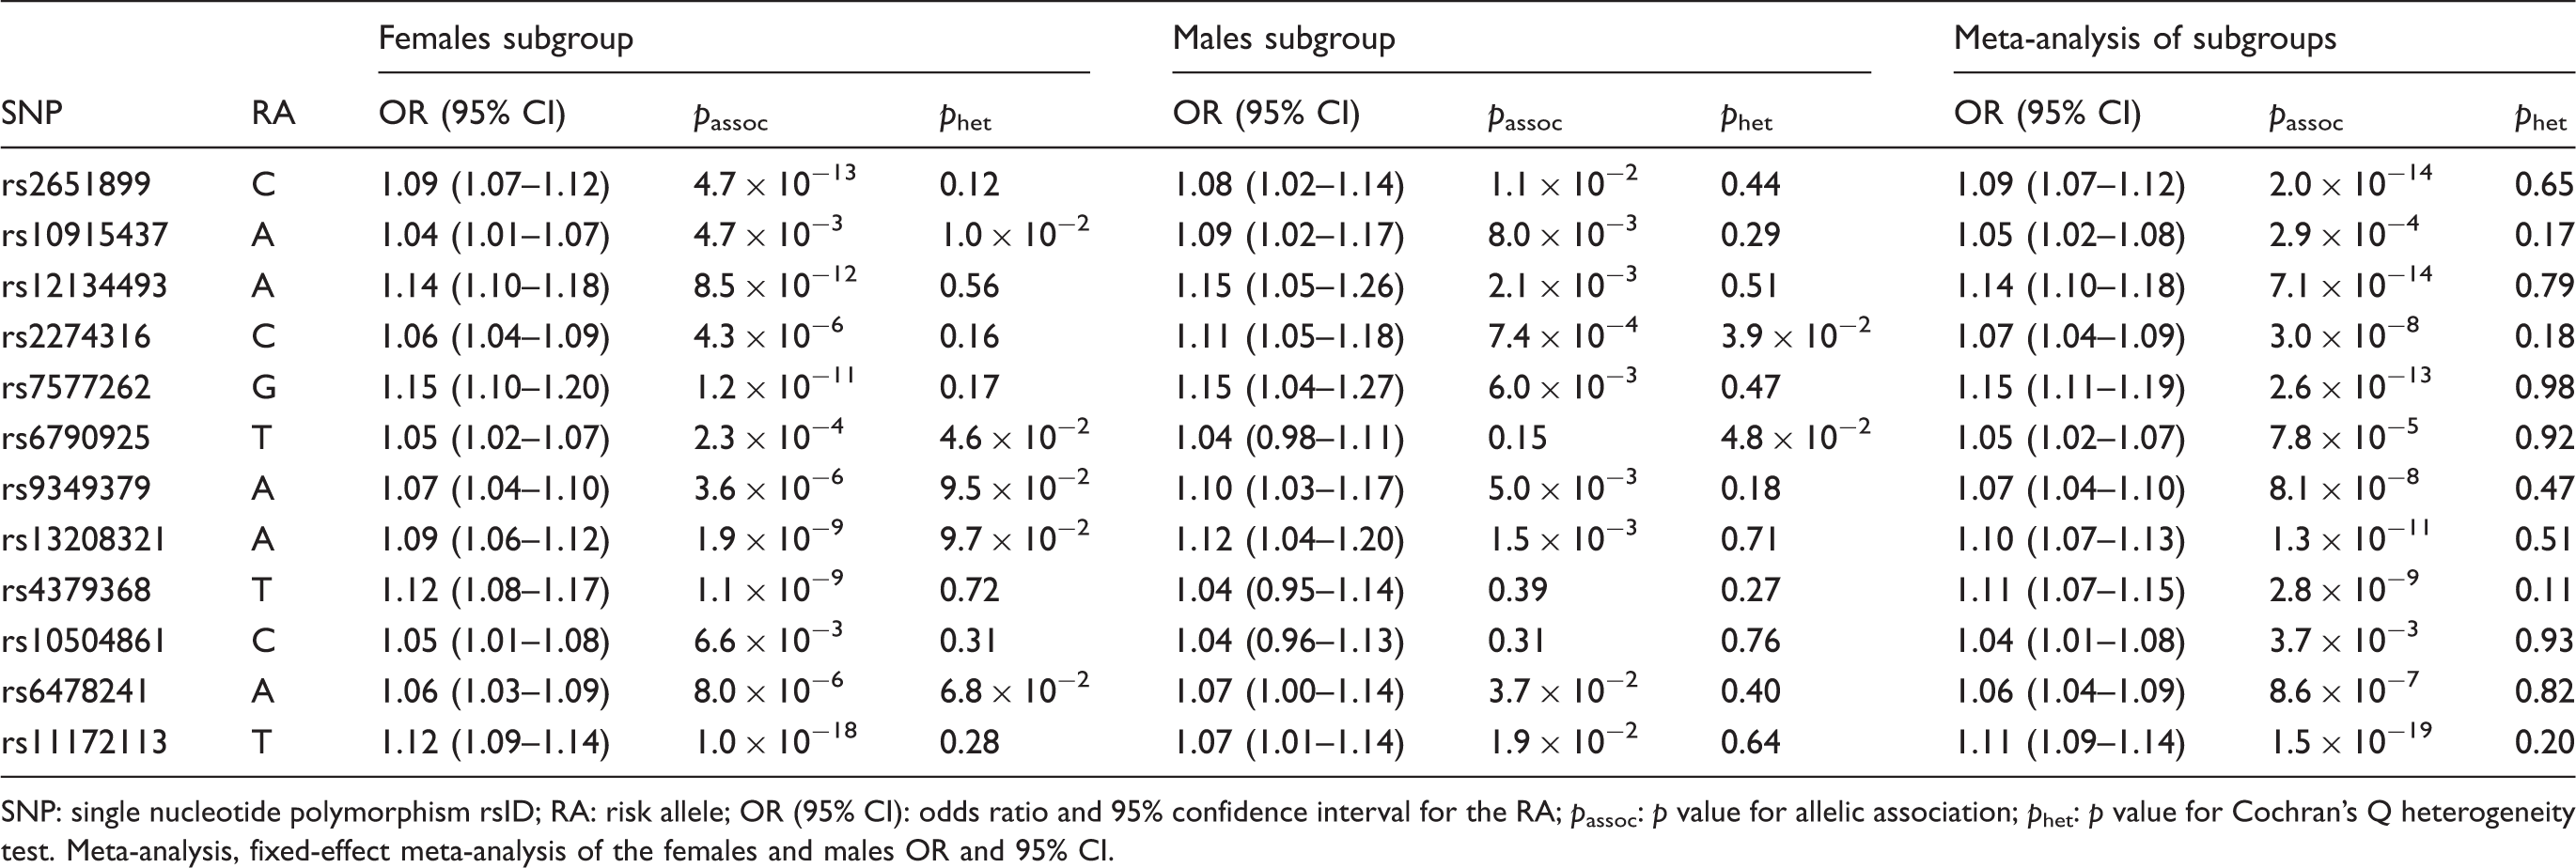
SNP: single nucleotide polymorphism rsID; RA: risk allele; OR (95% CI): odds ratio and 95% confidence interval for the RA; passoc: p value for allelic association; phet: p value for Cochran’s Q heterogeneity test. Meta-analysis, fixed-effect meta-analysis of the females and males OR and 95% CI.
Results from SECA (online Supplementary Tables) comparing MA subgroup ORs for the 23,367 index SNPs with the most significant MA association p values (passoc) to the ORs in the MO subgroup indicated the SNP effects were highly concordant across these subgroups. The total number of SNP subsets with nominally significant concordant effects (i.e. Fisher’s tests with ORFT ≥ 1 and pFT ≤ 0.05) was 144. Out of 1000 replicates, 0 produced 144 subsets with nominally significant concordant effects (pFTsig-permuted = 9.9 × 10⁻⁴; 95% CI: 5.1 × 10⁻⁵ – 5.6 × 10⁻³). The subset producing the most significant concordance test was for SNPs with MA passoc ≤ 0.3 and MO passoc ≤ 0.5 (ORFT = 4.4; pFTmin = 2.3 × 10−256). Analogous concordance was obtained comparing ORs for the 23,162 index SNPs with the most significant MO passoc to the ORs in the MA subgroup; here the subset producing the most significant concordance test was for SNPs with MO passoc ≤ 0.3 and MA passoc ≤ 0.6 (ORFT = 3.8; pFTmin = 1.3 × 10−248).
Given that the 2013 IHGC MA and MO subgroup analyses utilised overlapping controls, the MA and MO SNP effect estimates are not independent of each other. Furthermore, because 64,847 (87%) of the total 74,239 MA controls were also MO controls, and 93% of the total 69,427 MO controls were also MA controls, the SECA concordance analysis will be severely biased in favour of concordance – driven by the near identical control allele frequencies being compared to the less similar MA and MO case frequencies. Therefore, SECA was re-run using the independent clinic-based MA (17) and clinic-based MO (18) GWA datasets from the 2013 study (5).
Results from SECA comparing the clinic-based MA subgroup (2849 cases versus 9392 controls, Neff = 8744) ORs for the 23,182 index SNPs with the most significant clinic-based MA passoc to the ORs in the independent clinic-based MO subgroup (2326 cases versus 4580 controls, Neff = 6170) indicated the SNP effects were highly concordant across these subgroups. The total number of SNP subsets with nominally significant concordant effects was 144 (pFTsig-permuted = 9.9 × 10⁻⁴; 95% CI: 5.1 × 10⁻⁵ – 5.6 × 10⁻³). The subset producing the most significant concordance test was for SNPs with MA passoc ≤ 0.2 and MO passoc ≤ 0.5 (ORFT = 2.3; pFTmin = 1.7 × 10−75). Analogous concordance was obtained comparing ORs for the 23,366 index SNPs with the most significant clinic-based MO passoc to the ORs in the clinic-based MA subgroup; here the subset producing the most significant concordance test was for SNPs with MO passoc ≤ 0.3 and MA passoc ≤ 0.7 (ORFT = 1.9; pFTmin = 2.8 × 10−68).
Results from SECA comparing ORs for the 23,392 index SNPs with the most significant clinic-based passoc to the ORs in the population-based subgroup indicated the SNP effects were highly concordant across these subgroups. All 144 SNP subsets produced nominally significant concordance (pFTsig-permuted = 9.9 × 10⁻⁴; 95% CI: 5.1 × 10⁻⁵ − 5.6 × 10⁻³). The subset producing the most significant concordance test was for SNPs with clinic-based passoc ≤ 0.1 and population-based passoc ≤ 0.4 (ORFT = 1.7; pFTmin = 7.1 × 10⁻²¹). Analogous concordance was obtained comparing ORs for the 23,374 index SNPs with the most significant population-based passoc to the ORs in the clinic-based subgroup; here the subset producing the most significant concordance test was for SNPs with population-based passoc ≤ 0.2 and clinic-based passoc ≤ 0.2 (ORFT = 1.8; pFTmin = 7.0 × 10⁻¹⁹).
Results from SECA comparing ORs for the 23,276 index SNPs with the most significant female subgroup passoc to the ORs in the male subgroup indicated the SNP effects were highly concordant across these subgroups. All 144 SNP subsets produced nominally significant concordance (pFTsig-permuted = 9.9 × 10⁻⁴; 95% CI: 5.1 × 10⁻⁵ – 5.6 × 10⁻³). The subset producing the most significant concordance test was for SNPs with female passoc ≤ 0.3 and male passoc ≤ 0.7 (ORFT = 2.0; pFTmin = 9.6 × 10−78). Analogous concordance was obtained comparing ORs for the 23,266 index SNPs with the most significant male passoc to the ORs in the female subgroup; here the subset producing the most significant concordance test was for SNPs with male passoc ≤ 0.3 and female passoc ≤ 0.5 (ORFT = 2.1; pFTmin = 1.5 × 10−65).
SNP effect magnitude comparison for concordant effects.

SNP: single nucleotide polymorphism; Total: total number of SNPs with concordant effect across Subgroup 1 and Subgroup 2; OR1 > OR2, number of SNPs with odds ratio (OR) for Subgroup 1 greater than OR for Subgroup 2 (as a proportion of Total is also provided in brackets); pBT: two-tailed p value from an exact binomial test of observing the number of SNPs with OR1 > OR2 by chance.
Discussion
Recent GWA studies have identified common genetic variants that are associated with migraine (5) and its primary subtypes MA (17) and MO (18). To investigate whether the major migraine subgroups (MA versus MO, clinic- versus population-based, and female versus male) share a common or have distinct genetic aetiologies, we assessed their genetic overlap by examining GWA results from the 2013 IHGC analysis of 23,285 migraine cases and 95,425 population-matched controls of European ancestry.
Although heterogeneity of SNP effects was observed for the 12 genome-wide significant loci between the MA and MO subgroups, and between the clinic- and population-based subgroups, the risk-increasing allele was the same across all subgroups. This observation extends to the majority of common SNP effects across the human autosome, with SECA finding highly significant evidence that the majority of SNP effects are in the same direction across the MA and MO GWA cases, the clinic- and population-based migraine cases, and the female and male migraine cases. For all of the subgroup comparisons, the proportion of concordant effects increased for SNPs with smaller association p values in one subgroup, and was largest for SNPs with small p values in both subgroups. These findings were not driven by or restricted to the more robust association signals, with the same pattern of SECA results observed after excluding index SNPs with association p values (p1) < 0.001 (data not shown).
Comparing the magnitude of SNP effects concordant across clinic-based MA and clinic-based MO subgroups demonstrate the effect magnitudes to be generally larger in the MO subgroup (Table 6). This result was unexpected, given that MA has been shown to have a higher heritability and sibling recurrence risk than MO (3.8 versus 1.9) and is therefore typically considered to be ‘more genetic’ (i.e. have a higher genetic loading) (19). The significant concordance of common SNP effects across the MA and MO subgroups suggests this observed difference is not due to MA being mediated more by rare variants with larger effect sizes compared to MO. Rather, the difference may be due to a higher degree of heterogeneity among the MA cases, where, for example, genetically distinct subgroups share differing proportions of genetic risk with MO cases.
Contrasting the magnitude of SNP effects concordant across clinic-based and population-based subgroups confirms the effect magnitudes to be generally larger in the clinic-based subgroup (Table 6). This result extends the original study’s (5) observation for the 12 genome-wide significant loci and indicates a higher genetic homogeneity and/or loading for the clinic-based samples. This finding is perhaps not surprising given the stricter diagnostic criteria (e.g. compared to self-report) and a higher likelihood that more severe migraine cases (often with a strong family history) would be referred for clinic-based care.
Interestingly, comparing the magnitude of SNP effects concordant across female and male subgroups demonstrates the effect magnitudes to be generally larger in the male subgroup (Table 6). Despite using heterogeneous migraine definitions, the vast majority of twin studies report correlations for migraine in opposite-sex twin pairs to be less than or in between same-sex male and female twin pairs, and several twin studies estimate larger twin correlations for migraine in male-male compared to female-female twin pairs (20). Similar to the twin correlations, our finding of larger SNP effects for male cases compared to female cases suggests migraine may be more genetic, or genetically homogenous, in males compared to females.
Our primary finding of significant SNP effect concordance across these major migraine subgroups indicates fixed-effect meta-analysis of additional GWA datasets, which assumes the same effect size between studies, should continue to identify new SNP loci. For the minority of SNPs with substantial heterogeneity of effect size estimates, alternate meta-analysis models that assume no heterogeneity under the null hypothesis (21), in contrast to the traditional (low-powered) random-effects model (22), will provide improved power to identify new genome-wide significant loci. Other methods, such as the ‘binary-effects model’ – a weighted sum of z-scores method (23) assigning a greater weight to the studies predicted to have an effect and a smaller weight to the studies predicted to not have an effect (24) – may also improve power to identify new migraine risk loci. Investigation of other migraine subgroups, such as those with and without depression, may also help identify novel risk loci (25).
In summary, these results show the concordant genetic risk across these major migraine subgroups is not restricted to the genome-wide significant/suggestive SNPs identified from the 2013 IHGC fixed-effect meta-analysis of all GWA samples (5). Although not precluding their existence, significantly heterogeneous risk factors across these subgroups (especially with opposite directions) will be the exception rather than the rule. In other words, any differences in common genetic risk across these subgroups is far outweighed by the similarities. Hence, meta-analysis of additional GWA datasets, regardless of their major subgroup composition, will identify new susceptibility loci for migraine.
Clinical implications
For the 12 common migraine risk (single-nucleotide polymorphism (SNP)) loci, the risk-increasing allele was the same across the migraine with aura (MA) and migraine without aura (MO) genome-wide association (GWA) cases, the clinic- and population-based migraine cases, and the female and male migraine cases. This observation extends to the majority of common SNP effects (odds ratios) across the human autosome. Any differences in common genetic risk across these migraine subgroups are outweighed by the similarities. Meta-analysis of additional migraine GWA datasets, regardless of their major subgroup composition, will identify new susceptibility loci for migraine.
Footnotes
Funding
This research received no specific grant from any funding agency in the public, commercial, or not-for-profit sectors.
Conflict of interest
None declared.
Acknowledgments
Dale R Nyholt was supported by the Australian Research Council (ARC) Future Fellowship (FT0991022) and National Health and Medical Research Council (NHMRC) Fellowship (APP0613674) Schemes, by a grant from the NHMRC (APP1075175), and by the European Union’s Seventh Framework programme (2007–2013) under grant agreement no. 602633 (EUROHEADPAIN). See the original publication of the 2013 IHGC migraine GWA meta-analysis (![]() ) for detailed cohort-specific acknowledgments.
) for detailed cohort-specific acknowledgments.
References
Supplementary Material
Please find the following supplemental material available below.
For Open Access articles published under a Creative Commons License, all supplemental material carries the same license as the article it is associated with.
For non-Open Access articles published, all supplemental material carries a non-exclusive license, and permission requests for re-use of supplemental material or any part of supplemental material shall be sent directly to the copyright owner as specified in the copyright notice associated with the article.