
Abstract
Premise
One of the most exciting developments in modern neuroscience was the development of imaging techniques providing a non-invasive technique for detection of structure-function relationships characteristic of pain and headache. There is no question that neuroimaging has provided us with a better understanding of how the aura in migraine develops, and it has served as a bridge between neurophysiological studies and clinical findings, although doubtless several questions remain.
Pearls
Neuroimaging drew attention toward central mechanisms in idiopathic headache syndromes. Outstanding functional studies have reinforced the crucial role of the brainstem in acute and chronic migraine and the hypothalamic area in trigemino-autonomic headaches. Several morphometric studies suggest a decreased gray matter in pain-transmitting areas in headache patients; however, those have to be seen in the light of a wealth of pain studies and studies on exercise-dependent plasticity.
Goal
This review focuses on neuroimaging as a scientific tool and highlights the recent advances made in studying primary headache syndromes using functional and structural neuroimaging techniques. It will also point toward open questions and gives recommendations for future studies.
Introduction
High-resolution imaging of the nervous system is the most useful and exciting approach to interrogate the living human brain. Because of its noninvasiveness, it is the ideal tool for in vivo investigation of neurological diseases and consequently has impacted the way we think about pain, chronicity and idiopathic headache. Moreover, especially in headache research, neuroimaging has provided a unique signature and sometimes disease-specific information of pathophysiological significance. The early methods using Doppler, Duplex and near-infrared spectroscopy (NIRS) have all characterized possible vascular mechanisms in headache. The first positron emission tomography (PET) study drew attention to central mechanisms, i.e. the brain as the ultimate source of the headache attack (1**). All the other imaging modalities, such as magnetic resonance imaging (MRI) tomography, magnetic encephalography (MEG), spectroscopy and various structural imaging methods supported this view and delivered several pieces of the puzzle, which is by far not complete. If we exclude Doppler and Duplex, all the others follow the same principle: After preprocessing the data (realignment, normalization, smoothing), the analysis will estimate, on a voxel to voxel basis, whether there are differences in any region of the brain between cohorts. Figure 1 shows a statistical map of one given plane. Using a statistical threshold of p < 0.05, only some results will survive; choosing a higher threshold, fewer voxels will survive. Transforming the three-dimensional diagram into a two-dimensional diagram and superimposing the finding on a normal single subject or mean group MRI visualizes the statistically significant differences between two cohorts or between two time points in the same cohort. The following sections describe how high-resolution imaging (focusing on PET and functional MRI (fMRI) findings) has allowed in vivo measures of brain structure and function in headache.
Graph of commonalities between neuroimaging methods regarding pre-processing of data from a visual experiment. Figure 1A: Draft of the experiment looking at visual cues (yellow bulb) and rest condition (colorless bulb). Figure 1B: Data from both conditions are sampled over time and pre-processed, involving lineal realignment of all images to the first image and normalizing (linear and nonlinear) into a standardized space using a template. These data are finally smoothed. Figure 1C: A statistical map of one given plane (three-dimensional, left is occipital, right is frontal). Figure 1D: Using a statistical threshold of p < 0.05 (visualized as a dark layer), only some results will survive; choosing a higher threshold of p < 0.005, fewer voxels will survive. Figure 1E: Transforming the three-dimensional diagram into a two-dimensional diagram and superimposing the finding on a normal single-subject magnetic resonance imaging scan (MRI) or mean group MRI visualizes the statistically significant differences (here as an index for synaptic activation) between condition 1 and 2. Looking at the visual cue, compared to the rest condition, will activate the visual cortex (significantly more than the rest of the cortex).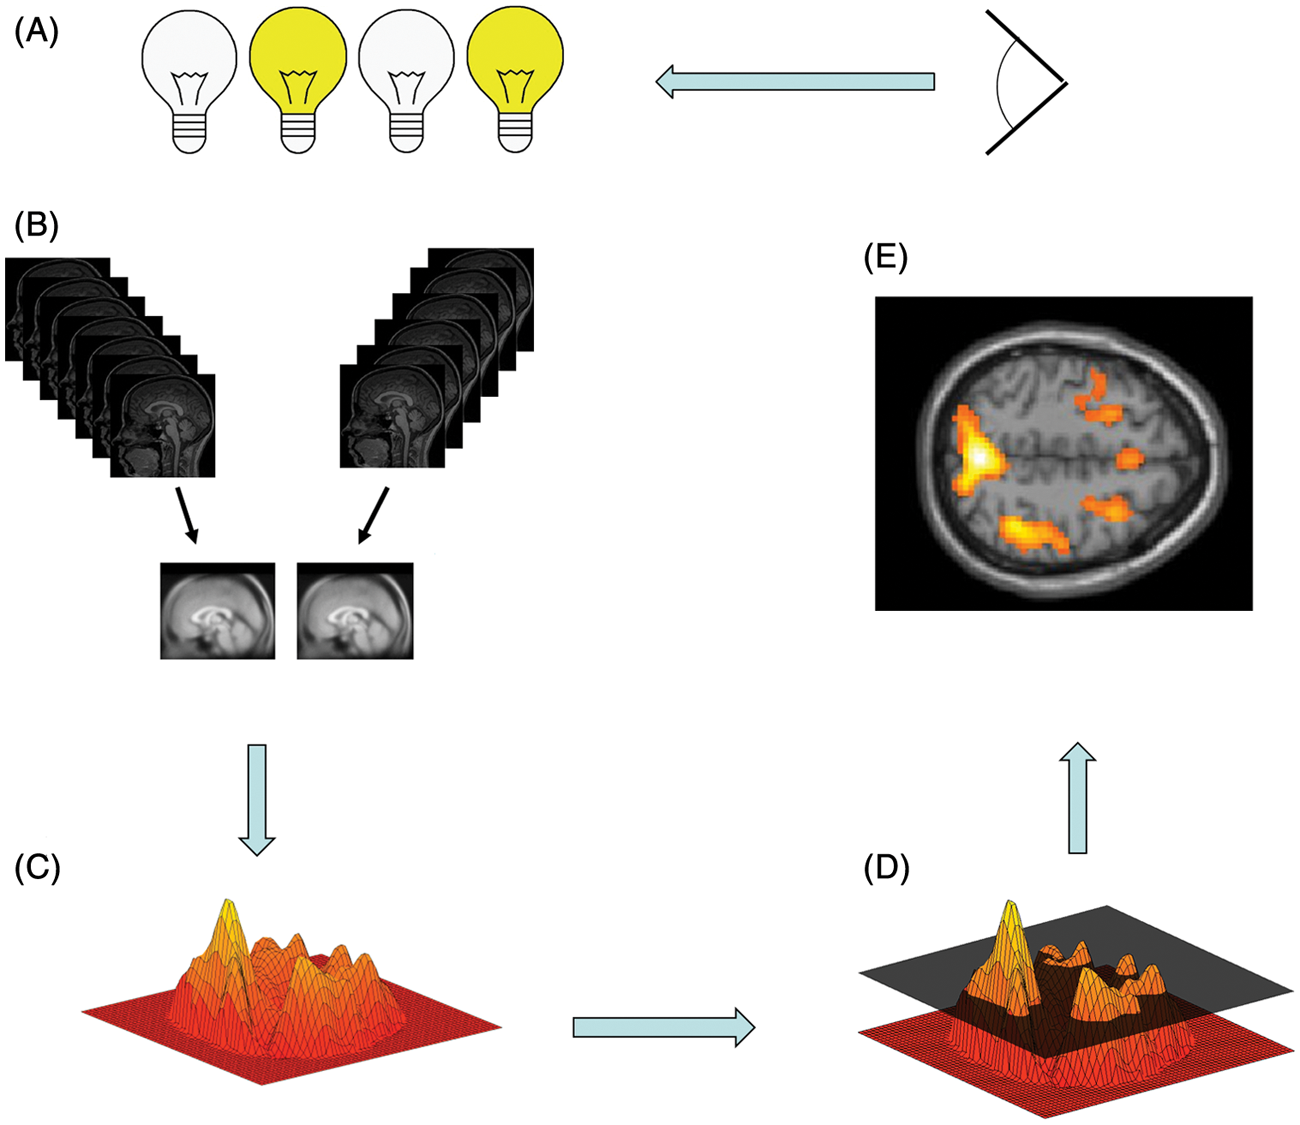
Neuroimaging in headache: Pearls
To understand the possible impact of functional studies in primary headache such as migraine and cluster, the neuroimaging pattern of activation in experimental headache needs to be established. In a PET study on experimental head pain (2) seven healthy male volunteers without a history of headache were studied during an acute pain state evoked by injecting a small amount of capsaicin subcutaneously into the forehead. During the acute pain state compared to the resting state, increases in regional cerebral blood flow (rCBF) as an index for synaptic activation were found bilaterally in the anterior insula, the contralateral thalamus, the ipsilateral anterior cingulate cortex and in the cerebellum bilaterally. These areas are well known from several studies in experimental pain in humans and are considered in other reviews (3,4). Regarding headache syndromes, it has recently been shown that it is even possible to use fMRI to measure central nervous system (CNS) activation in the trigeminal ganglion and spinal trigeminal nucleus (5,6).
Blood flow studies in migraine attacks
Over the last few years remarkable efforts have been made using functional imaging studies of the trigemino-vascular system that demand renewed consideration of the neural influences at work in many primary headaches.
The pioneering work of Olesen and colleagues (7,8) revealed a focal reduction of rCBF for migraine attacks with aura, usually in the posterior parts of one hemisphere. These data have been reproduced and are robust (9–11**). Using single photon emission computed tomography (SPECT) in migraine without aura, no blood flow changes were noticed (12). This prompted a still on-going debate as to whether there are major pathophysiological differences between migraine with and without aura. A clear distinction was first made in the first edition of the International Headache Classification, where the terms migraine with aura and migraine without aura were coined (13). Since this pioneering work, a number of studies have used different techniques to demonstrate gross changes in cortical perfusion in the attempt to explain either the aura or the headache in migraine (9–11**).
Using surface-based methods, such as measuring cortical thickness and diffusion tensor imaging (DTI), a recent study examined the motion-processing visual network in 24 migraine patients and 15 age-matched healthy controls (14). This study found an increase in cortical thickness of motion-processing visual areas in migraineurs, virtually in the same area that was previously described as a source in spreading changes involved in visual aura (11**). In addition, DTI revealed that migraineurs have alterations in the superior colliculus and the lateral geniculate nucleus, which are also involved in visual processing. The authors concluded that a structural abnormality in the network of motion-processing areas could account for, or be the result of, the cortical hyper-excitability observed in migraineurs. In summary, it seems as if the inherited basis for migraine is responsible for a developmental change that leads to the structural differences in these areas, irrespective of the occurrence of aura symptoms (15). There is consensus that cortical spreading of depression-like changes in brain blood flow are observed only in migraine with aura, despite an unusual case report who developed a bilateral reduction in blood flow while suffering the very beginning of a migraine attack without aura (16**).
Functional imaging in migraine – PET and fMRI
With the advent of H2O-activation PET (1**) and later fMRI (17**), newer studies drew the attention to central mechanisms, i.e. the brain as the main source of the headache attack. Several independent studies have reinforced the crucial role of the brainstem in acute and, probably also, chronic migraine (18–20). The common ground of all these observations is a consistent increase in rCBF in the rostral brainstem that persisted, even after sumatriptan had induced complete relief from headache, nausea, phonophobia and photophobia (21). This increase was not seen outside the attack and has been confirmed in a single case study, which further refined the activation to the dorsal rostral pons (18). Dysfunction of the regulation of brainstem nuclei involved in anti-nociception, extra- and intra-cerebral vascular control and sensory-gating provides a far-reaching explanation for many of the facets of migraine. The importance of the brainstem for the genesis of migraine is further underlined by reports of non-headache patients who developed migraine-like episodes after stereotactic placement of electrodes in the periaqueductal gray (PAG) for treatment of chronic pain (22**,23). One could argue that these, relative to the number of operated patients, rare findings are only indirect indicators of PAG involvement in migraine pathophysiology. Certainly, brainstem activation per se has been reported in many pain conditions other than migraine, including tonic cold stimulation (24), laser-induced pain (25), painful touch produced by a stylus (26) and even experiencing empathy in case someone else suffers pain (27). However, the brainstem activation in almost all these studies appears to be caudal extension of PAG activation rather than a discrete area of pontine activation, which was specifically described in spontaneous acute migraine attacks (Figure 2).
Brainstem findings using functional imaging in migraine. Figure 2A: Positron emission tomography (PET) data of nine spontaneous, untreated migraine attacks (1). Figure 2B: PET data of one evoked very early migraine attack (18). Figure 2C: Magnetic resonance imaging (MRI) findings of iron accumulation in the periaqueductal gray (PAG) correlating with the duration of migraine illness (30). Figure 2D: PET findings in 24 migraineurs during a nitroglycerin (NTG)-triggered migraine attack and divided into three groups according to the site of their headache: bilateral (D1), right (D2)-, or left (D3)- sided headache. These results suggest that lateralization of pain in migraine is due to lateralized brain dysfunction (19). Figure 2E: Functional MRI (fMRI) study of 13 patients during spontaneous, untreated acute migraine attacks showing an increased activation level during trigemino-nociceptive stimulation in the rostral pons compared with the headache-free data (20).
Again using PET, a very interesting paper reported significant activations not only in the midbrain and pons but also the hypothalamus, which, just as in the brainstem activation, persisted after headache relief by sumatriptan (28**). Specific hypothalamic activation has been reported in the trigeminal autonomic cephalgias (TAC) (29) but has hitherto not been observed in migraine. A major limitation of this study is that it did not have a control group and is, therefore, potentially confounded by order and session effects (variance explained by scan order or session order, respectively).
Using fMRI and an event-related protocol, a recent study reported that the activity of the spinal trigeminal nuclei in response to nociceptive stimulation showed a cycling behavior over the migraine interval. While interictal migraine patients revealed lower activations in the spinal trigeminal nuclei compared to controls, the activity shortly before attack was similar to controls (Figure 2), which demonstrates that the trigeminal activation level increases over the pain-free migraine interval (20**,31). Additionally, and for the first time using fMRI, a significant increase in activation of rostral parts of the pons, previously coined “migraine generator,” was found. Unlike the dorsal pons PET findings usually linked to migraine attacks (1**), the gradient-like activity following nociceptive stimulation in the spinal trigeminal neurons likely reflects a raise in susceptibility of the brain to generate the next attack, as these areas increase their activity long before headache starts. It was concluded that this oscillating behavior may be a key player in the generation of migraine headache whereas attack-specific pons activations are most likely a secondary event (20**).
Functional imaging in medication overuse headache (MOH)
It is unknown how medication overuse transforms episodic migraine into chronic daily headache. A PET study measured glucose metabolism in 16 chronic migraineurs with analgesic overuse before and three weeks after medication withdrawal (32) and compared these findings to healthy volunteers. Before withdrawal, the bilateral thalamus, orbitofrontal cortex, anterior cingulate gyrus, insula/ventral striatum and right inferior parietal lobule were hypo-metabolic. All of these areas recovered to almost normal glucose uptake after withdrawal of analgesics, except the orbitofrontal cortex. The authors concluded that MOH may be associated with reversible metabolic changes in pain-processing structures, but also with persistent orbitofrontal hypo-function. The latter is known to occur in drug dependence and could predispose subgroups of migraineurs to recurrent analgesic overuse. Whether these findings are indeed specific for MOH is a matter of debate. Another study investigated nine MOH patients before and after withdrawal using fMRI and evaluated possible differences in the processing of noxious stimuli compared to healthy controls. MOH patients showed reduced pain-related activity in several pain-transmitting areas, including the primary somatosensory cortex, which normalized after withdrawal (33). As a general rule, not many studies exist that investigate MOH using functional imaging methods, probably because of the high logistic effort. Further studies are needed to be able to estimate functional consequences of such findings.
Functional imaging in TACs

Plot of the activity of the spinal trigeminal nuclei in response to nociceptive stimulation showing a cycling behavior over the migraine interval. The activity increases significantly toward the next migraine attack (20**).
Neuroimaging has made substantial contributions in recent times to understanding this relatively rare but important syndrome, TACs (34). Using PET in a larger patient sample, significant activations ascribable to acute cluster headache (CH) were observed in the ipsilateral hypothalamic gray matter when compared to the headache-free state (35**). This highly significant activation prompted the use of deep brain stimulation in the posterior hypothalamic gray matter in patients with medically intractable CH headache (36,37). In contrast to migraine, no brainstem activation was found during the acute attack compared to the resting state (see Figure 4). This is remarkable, as migraine and CH are often discussed as related disorders. Again using PET in hypothalamic deep brain-stimulated patients, both activations and de-activations were found in pain-processing networks, which argues against an unspecific antinociceptive effect or pure inhibition of hypothalamic activity (38). Instead, the data suggest a hitherto unrecognized functional modulation of the pain-processing network as the mode of action of hypothalamic deep brain stimulation (DBS) in CH (36,39).
Hypothalamic activation findings using functional imaging in trigemino-autonomic headaches. Figure 4A: Positron emission tomography (PET) data of nine nitroglycerin-triggered cluster headache attacks (35). Figure 4B: PET data in a single case of spontaneous cluster headache (48). Figure 4C: PET data in a single atypical case of trigeminal autonomic cephalalgia (TAC) (46). Figure 4D: Structural changes in cluster headache compared to controls (49). Figure 4E: PET data during hypothalamic activation versus rest condition (38). Figure 4F–H: Functional magnetic resonance imaging (fMRI) data in single cases of short-lasting neuralgiform pain with conjunctival injection and tearing (SUNCT) (41–43). Figure 4I: PET data during headache in hemicrania continua (45). Figure 4K: PET data during headache in paroxysmal hemicrania (44).
If it is correct, that TACs share a common pathophysiological background (40), it should be possible to delineate similar structures using functional imaging. And indeed, a specific hypothalamic involvement has been shown in patients with short-lasting neuralgiform pain with conjunctival injection and tearing (SUNCT) (41–43), in paroxysmal hemicrania (44), in hemicrania continua (45) and even in excruciating trigemino-autonomic headache attacks, in which frequency, duration and therapeutic response allowed no clear-cut classification to one of the subtypes of TACs (46). Taken together, the functional imaging data impressively emphasizes that primary headache syndromes can be distinguished on a functional neuroanatomical basis by areas of activation specific to the clinical presentation (Figure 4) (47).
Morphometric changes in primary headache syndromes
Currently, there is a steadily growing number of surface-, shape- or volume-based methods capturing different and complementary morphological characteristics of the brain (50). One of the widely spread and validated morphometric techniques used to capture structural alterations in the brain is voxel-based morphometry (VBM). VBM is a whole brain method for analysis of automatically pre-processed structural high-resolution MRI data treating images as continuous scalar measurements (51). One of the very first studies using VBM to investigate possible brain differences between headache patients and healthy volunteers found a significant structural difference in gray matter density, a “lesion” coinciding with the inferior posterior hypothalamus, in cluster headache (49**) that showed a co-localization of morphometric alterations and functional activation in CH patients (49**). Five recent studies reported a decrease in gray matter in the anterior cingulate cortex and both insulae in migraine patients. To date, this finding (decrease in gray matter) was replicated in four independent studies (52–55), whereas one (56**) found additionally an increase in gray matter in brainstem structures. Interestingly, patients with chronic tension-type headache also have a significant gray matter decrease in regions known to be involved in pain processing (57). However, the structural studies in migraine as well as the study in tension-type headache have to be seen in the light of recent morphometric studies in several chronic pain syndromes (58). All of these studies showed a decrease in some of the above-mentioned areas (cingulate cortex, insulae, thalamus, orbitofrontal cortex). A striking feature of all of these studies is the fact that the gray matter changes were not randomly distributed, but concerned defined and functionally highly specific brain areas – namely, involvement in supraspinal nociceptive processing. This common “brain signature” of chronic pain patients raises the question of whether these changes are the cause or the consequence of chronic pain (58). As these changes are in principle reversible when the pain is adequately treated (59,60) and given overwhelming evidence that structural brain changes are experience dependent (61), further studies are certainly warranted to better characterize their clinical significance.
Iron accumulation in migraine
In the quest to disentangle possible consequences of frequent repetitive headache attacks, in vivo imaging has been used to investigate cumulative iron deposition (as a marker of cellular stress) in brain tissue. MRI findings of iron accumulation in the PAG was reported to correlate with the duration of migraine illness (30). These findings were much discussed as they might point toward a mechanism by which episodic migraine may progress toward a more disabling chronic form. In 2009 a group from The Netherlands also found a decreased T2 signal (consistent with increased iron) in certain brainstem structures, but only in older people. Instead, they reported changes in the red nucleus (RN) in patients who had a particularly long migraine history (62). These studies linked chronicity (i.e. duration of illness and frequency of attacks) to brain changes, a very important strategy in that investigating T1-signal changes also pointed to structural abnormalities in cortical and subcortical areas in migraine (34,63). A very recent study evaluated iron deposition in basal ganglia and brainstem nuclei in healthy volunteers and in patients with various migraine subtypes. This study also did not confirm migraine-specific significant changes in the PAG but reported that T2 imaging in the globus pallidus was able to distinguish between episodic and chronic migraine (64). Interestingly, patients with MOH did not demonstrate iron accumulation. However, only eight MOH patients were studied and further research is certainly warranted. To that end it is also not clear what such an accumulation means, given that migraine is considered a non-malignant disease and usually remits with age.
Neuroimaging in headache: Pitfalls
The field of neuroimaging is in continuous flux and it is not feasible to point out all possible problems or pitfalls inherent in sampling, analyzing and interpreting neuroimaging data. However, there are some general rules or recommendations to keep in mind when performing or reading about neuroimaging studies. The recommendations outlined for investigators revolve around when results are unpredicted, whereas the advice for readers focuses on how to determine the quality of any given neuroimaging paper. Both lists are necessarily incomplete and exceptions to the rules are undeniable. However, as a basic rule of thumb, they can be quite helpful.
Recommendations for investigators
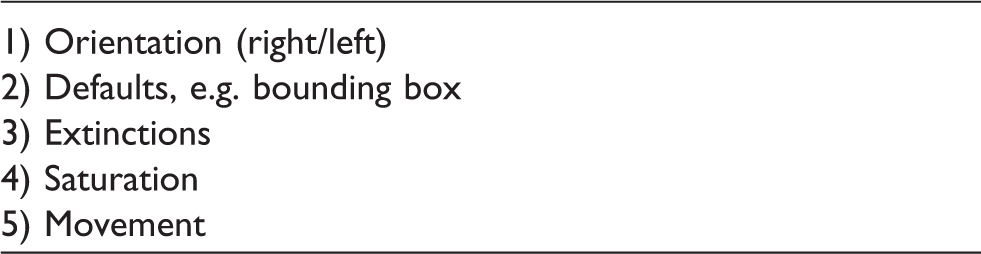
There is really only one red flag: Look out for artifacts. A banal but common error is to overlook how the data come out of the scanner (acquisition) and how the analysis software will handle the data, i.e. the orientation. There are two possibilities: the neurological and the radiological convention. And even if this is known for the individual scanner, it may change unnoticed with software updates – not only of the scanner, but also the analysis software. It is certainly worth the effort to check at least twice a year, which is simply performed by placing a scanner-specific indicator (vitamin E capsule in the event of MRI) on the right forehead of a given subject.
Another common pitfall may be to simply use the default settings of the analyzing software. Although the scanner protocol may allow sampling data in the z-axis down to the level of, for example, the brainstem or trigeminal nuclei, the default bounding box of the preprocessing software may cut off all data below the thalamus. The analysis would just show cortical and subcortical findings to this lower border and the (wrong) interpretation would be that the brainstem is not involved in the specific task that is currently being investigated. The even more subtle error of scanning all subjects with the same bounding box but missing the data of only one subject for a given anatomical area would have the same effect. The easiest way to check for this would be to set the statistical threshold to p = 1, which will result in all captured voxels being shown (Figure 5).
Examples of common artifacts. Figure 5A: Top row left: Distortion due to thermode artifacts on the left forehead. Figure 5B: Lower row left: Checking for missing data/showing the captured voxels. Figure 5C: Lower row middle: Movement artifacts, typically at boundary boarders and the eyes. Figure 5D: Right-hand side upper row: Optimal movement <1 mm over time resulting in slow drifts in all three axes (blue = pitch, green = roll, red = yaw). Figure 5D: Right-hand side lower row: Although there is no significant movement in all three axes, there is a stimulus-related movement (jerking movement), which renders the data useless.
Although not exclusive to MRI investigations, the issues of extinction and saturation are exceedingly relevant for them. Extinction (signal drop-out) of (MRI) data is well known and commonly seen next to areas filled with air, such as the ears and nose. However, extinction of data may also be due to artifacts such as hairclips, earrings, dental fillings, piercings in the face or tongue, tooth-retainers, etc., to name just a few. Another issue of concern is artifacts from the extra equipment used, such as thermode stimulation in the face or forehead (Figure 5). It is banal but indispensable to check the raw data for such obvious artifacts (Figure 5). It is quite easy to avoid saturation effects (increase in magnetization due to external magnet) by delaying the start of the experiment to after the first several MRI volume acquisitions (i.e. when the volumes are fully magnetized).
Movement artifacts are a huge concern in all neuroimaging studies. Movements will be displayed in three axes (left-right, up-down and front-back) and most pre-processing software is highly efficient in reducing the resulting bias (realignment). As a rule of thumb, one would accept movements of three times the original voxel size, i.e. 3 mm in any direction if the original voxel size is 1 mm3. However, this holds true only for linear slow drifts in the scanner, as modern realignment software will sufficiently correct for this. The problem becomes imminent when the movement is correlated to the stimulus, which is often the case in pain experiments. If these “jerks” are stimulus dependent, i.e. always happen when the (pain) stimulus is presented, these data are contaminated and must not be used for analysis. It is not possible to correct for the resulting artifact, and the last resort would be to eliminate the part of the experiment where stimulus-dependent movement takes place and use only the uncorrupted files.
Look out for artifacts: Flags for scientists.
Flags for readers
Look out for dissonance: Flags for readers.
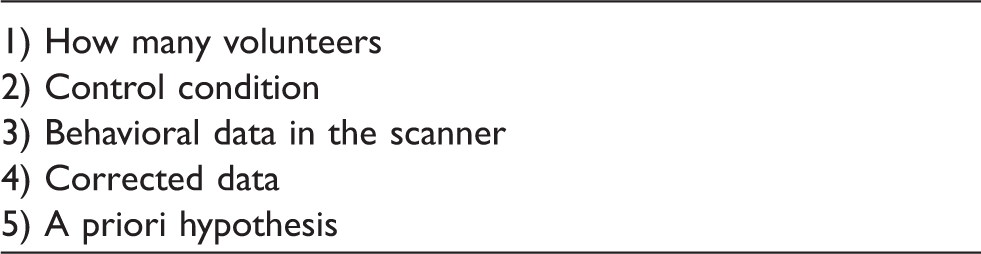
It is self-understood that science cannot falsify a hypothesis. Not finding a certain brain structure to be involved in headache does not mean that it is not involved: It simply means that it could not be found using the particular methods. As such, not showing a statistical difference between cohorts (i.e. migraine patients and controls) or longitudinal data (i.e. migraine attack versus interictal data of the same patient) may be a simple threshold problem. The right thing to do is to increase the number of volunteers, not to lower the threshold. This issue may be banal, but how many volunteers are “enough”? Given that the number of patients with a specific syndrome may be rare and/or limited because of ethical considerations regarding the method used, it will always be a tightrope walk to decide how many patients are sufficient. As a rule of thumb, six to eight datasets are usually accepted in PET and 10–14 datasets in fMRI, if positive findings are reported. If the data are negative (type 2 error; the 0-hypothesis is rejected), more datasets may be necessary.
The same issue can be viewed from a different angle: Data in functional imaging should be reported only if they are corrected for multiple comparisons (p < 0.05, corrected). Given that hundreds of planes per patient and per condition with literally thousands of voxels per plane are investigated, correction for multiple comparisons is compulsory. The only accepted exception is a statistical threshold of p < 0.001 uncorrected (whole brain), if a strong and valid a priori hypothesis exists. In this case, a region of interest (ROI) is defined and the finding is corrected only for all voxels in this ROI rather than for the whole brain. If this ROI approach reaches the appropriate threshold (p < 0.05, corrected), it is acceptable with the appropriate a priori hypothesis. However, the ROI should not be defined by the findings of this particular experiment (i.e. choosing the voxel with the maximal statistical power and drawing a concentric circle of some millimeters), but should be extracted from an independent dataset or ultimately from another published study/anatomical reference. Adding or removing some millimeters from the ROI will change the outcome and, consequently, the ROI must be based on anatomical references.
It is commonplace that studies without a proper control condition are not accepted as valid (to control for session or time effects); however, it is also very important to insist on the capture of behavioral data in the scanner. It is not sufficient to study participants in the scanner with a given task (i.e. nociceptive trigeminal input) and ask them later and outside the scanner whether they perceived the stimulus as painful. Next to the reporting bias, it is mandatory to realize that while we are scanning volunteers, we see only their feet. We cannot determine whether they perceive anything, have followed instructions or whether they simply fell asleep. Neither controls nor patients usually participate in any experiment for altruistic motives, but rather for money or knowledge regarding their own disease or syndrome. It follows that an experimenter needs to show that his or her subjects were alert and followed the instructions – hence showing behavioral data in the scanner.
A final recommendation would be to mistrust imaging results that are shown for only a small sector of the brain. It is important to develop a general feeling for the data, and the proper approach is to understand whether a given finding (i.e. significantly activated brain area) is one finding out of thousands or the only one. The latter situation (just one finding matching a proper hypothesis) is a strong criterion for the validity of the data. Ideally, all data are shown (for example using a glass brain, Figure 6) and only then, if appropriate, an enlargement of a specific finding.
Example of a glass brain (left-hand side of the figure) and superimposing the finding on a mean group magnetic resonance imaging (MRI) scan to visualize the statistically significant differences between two conditions (Here: Rest condition and trigeminal nociceptive input will activate these areas more in healthy controls than in migraine patients outside the migraine attack). Data from Stankewitz et al. (20).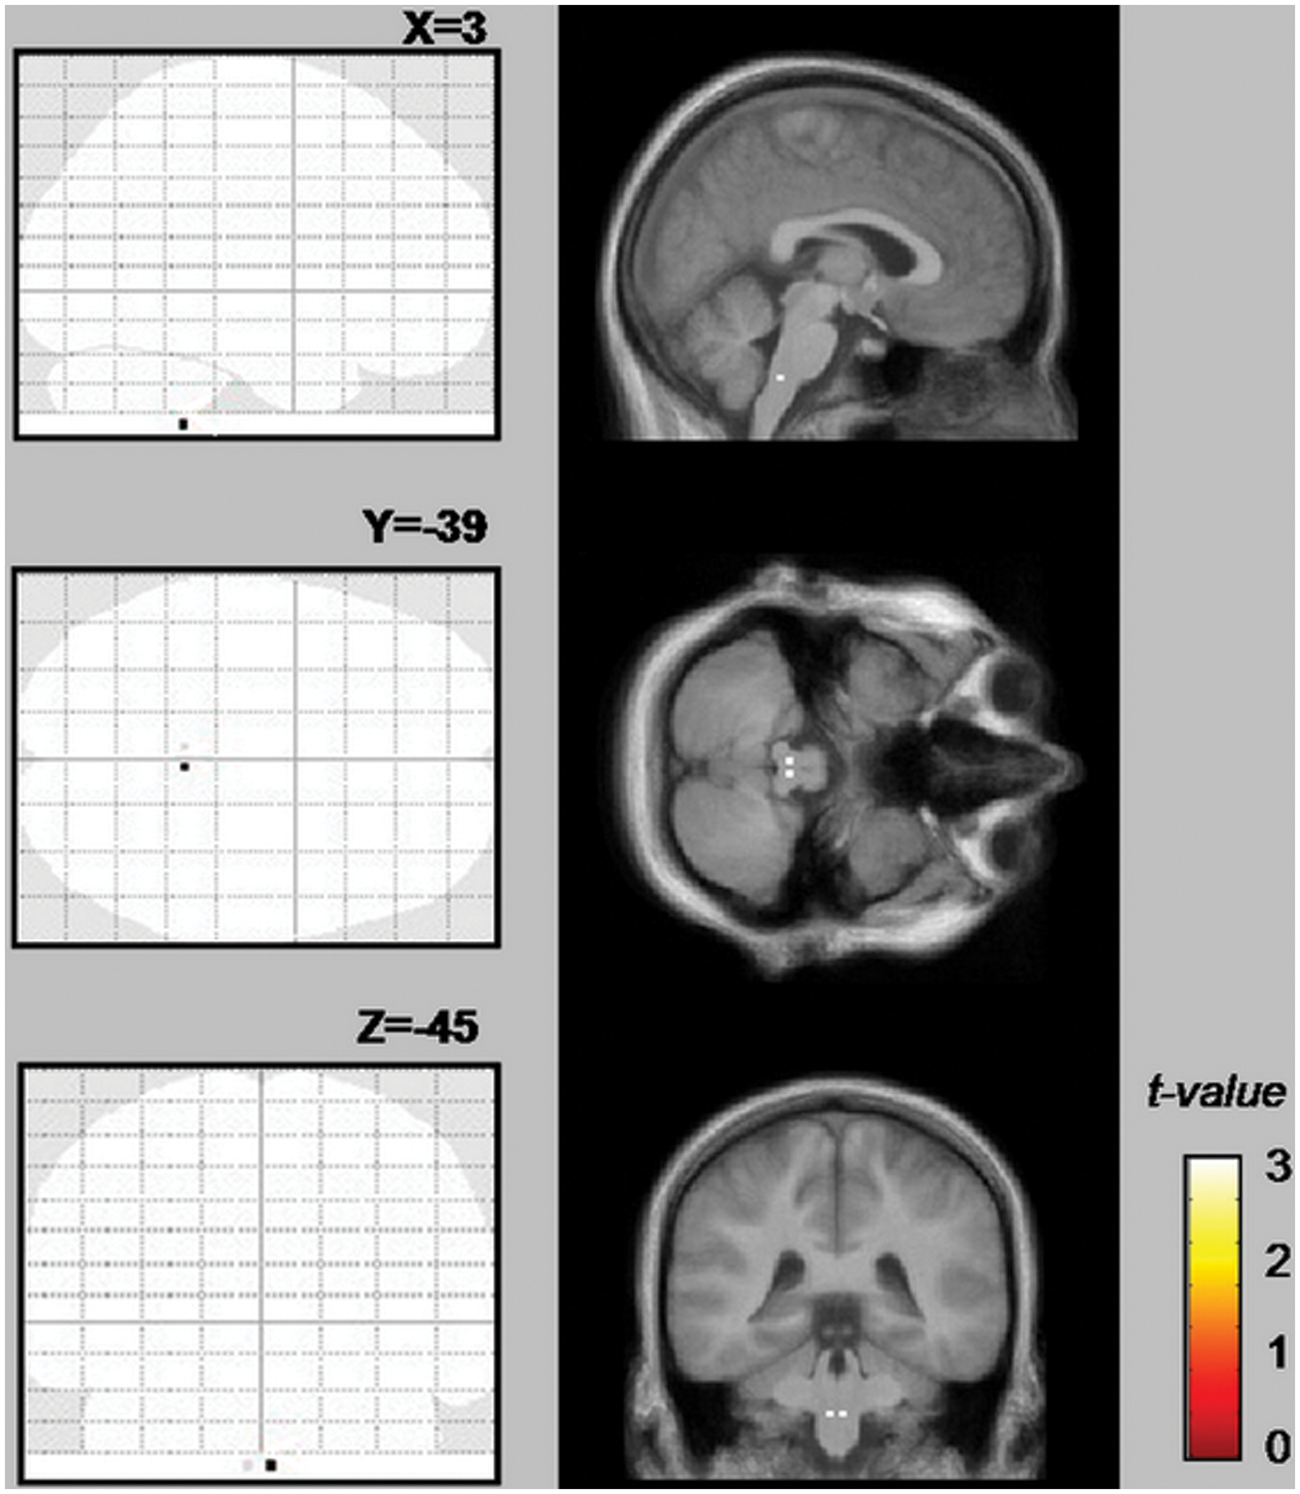
In summary, these rules are neither complete nor absolute (and mainly cover fMRI), but may give some considerations for a better personal judgment of the quality of published data. Technical considerations regarding other, currently less used imaging methods in headache research such as magnetic resonance spectroscopy, diffusion- and perfusion-weighted MRI as well as methods for provoking migraine attacks are covered elsewhere (65).
Open questions for the future
For obvious reasons it is not feasible to list all open questions that can be answered using neuroimaging in headache. Given that imaging has provided immensely useful insights into the pathophysiology of headache and given that it is the ideal tool to noninvasively evaluate brain changes in headache patients, some particular challenges come to mind.
Most imaging studies are performed on migraine patients and in just some CH and even fewer in MOH. Moreover, most studies have investigated changes between the ictal and interictal state. However, nearly no studies have been conducted in CH, such as tension-type headache or chronic migraine, probably because of methodological issues. Regarding migraine, valid studies investigating the premonitory phase, i.e. immediately before the attack, are lacking. The link between aura and headache remains controversial, despite some valuable theoretical considerations (66**). The origin of the aura and general susceptibility to attacks seems to lie in the cerebral cortex, but it must be remembered that only 15–30% of migraineurs have aura (67), and the rest do not show any consistent demonstrable changes in blood flow. It will be mandatory to integrate and combine neuroimaging and other scientific fields such as genetics, electrophysiology and behavioral research. The ultimate goal will be to visualize pharmacological intervention of central effects on pathophysiological states in different headache syndromes. The pathophysiological insights of these studies will translate into a better understanding and ultimately lead to new therapies through research.
Recommendations for future studies
Generally speaking, future studies will require the same features that valid studies provide already, such as a sufficient number of participants, providing corrected findings and an excellent a priori hypothesis. In clinical practice, to obtain reliable and reproducible imaging data, as a rule of thumb the following is recommended:
For cohort studies: n > 15 per group. Homogenous groups, optimum: genetically determined cohorts. If possible, using the same scanner with identical imaging parameters. Providing behavioral data in the scanner. Strong a priori hypothesis. Longitudinal analysis (same patient over time) better than cohort analysis (patients vs. controls). If available, additional regression analysis using external parameters (such as electrophysiological data, etc.) to better fit the model of the a priori hypothesis.
Footnotes
Funding
This work was supported by grants from the DFG (SFB 936-Teilprojekt A5).
Conflict of interest
None declared.