
Abstract
Background: Chronic daily headache (CDH) and chronic migraine (CM) are one of the most frequent problems encountered in neurology, are often difficult to treat, and frequently complicated by medication-overuse headache (MOH). Proper recognition of MOH may alter treatment outcome and prevent long term disability.
Objective: This study identifies the unique genomic expression pattern MOH that respond to cessation of the overused medication.
Methods: Baseline occurrence of MOH and typical pattern of response to medication cessation were measured from a large database. Whole blood samples from patients with CM with or without MOH were obtained and their genomic profile was assessed. Affymetrix human U133 plus2 arrays were used to examine the genomic expression patterns prior to treatment and 6–12 weeks later. Headache characterisation and response to treatment based on headache frequency and disability were compared.
Results: Of 1311 patients reporting daily or continuous headaches, 513 (39.1%) reported overusing analgesic medication. At follow-up, 44.5% had a 50% or greater reduction in headache frequency, while 41.6% had no change. Blood genomic expression patterns were obtained on 33 patients with 19 (57.6%) overusing analgesic medication with a unique genomic expression pattern in MOH that responded to cessation of analgesics. Gene ontology of these samples indicated a significant number were involved with brain and immunological tissues, including multiple signalling pathways and apoptosis.
Conclusions: Blood genomic patterns can accurately identify MOH patients that respond to medication cessation. These results suggest that MOH involves a unique molecular biology pathway that can be identified with a specific biomarker.
Keywords
Introduction
Headache and migraine are significant health problems creating disability and socio-economic impact (1,2). Chronic daily headache (CDH) occurs in 4% of the population, but accounts for over 60% of the patients seen in tertiary headache practices with suffering for years to decades (3,4). CDH may be difficult to treat, have significant disability with diminished socio-economic status and quality of life and may have progressive deterioration if not effectively treated. In their attempt to treat headaches, patients can exacerbate the problem with the overuse of medications.
CDH can broadly be defined as 15 or more headaches per month over more than 3 months. CDH diagnosis has been aided by the recognition of multiple CDH types by the International Classification of Headache Disorders, 2nd Edition (ICHD-II) (5), including chronic migraine (CM), chronic tension-type headache, new daily persistent headache and hemicrania continuum with CM being revised to help clarify the requirement of 8 of the 15 days having migraine features (6). The differentiation of these sub-types can be complicated by attenuation of headache features and mixed headaches. CDH is commonly associated with migraine features and may be stratified as daily continuous, daily intermittent, and frequent, but not daily (15–29 days per month) (4,7,8).
CDH diagnosis is further complicated when there is frequent use of acute medication (i.e. medication overuse headaches [MOH]). The ICHD-II initially required that a diagnosis of MOH could only be made after a 2-month cessation of these medications with a positive response. This has been modified, focusing on the initial presentation (6), but remains observationally based. Furthermore, adult population studies demonstrate that different acute medications may have a variable influence on the clinical contribution to of MOH (9). Biological genomic markers with detailed phenotypic characterisation would greatly reduce these obstacles to diagnosis and treatment.
The development and pathophysiology of CM remains poorly understood. For migraine, large-scale epidemiological and twin studies suggest both genetic and environmental factors (10–14). This observation implies that there is a genetic, molecular contribution to migraine that may be polygenetic with the multiple molecular pathways resulting in a common phenotypic expression. For CM these influences have yet to be identified.
New molecular biology techniques can assist in identifying the genetic and environmental influences. Gene expression profiling using microarray technology is a powerful technique that can quickly and efficiently screen expression levels in the entire human genome (15) and has helped in diagnosing and classifying cancers (16–18). Blood cells inherit the same genetic information as brain cells and blood genomic profiling patterns for neurological diseases have been described for both rats and humans (19–31). The ability to detect disease-specific gene expression changes in the blood of patients with neurological diseases greatly increases the likelihood of identifying biochemical pathways involved in the pathophysiology of polygenetic, neurological disease such as migraine where brain tissue samples are not readily available. We have previously demonstrated the ability of blood genomic profiling to differentiate CM and acute migraine from healthy controls and patients with other neurological diseases (25). This preliminary study examined the expression patterns of seven subjects with acute migraine and 15 patients with CM compared to 50 controls (healthy and other neurological diseases). Although a preliminary study, it was able to differentiate specific gene expression patterns in platelet and mitochondrial genes that were unique to acute migraine and chronic migraine compared to the controls. This observation served as the foundation of the current study focusing on the contribution of MOH on CM.
Based on these preliminary findings, we speculated that blood genomic profiling could be used as markers for the identification of phenotypic sub-types of CM, including MOH. These patterns may identify interactions between genetic and environmental factors to help us understand better the pathophysiology of CM. In the future, this genomic fingerprint may allow for unique diagnosis and treatment of CM, resulting in a personalised approach to the management of CM with improved response and outcome.
Subjects and methods
Subjects
As part of their standard, multidisciplinary headache care, patients complete a detailed questionnaire with confirmatory history, physical examination, neurological examination and comprehensive headache examination that is maintained in an extensive, relational database, allowing for screening of complex phenotypes (32). This database was screened for daily or near daily use of acute medications to identify MOH. For this study, CDH was defined as 15 or more headaches per month, but only subjects with daily continuous or daily intermittent headaches and only subjects meeting the revised ICHD-II for CM and MOH were enrolled. Reduction of headache frequency >50% by cessation of these medications was used to confirm MOH. These patients were compared with the genomic subjects to assure a representative sample.
Patients with CM (continuous or intermittent) aged 5–18 years, not receiving prophylactic treatment, were asked to participate in genomic expression analysis. This group was representative of the entire population seen and no additional selection criteria were applied. Whole blood was obtained initially and at selected follow-up evaluations. Patients and their parents gave informed consent/assent, based on age and institutional policy. Patients and parents also authorised the use of medical information for research purposes including data collection and analysis as approved by the Institutional Review Board at Cincinnati Children’s Hospital Medical Centre.
Patients were prescribed a standard multidisciplinary treatment plan including acute, preventative, and biobehavioural therapy (32). Patients with probable MOH were instructed to discontinue any acute medication for a minimum of 30 days. Patients were categorised into CM (not MOH) or MOH.
Blood for genomic analysis was obtained prior to treatment (D1) and at first follow-up (D2); a schematic of this flow is shown in Figure 1A. A change in gene expression due to MOH was assessed by dividing the subjects based on their presence of MOH and response to treatment at the first follow-up. Responders (R) were MOH subjects whose headache frequency was reduced by >50% within 30–60 days (40.0 ± 8.74 days). Non-responders (NR) were subjects that had no reduction in headache frequency at D2 (54.4 ± 13.11 days). In order to assure that this group was not in transition to responding to therapy at D2, NR subjects also had to continue at a frequency of 30 headaches per month for >90 days but <450 days. Thus, the only clinical differences in the groups at D2 were R versus NR. The treatment approach including acute, preventative and biobehavioural therapies did not differ, with the exception that those patients with MOH stopped the overuse of acute medication. In this way we could assure that the gene expression effects that differentiated R from NR were due to the cessation of overuse of analgesic medications. NR included subjects with or without MOH. Analysis confirmed that gene expression did not differ between MOH NR and CM NR.
Schematic of study design. (A) As outlined in the methods, subjects had samples drawn at their initial presentation (D1) and at the first follow-up (D2). Based on the presence of MOH and the subjects response (R) or lack of response (NR), subjects could be phenotypically defined for genomic analysis. (B) Genomic analysis is detailed in Methods with RNA isolated from a whole blood sample and processed by Affymetrix standardized protocols and analyzed for genomic expression profiles.
Blood sample collection, RNA isolation, and microarray hybridisation
Blood sample collection, RNA isolation, microarray hybridization, and normalisation were performed as previously described (Figure 1B) (33). Whole blood was collected into 6 Paxgene Blood RNA tubes, RNA isolated using Paxgene Blood RNA Kit and concentrated using RNeasy MinElute Cleanup Kit (Qiagen, Valencia, CA, USA <http://www.preanalytix.com/RNA-Instr.asp>). mRNA was assessed for concentration by spectrophotometry (1 µg/µl total RNA) and for quality using the ratio of 28S:18S ribosomal RNA with Agilent Bioanalyzer 2100 (<http://www.chem.agilent.com>).
RNA was prepared and hybridised to Affymetrix HGU133 2.0+ microarrays (<http://www.affymetrix.com>) using standard Affymetrix labelling protocol (<http://www.affymetrix.com/support/technical/manual/expression_manual.affx>) in batches of 16 samples with D1 and D2 samples from each subject paired together. This generated cell intensity (CEL) files containing unnormalised data. The quality and identification of array outliers in the CEL files were assessed using dChip, v2005 (DNA-Chip analyzer <http://www.dchip.org>). The perfect match-only (PM-only) model was used in dChip. All microarrays found to have greater than 5% array outliers were excluded from further analysis. Microarrays that passed quality control criteria were then normalised using RMA (34).
Microarray analysis
Samples were grouped by R or NR and by draw, D1 or D2. Differences between R and NR were assessed at both D1 and D2 using Genespring GX v10 (Agilent Technologies, Santa Clara, CA, USA). Minimum average fold change cut-offs were established, and lists of probesets generated for difference between R and NR. On the Affymetrix microarray, a probeset is a collection of 20 identical single-stranded short pieces of DNA with positive probeset requiring annealing to all 20 probes. These probesets are designed to represent unique genetic sequence with over two-thirds of the probesets being identified as specific genes. Thus, these probesets can be correlated as gene expression. A t-test with Benjamini and Hochberg False Discovery Rate multiple testing correction was performed on each fold change list. Further analysis was performed on all probesets that were significantly different (P < 0.05).
Identified gene lists were analysed for over-representation in tissue expression, biological pathway and gene ontology using DAVID 2008 (Database for Annotation, Visualization and Integrated Discovery, NIAID/NIH <http://david.abcc.ncifcrf.gov/>). DAVID compares the experimental list with databases of probesets shown to be expressed within specific tissues, pathways, or ontology categories, and determines whether the experimental lists contains more probesets than would statistically be expected by chance alone using an EASE score (a modified Fisher’s Exact Test).
Results
Genomic patient demographics
Demographics of subjects with medication overuse headaches

CM that was daily continuous or daily intermittent.
Database screening identified 1311 patients with daily continuous or daily intermittent headaches (26.3% of the entire clinic population). Of these patients having a headache everyday, 513 (39.1%) were using medications daily for the acute treatment of their headaches (MOH), while 797 (60.8%) did not overuse acute medications (not MOH). Additionally, 746 patients had CM that were not daily intermittent or daily continuous with 124 (16.6%) of these patients using daily medications for the acute treatment in 124 (16.6%). The overall rate of MOH for the daily continuous/daily intermittent CM was 39.1%, while for all CM patients it was 36.3%. Genomic analysis focused on daily intermittent and daily continuous CM to assure the greatest potential for sustained gene expression pattern changes.
Genomic expression patterns
Gene expression pattern
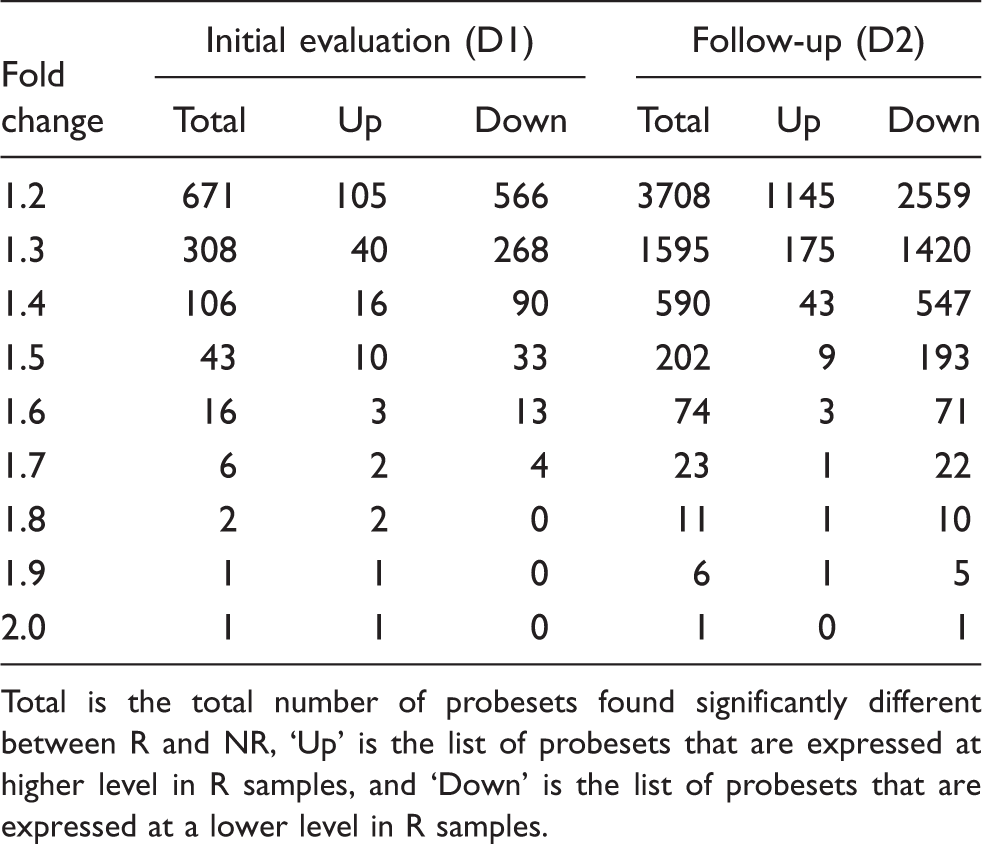
Total is the total number of probesets found significantly different between R and NR, ‘Up’ is the list of probesets that are expressed at higher level in R samples, and ‘Down’ is the list of probesets that are expressed at a lower level in R samples.
Gene expression differences at D1
At a fold change of 1.3, 308 probesets were found to be expressed at a significantly different level between R and NR – 268 were expressed at lower levels in R. At a minimum fold change of 1.5, 43 probesets were found to be significantly different with 33 expressed lower in R. Standard clustering algorithm showed distinct grouping of R and NR, Figure 2A with 12 of the 15 R clustered together and 13 of the 18 NR clustered together with six subjects in the middle suggesting a mixed branching algorithm.
Hierarchical cluster analysis of expression patterns of 308 probesets at D1 (A) and 1595 probesets at D2 (B) comparing R and NR with a minimum fold change difference of 1.3. Individual subjects are represented in each column. Individual probesets are represented by each row. Hierarchical cluster analysis groups subjects and probesets that are most alike together and presented as a branching pattern of subjects (top) and probesets (left). Subjects within the same branch are the most similar. For individual probesets, red indicates that the probeset is expressed at a higher level of expression than the average expression for that probeset, while blue represents a lower level of expression. R subjects cluster more often together on the right (yellow box at the bottom) and NR subjects cluster more often together on the left.
Gene expression changes at D2
R were subjects who had a >50% headache reduction (8.9 ± 4.8 days per month) by D2. At a fold change of 1.3, 1595 probesets were found to be differentially expressed with 1420 having a lower expression in R. At a minimum fold change of 1.5, 206 probesets were found to be significantly different between groups with 193 having a lower expression in R. The unsupervised, standard correlation algorithm clustering shows good separation between R and NR with an intermediate group Figure 2B.
Gene expression changes in NR
Between MOH NR (n = 4) and CM NR (n = 14) only six probesets were found to differ at D2 with one of these probesets at D1 (fold change 1.2). None of the probesets were included in any probesets comparing MOH R and NR.
Tissue expression patterns
Tissue specification for gene expression changes

Gene expression pathways
Selected significant gene expression pathways

Significant gene expression pattern differences
Selected significant genes

Discussion
MOH occurs commonly in patients with CM. The ICHD-II originally defined MOH only after the response to cessation of the daily medication occurred, but subsequently revised such that the overuse alone was sufficient for the diagnosis. MOH occurrence in tertiary headache clinics varies from 5–10% (35–37), while up to 60% of CM patients may have MOH (38). In our population, nearly 40% reported near daily use of analgesic medications with 40% having a 50% or greater reduction in headache frequency by stopping the overuse of analgesics. Although the age of our subjects was predominantly in the adolescent age range, the pattern we observed is similar to that noted above for adults with MOH. This observation highlights the problem with MOH diagnosis, in that over half the MOH patients did not improve. This lack of differentiation raises the need for a marker for those that have pure MOH that responds to cessation.
Clinically, the MOH patients that responded were identical to those that did not respond and neither of these groups phenotypically differing from CM patients without MOH. In the patients that responded to the cessation of the analgesics, a rapid response occurred implying a quick biological reversal of the underlying aetiology. The lack of a response in MOH NR implies that they have a different underlying biological susceptibility that is phenotypically indistinguishable from MOH R. This suggests that different genetic pathways of susceptibility can result in the same clinical presentation. Identifying the underlying molecular biological differences responsible is essential for the understanding and management of patients with MOH.
The rapidity with which this gene expression response changes suggests that the MOH mechanisms is more easily reversible than in those patients that continue to have CM. In this study, the subjects were phenotypically identical at D1 with identical headache frequency and severity. The ability to identify gene expression differences at D1 in R and NR demonstrates that it may be possible to have a predictive biomarker that can be used to establish treatment options for MOH.
Depending on the fold change chosen, the number of genes identified varied from a large number of genes at a low fold change – nearly 4000 genes at a 1.2-fold change in the comparison between MOH R and NR at D2, to only one gene having a 2.0-fold change. This large difference highlights one of the limitations and difficulties of gene expression analysis in the study of the pathophysiological process. To overcome this limitation, the pattern of grouping of these genes by tissue and biological pathways can shed some light on areas to investigate further.
Many of the genes with altered expression in MOH were found to be highly expressed in brain with nearly half the genes for MOH R at D1 and D2 expressed in whole brain. This finding illustrates the ability of whole blood sampling to detect gene expression pattern changes in the brain, and reflects the strength of this tool to study underlying neurological changes. Importantly, the identification of brain-specific gene expression changes suggests that brain gene expression is occurring in MOH that is reversed in response to treatment.
Specific brain areas were also found to be significantly over-represented that have been either hypothesised or shown by neuro-imaging and neurophysiology to be involved in migraine pathophysiology. Specifically, the trigeminal ganglion and superior cervical ganglion are significantly effected suggesting altered sensitivity and functioning within these areas. As these are the primary locations for sensation transmission, and headache by its nature has pain in the distribution of both of these ganglion, this suggests an over-activation in this area that returns to normal once the pain has resolved.
Higher brain areas are also altered, including the amygdala, caudate nucleus and globus pallidus. These areas may be important in the transmission of migraine process and feed-back components to the higher cortical structures, including the cingulate cortex and parietal lobe. The observation that gene expression changes occur throughout the neuro-axis in patients with MOH R highlights a potentially large degree of brain involvement.
In addition to neurological tissues, a variety of other tissues have altered gene expression including muscle, adipocytes, uterine tissue, and a variety of white blood cells. The muscular component was found most significantly in the cardiac myocytes and may indicate an interaction between migraine and cardiac disease. This relationship has recently been reviewed with a suggestion of interaction between the heart and brain in migraine (39). Alternatively, as one of the frequently overused medications of migraine in this study population were NSAIDs, this may reflect altered gene expression in the heart that may contribute the increased association of cardiovascular disease in patients that use NSAIDs (40).
Obesity has been recently observed to be associated with increased headache frequency and disability (41). The altered gene expression of adipocytes is suggestive of a molecular level of interaction with CM and MOH. It is unclear about the direction of the interaction, but does point out the importance of this potential clinical interaction.
A menstrual pattern is common in migraineurs. The majority of the subjects in this study were female, but they were balanced between the R and NR group. In addition, menstrual migraine was balanced between these groups. Therefore, the differential gene expression pattern in uterine tissue suggests a particular susceptibility or potential bio-marker for MOH.
Inflammation is also a hallmark of migraine. In this study, multiple lymphocytic tissues had differential gene expression. Although this may be due to the underlying medication, the R and NR groups reported similar profiles of medications, with NSAIDs being the most predominant. If this effect were simply due to medication, there should not be a difference between the two groups. The difference thus suggests a differential degree of lymphocyte susceptibility to analgesics that may contribute to MOH and is reversible in R. Stopping analgesics thus reverses this biochemical change in the R, yet has no effect in the NR. Identifying the specific cause of this susceptibility has the potential to also be a MOH biomarker.
The gene expression pathway analysis identified that many of these gene changes are associated with cell homeostasis and metabolism (apoptosis pathways, cytoskeleton regulations, nicotinate and nicotinamide metabolism and neurodegenerative diseases); cell signalling (multiple signalling pathways and vesicular release – SNARE); and leukocyte function (transendothelial migration, NK cell-mediated cytotoxicity, antigen processing, and lymphocytic cell signalling). These three groups may have distinct roles in MOH propagation that may underlie some of the risk of progression and decreased responsiveness both over time (apoptosis) as well as acutely (cell signalling). The observation that metabolism may be involved may relate to previous observations of mitochondrial alterations in migraines. The alteration in signalling pathways and the SNARE interactions in vesicular transport may underlie the biological process for hypersensitivity as a change in neurotransmission and signalling that may be reversible.
Many of the individual probesets also involve metabolic, cell signalling and immunological genes. Investigation into these probesets and their expression products may reveal the underlying genetic nature of MOH and provide clues to its prevention and management. This ability to diagnose MOH quantitatively with a predictive biomarker would aid in the ability to treat MOH. This biomarker would allow clinicians to distinguish MOH from CM patients taking daily acute medications not contributing to their headaches. To establish this biomarker, future studies of large groups of MOH and CM patients will be needed to refine specific gene expression from MOH patients that respond to treatment, CM specific genes, and refractory patients that are difficult to treat. In addition, there may be unique overlapping expression patterns that are medication specific with some genes representing the general biomarker for MOH, while the differences may represent the biomarkers for individual mediations. In this way, future treatment can be biologically driven for improved patient outcome in these difficult to treat group of patients.
Footnotes
Abbreviations
Acknowledgements
This work was support by a NIH grant (NS045752). The authors would like to thank Frank Sharp for his original support of this project and his consultation in the original NIH grant. The authors would also like to thank Susan LeCates, Shannon Cherney, Polly Vaughan, Ann Segers, Paul Manning, Judy Bush and Anna-Liisa Vockell for their assistance in clinical recruitment and patient management.