
Abstract
We study within-firm and job-type wage gaps arising from words in job descriptions using a natural language processing technique (word2vec) on proprietary US job-level wage data from publicly traded companies spanning two decades. Analyzing nearly half a million job descriptions, we find that stereotypically feminine descriptions correspond to lower wages compared to masculine ones, as they require fewer years of experience and less education. At the firm level, wider job description wage gaps—where masculine descriptions earn more—are associated with higher firm value. A difference-in-differences design around Executive Order 13672 supports a plausibly causal interpretation, and the effect is strongest in politically sensitive firms. The wage premium for masculine descriptions is linked to a higher share of skilled jobs, greater productivity, and increased investment.
Keywords
“Competition for the best leaders will be intense. One way to ensure that you have the right people in the right jobs in this rapidly shifting environment is by writing
1. Introduction
Almost every job comes with a written job description that outlines the essential duties, responsibilities, qualifications, and expectations associated with a specific position within an organization. Job descriptions, and their corresponding words, are connected to individuals and the managers that write them. Envoking gendered wording in these descriptions could cause a systematic divergence between job opportunities and applicant pools, leading to potentially larger ramifications at the firm-level. In this article, we use information from the US federal contract labor market to help understand how and why gendered wording affects individual job-level outcomes and, therefore, firm financial performance.
Specifically, we use a natural language processing technique (word2vec) to classify nearly half a million US job descriptions as either stereotypically masculine or feminine. We find systematic differences in wages and education/experience requirements between masculine and feminine job descriptions. Feminine job descriptions earn less than masculine ones, likely because they require fewer years of education and experience. This is consistent with individuals investing in their own education and training to increase their productivity and earnings potential, inducing wage differentials (i.e. human capital theory as in Becker, 1965). To explore the effect of these gendered job description wage differentials on firm financial performance, we aggregate these gaps up to the firm-year level, defining them as the percent change between the average wage rates for masculine and feminine job descriptions. We find a firm-level masculine job description wage premium effect: wider job description wage gaps—where masculine descriptions earn more—are associated with higher firm value. These wider gaps likely attract more skilled employees, increasing firm productivity and investment. This is consistent with employers offering higher wages for difficult jobs that may attract more, skilled, and productive employees, which in turn enhances firm productivity and investment, ultimately increasing firm value (i.e. efficiency wage theory as in Akerlof, 1982; Akerlof and Yellen, 1986).
In particular, we analyze 402,385 job descriptions from GovWin IQ, a platform that tracks awarded US federal contracts, between 1999 and 2019. This source lists every job description that the firm will fill associated with fulfilling the contract, thereby allowing one to address important questions, such as the relationship between the words in the job description, whether they are masculine or feminine, and those job outcomes, that cannot otherwise be examined. To the best of our knowledge, this study is the first to use information from GovWin IQ, which includes information on specific job type, job description, stated pay, and firm, and, importantly, is one of the only sources of a holistic view of US wage rates paid for individual jobs at major US corporations (of which they are contractually required to actually pay).
We assess the extent to which a job description might likely be masculine or feminine using the machine learning program word2vec in Python. Following the data-driven approach described in Mikolov et al. (2013), we use basic seed words such as “him” and “her” on pre-trained vectors trained on a part of the Google News dataset (about 100 billion words) that contains 300-dimensional vectors for 3 million words and phrases to identify words that have masculine or feminine connotations. We then calculate cosine similarities between the trained vectors from the Google News dataset and job description vectors to identify which job descriptions are either masculine or feminine.
This approach suggests that feminine job descriptions earn 4.80% less per hour, around four dollars on average, than masculine job descriptions. This estimate implies that, if the gap persists over time, feminine job descriptions would lose more than an entire year’s pay over the course of a 35-year career relative to masculine job descriptions. To explain this finding, we show that feminine job descriptions are associated with lower education and experience requirements. We also find, perhaps surprisingly, that the share of job descriptions, favoring men versus women is roughly equal. Put another way, when it is illegal to express explicit gender preferences in jobs (as is the case in US federal contracts), employers appear to influence wages by gendering job descriptions and use feminine descriptions as often as masculine ones.
Jobs and/or firms traditionally or culturally associated with one gender may inherently offer different wage rates, independent of the gendered wording in job descriptions. However, these estimates of the wage gap and lower levels of corresponding education and experience requirements arising from gendered job descriptions are robust to controlling for job characteristics, firm traits, and time effects. The richness of the data allows for estimation “within” year and job type (i.e. “engineer”) and year and firm (i.e. “Honeywell”). Doing so removes both time-varying observable and time-invariant unobservable characteristics that might explain the effect at the job type- and firm-level.
Given job descriptions importance to matching the right employees to the right jobs, these wage gaps from job descriptions should have an impact on firm outcomes. On the one hand, firms with significant wage differences between feminine and masculine job descriptions may face several negative consequences, such as reduced employee morale, higher turnover rates, and increased litigation risks, all of which could potentially harm financial performance. On the other hand, wider wage gaps might also lead to positive outcomes, as higher wages for masculine job descriptions, seen as more critical to productivity and profitability, could attract more skilled or motivated employees, boosting firm performance. Thus, how wage gaps between feminine and masculine job descriptions impact financial performance is ultimately an empirical question.
We examine these ideas by creating a firm-year panel that takes the percent difference between the average wage rates of masculine and feminine job descriptions. With this unique source of variation, we find that a one standard deviation increase in this firm-level wage gap (meaning that the firm is paying higher wages to masculine job descriptions as compared to feminine ones) is associated with about a 6% increase in Tobin’s Q. In sub-sample analysis, we find that the positive association between job description wage gaps and firm value is significantly stronger in firms facing above-median levels of political risk, as measured by the Hassan et al. (2019) political risk index. This aligns with prior research showing that stakeholder responses to firm behavior, including pay practices, can be politically contingent and that firms in more politically sensitive environments may be rewarded for signaling alignment with dominant cultural or ideological expectations (e.g. Kim et al., 2013; Sheng et al., 2024). We also document positive associations between the wage gap and the share of highly skilled jobs, firm productivity, employee productivity, and firm investment, all of which help explain the observed increase in firm value.
Because firms endogenously choose whether to bid on US federal contracts, the GovWin IQ data may be subject to sample selection bias. To address this concern, we estimate a Heckman (1979) two-step selection model and find that our main results remain robust. To further mitigate concerns about endogeneity, we implement a difference-in-differences (DiD) design around the enforcement of Executive Order 13672, which prohibited discrimination in the federal civilian workforce on the basis of gender identity and extended these protections to hiring practices by federal contractors. This policy represents a plausibly exogenous shock to the compliance environment faced by covered firms and may have influenced internal personnel practices, including compensation structures related to job description wage gaps. Our DiD results are consistent with the baseline specification, strengthening the claim that the observed relationship between gendered job descriptions and firm value is not solely driven by unobserved heterogeneity or selection.
These findings are consistent with the idea that masculine job descriptions demand a wage premium, as they are associated with jobs that are more difficult, require more human capital, and thereby, are more competitive (Becker, 1965; Belot et al., 2022). In turn, jobs that offer higher wages may attract more able applicants, leading to potentially more skilled employees within the firm (Banfi and Villena-Roldan, 2019; Dal Bó et al., 2013; Marinescu and Wolthoff, 2020). As a firm requires more demanding jobs, these highly skilled employees should drive, productivity, which will ultimately lead to increases in firm value (Akerlof, 1982; Akerlof and Yellen, 1986). In addition, these findings occur in a broader context where political debates over Diversity, Equity, and Inclusion (DEI) have raised questions about the role of gendered wage structures in shaping organizational identity and stakeholder perceptions. Prior research shows that in politically conservative or high-risk settings, firms that align with traditional workplace norms, such as those embedded in “masculine” pay structures, may be rewarded for signaling stability or conformity to dominant political expectations (e.g. Kim et al., 2013; Sheng et al., 2024).
We contribute to the literatures on the wording in job descriptions (ads), how and why the gendering of job descriptions impacts wages, and how setting wages correlates with firm performance. Firms actively manage the text in their job ads in response to economic conditions and applicant pools (Marinescu and Wolthoff, 2020; Modestino et al., 2016). However, most prior work in the labor economics area focuses on the share of certain demographic groups that decide to work or enter a specific type of job based on job ads and their corresponding language (see, for example, Darity and Mason, 1998; Flory et al., 2021; Friesen et al., 2011; Ibañez and Riener, 2018; Leibbrandt and List, 2022). This area of research contributes to a broader understanding of demographic stereotypes in labor markets (Chan and Wang, 2018; Coffman et al., 2021; Fischbacher et al., 2023).
However, very few studies in labor economics examine job descriptions. Unique data from China suggests that firms use job ads to frame managerial gender preferences in hiring practices (Kuhn et al., 2020; Kuhn and Shen, 2013, 2023). In addition to China, job ad data from India, Mexico, and the United States suggests that managers set gender preferences either explicitly (by directly stating the job is for a male or female if legal) or implicitly (by writing the job ad in such a way to attract only a specific gender) to influence job applicant decisions to apply for a job (Card et al., 2022; Castilla and Rho, 2023; Chaturvedi et al., 2023; Chowdhury et al., 2018; Helleseter et al., 2020; Ningrum et al., 2020). Field experiments suggest that job ad language related to stereotypes of age (Burn et al., 2022, 2023a, 2023b), job flexibility (He et al., 2021), competition and pay uncertainty (Flory et al., 2015), masculinity (Tilcsik, 2011), and diversity (Derous and Wille, 2017; Flory et al., 2021) may predict hiring discrimination against specific demographic minority groups or decrease the share of minority groups that choose to pursue specific jobs.
Even fewer studies research how the text in job descriptions relates to wages. The text in employment vacancies from Burning Glass Technologies, a database that encompasses nearly all jobs posted to online sources in the United States, suggests that specific keywords related to employee skills are associated with wages (Deming and Kahn, 2018). Data from a Chilean job board suggests that high-wage job ads attract more applicants and that the text in job descriptions tacitly conveys wage information (Banfi and Villena-Roldan, 2019). Similarly, Belot et al. (2022) design an experiment using a UK job board where they assign wages randomly to pairs of otherwise similar employment vacancies and find that higher-wage jobs are perceived as more competitive based off of the text that conveys information about skill and experience. Textual analysis to identify gender preferences within job descriptions posted on an online job portal in India suggests that job ads that prefer women are associated with lower advertised wages and that these jobs attract a larger share of female applicants (Chaturvedi et al., 2024).
And there are no studies, to the best of our knowledge, that explore how the relationship between gendered job descriptions and wages are associated with firm performance in empirical corporate finance. However, there is literature on how differences in pay levels correlate with firm outcomes. Mueller et al. (2017a, 2017b) use data from the United Kingdom to show that firm size, as measured by total assets, is positively correlated with pay inequality since larger firms are more difficult to manage and thus require managers with more talent that demand higher wages (Gabaix and Landier, 2008; Terviö, 2008). Data from Italy suggests that pay dispersion increases among firms whose workers show lower sensitivity to pay inequality and that these firms outperform similar firms whose workers show higher sensitivity to pay inequality (De Vito and Gomez, 2024). Krueger et al. (2024) use data from Sweden and find, that employees earn lower wages in more sustainable firms, especially among highly skilled workers. Additional work examines how pay inequality within the top management team (Heyman, 2005; Kale et al., 2009; Siegel and Hambrick, 2005) or between the CEO and the median employee (Carter et al., 2024; Green et al., 2023; LaViers et al., 2024; Pan et al., 2022; Rouen, 2020) affects morale and performance.
We contribute to these literatures in several ways. First, we systematically identify the relationship between wages and gendered words in job descriptions for American jobs. Specifically, we complement Chaturvedi et al. (2024), which use Indian jobs, and provide external validity to the association between the wording of job descriptions and wages. Second, we provide the first evidence on how and why heterogeneity in the gendered wording across setting individual job-level wages in the United States is associated with firm performance. In particular, we add to the work in Deming and Kahn (2018), which use US job ads also, and show that not only text related to skills impacts firms, but so does text related to gender.
More broadly, we show how managerial decisions at the individual job-level that influence wages and their respective gaps within the firm can have larger financial ramifications at the firm-level, continuing the work of Mueller et al. (2017a, 2017b), among others, to show that setting wages is a non-trivial decision for the firm. Overall, understanding how job description wage gaps impact financial performance is important as it allows for a comprehensive evaluation of how such differences affect a firm’s economic health and underscores the need for firms to consider how they word their job descriptions. Finally, from a US policy perspective, more research in this area is greatly needed as there is little regulation on the wording of job descriptions, and it is unclear if there even needs to be any.
2. Data and descriptive statistics
2.1. Genderness of job descriptions
We manually collect proprietary US job-level wage data from publicly traded companies from 1999 to 2019. Specifically, the wage rate data is from GovWin IQ. It is a website that tracks US federal contracts to help “businesses manage opportunities, pursue bids faster, and plan strategically to get ahead of the competition.” The GovWin data includes information at the job-year level and, importantly, details the text in job-level job descriptions. Typically, in bids for US federal contract, procurement contracting officers at companies put together qualification requirements, and, thus, the job descriptions, before assigning wages.
We use the natural language processing technique, word2vec (Mikolov et al., 2013), to analyze the gendered language in job descriptions, identifying whether they lean toward masculine or feminine terminology. Word2vec operates by teaching a model to understand the relationships between words based on their context within large volumes of text. As the model processes these texts, it learns to predict the likelihood of certain words appearing near each other, effectively capturing the semantic associations between them. Through this iterative process, the model generates vector representations for each word, where similar words are positioned closer together in a multidimensional space. These vectors allow for a detailed analysis of language patterns, enabling the identification of gendered language in job descriptions based on the contextual relationships between words. 1
We use pre-trained vectors trained on a part of the Google News dataset (about 100 billion words) in Python. The model contains 300-dimensional vectors for 3 million words and phrases that are obtained using a data-driven approach described in Mikolov et al. (2013). We start with the following basic seed words to identify gender from the Google News dataset: the masculine words are he, him, his, man, male, brother, son, father, and boy and the feminine seed words are: she, her, hers, woman, female, sister, daughter, mother, and girl.
This creates a context-specific dictionary for measuring masculine and feminine words.
In Figure 1, we plot the most heavily weighted adverbs and adjectives in the job descriptions by the identified gender association from word2vec. Using simple seed words and Google News, the model identifies words in job descriptions such as erratic, physically, and mentally as masculine and elementary, emotional, and distressed as feminine. Relating these word clouds to the psychology literature on identifying gendered words, which typically uses a bag of words approach, we find striking similarities. For example, Friesen et al. (2011) create a measure of gendered wording from published lists of agentic and communal words (e.g. individualistic, competitive, committed, supportive; Bartz and Lydon, 2004) and masculine and feminine trait words (e.g. ambitious, assertive, compassionate, understanding; Hoffman and Hurst, 1990). Their list of 40 masculine and feminine words are often grouped into the same gender category as the word2vec model.
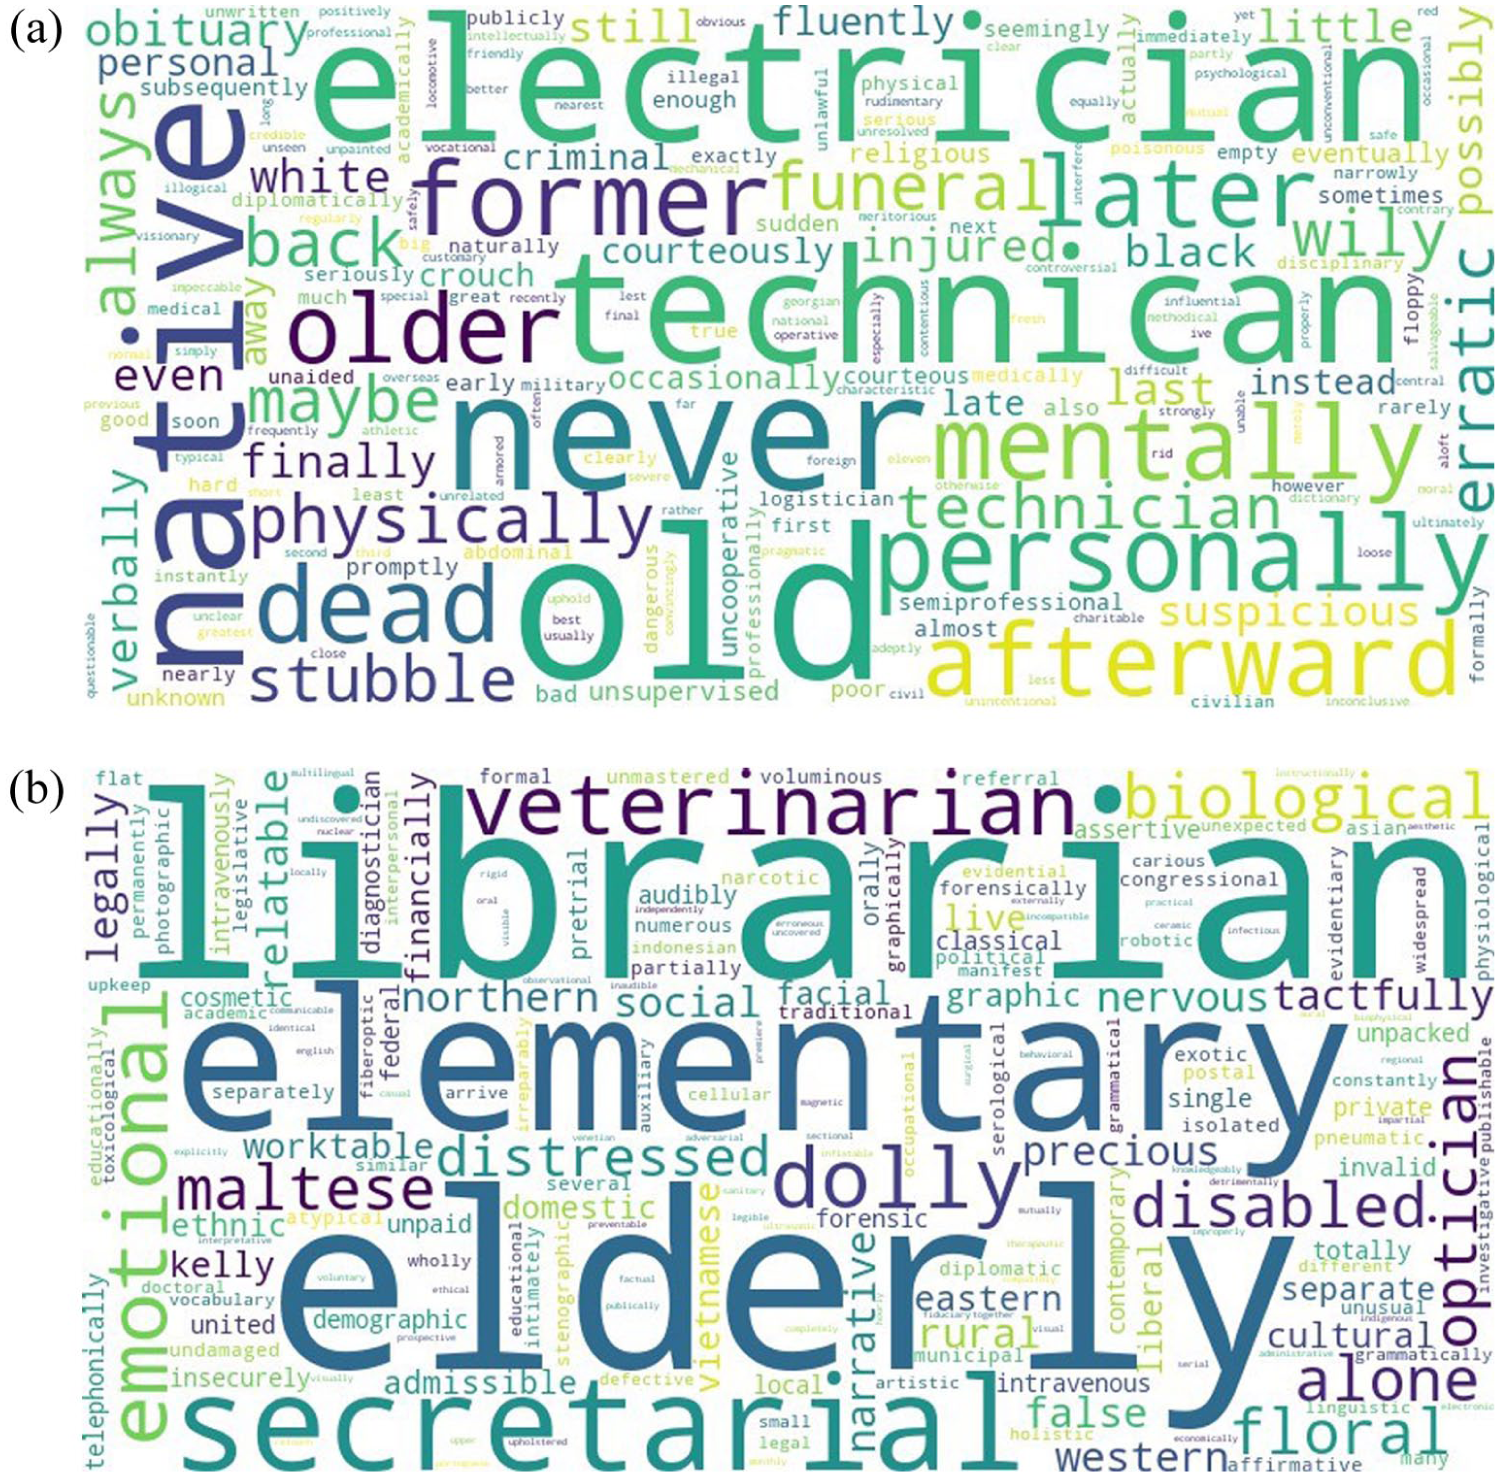
Job description word clouds from Word2vec.
Next, we turn to the job descriptions from GovWin IQ. We vectorize each job description and assign weights to words based on their frequency in the document set and their overall corpus frequency, which helps emphasize words that are distinctive to a particular description and de-emphasize common words (i.e. the tf.idf package in Python). We then calculate cosine similarities between the trained vectors from the Google News dataset and job description vectors. If the job description has a higher similarity with masculine (feminine) words identified from the pre-trained model, then it is identified as masculine (feminine).
Table 1 shows four job descriptions from the data, their corresponding gender classification from the word2vec model, and the firm and year the job description is for. The job descriptions are for the same job (program manager in the top panel and quality assurance manager in the bottom panel). For the 2014 Booz Allen Hamilton contact, word2vec identifies the first, job description as masculine and the second job descriptions as feminine. The masculine description appears to potentially emphasize control, structure, and technical responsibilities, with phrases such as “day-to-day management,” “organizes, directs, and coordinates,” and “establishes and alters corporate management structure.” This language seems to be assertive and action-oriented, which often may be associated with traditionally masculine traits. In contrast, the feminine description appears to possibly highlight strategic vision, collaboration, and communication, with phrases like “strategically manages,” “developing product and service vision,” and “building and successfully maintaining.” This language seems to focus on relationship-building, holistic management, and strategic thinking, which could be traits traditionally associated with femininity. Similar structures are present in the Honeywell 2011 contract.
Job description examples.
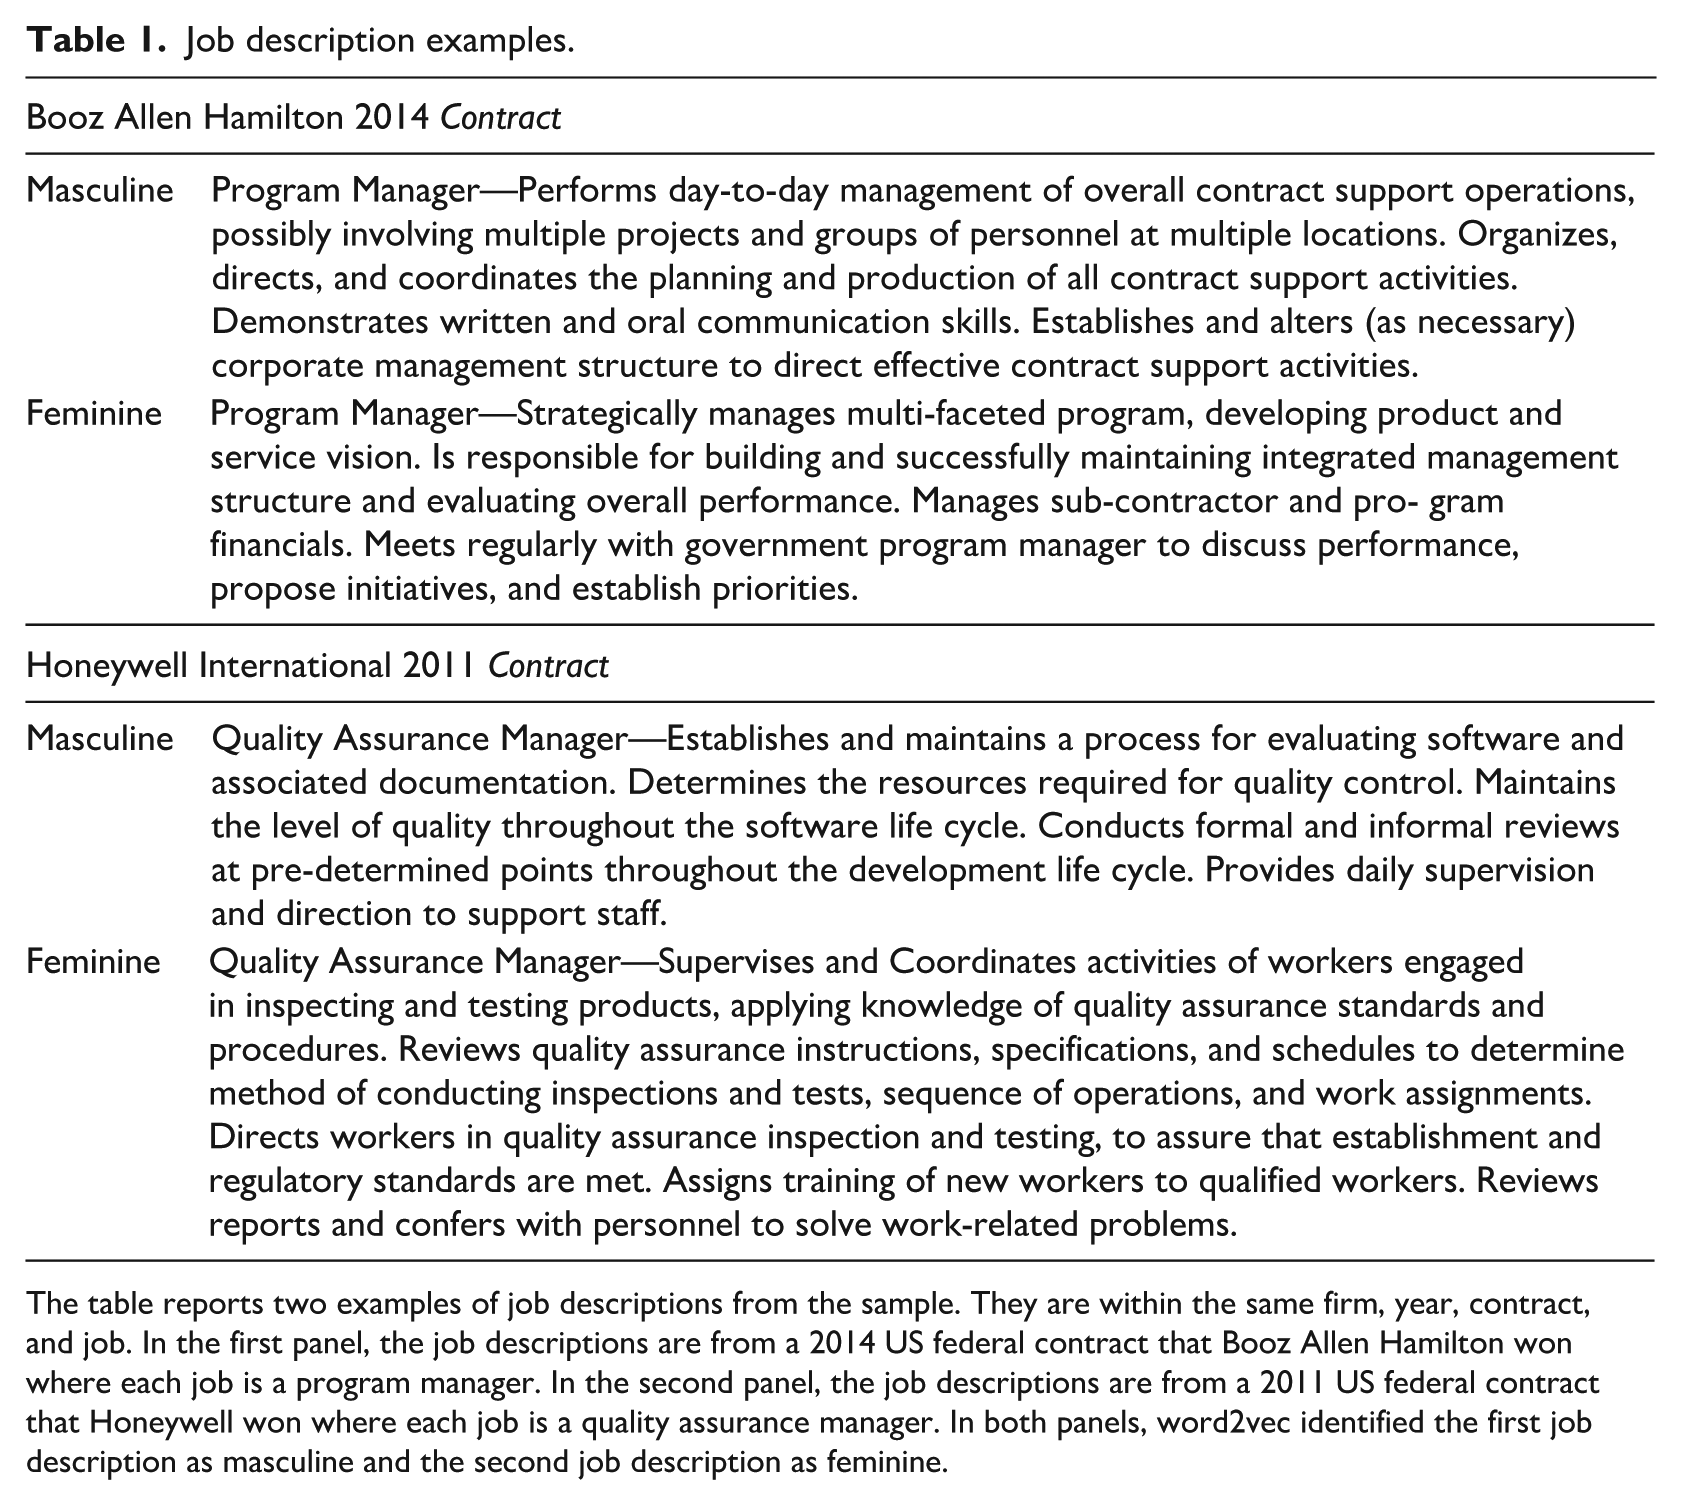
The table reports two examples of job descriptions from the sample. They are within the same firm, year, contract, and job. In the first panel, the job descriptions are from a 2014 US federal contract that Booz Allen Hamilton won where each job is a program manager. In the second panel, the job descriptions are from a 2011 US federal contract that Honeywell won where each job is a quality assurance manager. In both panels, word2vec identified the first job description as masculine and the second job description as feminine.
In summary, while it is theoretically possible for experts with deep knowledge of various aspects of business operations to understand the myriad meanings of individual words and phrases based on context in job descriptions, their doing so is often impractical and highly disputed. As such, we offer a machine learning alternative to address these challenges. The proposed approach starts with seed words that define each gendered value and automatically creates a high-quality dictionary from qualitative job descriptions. The word embedding model approach, which learns the meaning of a word based on its context, then allows for analysis on the difference in outcomes for masculine and feminine job descriptions.
2.2. Summary statistics
The sample means are in Table 2. For each US federal contract that a firm wins, one can observe information such as the job title, worksite location, contract type, education and experience requirements, job descriptions, and, importantly, the wage rate. A limitation of the data is that it only contains the winners of these US federal contracts and does not show information about other firms that bid for and lost the contract.
Descriptive statistics.
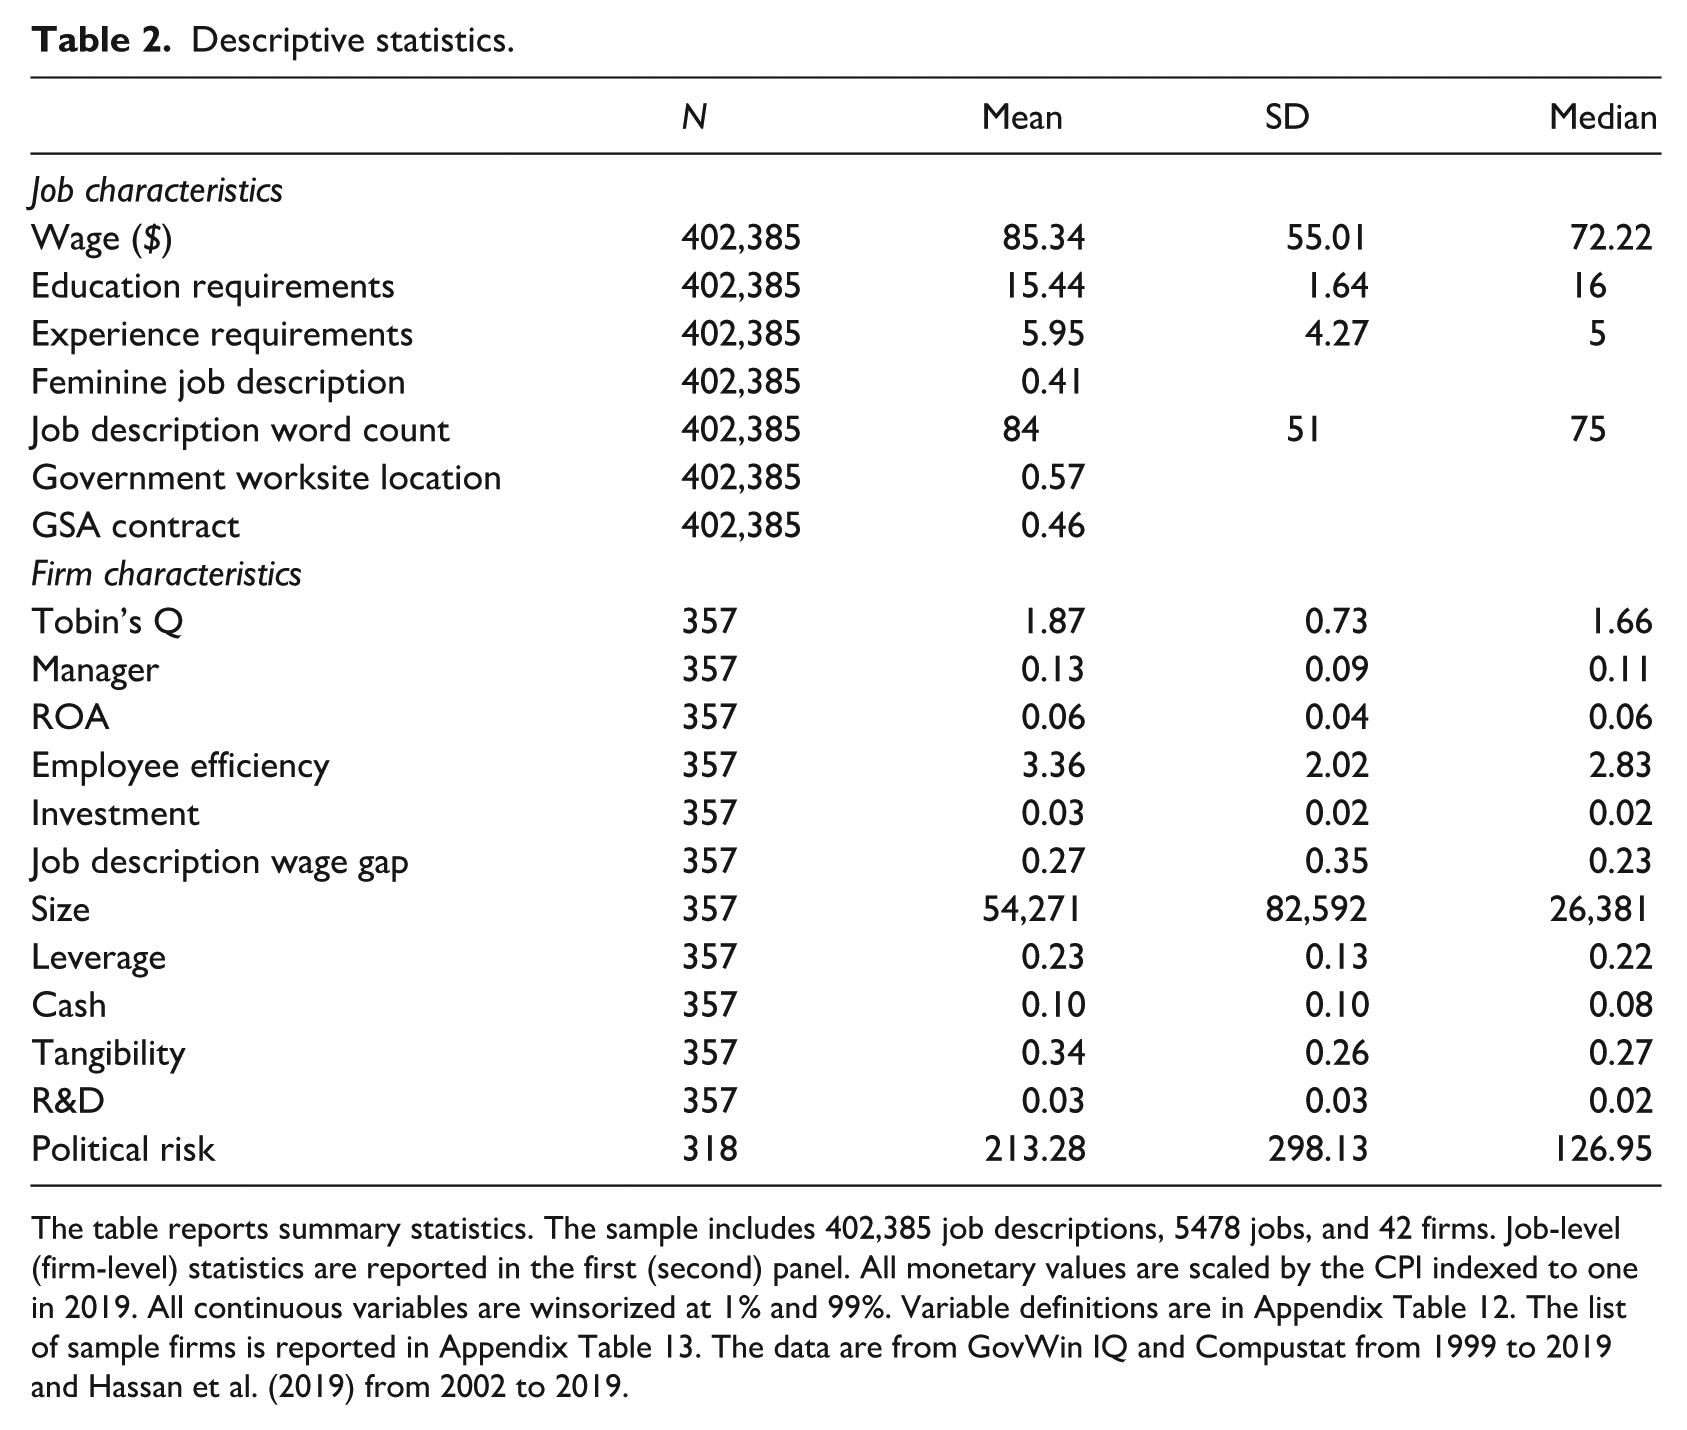
The table reports summary statistics. The sample includes 402,385 job descriptions, 5478 jobs, and 42 firms. Job-level (firm-level) statistics are reported in the first (second) panel. All monetary values are scaled by the CPI indexed to one in 2019. All continuous variables are winsorized at 1% and 99%. Variable definitions are in Appendix Table 12. The list of sample firms is reported in Appendix Table 13. The data are from GovWin IQ and Compustat from 1999 to 2019 and Hassan et al. (2019) from 2002 to 2019.
To ensure a consistent sample of observations across specifications, we exclude observations.
with missing values for contract year, education and experience requirements, job descriptions that are missing or have five words or less, and singleton observations. We then merge in Compustat data and drop any observations with missing firm-level financial data. We also merge in political risk data from Hassan et al. (2019), which only covers 2002 to 2019. To reduce inflation concerns, we scale all monetary values by the CPI indexed to one in 2019. We winsorize all continuous variables at 1% and 99% to reduce outlier concerns.
The first panel of Table 2 reports job-level characteristics from GovWin IQ. The average wage rate is $85.34 an hour. A technicality of US federal contracts is that the wage rate is not the true wage that an employee receives for that job. It is often a percentage of the rate, and the firm keeps the remaining percentage. Thus, it is highly unlikely that employees in the sample actually receive the full dollar amount reported.
On average, most jobs in the sample require around 16 years of education (i.e. a bachelor’s degree) and about 5–6 years of experience. Less than half of the job descriptions are identified as feminine with about 41% being identified as a feminine job description, which is unsurprising given the list of firms and their corresponding Fama-French 12 industries in Appendix Table 13 have a tilt toward jobs that would probably be viewed as more historically masculine. The average job description has around 84 words in it.
GovWin IQ also includes information about federal contract location and type. Fifty seven percent of jobs from US federal contracts take place on government grounds. The reaming percentage of jobs are located on contractor grounds. 46% of jobs are administered by the US General Services Administration (GSA), the federal agency that provides management best practices for the government to use to contract with commercial companies, while 55% are bid out by other US federal agencies.
The second panel of Table 2 reports firm-year-level characteristics from Compustat and Hassan et al. (2019). At the firm level, we require all observations to have non-missing information for Tobin’s Q and the job description wage gap. The sample firms are large. On average, firms in the sample have $54 billion in total assets. Since the sample is restricted to a sub-sample of firms that are on the S&P 500, these averages make sense and suggest that the findings are likely not generalizable to smaller firms.
These firms are also profitable and productive. The average Tobin’s Q is 1.87, the average ROA is 0.06, and these firms generate about $336,000 of sales per employee. However, they might not be the most equitable. On average, the job description wage gap—the percent difference between the average wage of masculine job descriptions and feminine job descriptions—is 27%, or, in other words, masculine job descriptions earn about 27% more than feminine job descriptions within the same firm and year. The average wage for feminine (masculine) job descriptions is $84.75 ($106.29). About 13% of jobs for firms in this sample require a manager. Finally, the average of political risk is 213.
Figure 2 plots some of the most common jobs. The larger the word, the more occurrences it has in the sample. Out of the 5478 jobs, the most common titles include project manager, program manager, subject matter expert, and engineer/technician. Once again, considering the list of firms/industries in Appendix Table 13, these jobs, and their respective weights, fall in line with expectations.

Job word cloud.
Job descriptions show a surprising amount of gendered heterogeneity across firms and industries. Figure 3 plots the share of gendered job descriptions by firm across all years of the sample period. Specifically, the figure reports the share of job descriptions identified as feminine for samples of job descriptions differentiated by firm. Accenture, CoreLogic, and UnitedHealth Group have some of the highest shares of feminine job descriptions, while Tesla, Dell, and Broadcom have no feminine job descriptions.
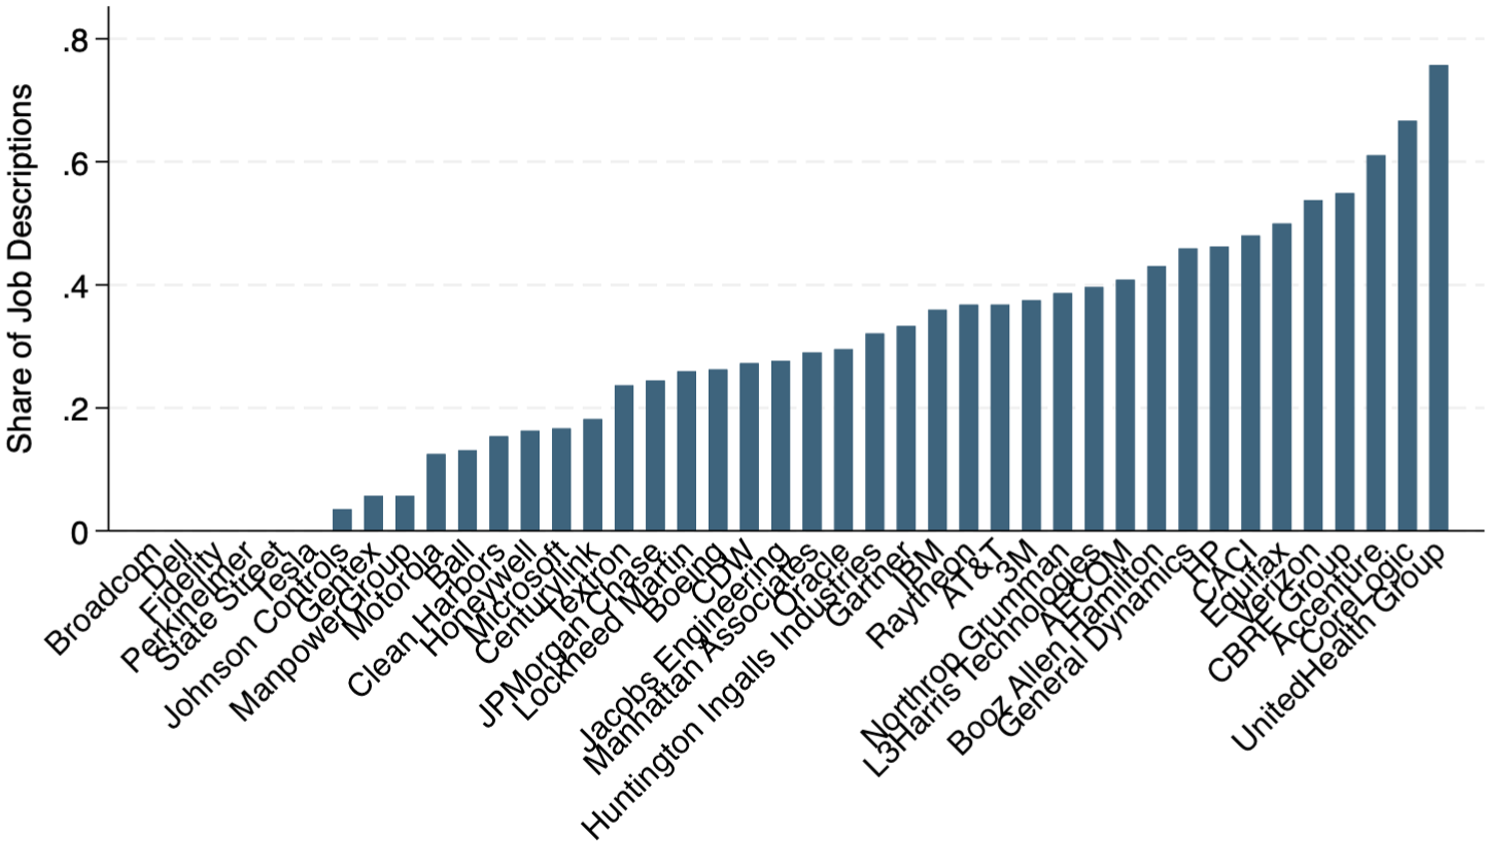
The share of feminine job descriptions by firm.
Figure 4 follows the same structure as Figure 3, except that it plots the share of gendered job descriptions by Fama-French 12 industries (of which only seven exist in the sample). The graph shows that industries such as consumer durables have job descriptions that rely more heavily on masculine words. Industries like retail, manufacturing, and communications have similar shares of feminine job descriptions. Somewhat surprisingly, finance has the highest share of feminine job descriptions (70%).
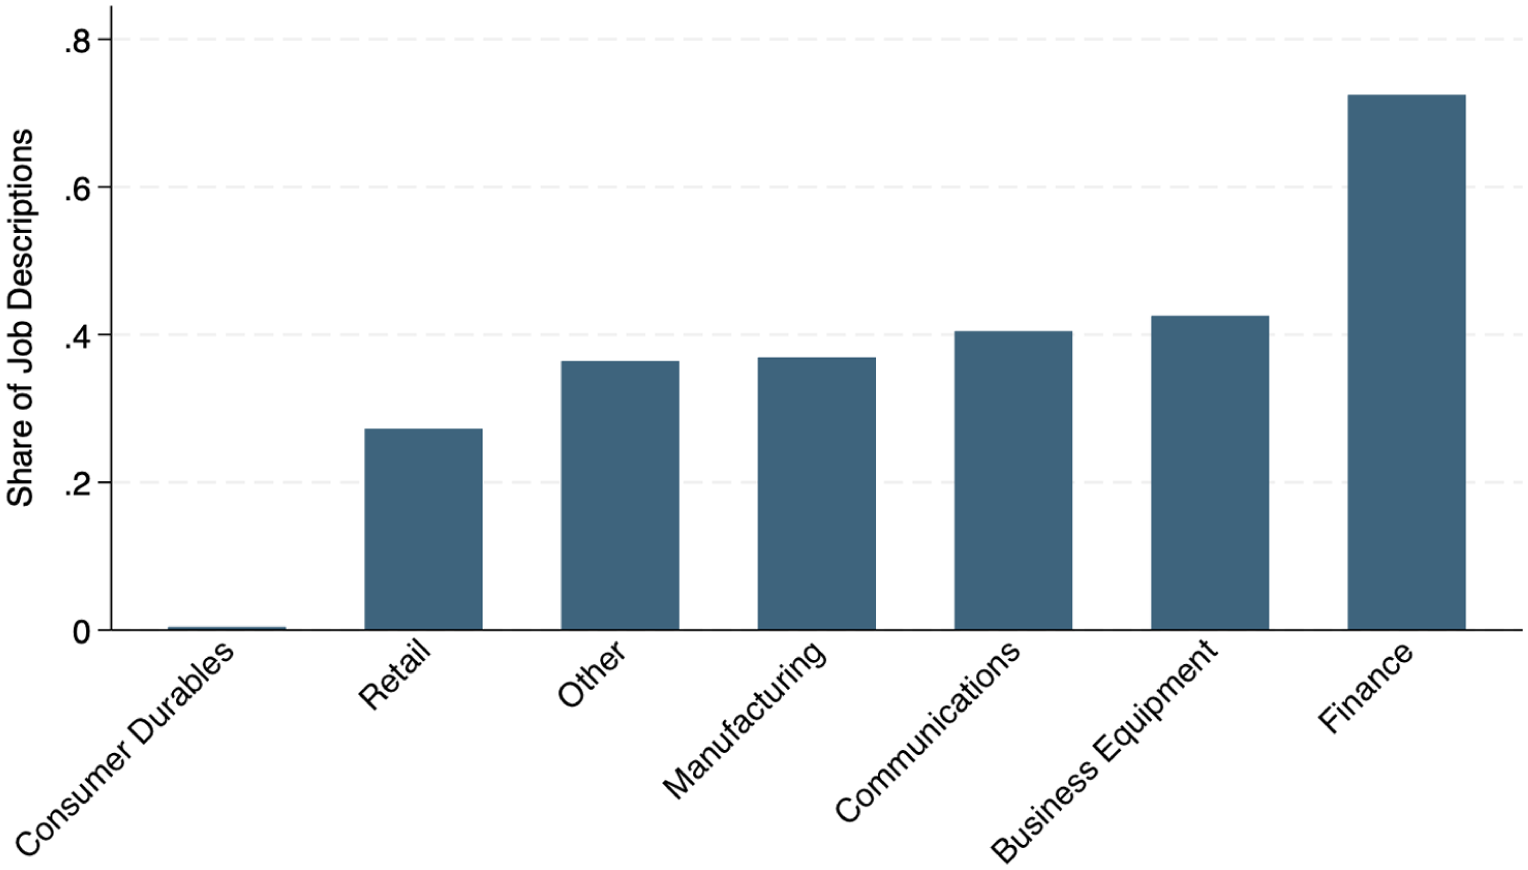
The share of feminine job descriptions by industry.
2.3. Determinants of feminine job descriptions
Additional detail on the role of firms, jobs, and their intersection (“job cells”) in accounting for patterns of gendered job descriptions is provided in Table 3. It presents a decomposition of the variance in the indicator of feminine job description. The approach of decomposition of wages into occupation- and firm-specific components follows Groshen (1991). Accordingly, column (4) of Table 3 reports the R2 from a linear probability regression model of feminine job description (a binary variable that takes the value of one if word2vec identified the job description as feminine and zero otherwise) on a full set of firm and job fixed effects.
What explains a feminine job description?.
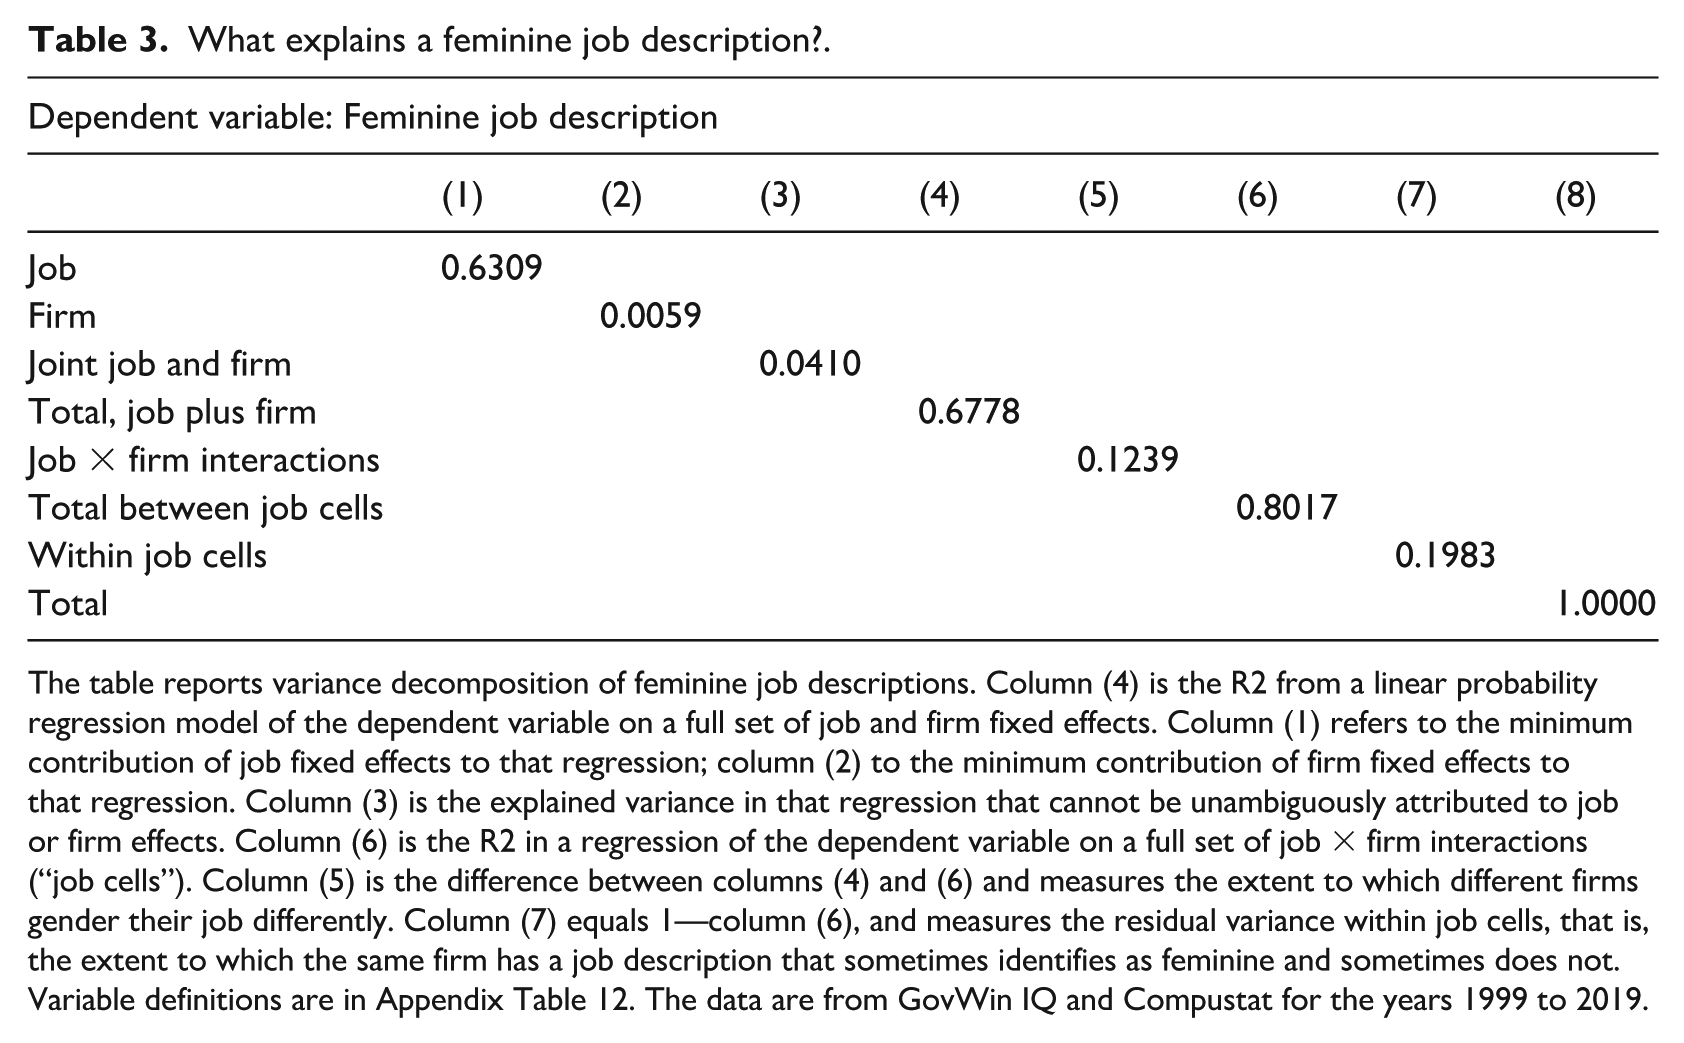
The table reports variance decomposition of feminine job descriptions. Column (4) is the R2 from a linear probability regression model of the dependent variable on a full set of job and firm fixed effects. Column (1) refers to the minimum contribution of job fixed effects to that regression; column (2) to the minimum contribution of firm fixed effects to that regression. Column (3) is the explained variance in that regression that cannot be unambiguously attributed to job or firm effects. Column (6) is the R2 in a regression of the dependent variable on a full set of job × firm interactions (“job cells”). Column (5) is the difference between columns (4) and (6) and measures the extent to which different firms gender their job differently. Column (7) equals 1—column (6), and measures the residual variance within job cells, that is, the extent to which the same firm has a job description that sometimes identifies as feminine and sometimes does not. Variable definitions are in Appendix Table 12. The data are from GovWin IQ and Compustat for the years 1999 to 2019.
Column (1) calculates the minimum contribution of occupation effects to that regression as the reduction in R2 when the occupation effects are removed from it. Column (2) performs the analogous exercise for firm effects, and column (3) equals column (4)—(column (1) + column (2)). In sum, column (4) reports the total variance that can be explained by job and firm effects, and columns (1)–(3) respectively partition this variance into components that can be unequivocally assigned to occupation effects, firm effects, and a portion that cannot be unequivocally assigned to either of these two factors.
Next, column (6) of Table 3 presents the R2 from a linear probability regression model of feminine job description on a full set of job by firm interactions. Thus, column (6) shows the, total variance that can be explained by these job cells. Column (7) (which is just 1—column (6)) is the within-job-cell variance.
Finally, column (5) is the difference in R2 between the regression with job by firm interactions (column (6)) and the regression with job and firm effects (column (4)). It is a measure of the extent to which firms gender their job descriptions differently. For example, it would equal 0 in column (1) if the tendency for job descriptions to be feminine was the same in all firms and similarly for all other occupations.
The decomposition results in Table 3 suggest that the job categories explain a considerable portion (63%) of the variance in feminine job descriptions. Firm effects explain less than 1% of the variation in feminine job descriptions, but the total explained by firms and jobs together is 80%. Although firm effects are unimportant by themselves, most of the variation in job descriptions occurs within job and firm (column (6)).
Recalling that column (5) of Table 3 measures the extent to which different firms gender job descriptions differently, the results show that this tendency explains a small share—a little more than one tenth—of the total variance in the genderness of job descriptions. Thus, it appears that jobs are fairly consistently gendered across firms. This fits with the findings in Figure 3, where a majority of the firms have similar shares of feminine job descriptions. To the extent that the job categories measure the type of work performed in a job, this suggests that the broad nature of the work performed may be a decent predictor of whether a job description is feminine.
Finally, according to column (6), a full set of job by firm interactions explains most of the gender variation in job descriptions. Since these factors are very powerful, it follows that about 20% of the variance occurs within job cells, that is, because the same firm, at different times during the sample period, sometimes (for instance) writes a job description as feminine and sometimes does not.
One interpretation of this pattern is, of course, that individual firms’ job-specific gender preferences are not fluid over time. Alternatively, firms might consistently gender job descriptions at a finer level than the job indicators capture, whereas the mix of detailed job titles they are trying to fill changes from contract to contract. According to Kuhn and Shen (2013), the later case is more likely.
3. Empirical approach and results
3.1. Do feminine job descriptions earn less?
In this section, we explore the relationship between feminine job descriptions and wage rates. Figure 5 plots this relationship over time. A clear wage gap is evident throughout the period, with masculine job descriptions consistently earning higher wages than feminine job descriptions. The wage gap fluctuates over time but exhibits a noticeable divergence post-2008, particularly peaking around the end of the sample period, where the difference is most pronounced. This trend reflects broader economic conditions, with wage dips during recession periods and recoveries aligning with economic upturns. Even though the raw data shows a wage gap by job descriptions gender over time, it could easily be the case that economic conditions, firm specifics, or the jobs themselves can explain this gap.
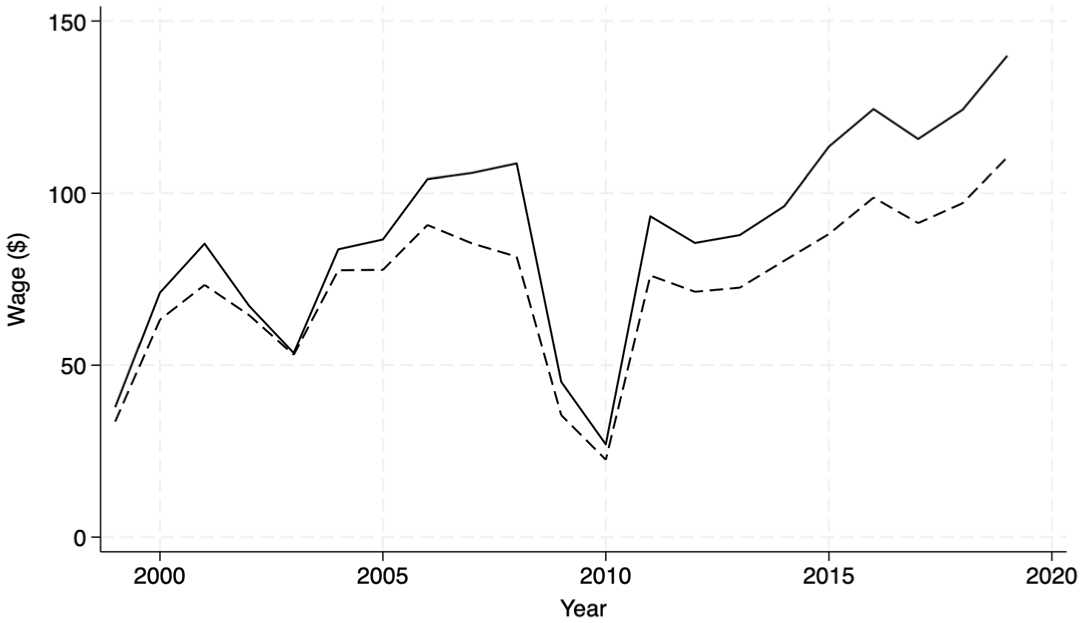
Wage rates for job descriptions by year and gender.
To address these cases, we use variations of the following fixed effect linear regression:

The dependent variable, ln(wageijfwclrt), is the wage rate for job description i in job j in firm f at worksite w for contract type c in location t in job description quintile r during year t. Feminineijfwclrt takes the value of one if a job description is identified as feminine and zero otherwise. Fixed effects, γjt, δft, αwt, ωct, ξlt, and ηrt capture both time-varying observables and time-invariant unobservables by job, firm, worksite, contract type, location, and job description word count, respectively. ϵijfwct is the econometric error term, and we report standard errors clustered by job.
One problem with taking the wage gap between feminine and non-feminine job descriptions in Figure 5 at face value is the possibility that jobs traditionally or culturally associated with one gender may inherently offer different wage rates, independent of the gendered wording in job descriptions. To limit this concern, we include job type by year fixed effects that should average out both time-varying observables and time-invariant unobservables in these classifications. For example, equation 1 will compare the difference in wage rates between job descriptions identified as either feminine or non-feminine “within” the job type and year of “engineer.” Thus, while it is likely that the job type of “engineer” has job descriptions that are more non-feminine dominated than the job type of “administrator,” the empirical model overcomes this issue by looking within these job types.
Another issue is that differences across firms that are either time varying and observable or time invariant and unobservable, as is evident in Figures 3 and 4, could explain the gap in Figure 5. For example, it could be the case that larger firms have more dispersion across wages irrespective of the genderness of job descriptions (Mueller et al., 2017b). Firm by year fixed effects help reduce omitted variable bias of this nature as they control for time-varying observables like firm size and time invariant unobservables.
We also include contract specific fixed effects to reduce issues that might vary with wages by US federal awards. For example, a potential concern is that masculine roles might involve higher risk or other jobs might have more flexibility around travel requirements. To address the concern, we incorporate fixed effects for the location in which each contract is performed. 2 These location-based fixed effects help control for institutional, logistical, and regulatory differences that influence job structures across regions, including the feasibility of remote work and the extent of required travel. In addition, we use job description word count grouped into quintile fixed effects to control for job risk as a higher word count, and thus more responsibilities, could mean it is easier to get fired. Therefore, the coefficient of interest, β, measures the average difference in wages between feminine and masculine job descriptions relying on variation within job, firm, worksite, contract, location, and job description word count.
The results from equation 1 estimates are reported in Table 4. The columns of the table relax successive constraints that the regression coefficients be zero. Column (4), the most restrictive model with year by job, year by firm, year by worksite, year by contract, year by location, and year by word count fixed effects, shows a negative relationship between feminine job descriptions and wage rates. Specifically, feminine job descriptions earn 4.80% less than non-feminine job descriptions. 3 Across all specifications, the results are highly statistically significant at the 1% level.
Feminine job descriptions and wage rates.
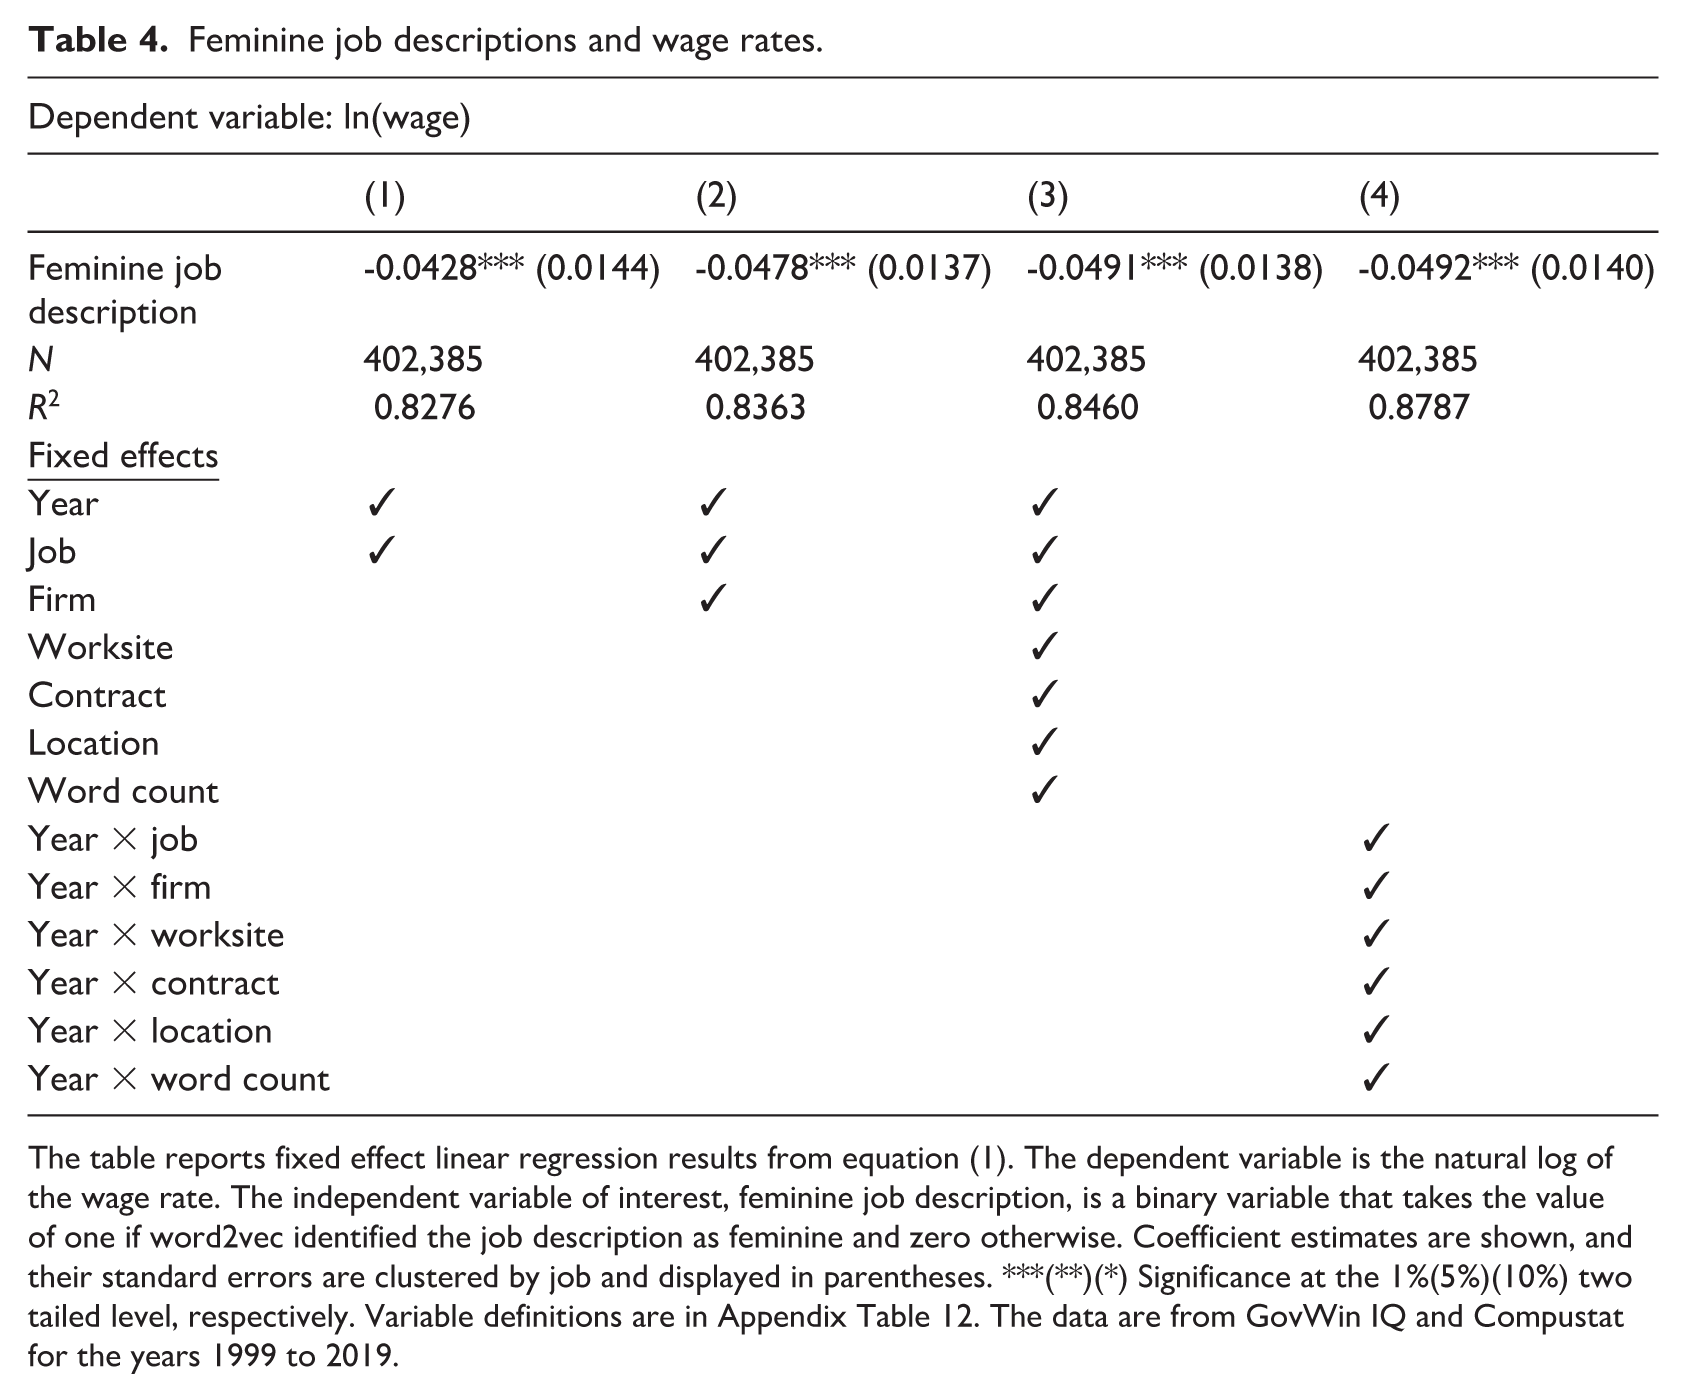
The table reports fixed effect linear regression results from equation (1). The dependent variable is the natural log of the wage rate. The independent variable of interest, feminine job description, is a binary variable that takes the value of one if word2vec identified the job description as feminine and zero otherwise. Coefficient estimates are shown, and their standard errors are clustered by job and displayed in parentheses. ***(**)(*) Significance at the 1%(5%)(10%) two tailed level, respectively. Variable definitions are in Appendix Table 12. The data are from GovWin IQ and Compustat for the years 1999 to 2019.
The findings are also economically significant. If this gap persists over time, feminine job descriptions would lose more than an entire year’s pay over the course of a 35-year career relative to masculine job descriptions. To calculate this estimate, we follow Biasi and Sarsons (2022) and use information from both Tables 2 and 4. First, we take the average wage rate in Table 2 ($85) and multiply that by the coefficient 0.0480 from column (4) in Table 4. That equals $4.08. Thus, on average, feminine job descriptions have a wage rate around $81 and non-feminine job descriptions have a wage rate of $85. Next, we multiply these numbers by a 40–hour/50–week work year to get $162,000 for feminine job descriptions and $170,000 for non-feminine job descriptions. Over the course of a 35-year career, non-feminine job descriptions earn about $5.9 million, while feminine job descriptions earn close to $5.7 million. The difference of $200,000 is more than an entire year’s pay over the course of a 35-year career for feminine job descriptions relative to non-feminine job descriptions.
3.2. Why do feminine job descriptions earn less?
We examine why feminine job descriptions earn less than masculine job descriptions in this section. One potential explanation for this wage gap lies in the differing education and experience requirements set by managers when bidding for US federal contracts. These requirements are critical determinants of job compensation, as higher education and greater experience typically command higher wages. If job descriptions that are perceived as feminine tend to require less education or experience compared to their masculine counterparts, it could naturally lead to lower wages for these positions.
To explore this hypothesis, we analyze the correlation between job descriptions and their associated education and experience requirements. By examining whether feminine job descriptions are systematically linked to lower education or experience thresholds, it becomes possible to understand the underlying factors contributing to the wage gap between gendered job descriptions. This approach isolates the impact of specific requirements on wages, providing a clearer picture of how managerial decisions regarding qualifications influence compensation.
Since both education and experience are positive count outcome variables that count the number of years required for a specific job, we implement a Poisson pseudo-likelihood regression with multiple levels of fixed effects:

The dependent variable, yijfwclrt, is either education or experience requirements for job description i in job j in firm f at worksite w for contract type c in location t in job description quintile r during year t. All other model specification are the same as in equation (1).
Table 5 reports differences in education requirements between feminine and non-feminine job descriptions. All else being equal, column (4) shows that feminine job descriptions require, 1.25% less years of education than masculine job descriptions. On average, that equates to about 0.20 years less of education. This finding suggests that one potential reason feminine job descriptions earn less than masculine job descriptions is that they require less education.
Feminine job descriptions and education requirements.
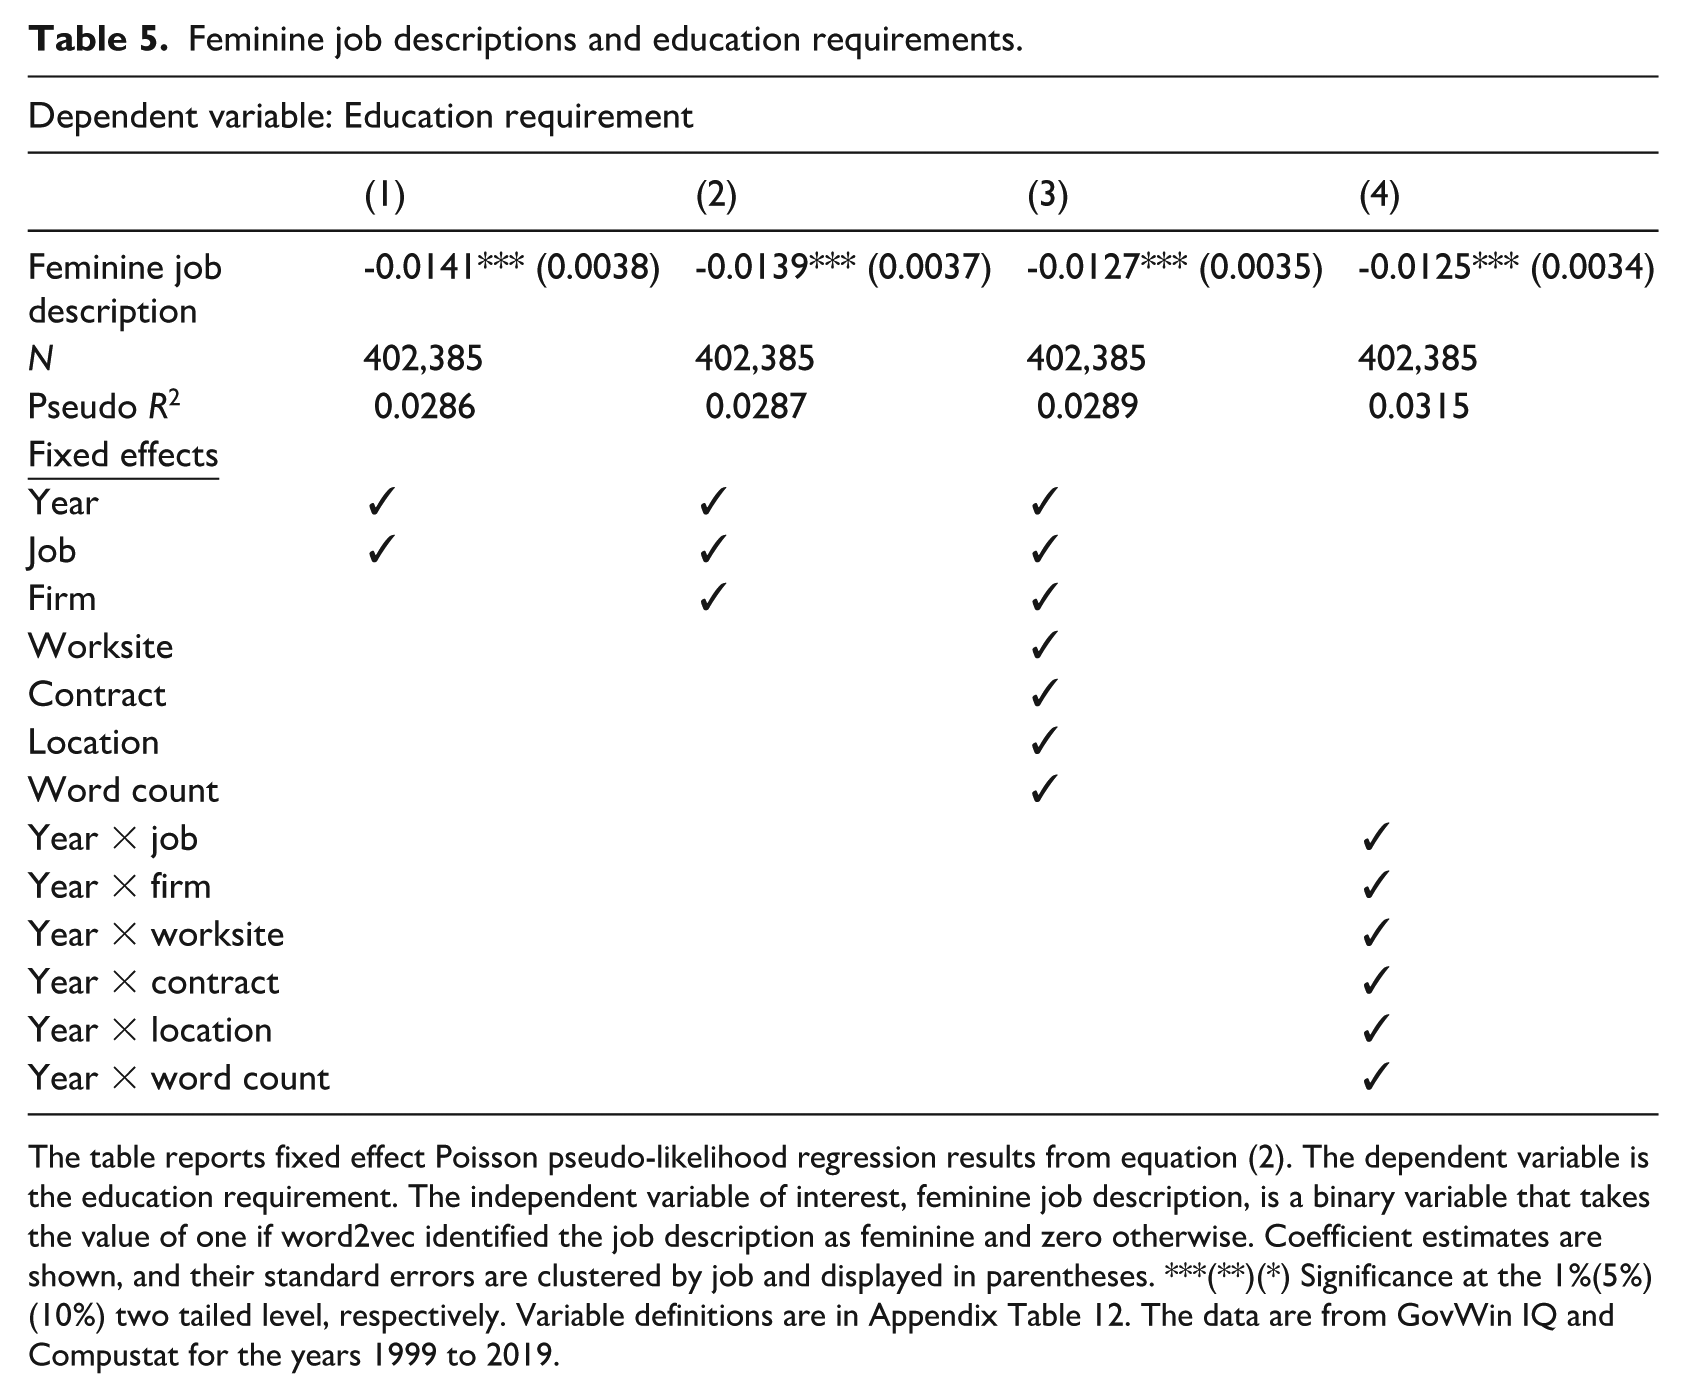
The table reports fixed effect Poisson pseudo-likelihood regression results from equation (2). The dependent variable is the education requirement. The independent variable of interest, feminine job description, is a binary variable that takes the value of one if word2vec identified the job description as feminine and zero otherwise. Coefficient estimates are shown, and their standard errors are clustered by job and displayed in parentheses. ***(**)(*) Significance at the 1%(5%)(10%) two tailed level, respectively. Variable definitions are in Appendix Table 12. The data are from GovWin IQ and Compustat for the years 1999 to 2019.
Column (4) in Table 6 reports that feminine job descriptions require 7.25% less years of work experience than masculine job descriptions, which on average equates to about half of a year. The differences in education and experience requirements between feminine and masculine job descriptions are all statistically significant at the 1% level. However, the economic magnitude is somewhat minimal suggesting that there could be other explanations as to why feminine job descriptions earn about $4 less per hour. Unfortunately, exploring potential alternative reasons is not possible with GovWin IQ data and we leave this as an open question to future researchers.
Feminine job descriptions and experience requirements.
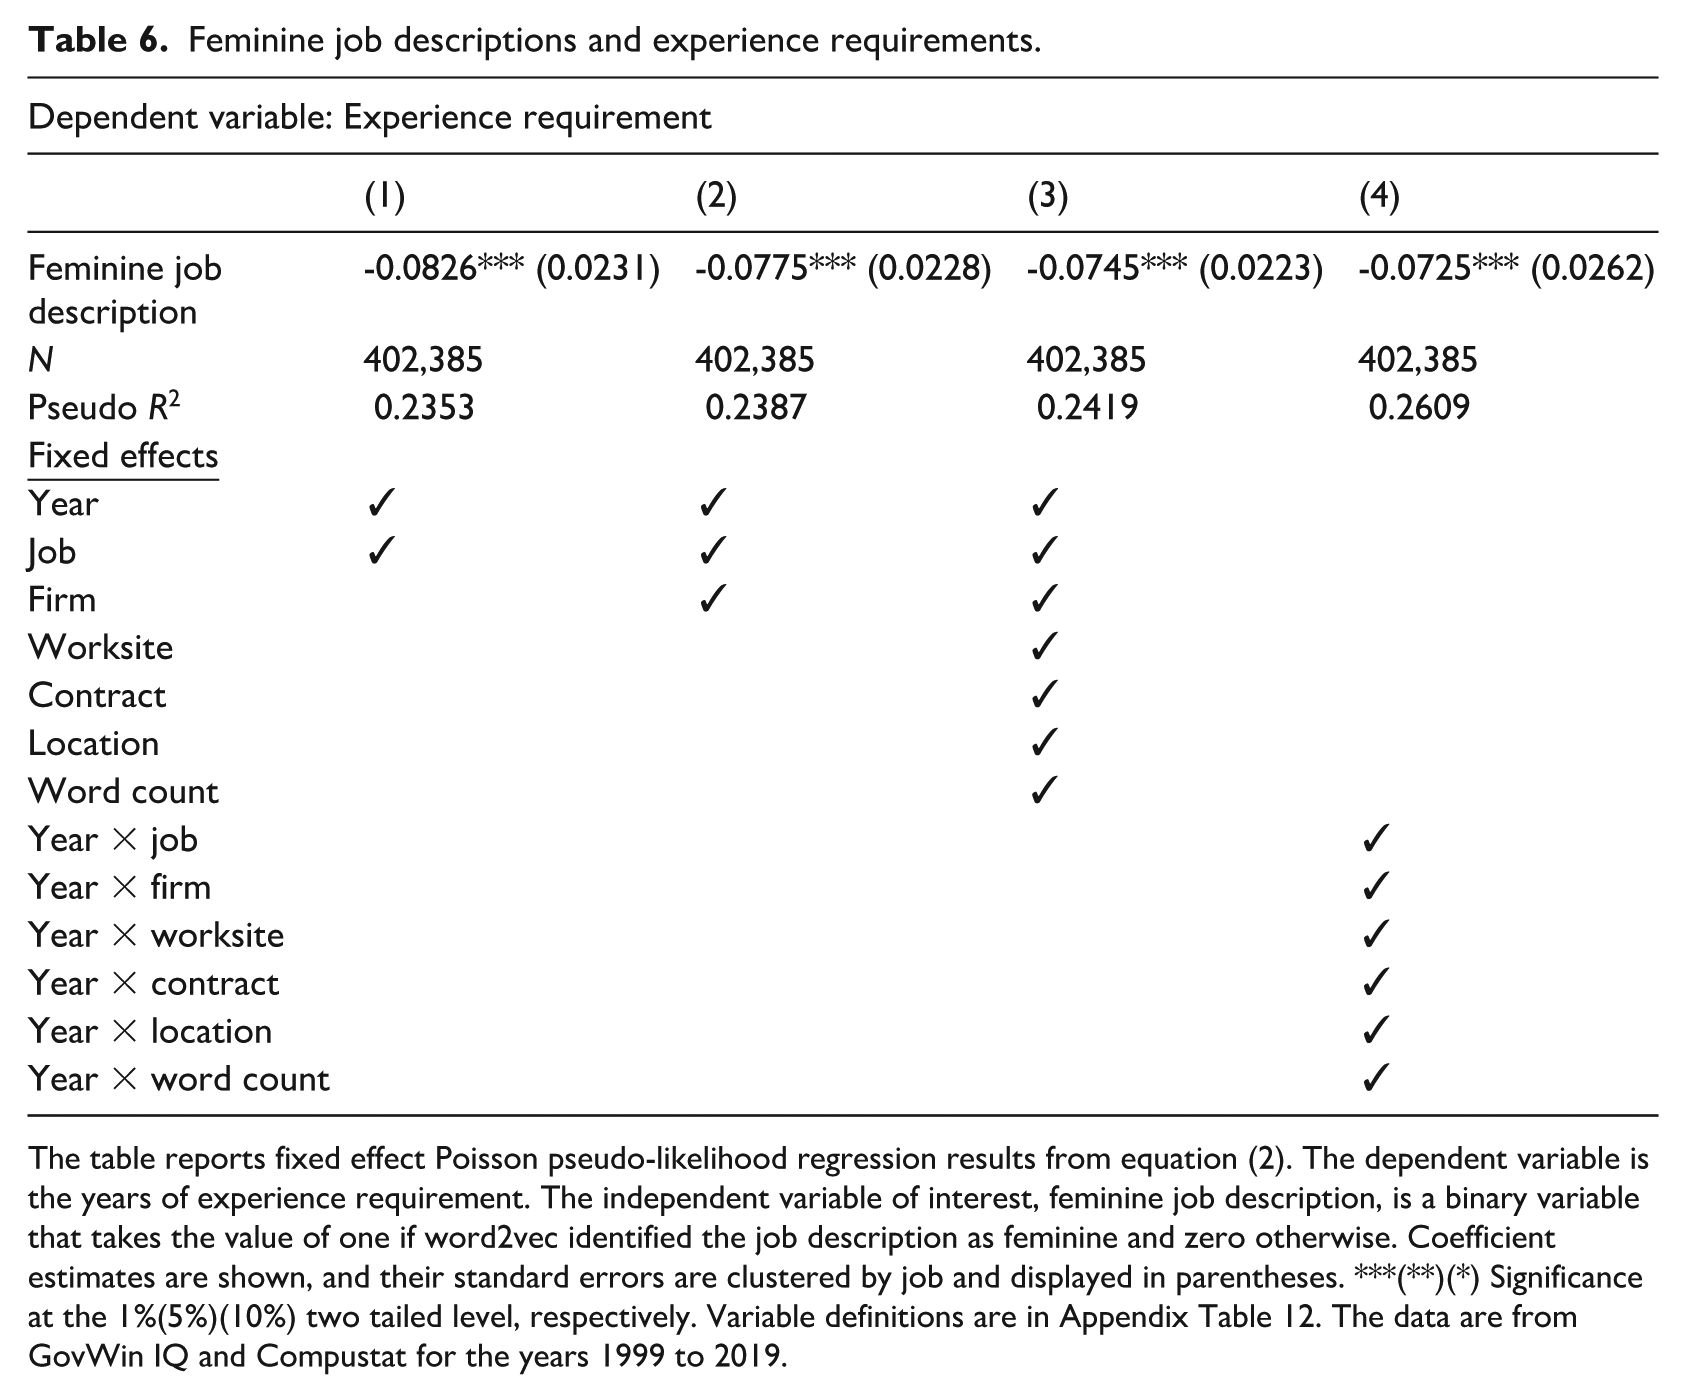
The table reports fixed effect Poisson pseudo-likelihood regression results from equation (2). The dependent variable is the years of experience requirement. The independent variable of interest, feminine job description, is a binary variable that takes the value of one if word2vec identified the job description as feminine and zero otherwise. Coefficient estimates are shown, and their standard errors are clustered by job and displayed in parentheses. ***(**)(*) Significance at the 1%(5%)(10%) two tailed level, respectively. Variable definitions are in Appendix Table 12. The data are from GovWin IQ and Compustat for the years 1999 to 2019.
3.3. Do job description wage gaps impact firm value?
We now turn to the real effects that gendered job description wage gaps might have on firm-level financial performance. Specifically, in this section, we aggregate feminine and masculine job description wage rates by year and firm to investigate the broader implications of wider wage gaps on corporate financial performance. Understanding how these gendered job description wage gaps impact firm outcomes allows for a comprehensive evaluation of how such differences affect a firm’s economic health and underscores the need for firms to consider how they word their job descriptions. By examining firm-level aggregate wage gaps from gendered job descriptions, it is possible to identify patterns and trends that individual job-level analyses might overlook, thereby offering a more holistic view of gender dynamics within firms over time.
Firms that exhibit significant wage difference between feminine and masculine job descriptions may face various negative outcomes. These could include lower employee morale, higher, turnover rates, and increased litigation risks, all of which can adversely impact financial performance. In addition, addressing these disparities could lead to improved organizational efficiency, enhanced reputation, and better talent acquisition and retention.
However, it could be the case that wider wage gaps from job descriptions could lead to positive outcomes. Firms may be paying higher wages for masculine job descriptions because these roles are perceived as more critical to firm productivity and profitability. This wage premium might attract more skilled or motivated employees to these key positions, enhancing overall firm performance.
To test these ideas, we implement the following firm-year level fixed effect panel regression model:

The dependent variable, yf,t + 1, is the financial outcome for firm f in year t + 1. The independent variable, Gapft, is the difference between the average wage rate for masculine job descriptions and the average wage rate for feminine job descriptions divided by the average wage rate for feminine job descriptions for firm f in year t. Fixed effects, δf and τt capture time-invariant unobservables by firm and year, respectively. 4 ϵft is the econometric error term.
Table 7 shows the results from equation 3 with Tobin’s Q as the dependent variable. A one standard deviation increase in the job description wage gap suggests a 0.1167 (i.e. 0.35 * 0.3334) increase in Tobin’s Q, or, about 6% on average. Since we have a small sample of firms (32 firms with non-missing Tobin’s Q and job description wage gap information), we let each column vary the calculation of standard errors. The effect is statistically significant, at the 5% and 1% levels across all different standard error calculations. Specifically, the most restrictive method in column (4) performs wild cluster bootstrap inference by firm. This method works well for models with heteroskedasticity, to the case of cluster-level correlation, and is a good inference tool when one or more of the cluster–robust variance estimator t-statistic consistency assumptions are violated (in this case the violation is the assumption that the number of clusters goes to infinity Cameron and Miller, 2015). The results in Table 7 suggest that as masculine job descriptions are paid more relative to feminine job description firm value increases.
Firm-level job description wage gaps and firm value.
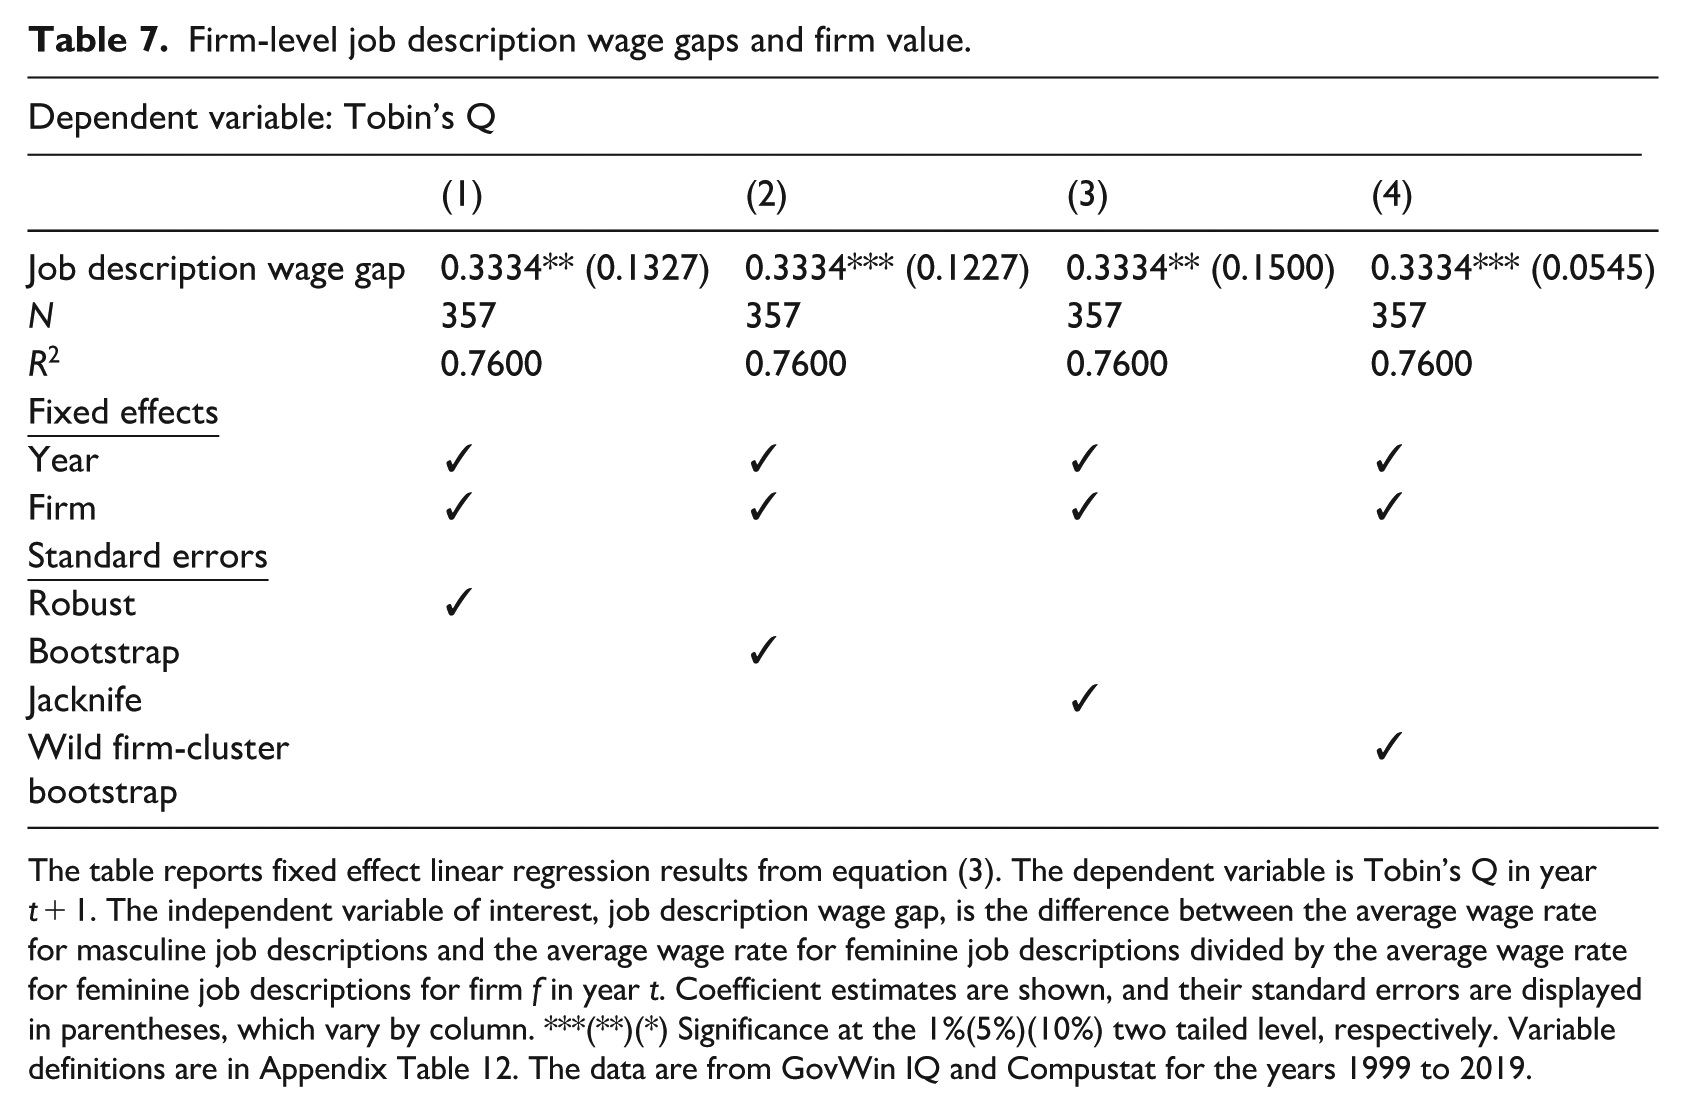
The table reports fixed effect linear regression results from equation (3). The dependent variable is Tobin’s Q in year t + 1. The independent variable of interest, job description wage gap, is the difference between the average wage rate for masculine job descriptions and the average wage rate for feminine job descriptions divided by the average wage rate for feminine job descriptions for firm f in year t. Coefficient estimates are shown, and their standard errors are displayed in parentheses, which vary by column. ***(**)(*) Significance at the 1%(5%)(10%) two tailed level, respectively. Variable definitions are in Appendix Table 12. The data are from GovWin IQ and Compustat for the years 1999 to 2019.
3.4. Why do job description wage gaps increase firm value?
Finally, we explore why increases in job description wage gaps are associated with increases in firm value. One potential reason is that in politically sensitive environments, firms with more “traditional” compensation structures (reflected in higher-wage gaps) may signal cultural alignment with prevailing norms, reducing perceived political risk. In addition, such wage structures may reflect clearer role differentiation or internal hierarchy, which could support more efficient organizational design and decision-making. Therefore, we might expect that larger gaps are positively associated with firm value, particularly in high political risk contexts. Given recent political debates over DEI initiatives that are especially salient in the context of rising political polarization, stakeholder responses to firm behavior, including pay practices, may be important to understanding why job description wage gaps increase firm value (Kim et al., 2013; Sheng et al., 2024).
To explore this dimension, we examine heterogeneity in the relationship between job description-based gender wage gaps and firm value across firms with differing exposure to political risk. We split the sample based on the median value of the firm-level political risk index developed by Hassan et al. (2019). This approach allows us to test whether the firm value effects of gendered wage structures vary depending on the salience of the political environment. If wage structures are interpreted through a political lens, we expect these, effects to be more pronounced among firms operating in politically sensitive contexts.
The results are in Table 8. For firms with below-median exposure to political risk, we find a negative association between the job description wage gap and firm value: a one-unit increase in the wage gap corresponds to a 0.09 decline in Tobin’s Q (p = 0.003). In contrast, for above-median political risk firms, the coefficient is positive and statistically significant: a one-unit increase in the wage gap is associated with a 0.83 increase in Tobin’s Q (p = 0.003). The difference in coefficients between the two groups is statistically significant at the one percent level. These findings indicate that the firm value implications of gendered pay structures are contingent on political context. In high political risk environments, firms with more “traditional” or male-skewed compensation structures appear to perform better, consistent with the idea that such structures may align with stakeholder expectations or help mitigate political uncertainty.
Firm-level job description wage gaps, firm value, and political risk.
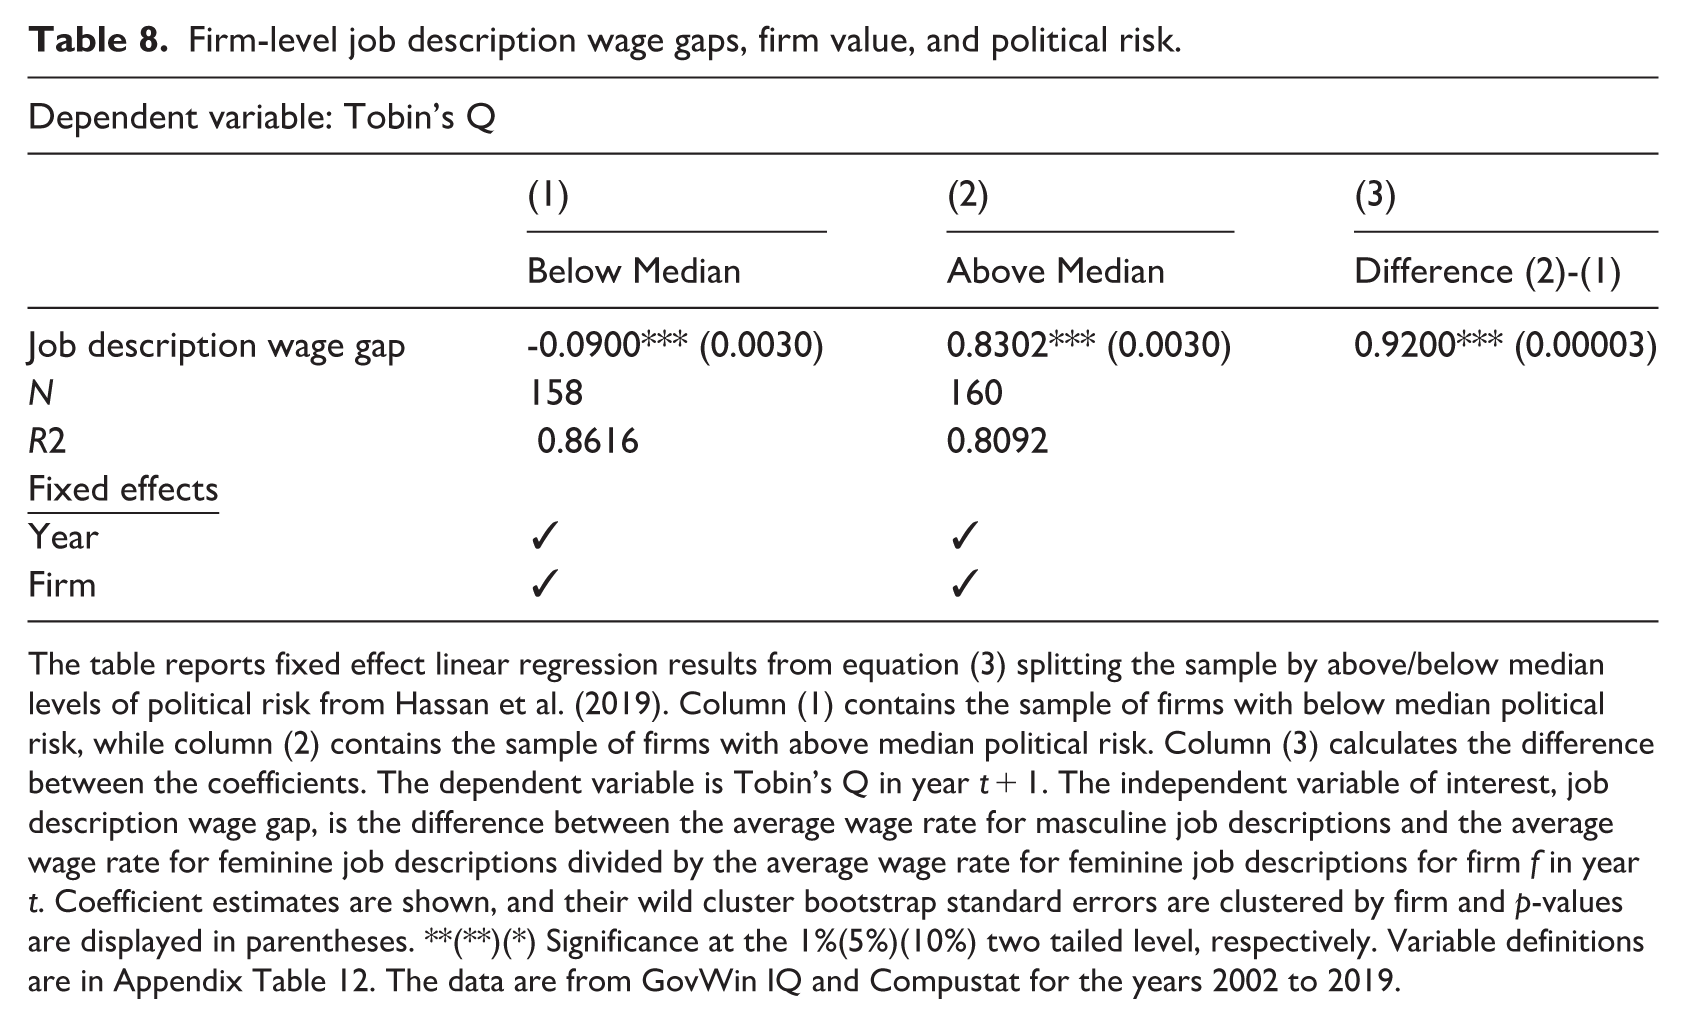
The table reports fixed effect linear regression results from equation (3) splitting the sample by above/below median levels of political risk from Hassan et al. (2019). Column (1) contains the sample of firms with below median political risk, while column (2) contains the sample of firms with above median political risk. Column (3) calculates the difference between the coefficients. The dependent variable is Tobin’s Q in year t + 1. The independent variable of interest, job description wage gap, is the difference between the average wage rate for masculine job descriptions and the average wage rate for feminine job descriptions divided by the average wage rate for feminine job descriptions for firm f in year t. Coefficient estimates are shown, and their wild cluster bootstrap standard errors are clustered by firm and p-values are displayed in parentheses. **(**)(*) Significance at the 1%(5%)(10%) two tailed level, respectively. Variable definitions are in Appendix Table 12. The data are from GovWin IQ and Compustat for the years 2002 to 2019.
Another potential reason is that higher wages for masculine job descriptions could attract more skilled and experienced employees. Firms willing to pay a premium for specific roles are likely to draw candidates with superior qualifications, thus enhancing the overall talent pool. This influx of highly skilled workers may lead to significant improvements in firm value, as these employees bring expertise and efficiency to their roles, driving better performance within the firm.
Moreover, the disparity in wages from gendered job descriptions may reflect a strategic allocation of resources where investment is channeled toward roles deemed critical for the company’s success. By prioritizing higher wages for certain positions, which are more correlated with masculine descriptions, firms can focus on optimizing key areas of their operations, leading to greater overall productivity. In addition, higher productivity among employees can generate higher output and efficiency, which translates to increased profitability and growth potential. Ultimately, the combined effects of attracting top talent, boosting, productivity, and strategically investing in crucial roles contribute to the observed increase in firm value associated with wider wage gaps in job descriptions.
Table 9 reports results from equation 3 with the dependent variable in columns (1), (2), (3), and (4) as manager, ROA, the natural log of employee efficiency, and investment, respectively. All columns perform wild cluster bootstrap inference by firm. The share of manager related jobs increases by 1.86% for a one standard deviation increase in wage gaps from job descriptions in column (1) and the effect is statistically significant at the 5% level. Column (2) suggests that a one standard deviation increase in the job description wage gap increases ROA by 0.0034, which is statistically significant at the 10% level. On average, that is around a 6% increase (i.e. 0.0034/0.06). Employee efficiency increases by 2.95% for a one standard deviation increase in wage gaps from job descriptions in column (3). This effect is statistically significant at the 5% level. Column (4) suggests that a one standard deviation increase in the job description wage gap increases investment by 0.0018, which is statistically significant at the 1% level.
Firm-level job description wage gaps, employee types, and firm productivity.
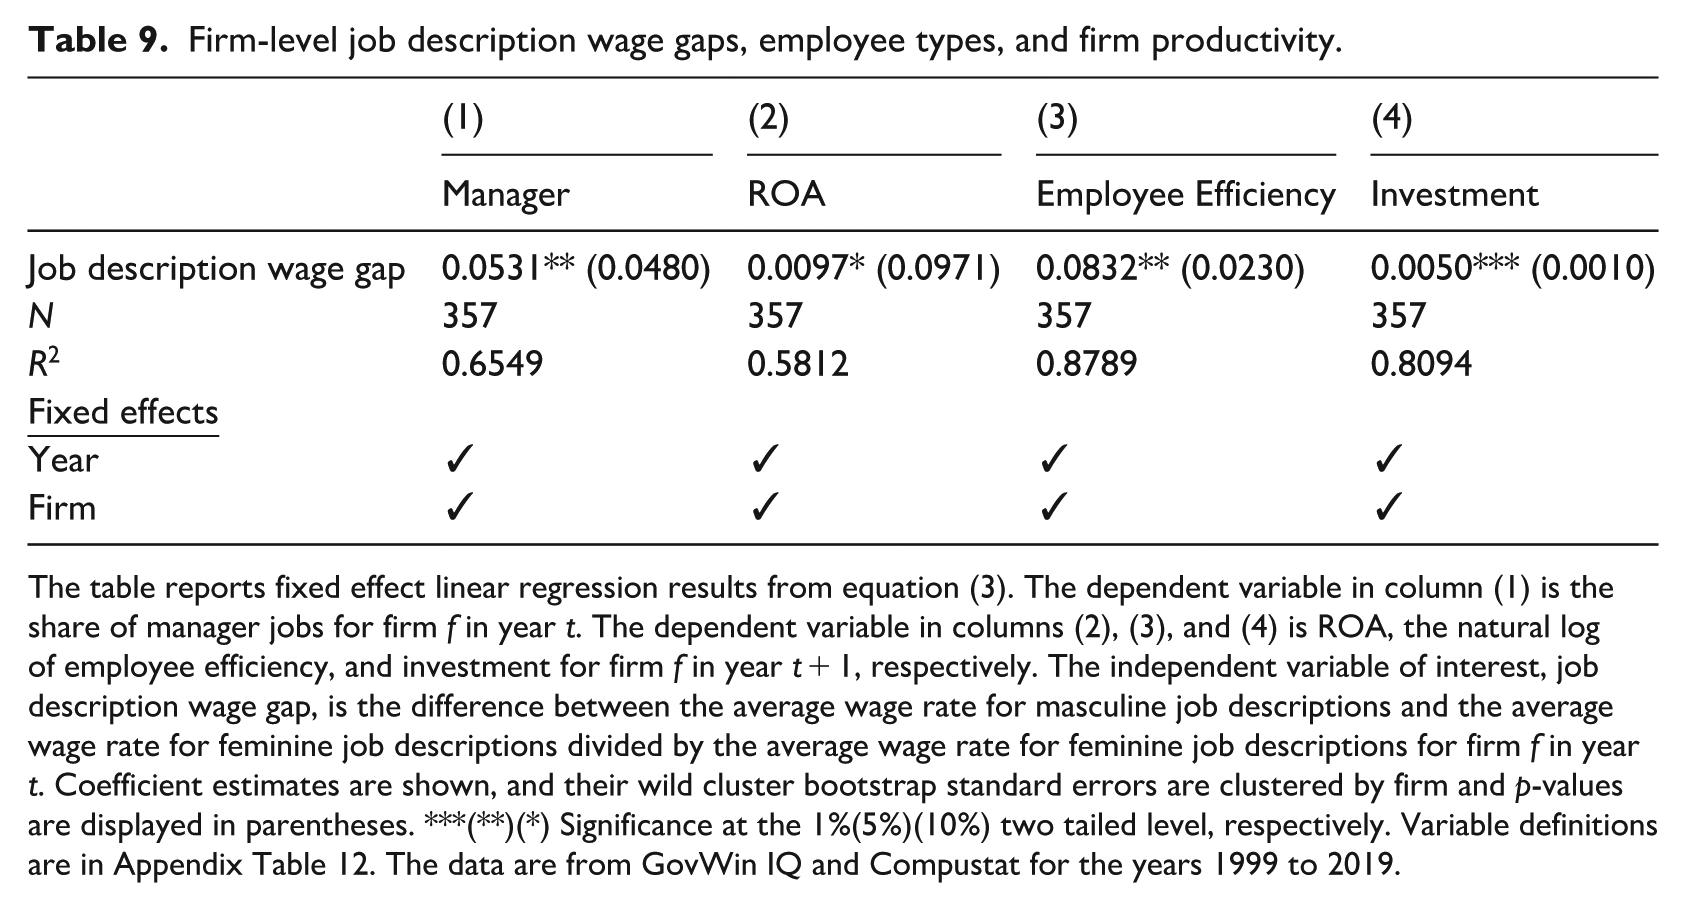
The table reports fixed effect linear regression results from equation (3). The dependent variable in column (1) is the share of manager jobs for firm f in year t. The dependent variable in columns (2), (3), and (4) is ROA, the natural log of employee efficiency, and investment for firm f in year t + 1, respectively. The independent variable of interest, job description wage gap, is the difference between the average wage rate for masculine job descriptions and the average wage rate for feminine job descriptions divided by the average wage rate for feminine job descriptions for firm f in year t. Coefficient estimates are shown, and their wild cluster bootstrap standard errors are clustered by firm and p-values are displayed in parentheses. ***(**)(*) Significance at the 1%(5%)(10%) two tailed level, respectively. Variable definitions are in Appendix Table 12. The data are from GovWin IQ and Compustat for the years 1999 to 2019.
The findings presented in Table 9 suggest that firms with higher-wage gaps attract a greater share of managers, indicating a draw of more skilled employees into key leadership roles. This influx of managerial talent likely enhances decision-making and strategic direction, driving better overall performance. In addition, the positive impact on ROA and employee efficiency suggests that these firms are more productive and operate more effectively. The substantial increase in employee efficiency, coupled with a significant boost in investment, could imply that the masculine job description premium attracts employees that foster an environment conducive to growth. Collectively, these factors—political environments, attracting managerial talent, improving productivity, and increasing investment—help explain why firms with wider job description wage gaps experience a rise in firm value, reflecting a potentially strategic advantage gained from a masculine wage premium.
3.5. Missing data on job descriptions
A common problem in empirical corporate finance research, especially work regarding wages, is that of selected samples (i.e. Chemmanur et al., 2013). As we mention in Section 2, job description data is only available for a small selection of firms in GovWin IQ that are within the search parameters we set for data collection. This creates a potential sample selection bias in two ways: (1) selecting on the S&P 500 excludes other potentially similar firms and (2) firms selectively decide whether to bid for US federal contracts. To control for this potential sample selection bias, we adopt a Heckman (1979) two-step analysis in this section.
In the first step, we estimate a logit model of whether or not a firm has information in GovWin IQ. The dependent variable is one if the data on job descriptions is non-missing for a firm in a year, and zero otherwise. The independent variables include several time-varying observable characteristics and year and industry fixed effects. In the second step, we examine the effect of job description wage gaps on firm outcomes. The inverse Mills ratio derived from the selection model is included in the second step as a regressor, and all other model specification are the same as equation (3).
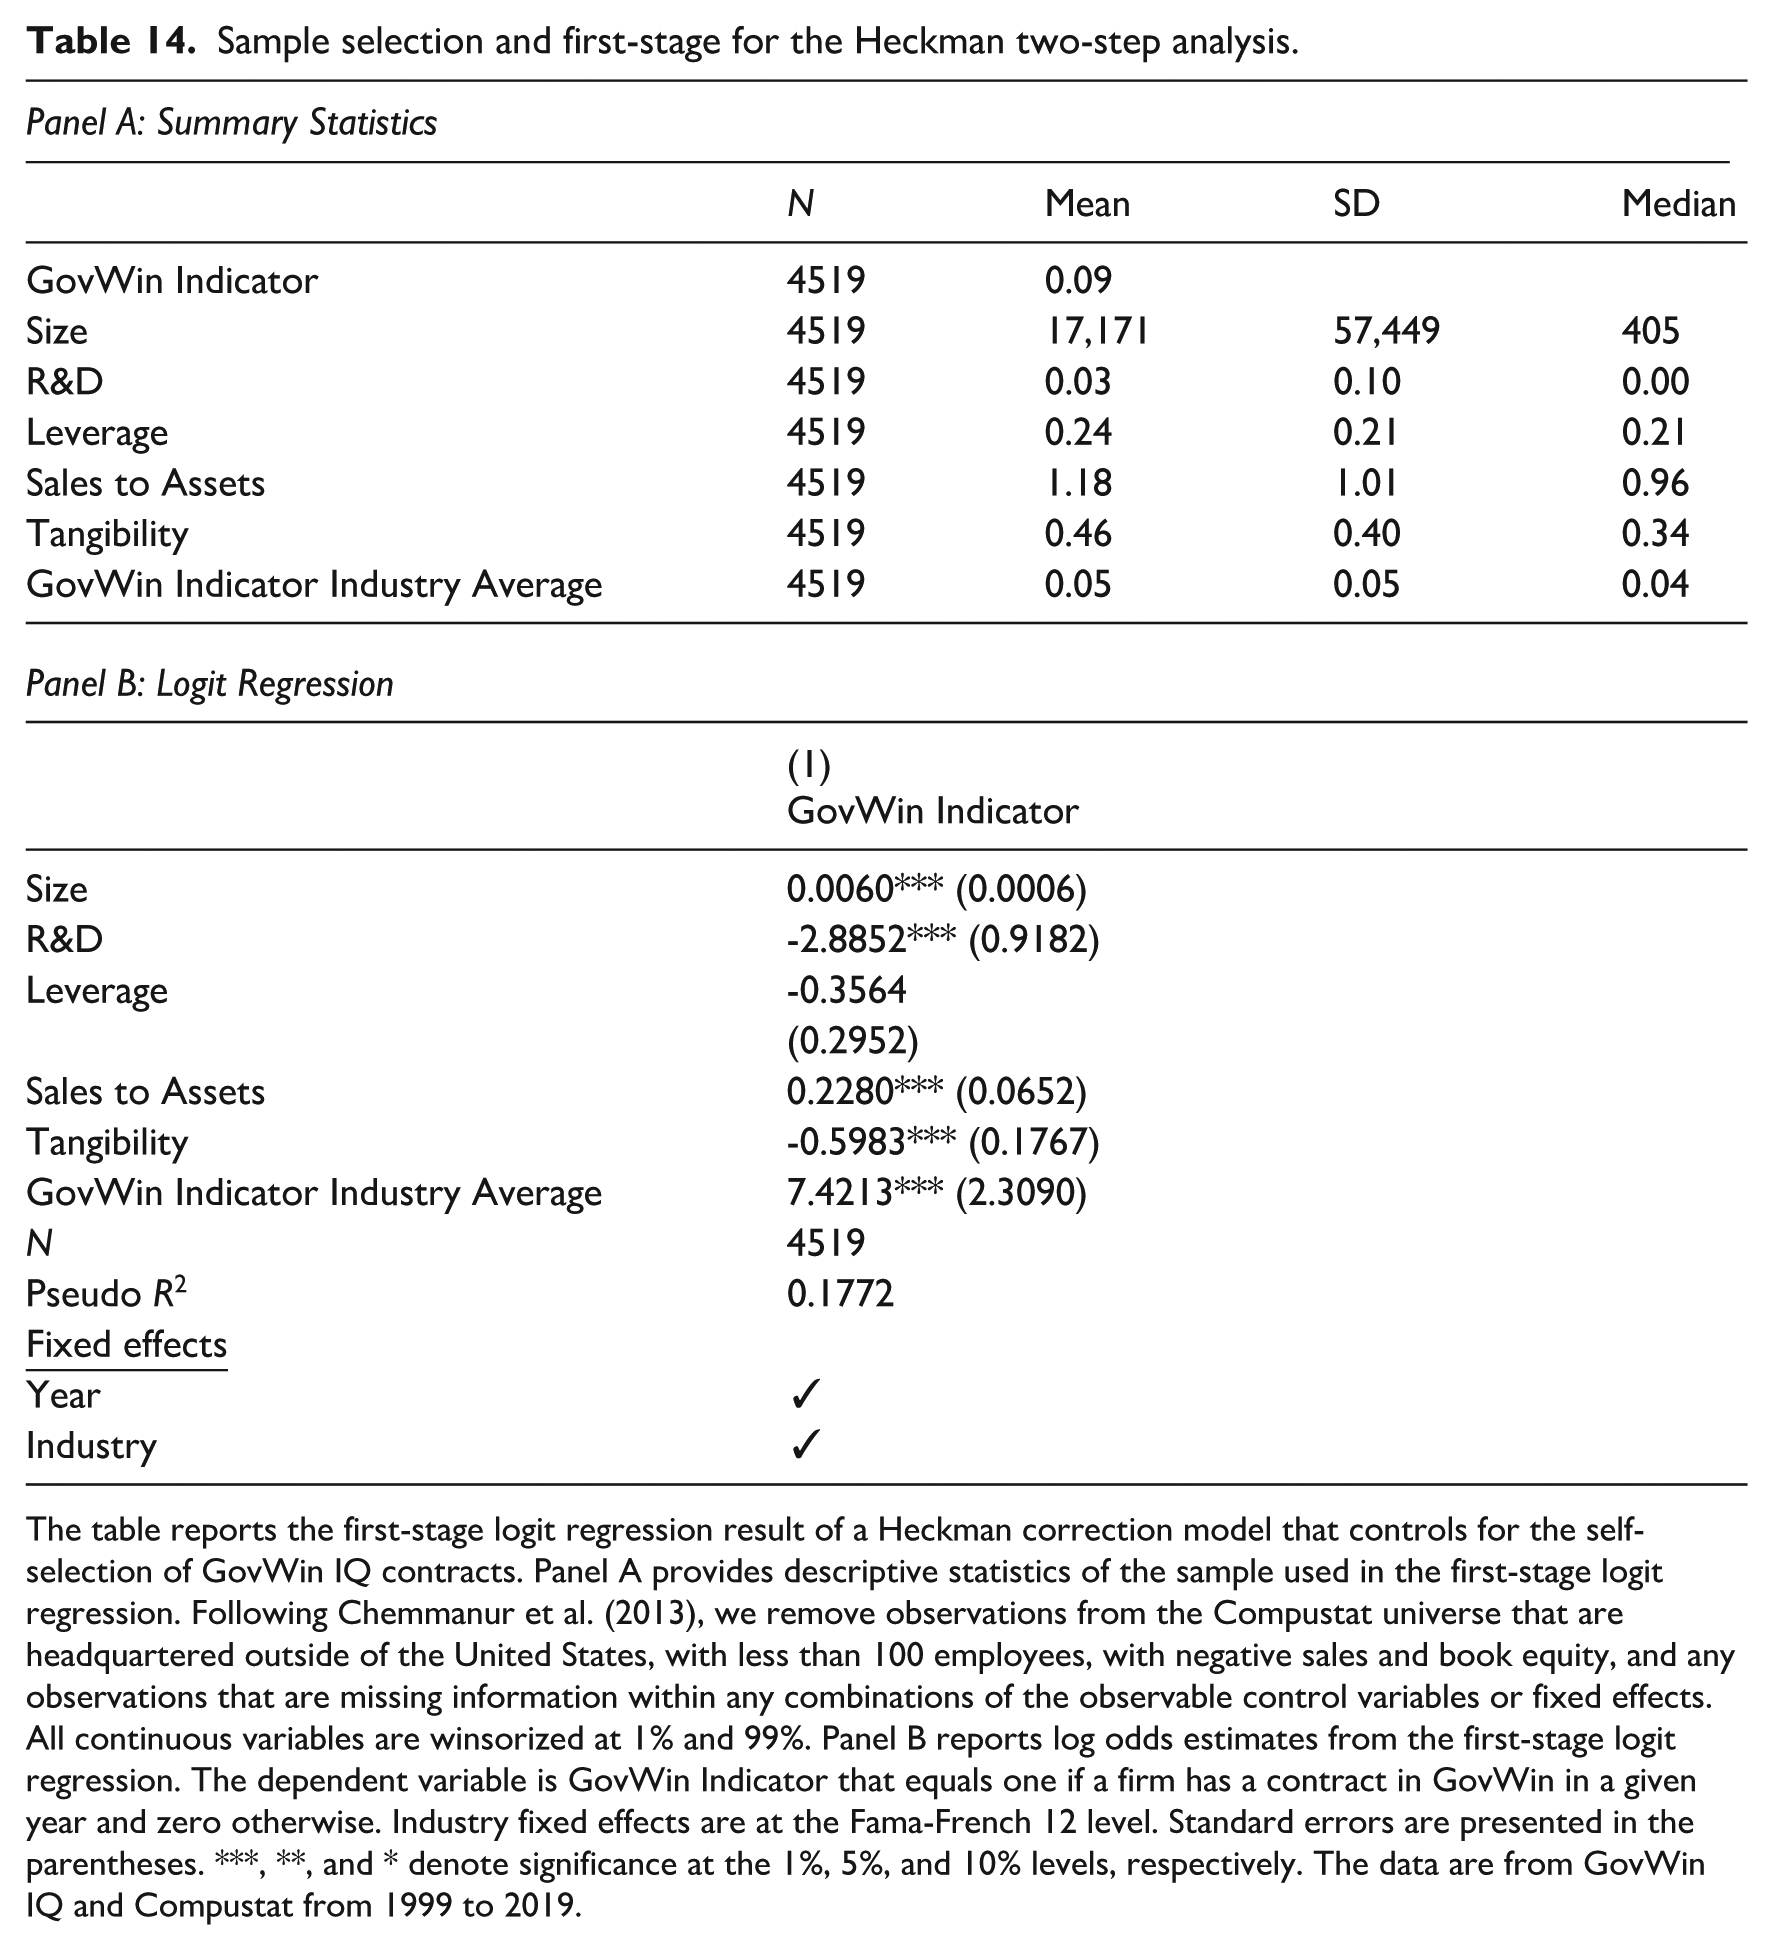
The descriptive statistics, estimated log odds coefficients, and standard errors for the first stage are in Appendix Table 14. The logit regression suggests that larger firms with higher sales and more industry activity in the US federal contracting space are more likely to have information on job descriptions. Conversely, the results suggest that firms with more R&D and property, plant, and equipment expenditures are less likely to have information on job descriptions. Leverage has no statistically significant effect on the likelihood of a firm to have GovWin information.
Table 10 reports the results from the second step that controls for potential sample selection bias by including the inverse Mills ratio as a regressor. The impact of job description wage gaps remains qualitatively similar across all firm outcomes. The only firm outcome to become statistically insignificant is ROA. The remaining firm outcomes are all statistically significant at the 10% level or higher. The Heckman two-step procedure produces consistent estimation of parameters. The coefficient on the inverse Mills ratio is statistically distinguishable from zero in columns (1)–(4). In column (5), the ratio is negatively signed and statistically significant at the 10% level suggesting that the unobserved factors that make having data on job descriptions in this sample tend to be associated with lower average investment. Importantly, the results in Table 10 suggest that the results are robust after controlling for potential sample selection bias.
Heckman two-step analysis.
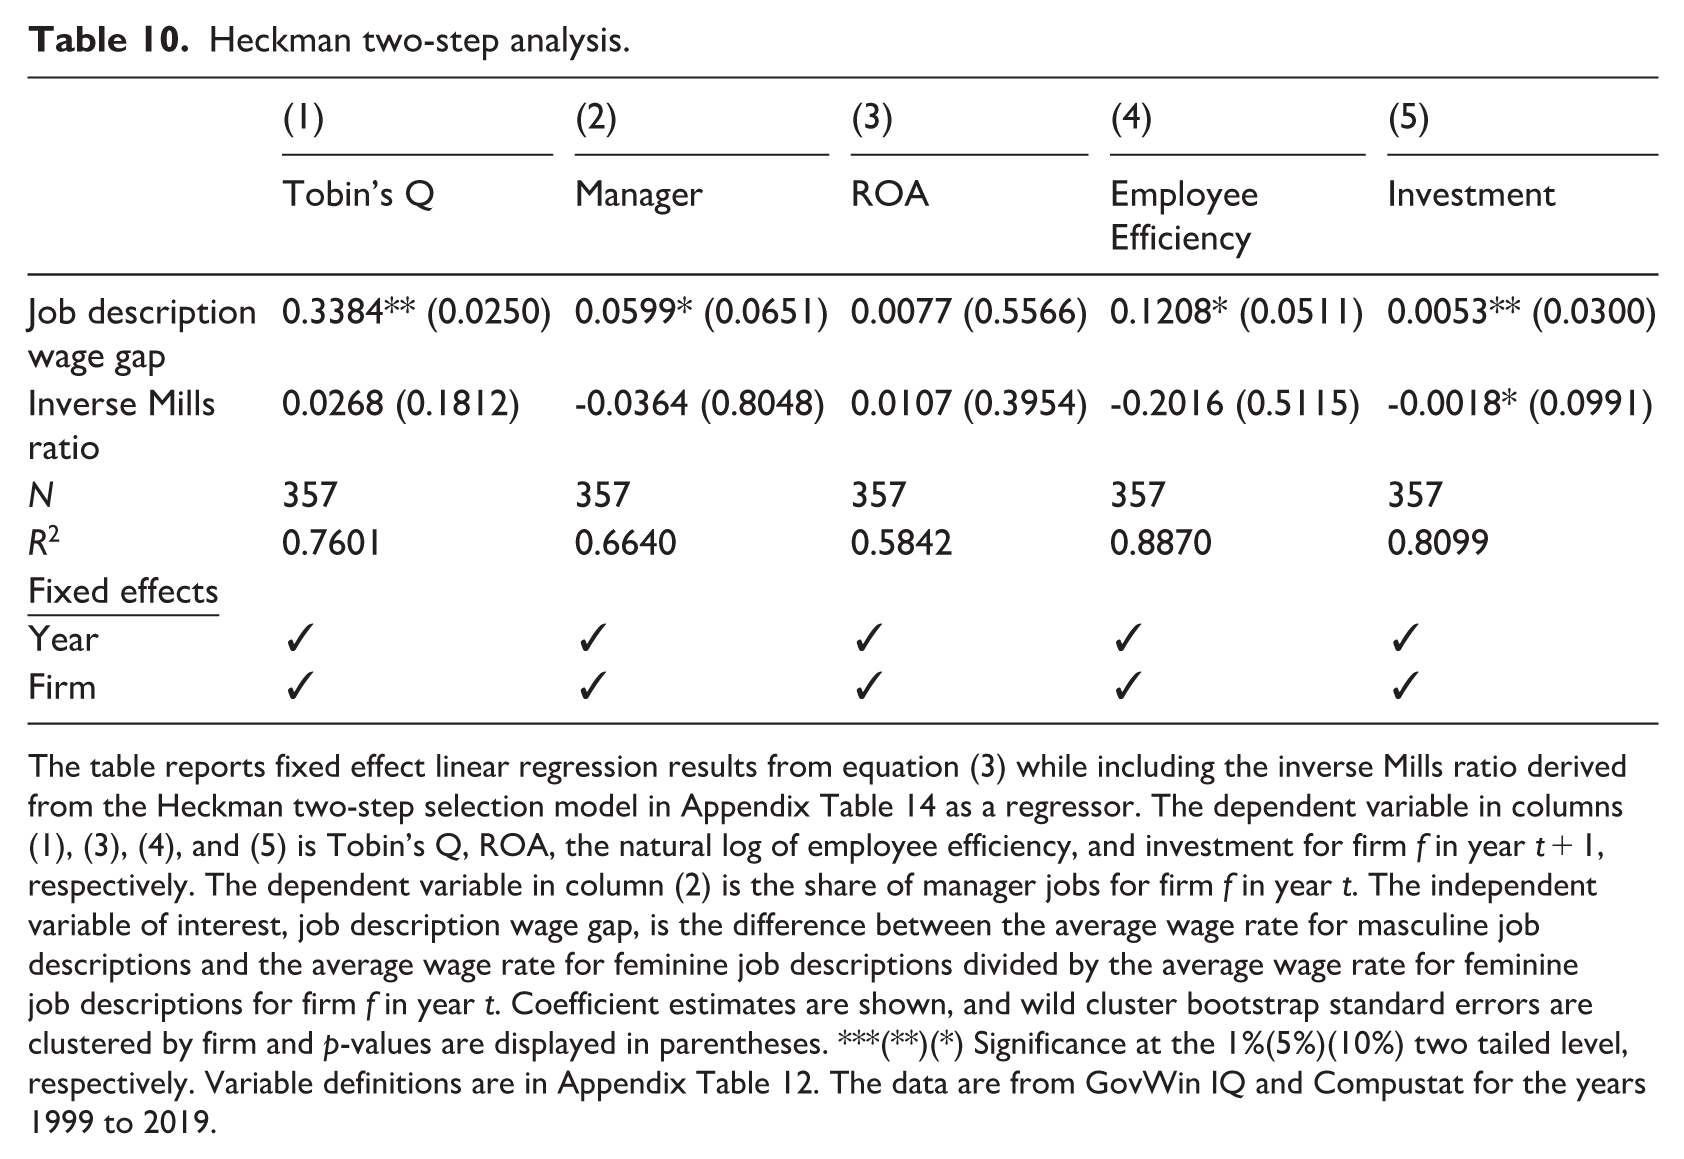
The table reports fixed effect linear regression results from equation (3) while including the inverse Mills ratio derived from the Heckman two-step selection model in Appendix Table 14 as a regressor. The dependent variable in columns (1), (3), (4), and (5) is Tobin’s Q, ROA, the natural log of employee efficiency, and investment for firm f in year t + 1, respectively. The dependent variable in column (2) is the share of manager jobs for firm f in year t. The independent variable of interest, job description wage gap, is the difference between the average wage rate for masculine job descriptions and the average wage rate for feminine job descriptions divided by the average wage rate for feminine job descriptions for firm f in year t. Coefficient estimates are shown, and wild cluster bootstrap standard errors are clustered by firm and p-values are displayed in parentheses. ***(**)(*) Significance at the 1%(5%)(10%) two tailed level, respectively. Variable definitions are in Appendix Table 12. The data are from GovWin IQ and Compustat for the years 1999 to 2019.
3.6. Addressing endogeneity
To address concerns about the potential endogeneity of the gender wage gap, we exploit the introduction of Executive Order 13672 as a plausibly exogenous policy shock. This order was signed by US President Barack Obama on 21 July 2014 (and went into effect in 2015). It amended two earlier executive orders to extend protection against discrimination in hiring and employment to additional classes. The EO prohibited discrimination in the civilian federal workforce on the basis of gender identity and in hiring by federal contractors on the basis of both sexual orientation and gender identity. Although the executive order does not directly regulate pay practices, it alters the compliance environment for federal contractors, which may affect internal personnel policies, including compensation structures. Importantly, this policy change applies broadly to all federal contractors, providing a common treatment timing that facilitates a difference-in-differences (DiD) research design.
We construct a DiD specification that compares outcomes between firms with relatively high and low pre-policy gender wage gaps. Specifically, we calculate the average gender wage gap for each firm during the two years preceding the policy (2012–2014), and define treatment intensity based on whether a firm’s pre-policy gap falls above the median of the sample distribution. This approach rests on the assumption that firms with larger baseline disparities faced greater compliance risk following the policy shift and were therefore more likely to respond to the policy. In contrast, firms with already narrow gaps may have required fewer internal adjustments. By comparing the post-policy trajectories of firms with initially high and low wage gaps, we identify differential effects that are plausibly driven by the policy. We then estimate the interaction between this high-gap indicator and a post-policy implementation dummy, capturing differential post-policy outcomes among firms with initially larger gender disparities.
Our DiD model takes the following form:

The dependent variable, yf,t+ 1, is the financial outcome for firm f in year t + 1. The independent variable, HighGapf, is a binary indicator variable that takes the value of one if the gender wage gap for a firm is above median across 2012–2014 and zero otherwise. Postt is a binary indicator variable that takes the value of one after 2014 and zero otherwise. Fixed effects, δf and τt capture time-invariant unobservables by firm and year, respectively, and subsume the HighGapf and Postt indicators. We use robust standard errors. This approach allows us to isolate policy-induced changes in firm outcomes that are plausibly related to regulatory exposure, rather than endogenous firm characteristics. By focusing on within-firm variation over time and comparing firms with differing initial wage gaps, the design mitigates concerns that unobserved time-invariant firm characteristics drive the observed relationship between the gender wage gap and our outcome variables.
We find evidence that the introduction of Executive Order 13672 is associated with differential post-policy outcomes for firms with initially larger gender wage gaps. Panel A of Table 11 reports results from equation (4). The coefficient on the interaction term is negative across all columns. In column (1), we find that firms with higher baseline gender wage gaps experienced a decline in Tobin’s Q relative to other firms following the policy, with an estimated effect of −0.534 which is statistically significant at the 5% level. Panel B reports placebo estimates based on pre-policy years. None of the year indicators for 2012 through 2014 are statistically significant across any specification. These findings support the parallel trends assumption and strengthen the interpretation that the observed post-2015 changes are attributable to the policy shock rather than pre-existing firm-specific trends.
Difference-in-differences analysis.
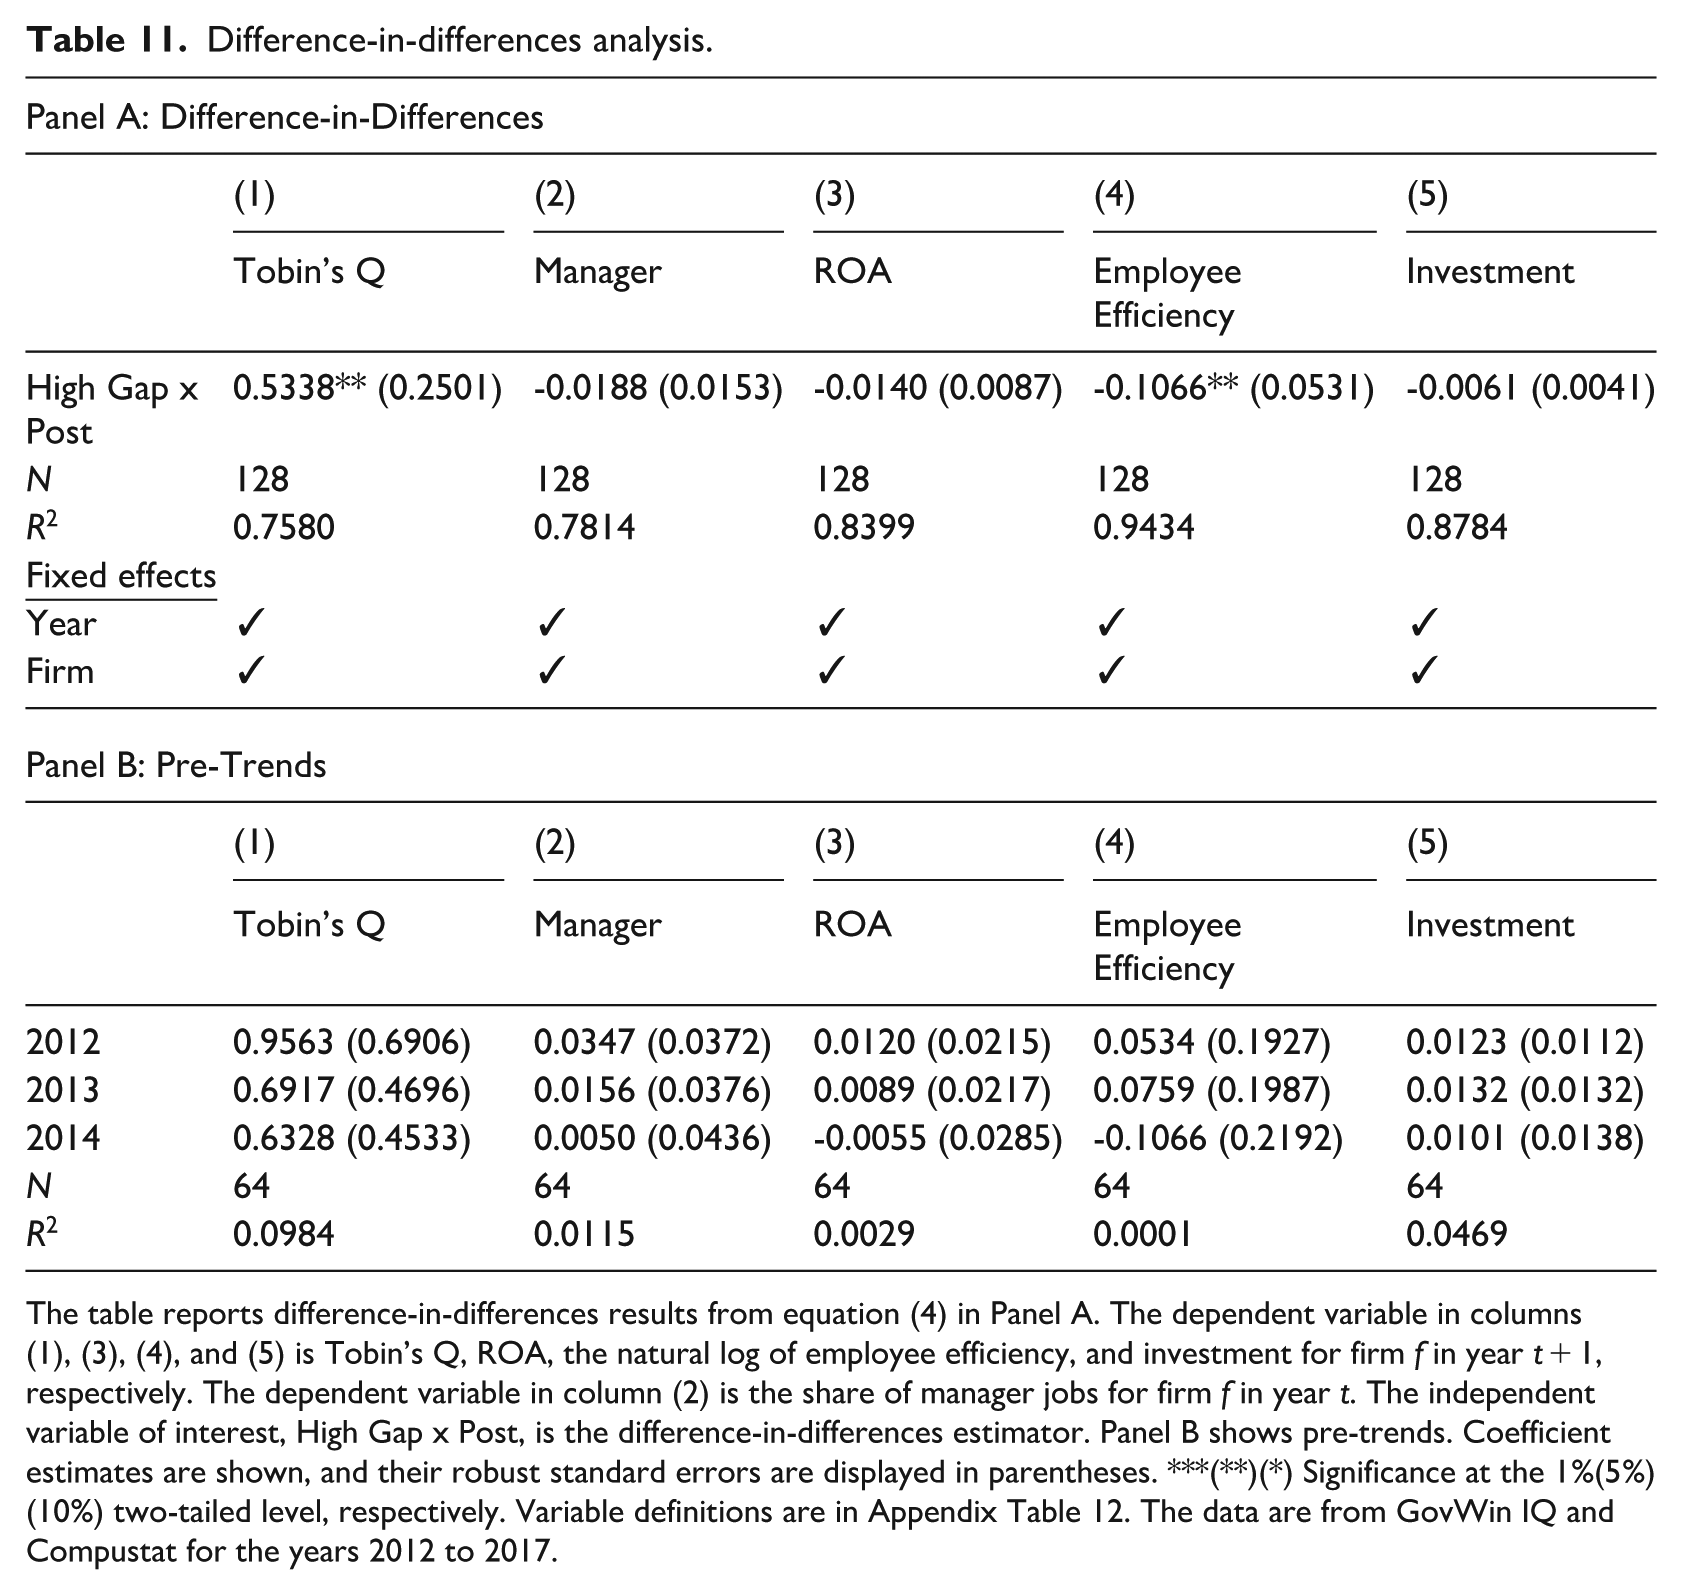
The table reports difference-in-differences results from equation (4) in Panel A. The dependent variable in columns (1), (3), (4), and (5) is Tobin’s Q, ROA, the natural log of employee efficiency, and investment for firm f in year t + 1, respectively. The dependent variable in column (2) is the share of manager jobs for firm f in year t. The independent variable of interest, High Gap x Post, is the difference-in-differences estimator. Panel B shows pre-trends. Coefficient estimates are shown, and their robust standard errors are displayed in parentheses. ***(**)(*) Significance at the 1%(5%)(10%) two-tailed level, respectively. Variable definitions are in Appendix Table 12. The data are from GovWin IQ and Compustat for the years 2012 to 2017.
Although the DiD results show a negative effect on Tobin’s Q for firms with initially high gender wage gaps, this finding is consistent with our baseline results, which reveal a positive association between the wage gap and firm value. The executive order likely pressured high-gap firms to reduce gender-based pay disparities. If a larger wage gap is positively correlated with firm performance due to factors such as labor cost structures or productivity sorting, then narrowing that gap may reduce firm value. The DiD estimates thus capture the cost of adjusting compensation practices in response to the policy, reinforcing rather than contradicting the baseline results.
4. Conclusion
In this article, we study wage gaps arising from the words in job descriptions. We manually collect US job-level wage data from GovWin IQ and then apply a natural language processing technique (word2vec) on these job descriptions to identify them as feminine or masculine. We find that stereotypically feminine job descriptions earn 4.80% less than masculine job descriptions, or more than an entire year’s pay over the course of a 35-year career. In addition, we find that as firm-level job description wage gaps increase—where masculine job descriptions earn more than feminine ones—there is an associated increase in firm value. We explain this finding by showing that this masculine wage premium is correlated with increases in the share of manager-related jobs, thereby attracting more skilled employees, which in turn increase firm and employee productivity and firm investment. We contribute to the literature by providing the first empirical evidence on how and why the genderness of job descriptions impact wages in the United States and the firm-level financial implications of those gaps.
There are several limitations to this study. First is the inability to link job descriptions to employee records. This prevents an exact estimation of the portion of the gendered job description wage gap that is attributable to differences in actual observable employee gender. Second, a limitation of the data is that it only contains the winners of these US federal contracts and does not show information about other firms that bid for, and lost, the contract. Third, due to the sheer number of US federal contracts, we restrict the search sample to S&P 500 firms for feasibility. Since the site is a paid service, they are incredibly restrictive on scraping, both from a legal and web design perspective. Unfortunately, the restriction results in only 42 publicly traded firms, which is an admitted limitation to the generalizability of the findings. Fourth, a technicality of US federal contracts is that the wage rate is not the true wage that an employee receives for that job. It is often a percentage of the rate, and the firm keeps the remaining percentage. Thus, it is highly unlikely that employees in the sample actually receive the full $85. Finally, job descriptions are most likely an endogenous choice by the firm, so the findings only admit correlative evidence between wages and gendered job descriptions.
Another limitation of the study is that it cannot explore the long-term consequences of maintaining such disparities. The results suggest that wage gaps may correlate with short-run gains in firm performance, particularly in politically sensitive environments where traditional compensation structures align with stakeholder expectations. However, we acknowledge that this framing does not capture potential long-term risks, such as reduced employee morale, talent attrition, or regulatory backlash. Future research should explore whether the benefits we observe are sustainable or whether they diminish over time as stakeholder preferences evolve.
Despite these limitations, the implications for employees, firms, and policymakers are meaningful. For employees, our results highlight how the wording of job descriptions can shape compensation outcomes, informing career choices and salary negotiations. For firms, understanding the relationship between job description language and wage structures offers an opportunity to evaluate whether compensation practices unintentionally reflect or reinforce gender bias. Finally, our findings underscore the importance of transparency in job descriptions, suggesting a role for policymakers in promoting standards that reduce bias and support equity in compensation practices.
Theoretical and/or practical contributions of the manuscript
Theoretical contributions
This article introduces a novel within-firm, job-level measure of gendered language in job descriptions and links it to wage outcomes and firm performance. It contributes to the literature on gender inequality, organizational economics, and corporate strategy by providing empirical evidence that job description language shapes compensation structures and is systematically associated with firm value. The findings also extend work on political economy by showing that the relationship between wage gaps and firm performance is stronger in politically sensitive environments.
Practical contributions
The results highlight the tangible financial implications of gendered job language for firms, suggesting that compensation structures aligned with traditional norms may signal cultural stability in politically uncertain contexts. For policymakers, the study underscores the need to monitor subtle forms of bias in job descriptions. For firms, it offers insights into how language and pay practices influence workforce composition, productivity, and market valuation. For employees, it provides transparency into how language may affect compensation and career trajectories.
Footnotes
Appendix
Sample selection and first-stage for the Heckman two-step analysis.
| Panel A: Summary Statistics | ||||
|---|---|---|---|---|
| N | Mean | SD | Median | |
| GovWin Indicator | 4519 | 0.09 | ||
| Size | 4519 | 17,171 | 57,449 | 405 |
| R&D | 4519 | 0.03 | 0.10 | 0.00 |
| Leverage | 4519 | 0.24 | 0.21 | 0.21 |
| Sales to Assets | 4519 | 1.18 | 1.01 | 0.96 |
| Tangibility | 4519 | 0.46 | 0.40 | 0.34 |
| GovWin Indicator Industry Average | 4519 | 0.05 | 0.05 | 0.04 |
| Panel B: Logit Regression | ||||
| (1) |
||||
| Size | 0.0060***
|
|||
| R&D | -2.8852***
|
|||
| Leverage | -0.3564 | |||
| (0.2952) | ||||
| Sales to Assets | 0.2280***
|
|||
| Tangibility | -0.5983***
|
|||
| GovWin Indicator Industry Average | 7.4213***
|
|||
| N | 4519 | |||
| Pseudo R2 | 0.1772 | |||
|
|
||||
| Year | ✓ | |||
| Industry | ✓ | |||
The table reports the first-stage logit regression result of a Heckman correction model that controls for the self-selection of GovWin IQ contracts. Panel A provides descriptive statistics of the sample used in the first-stage logit regression. Following Chemmanur et al. (2013), we remove observations from the Compustat universe that are headquartered outside of the United States, with less than 100 employees, with negative sales and book equity, and any observations that are missing information within any combinations of the observable control variables or fixed effects. All continuous variables are winsorized at 1% and 99%. Panel B reports log odds estimates from the first-stage logit regression. The dependent variable is GovWin Indicator that equals one if a firm has a contract in GovWin in a given year and zero otherwise. Industry fixed effects are at the Fama-French 12 level. Standard errors are presented in the parentheses. ***, **, and * denote significance at the 1%, 5%, and 10% levels, respectively. The data are from GovWin IQ and Compustat from 1999 to 2019.
Acknowledgements
I thank Aaron Burt, Patrick Button, Yingmei Cheng, Danielle Gaucher, Marina Gertsberg, Sadok El Ghoul, Isaac Hacamo, Gerard Hoberg, Peter Kuhn, Erik Mayer, Joni Hersch, Holger Mueller, Brian Roseman, Jason Sandvik, Luke Stein, Kailing Shen, and James Weston for useful feedback, along with participants in The Australian National University Research School of Economics 2024 seminar series and the 2025 Southwestern Finance Association Conference.
Final transcript accepted on 28 July 2025 by Tom Smith (AE Finance).
Ethical approval and informed consent statements
Ethical approval and informed consent were not required.
Data availability statement
Data will be shared upon reasonable request.
Funding
The author(s) received no financial support for the research, authorship, and/or publication of this article.