
Abstract
Using a sample of ASX 500 firms over the 2005–2019 period, we document substantial variation in the use of performance targets within Chief Executive Officer (CEO) compensation contracts, contrasting firms advised by Big 4 accounting entities with other compensation consulting firms. Firms that engage a Big 4 accounting firm are more likely to implement explicit non-financial performance targets within the short-term incentive plan, effectively minimising opportunities for post hoc justification. They also favour the incorporation of relative performance targets that mitigate pay for luck in the long-term incentive plan. Firms that engage a Big 4 accounting firm demonstrate a similar pay-for-performance relation to firms that do not engage a compensation consultant, while firms engaging non-Big 4 consultants exhibit a lower pay-for-performance relation. Our findings suggest that Big 4 accounting firms provide compensation recommendations that encourage the alignment of interests between managers and shareholders.
Keywords
1. Introduction
Concerns regarding the alignment between Chief Executive Officer (CEO) compensation and firm performance, as well as the influence of compensation consultants in shaping this relationship, have been increasingly highlighted in the literature (Karabell, 2018; Mishel and Wolfe, 2019; Murphy and Sandino, 2015). 1 While existing research primarily focuses on the magnitude and/or structure of CEO pay, the selection of performance targets in CEO compensation contracts may also contribute to misaligned or excess pay, particularly when those targets are subject to significant discretion (Abernethy et al., 2015; Neely et al., 1997; Nunn 2019). Our study provides evidence on the types of performance targets used in the short- and long-term components of CEO compensation contracts and examines the variance between firms that receive advice from a compensation consultant and those that do not, as well as contrasting firms receiving advice from one of the Big 4 accounting firms versus other compensation consultants.
This study is motivated by the tension between two theoretical frameworks, offering contrasting explanations for why firms engage compensation consultants. Efficient contracting theory posits that firms engage compensation consultants to optimise the structures of compensation packages and to set compensation levels conducive to attracting and retaining high-quality CEOs (Conyon et al., 2009, 2019; Murphy and Sandino, 2010; Voulgaris et al., 2010). In contrast, managerial power theory suggests that firms engage compensation consultants to camouflage or facilitate rent extraction, resulting in sub-optimal CEO compensation (Bebchuk and Fried, 2003; Waxman, 2007). Results in the extant literature remain mixed. For example, evidence examining consultant switches surrounding disclosure changes in the United States provides nuanced results (Chu et al., 2018), suggesting that not all compensation consultants behave the same and that not all multi-service consultants (specialists) are conflicted (aligned with shareholders). This perspective is mirrored in the work by Cai et al. (2016), who found that compensation consultants can have distinct styles with some facilitating rent extraction and others optimal contracting. Our study contributes to this debate by providing insights into the link between compensation consultants and performance targets used in CEO compensation contracts.
We conducted this study in the Australian setting as it allows us to overcome a practical limitation of prior research by leveraging the significant variation in the engagement of compensation consultants among listed firms (e.g. Armstrong et al., 2012; Cadman et al., 2010; Murphy and Sandino, 2010; Voulgaris et al., 2010). Approximately one-third of Australia’s largest listed firms do not engage a compensation consultant, a distinct contrast to the United States where almost all listed firms engage a compensation consultant, but similar to the United Kingdom. 2 Another distinguishing characteristic of the Australian context is the notably larger number of firms engaging a Big 4 accounting firm as their compensation consultant (Grosse et al., 2020). This contrasts from the United States, where these firms collectively account for less than 3% of engagements (Cai et al., 2016), but is not too dissimilar from the United Kingdom where they account for approximately 20% of engagements (Conyon et al., 2019). This distinction allows us to offer nuanced insights into the effects of compensation consultant engagement, and to examine whether these large, international, multi-service accounting firms exhibit different behaviours from compensation consultants in general.
Our analysis, based on a sample of ASX 500 firms spanning 2005–2019, reveals a concentrated market for compensation consulting services in Australia, with approximately 40% of firms receiving guidance from one of the Big 4 accounting firms. This is double the observed number of engagements by Big 4 accounting firms in the United Kingdom (Conyon et al., 2019), though our sample is more recent. Although our empirical findings align with prior research, suggesting a propensity for firms that engage compensation consultants to award lower short-term incentives (STI) and higher long-term incentives (LTI), we also identified significant variations in remuneration practices between firms advised by a Big 4 accounting firm (hereafter referred to as Big 4) and firms advised by other compensation consultants. For example, firms advised by a Big 4 firm more frequently adopt explicit non-financial targets (i.e. those that are quantifiable and clearly defined) within the STI, and relative performance targets (such as total shareholder return) within the LTI, a practice that helps mitigate pay for ‘luck’. 3 These results are robust to using entropy balanced subsamples to address potential endogeneity concerns regarding the use of compensation consultants, and to comparing firms that use a consultant with similar market share (i.e. number of engagements), but that is not a Big 4 firm.
Our study offers several contributions to the academic literature, regulatory frameworks, and professional practice. First, as far as we are aware, our study is the first to contribute to the academic literature substantial evidence on the association between compensation consultants and the types of performance targets used in CEO compensation contracts. Notably, our findings suggest that previously mixed results concerning the role of compensation consultants in setting levels of CEO pay might stem from a lack of homogeneity in consultant behaviour, highlighting the importance of nuanced treatment in academic research (a concern mirrored in the works by Chu et al. (2018) and Cai et al. (2016)).
Second, we contribute evidence to regulatory bodies on the effects of market concentration in compensation consulting services, and of the quality-of-service provision by large professional services firms, notably the Big 4 accounting firms. Our analyses suggest that larger multi-service consulting firms, with greater reputational effects and less reliance on repeat business from remuneration advice, are less likely to yield to CEO pressures and obscure remuneration practices which could lead to excess pay. These findings are useful for regulatory bodies when creating oversight mechanisms to ensure the integrity of large professional services firms.
Last, we contribute to the debate regarding compensation consultants’ reputational effects, measured in the literature by the number of engagements. Canil and Karpavicius (2020) provide evidence that firms employing more reputable consultants (those with greater market share) are more likely to get away with paying their CEOs excessively by way of higher say on pay votes. We show that not all consultants behave the same, despite similar market shares. Therefore, shareholders should consider the diversity in consultant practices and scrutinise the performance targets used within management’s STIs and LTIs.
The structure of this article is as follows. Section 2 presents the literature review and hypotheses development. Section 3 outlines the sample selection process and research design. Section 4 presents our main findings. Section 5 presents additional analyses and Section 6 concludes.
2. Literature review and hypotheses development
2.1. Literature review
2.1.1. The role of compensation consultants
The practice of hiring a compensation consultant is still emerging in Australia (Grosse et al., 2020), but enables firms to gain access to benchmark peer group data and the most up-to-date industry practices in designing optimal compensation contracts (Cadman et al., 2010; Chu et al., 2018). Nonetheless, evidence suggests that hiring a compensation consultant leads to a significant increase in CEO pay (Chu et al., 2018; Conyon et al., 2009, 2019; Goh and Gupta, 2010; Grosse et al., 2020; Murphy and Sandino, 2010, 2020). In the academic literature, two predominant theories compete to explain this phenomenon: efficient contracting theory and managerial power theory.
Efficient contracting theory views the design of CEO compensation arrangements as a means to minimise agency costs between shareholders and CEOs, attributing any observed variations in compensation to the underlying economic characteristics of the firm (Armstrong et al., 2012; Conyon et al., 2019; Goh and Gupta, 2010). Proponents of this perspective maintain that compensation consultants are optimal contract advisors, designing pay arrangements that align with shareholders’ interests. This alignment is attributed to the consultant’s desire to safeguard their reputation and circumvent potential dismissal by the client firm’s board of directors, thereby providing an incentive to supply accurate and unbiased information (Conyon et al., 2009, 2019).
Contrary to efficient contracting theory, managerial power theory posits that the pervasive influence of CEOs over corporate governance structures largely accounts for the observed inefficiencies in executive pay arrangements, including the decoupling of pay from performance (Bebchuk and Fried, 2003, 2004; Murphy and Sandino, 2010). From this perspective, compensation consultants are engaged to justify excessive remuneration levels and to camouflage or facilitate rent extraction by CEOs, aiming to secure ongoing business and opportunities to sell additional services to the firm (Bebchuk et al., 2002; Cho et al., 2020; Conyon et al., 2019; Crystal, 1991; Hsu et al., 2014; Foreman and Howard, 2016; Grosse et al., 2020; Murphy and Sandino, 2010; Tadros 2018; Wade et al., 1997; Waxman, 2007). 4 This dynamic is presumed to persist even in scenarios where the CEO does not directly partake in the selection of a compensation consultant, as the implicit influence of the CEO over the remuneration committee – and consequently the decision to reengage a compensation consultant – is enough to ensure compliance with the CEO’s preferences (Bebchuk et al., 2002; Voulgaris et al., 2010).
2.1.2. The role of performance targets
Although firms can incorporate a wide spectrum of performance targets, managerial power theory asserts that CEOs favour compensation contracts that facilitate the concealment of rent extraction. This preference manifests in the inclusion of (overly) easy performance targets and those that can be manipulated ex post (Abernethy et al., 2015; Bachmann and Spiropoulos, 2023; Bebchuk et al., 2002; Bebchuk and Fried, 2003; Kenny 2017; Morgenson, 2006; Morse et al., 2011; Qu et al., 2018). Accordingly, if given the choice between market- or accounting-based performance targets, the two most common categories within the LTI compensation component, CEOs will prefer accounting-based metrics as they can exert greater influence over these outcomes (Abernethy et al., 2015; Healy and Wahlen, 1999; Kuang et al., 2014; Leone and Rock, 2002).
Similarly, in the context of the STI, where performance targets may be financial or non-financial, CEOs are expected to prefer non-financial targets because these targets, unlike their financial counterparts, are predisposed to managerial manipulation and rarely subject to public verification (Ittner et al., 1997; Rajan and Reichelstein, 2009). 5 Furthermore, the inherent nature of non-financial targets renders them open to manipulation without sanction from external auditors and makes historical and industry comparisons difficult (Eccles and Mavrinac, 1995).
In response to widespread criticism regarding the use of non-financial performance targets, both the ASX Corporate Governance Council and a number of academic studies provide a framework to guide the design of effective performance targets. These frameworks underscore the importance for performance-based compensation to be tied to clearly defined targets that support a firm’s objectives across both short- and long-term horisons, thereby aligning the interests of management with shareholder value creation. A key attribute of a well-designed performance target is its measurability (e.g. Bachmann et al., 2020; Bachmann and Spiropoulos, 2023; Höppe and Moers, 2011; Neely et al., 1997). 6 Specifically, non-financial targets should be linked to quantifiably precise targets rather than vague terminology to avoid misuse and manipulation (Bachmann et al., 2020; Bachmann and Spiropoulos, 2023; Neely et al., 1997; O’Connell and O’Sullivan, 2014). As Neely et al. (1997) asserted, the absence of ‘an explicit target, which specifies the level of performance to be achieved and a time scale for achieving it, it is impossible to assess whether performance is improving’ (p. 1138). This view is also consistent with the ‘SMART’ standard for setting corporate objectives, specifically highlighting the importance of performance targets being specific and measurable, in addition to attainable, relevance and timely (Doran, 1981).
2.2. Hypotheses development
In summary, the role of compensation consultants – whether as facilitators of efficient contracts or enablers of CEO rent extraction – remains an ongoing debate. If compensation consultants devise compensation contracts in alignment with the principles of efficient contracting theory, we propose the following hypotheses:
H1a: There is a positive (negative) association between compensation consultants and quantitative (qualitative and undefined) non-financial performance targets used in CEO STI compensation.
H2a: There is a positive (negative) association between compensation consultants and market-based (accounting) performance targets used in CEO LTI compensation.
Conversely, should compensation consultants facilitate rent extraction efforts by CEOs, consistent with managerial power theory, we articulate our alternative hypotheses as follows:
H1b: There is a negative (positive) association between compensation consultants and quantitative (qualitative and undefined) non-financial performance targets used in CEO STI compensation.
H2b: There is a negative (positive) association between compensation consultants and market-based (accounting) performance targets used in CEO LTI compensation.
If the expertise of compensation consultants enables firms to devise efficient compensation contracts, changes in CEO wealth should be closely aligned with changes in shareholders’ wealth. Hence, it is expected that firms receiving advice from compensation consultants will exhibit a greater pay-for-performance relation, compared to firms that do not. In accordance with efficient contracting theory, we formulate the following hypothesis:
H3a: There is greater pay-for-performance in firms that receive advice from a compensation consultant compared to firms that do not.
Alternatively, if compensation consultants are swayed by the CEO’s influence, aiming to secure repeat business or opportunities to cross-sell services, a lower pay-for-performance relation is expected in firms that engage a compensation consultant, compared to firms that do not. Therefore, under the managerial power hypothesis, we posit:
H3b: There is lower pay-for-performance in firms that receive advice from a compensation consultant compared to firms that do not.
3. Research method
3.1. Data sources and sample selection
This study is based on a sample of ASX 500 firms over the period 2005–2019. We deliberately focused on ASX 500 firms as they constitute approximately 90% of the aggregate market capitalisation of the Australian Securities Exchange (ASX), are more likely to disclose performance targets in CEO compensation contracts and more frequently engage compensation consultants compared to smaller firms (Grosse et al., 2020). Data pertaining to CEO compensation and governance characteristics are sourced from the Connect4 database, while the economic characteristics of firms are obtained from the DatAnalysis database. Detailed information regarding the engagement of compensation consultants and the performance criteria of CEOs’ STI and LTI are all hand collected from remuneration disclosures within firms’ annual reports. 7
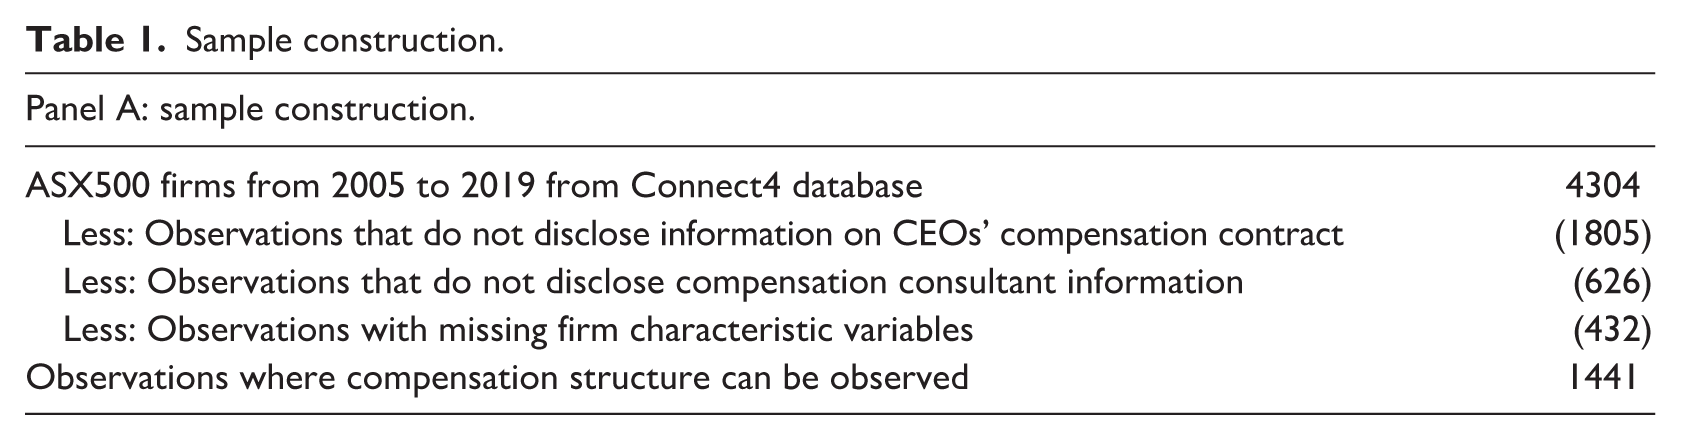
Table 1, Panel A, displays the sample selection process. We began by obtaining data on CEO compensation from the Connect4 database, which comprises 4303 firm-year observations throughout the sample period. For our analysis, we required information on (1) the CEO’s remuneration contract and (2) whether the firm sought advice from a compensation consultant during the year. Given the variability in reporting standards concerning these aspects, our analysis is confined to firms that offer sufficient disclosure. Consequently, we initially excluded 1805 observations due to absence of detailed information on the CEO’s compensation contract. This exclusion underscores a limitation of our study, as we were unable to include firms that withhold this information. 8 Subsequently, an additional 626 observations are excluded due to the lack of disclosure regarding the use of compensation consultants during the year. 9 Last, we removed observations missing firm-level data required for our control variables (432), resulting in a sample of 1441 firm-year observations which become the foundation for our empirical tests.
Sample construction.
Panel A: sample construction.
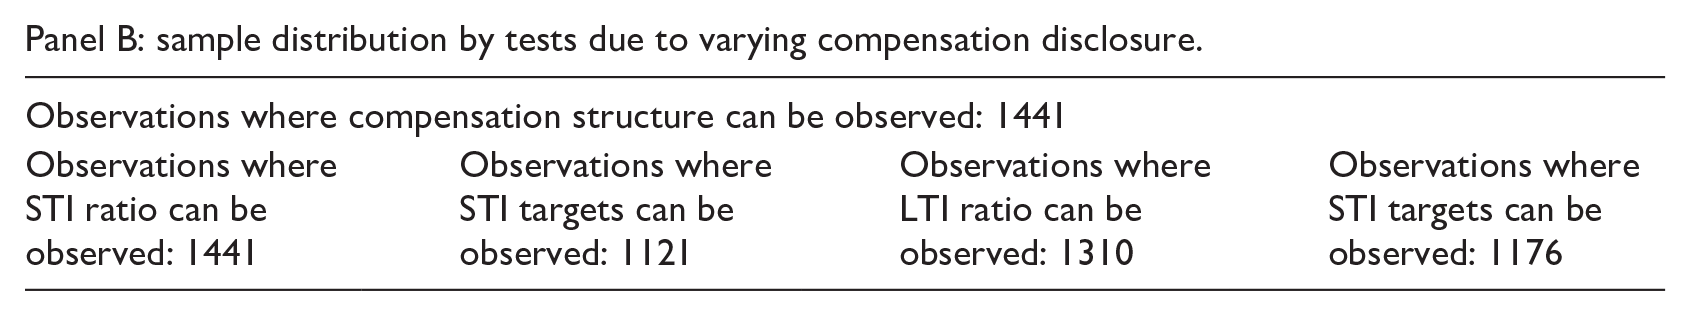
Panel B: sample distribution by tests due to varying compensation disclosure.
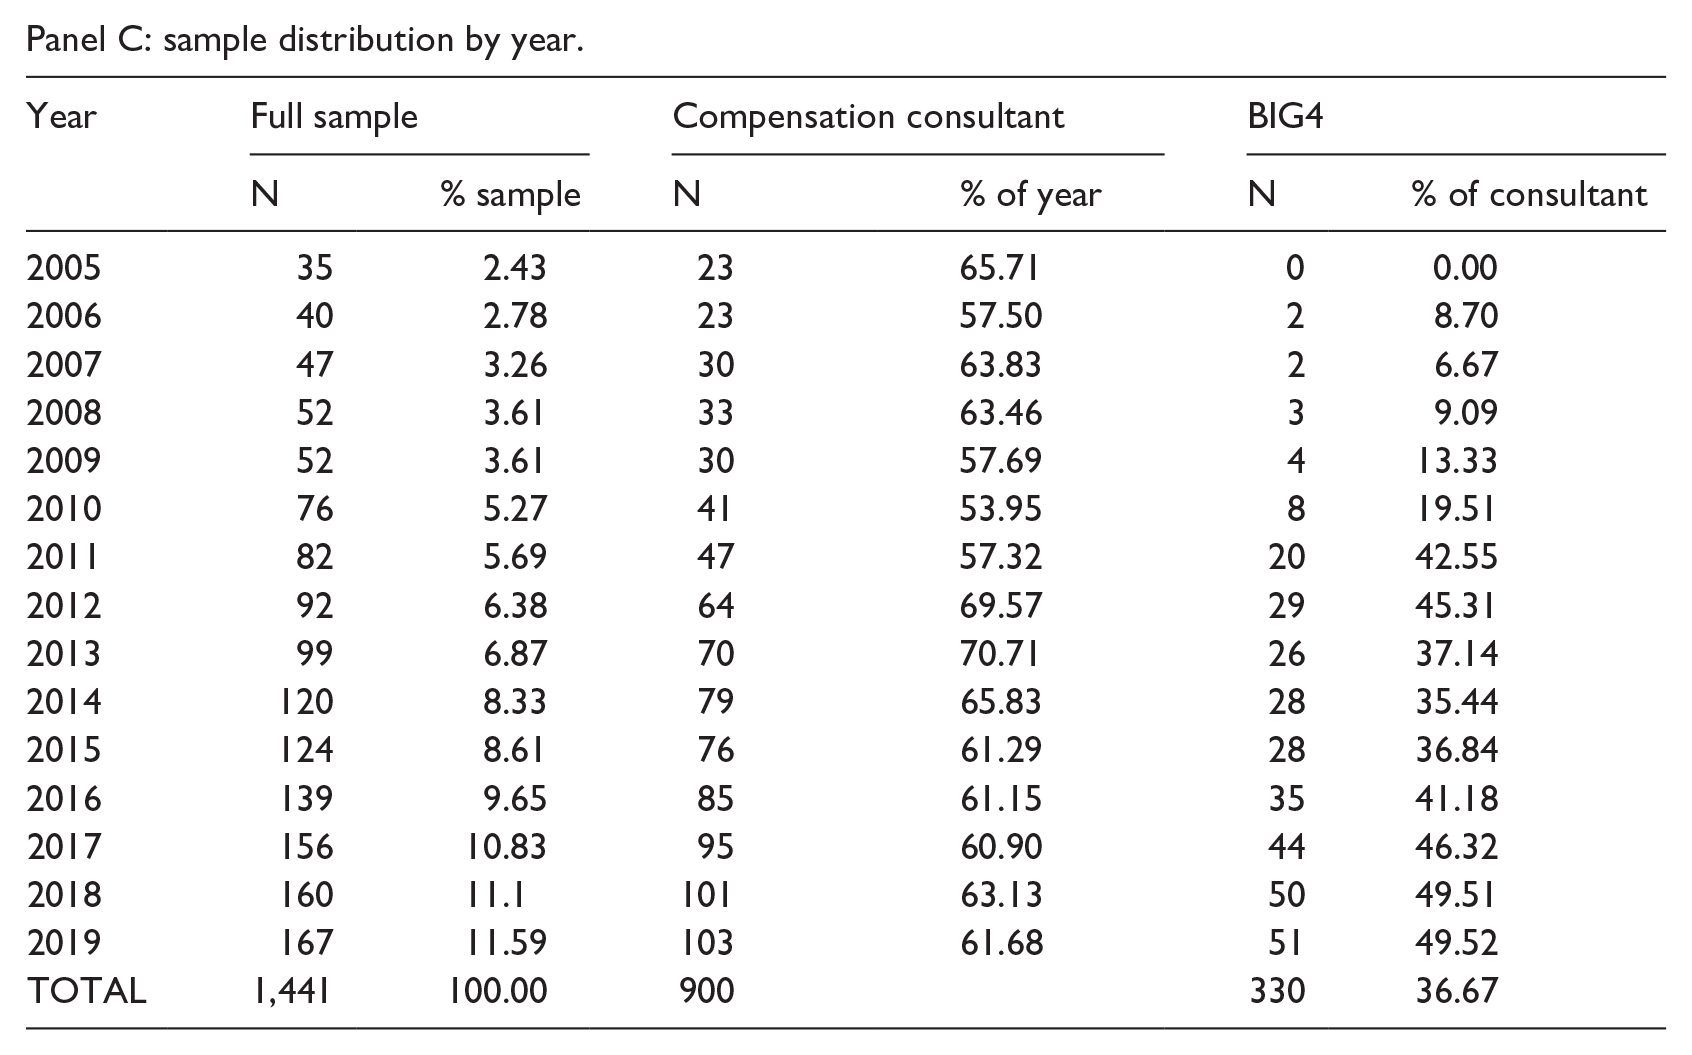
Panel C: sample distribution by year.
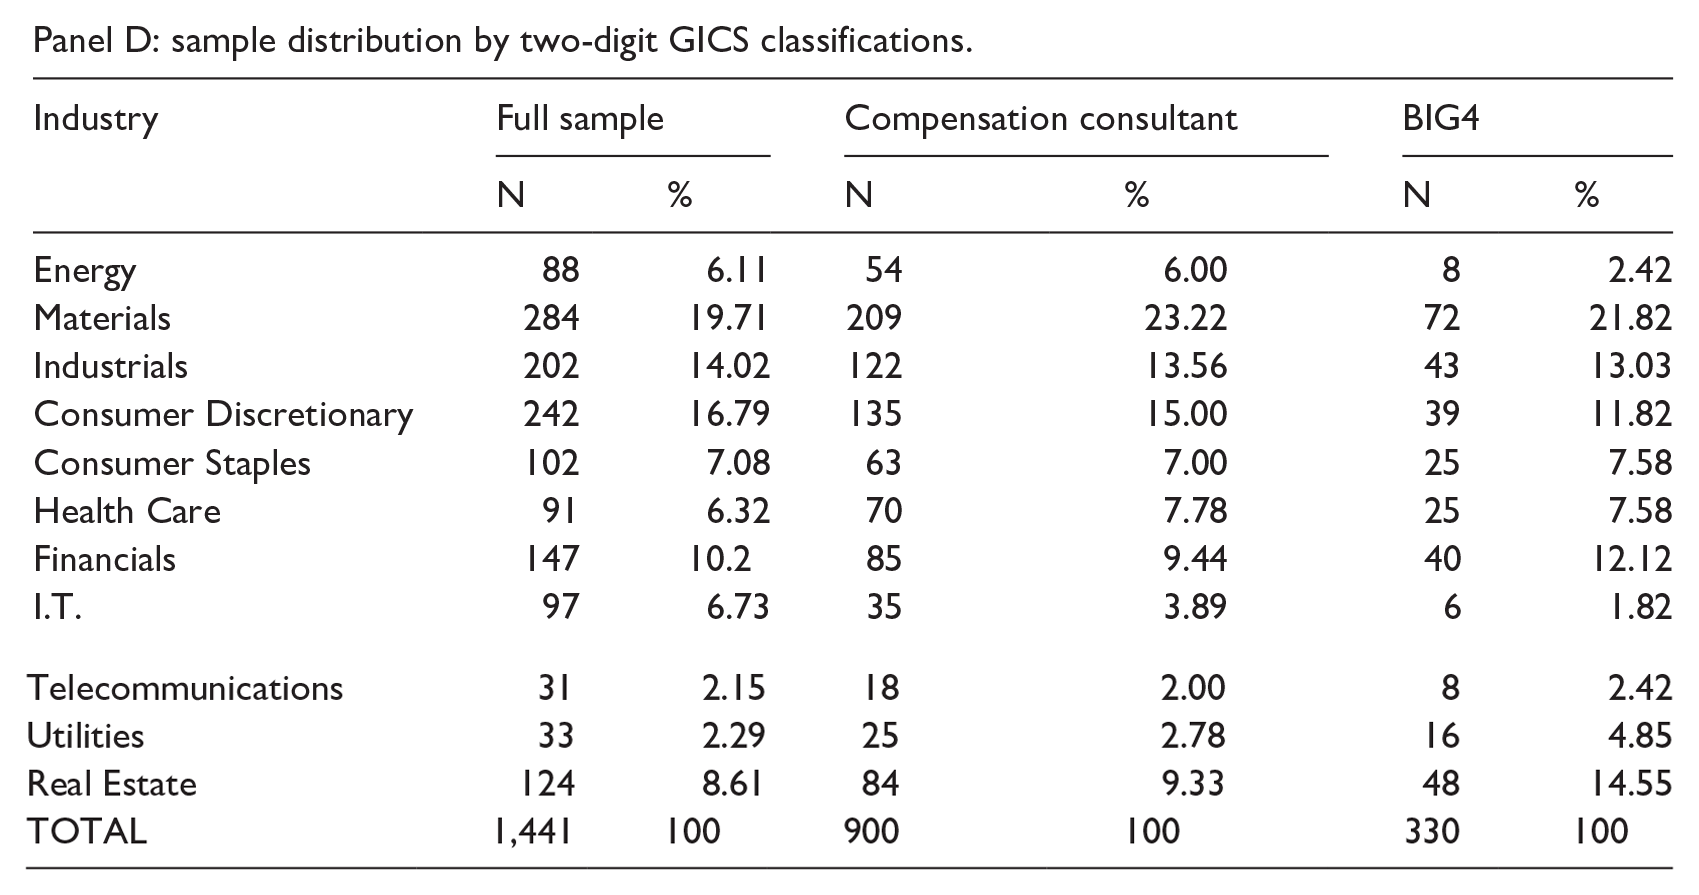
Panel D: sample distribution by two-digit GICS classifications.
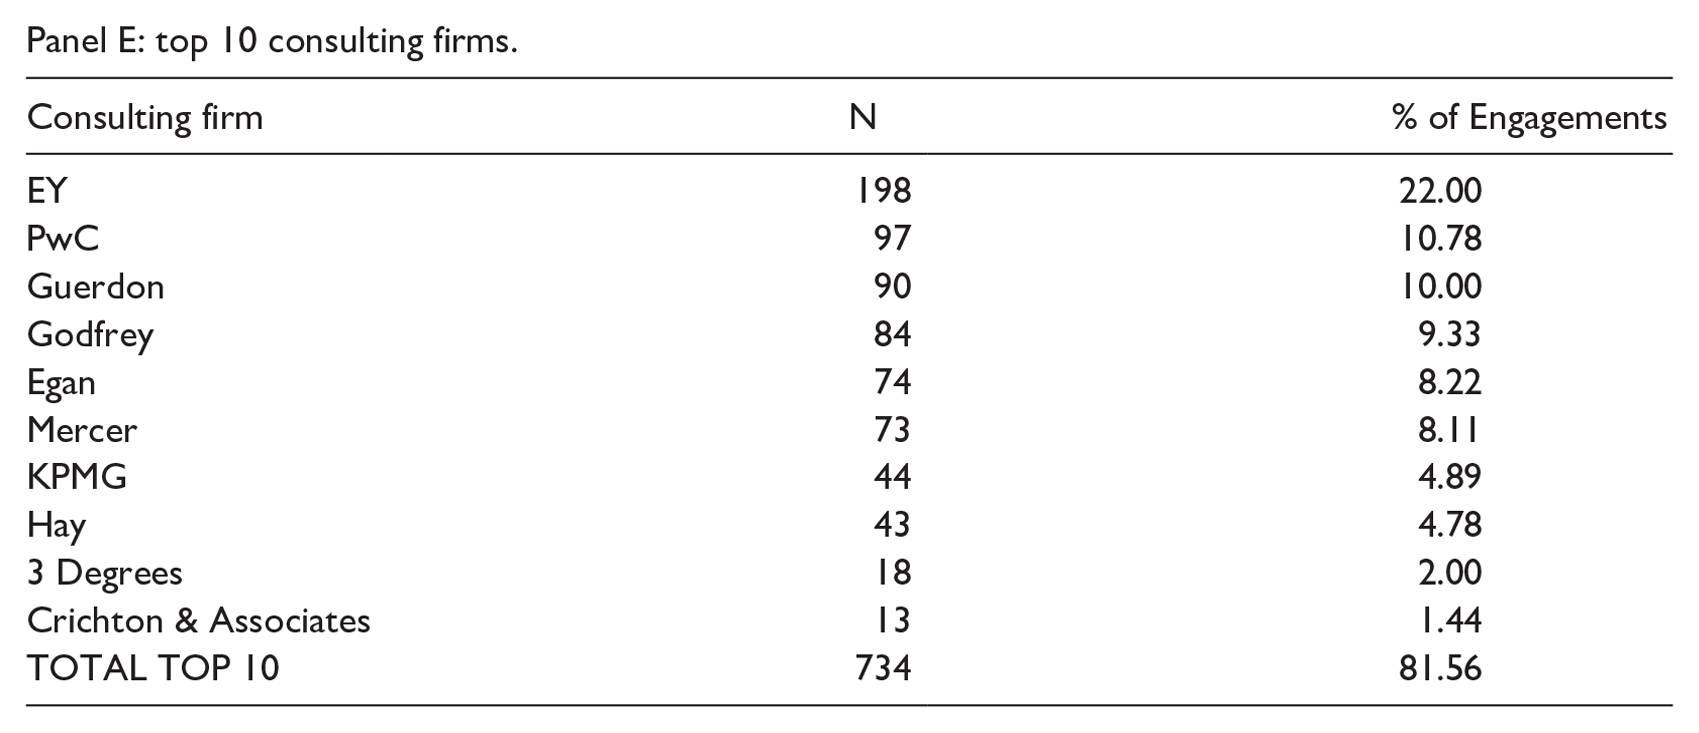
Panel E: top 10 consulting firms.
Our study examines the individual components of CEO compensation including both the STI and the LTI. However, the degree of transparency in reporting these components varies across firms. For example, within our data set, all 1441 firm-year observations provide details on the ex ante STI ratio (i.e. maximum STI opportunity relative to fixed salary) available to the CEO; however, only 1121 of these observations provide specific information regarding the actual performance targets included in the STI.
Similarly, although 1310 firm-year observations disclose the ex ante LTI ratio (i.e. maximum LTI opportunity relative to fixed salary) available to the CEO, only 1176 observations actually provide information on the performance targets included in the LTI. Consequently, our sample size varies marginally across our various analyses depending on whether the STI or LTI compensation component is being examined, as summarised in Panel B of Table 1. 10
Panel C presents the annual distribution of firms by financial year. The frequencies of observations increase towards the later sample years, though the sample is not dominated by any one year. The increase in frequency could be explained by Australian reporting requirements that were introduced in 2003 and later amended in 2011, prompting an improvement in reporting practices over time (Clarkson et al., 2011). 11 The use of compensation consultants remains relatively stable over the sample period, while the frequency of Big 4 exhibits an increasing trend.
Panel D provides the industry distribution based on two-digit Global Industry Classification Standard (GICS) classifications. The results highlight that no one industry dominates the sample. The materials industry accounts for the greatest proportion of firms, constituting 19.71% of the sample throughout the sample period, while the telecommunication services industry represents the smallest proportion at 2.15%. This distribution is consistent across all subsamples and reflects the composition of the Australian market (Bachmann et al., 2020; Matolcsy and Wright, 2007). We also examined the prevalence of Big 4 accounting firms as compensation consultants across different industries. The distribution is consistent with the full sample, indicating that the Big 4 market dominance is not the result of specialisation in any particular industry.
Panel E lists the top 10 compensation consultants based on market share in our sample. In total, 35 different compensation consulting firms appear at least once in our data set (not tabulated). However, a much smaller number of these consultants account for much of the market. As displayed in Panel E, the top 10 consultants service 81.56% of firms that engaged a compensation consultant in our sample. This is largely consistent with the findings of Grosse et al. (2020) over a period of 4 years from 2011 to 2015, although some small shifts have occurred in the market share ranking of consultants. Contrary to the United States, where Big 4 accounting firms service less than 3% of clients seeking compensation advice (Cai et al., 2016), two of the Big 4 are the largest providers in terms of market share within the Australian setting. Ernst & Young (EY) alone accounts for 22% of the market for compensation consulting services, followed by PricewaterhouseCoopers (PwC) at 11%. 12 In fact, together with KPMG (4.89%) and Deloitte (0.67%, not tabulated), the Big 4 accounting firms capture almost 40% of engagements in our sample.
3.2. Research design
3.2.1. Association between compensation consultant use and performance targets
To explore the association between compensation consultant engagement and CEOs’ STI and LTI, the following pooled logit or ordinary least squares (OLS) regression models are estimated, according to whether the dependent variable is discrete or continuous, respectively: 13

Performance Target represents nine distinct components, five of which specifically relate to the CEO’s STI: the ratio of bonus to fixed salary (STI_Ratio); the relative weight placed on non-financial performance targets (%STI_NonFin); STI_Quant, representing performance targets that are quantifiable; STI_Qual, representing performance targets that are qualitative in nature; STI_Undefined, a category for observations where the firm has not specified the non-financial targets used. 14 STI_Quant, STI_Qual and STI_Undefined are indicator variables designed to capture the spectrum of non-financial performance targets from the most to the least explicit, aligning with theoretical frameworks established by prior research (e.g. Neely et al., 1997).
The remaining four components capture the conditions of CEOs’ LTI: the ratio of LTI to fixed salary (LTI_Ratio), the weights placed on market-based targets (%LTI_Market), the weights placed on accounting-based targets (%LTI_Accounting) and an indicator variable (LTI_RTSR) set to 1 if the market-based target is relative total shareholder return, and zero otherwise. LTI_RTSR is incorporated as an alternative dependent variable to assess firms’ efforts to mitigate the impact of market-wide factors on performance, which fall outside the CEO’s control. By evaluating a firm’s total shareholder return in relation to its peers and acknowledging that similar market-wide factors affect competitors to a similar degree, a relative performance targets helps avoid paying CEOs for ‘luck’. Definitions for all variables are provided in Appendix 1.
The primary independent variable of interest, Consultant, is an indicator variable equal to 1 if the firm has engaged a compensation consultant during the year, and 0 otherwise. 15 We did not distinguish between firms seeking compensation consulting services versus remuneration advice, following findings from Grosse et al. (2020) which documents no significant difference in the impact of compensation consultants and remuneration advisors on CEO pay.
Given the large market presence of the Big 4 in the compensation consulting sector in Australia, we refined the Consultant variable to distinguish between these consulting firms. Drawing from the audit literature (e.g. DeFond et al., 2016; Lawrence et al., 2011), we expect that the comprehensive resource base of the Big 4 – extending beyond compensation consulting – reduces their dependence on any single client, thereby reducing the economic incentive to secure repeat business through client appeasement (DeAngelo, 1981; DeFond et al., 2002, DeFond et al., 2016; Grosse et al., 2020). Thus, Big4 is an indicator variable equal to 1 if the firm employs EY, PwC, KPMG or Deloitte as the compensation consultant or advisor during the year, and 0 otherwise. For accurate comparison, Consultant_other is also included in the model, which is an indicator variable equal to 1 for firms engaging compensation consultants other than the Big 4 accounting firms, and 0 otherwise.
Consistent with prior studies, control variables for economic characteristics expected to influence a firm’s preference for certain compensation contract were included (e.g. Bachmann et al., 2020; Matolcsy and Wright, 2011). These include firm performance measured as return-on-assets (ROA), firm size as the natural logarithm of total assets (lnSize), firm risk as the standard deviation of return on assets over a 5-year period (stdROA), annual buy and hold stock return as a market-based measure of firm performance (Return), debt-to-equity ratio to capture external monitoring by large debt holders (Leverage), market-to-book ratio to capture firm growth (M/B) and liquidity measured as the natural logarithm of operating cash flow scaled by total assets (lnCash). We also controlled for common governance characteristics including the size of the remuneration committee (RemSize), the proportion of independent directors on the remuneration committee (RemIndependent), the number of meetings held by the remuneration committee (RemMeetings), as well as whether the CEO is a member of the remuneration committee (RemMember). CEO characteristics including CEO tenure (CEO Tenure), the number of ordinary shares held by the CEO divided by total shares outstanding (CEO Shares), as well as the proportion of fixed salary relative to total compensation (CEO Salary) are also included. Finally, to control for temporal and industry variations not captured by other variables, we integrated both year and industry fixed effects into our model.
3.2.2. Pay-for-performance relation
To examine H3, whether the pay-for-performance association is different in firms that receive advice from a compensation consultant compared to firms that do not, we estimated the following model:
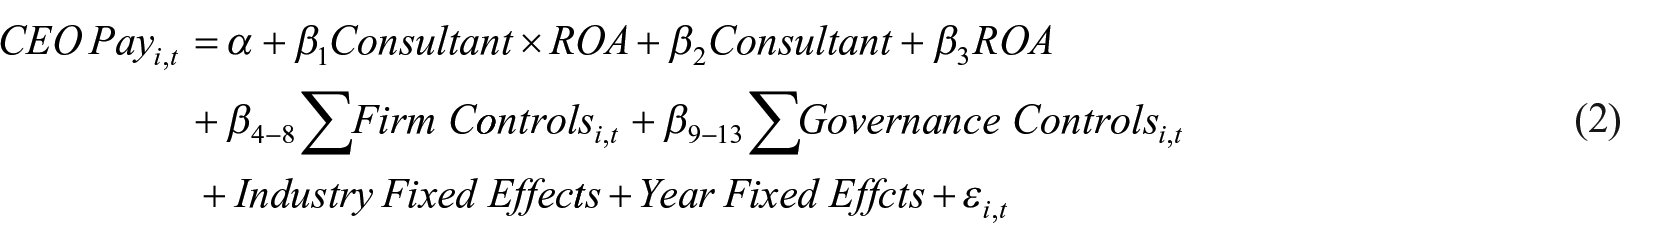
The dependent variable, CEO Pay, captures the actual compensation realised by CEOs (i.e. pay CEOs took home) and is measured several ways. First, Total Pay is the natural logarithm of the total realised pay for the CEO of firm i in year t. Second, we examined realised variable pay (Variable Pay), which encompasses earnings from both STI and LTI, calculated as the natural logarithm of the CEO’s total pay less fixed components (such as salary, super, allowances and motor) and options. We excluded options due to their potential to display negative values, since they are not realised forms of pay. Third, we examined realised bonus pay, measured as the natural logarithm of STI (STI). Finally, we included the natural logarithm of realised LTI (LTI). 16
We examined these compensation components separately due to the different types of performance targets incorporated within STI and LTI, potentially leading to different pay-for-performance dynamics. The independent variables of interest are the interaction terms between ROA and the compensation consultant variables. If compensation consultants facilitate efficient contracting, no significant difference in the pay-for-performance relation is expected relative to firms that do not engage a compensation consultant. Conversely, if compensation consultants help camouflage rent extraction, a diminished pay-for-performance relation is expected compared to firms that do not engage a compensation consultant. We employed control variables as previously defined in Model (1).
3.3. Descriptive statistics
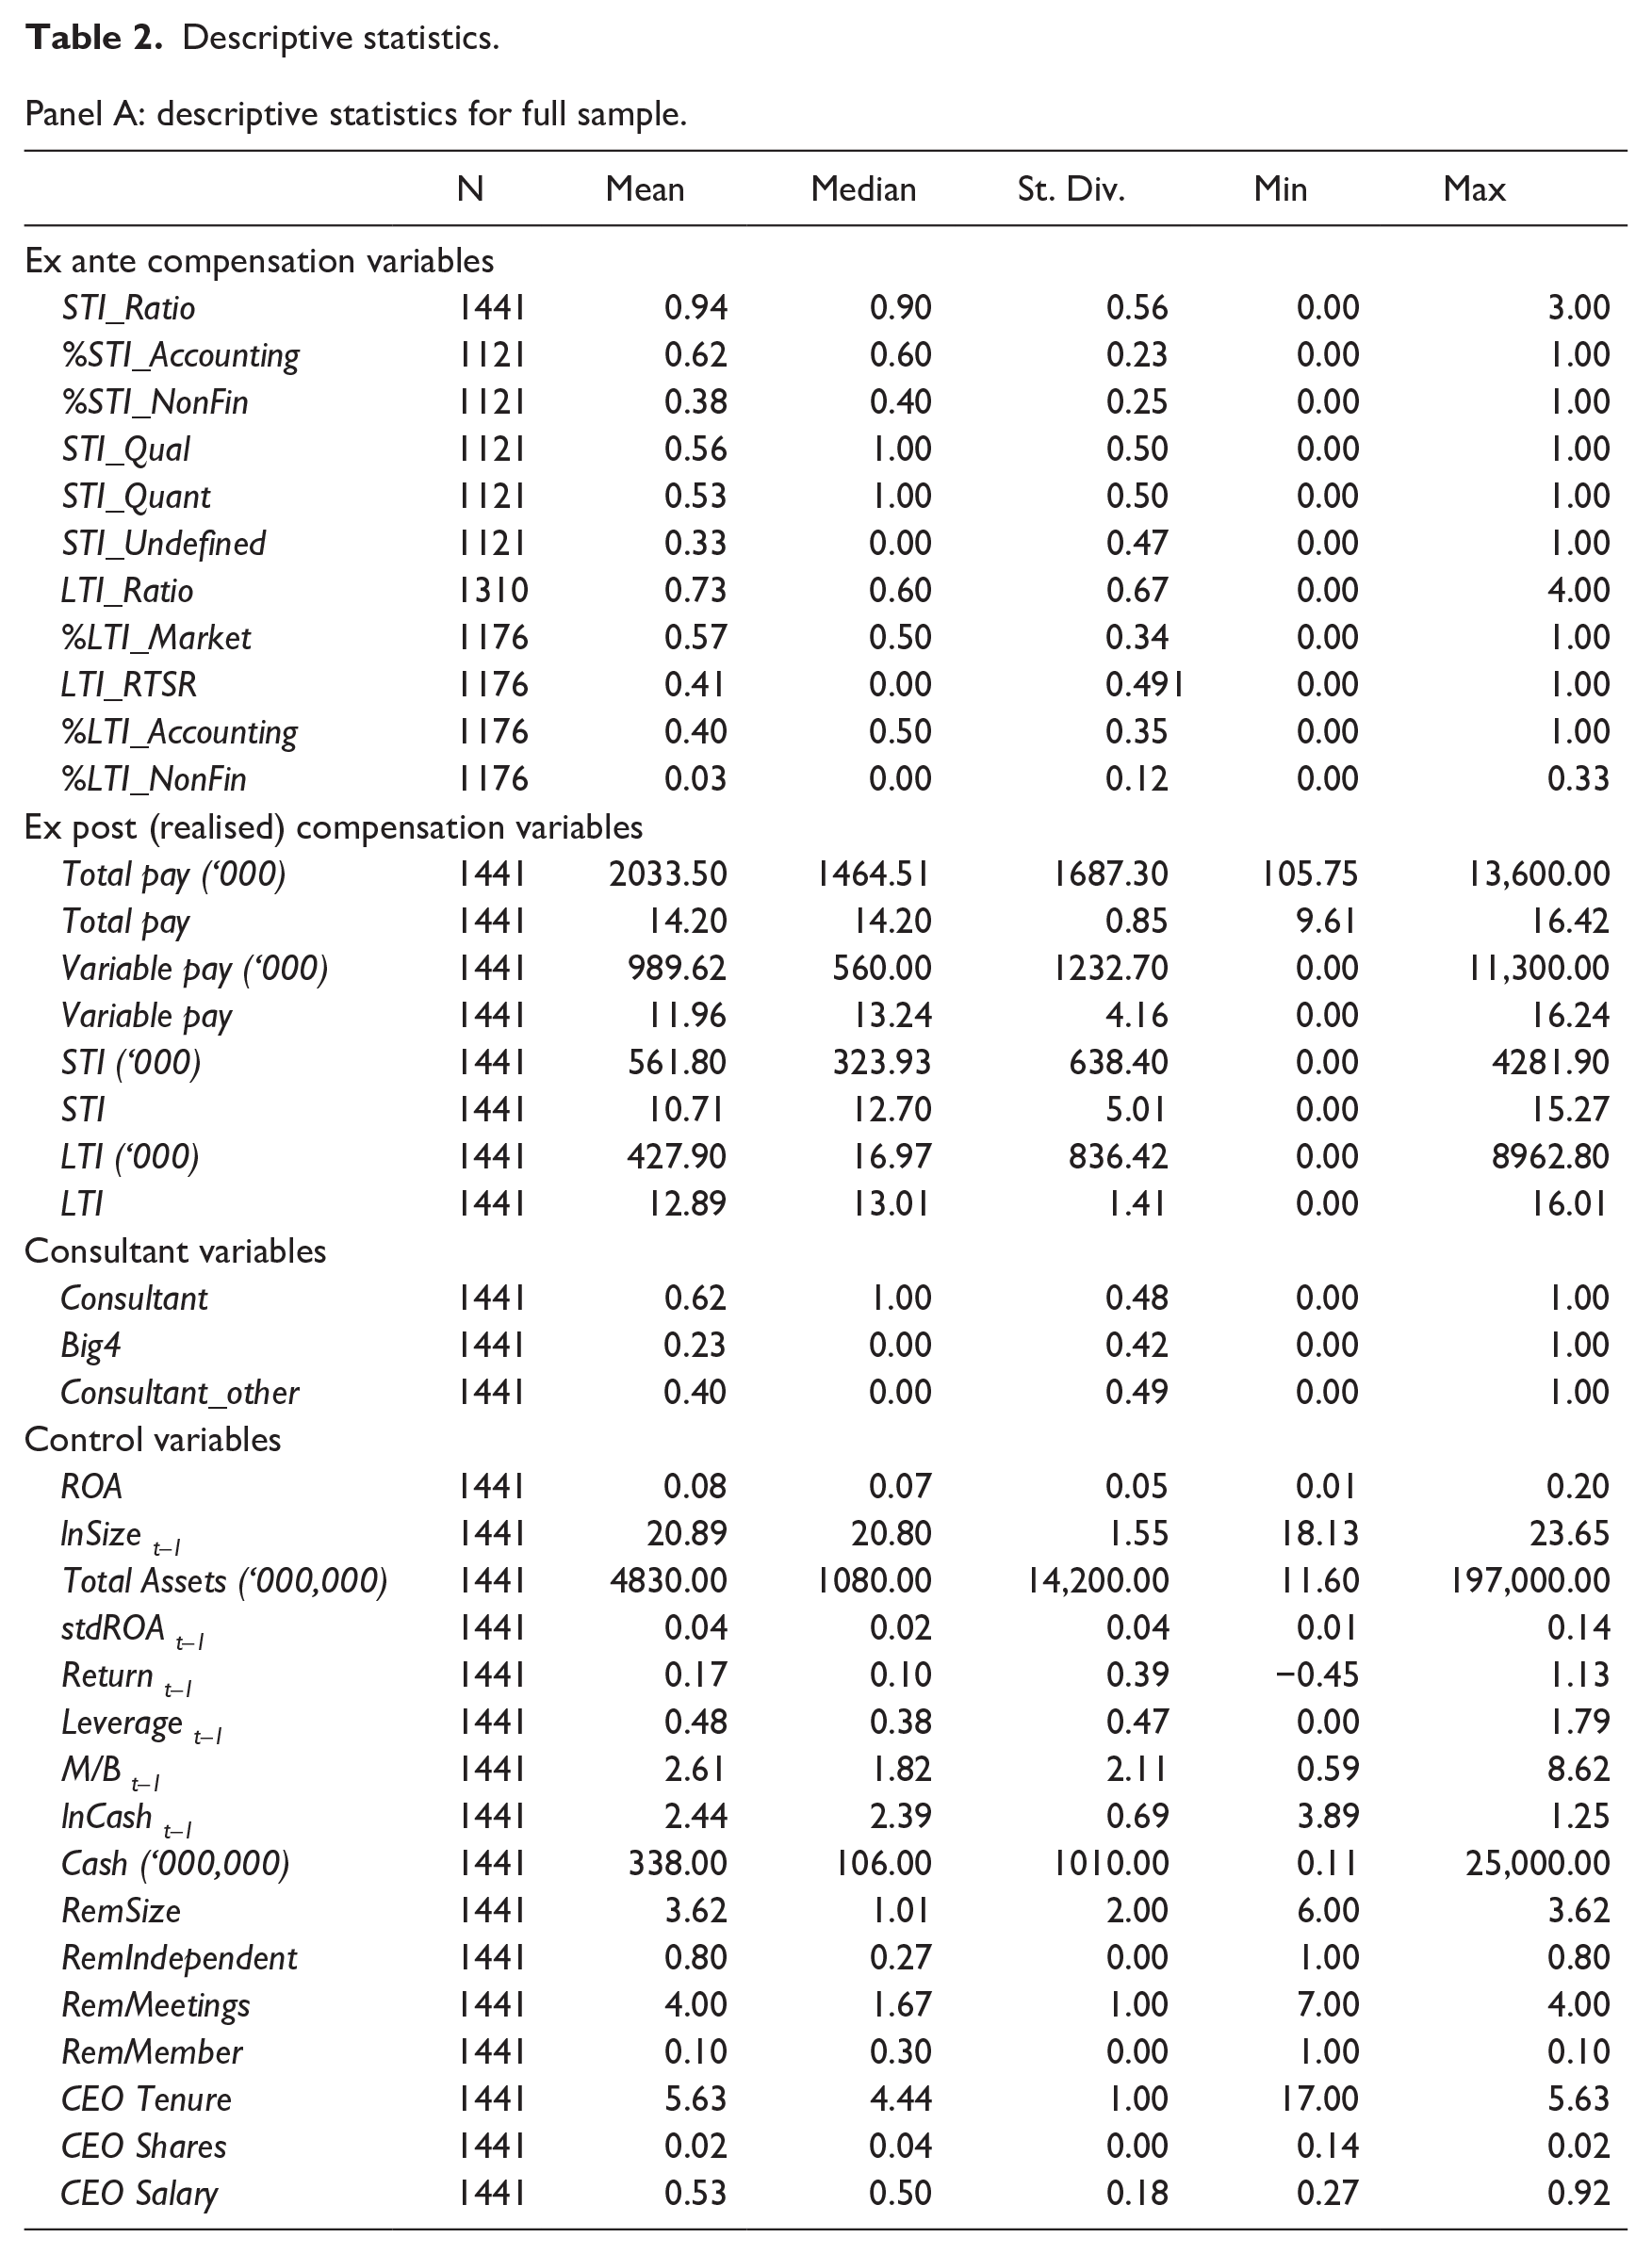
Table 2, Panel A, displays the descriptive statistics for all variables used in our main analyses. The control variables capturing relevant firm characteristics are generally consistent with prior literature indicating that our samples are comparable (e.g. Bachmann et al., 2020; Grosse et al., 2020).
Descriptive statistics.
Panel A: descriptive statistics for full sample.
Panel B: univariate analysis.
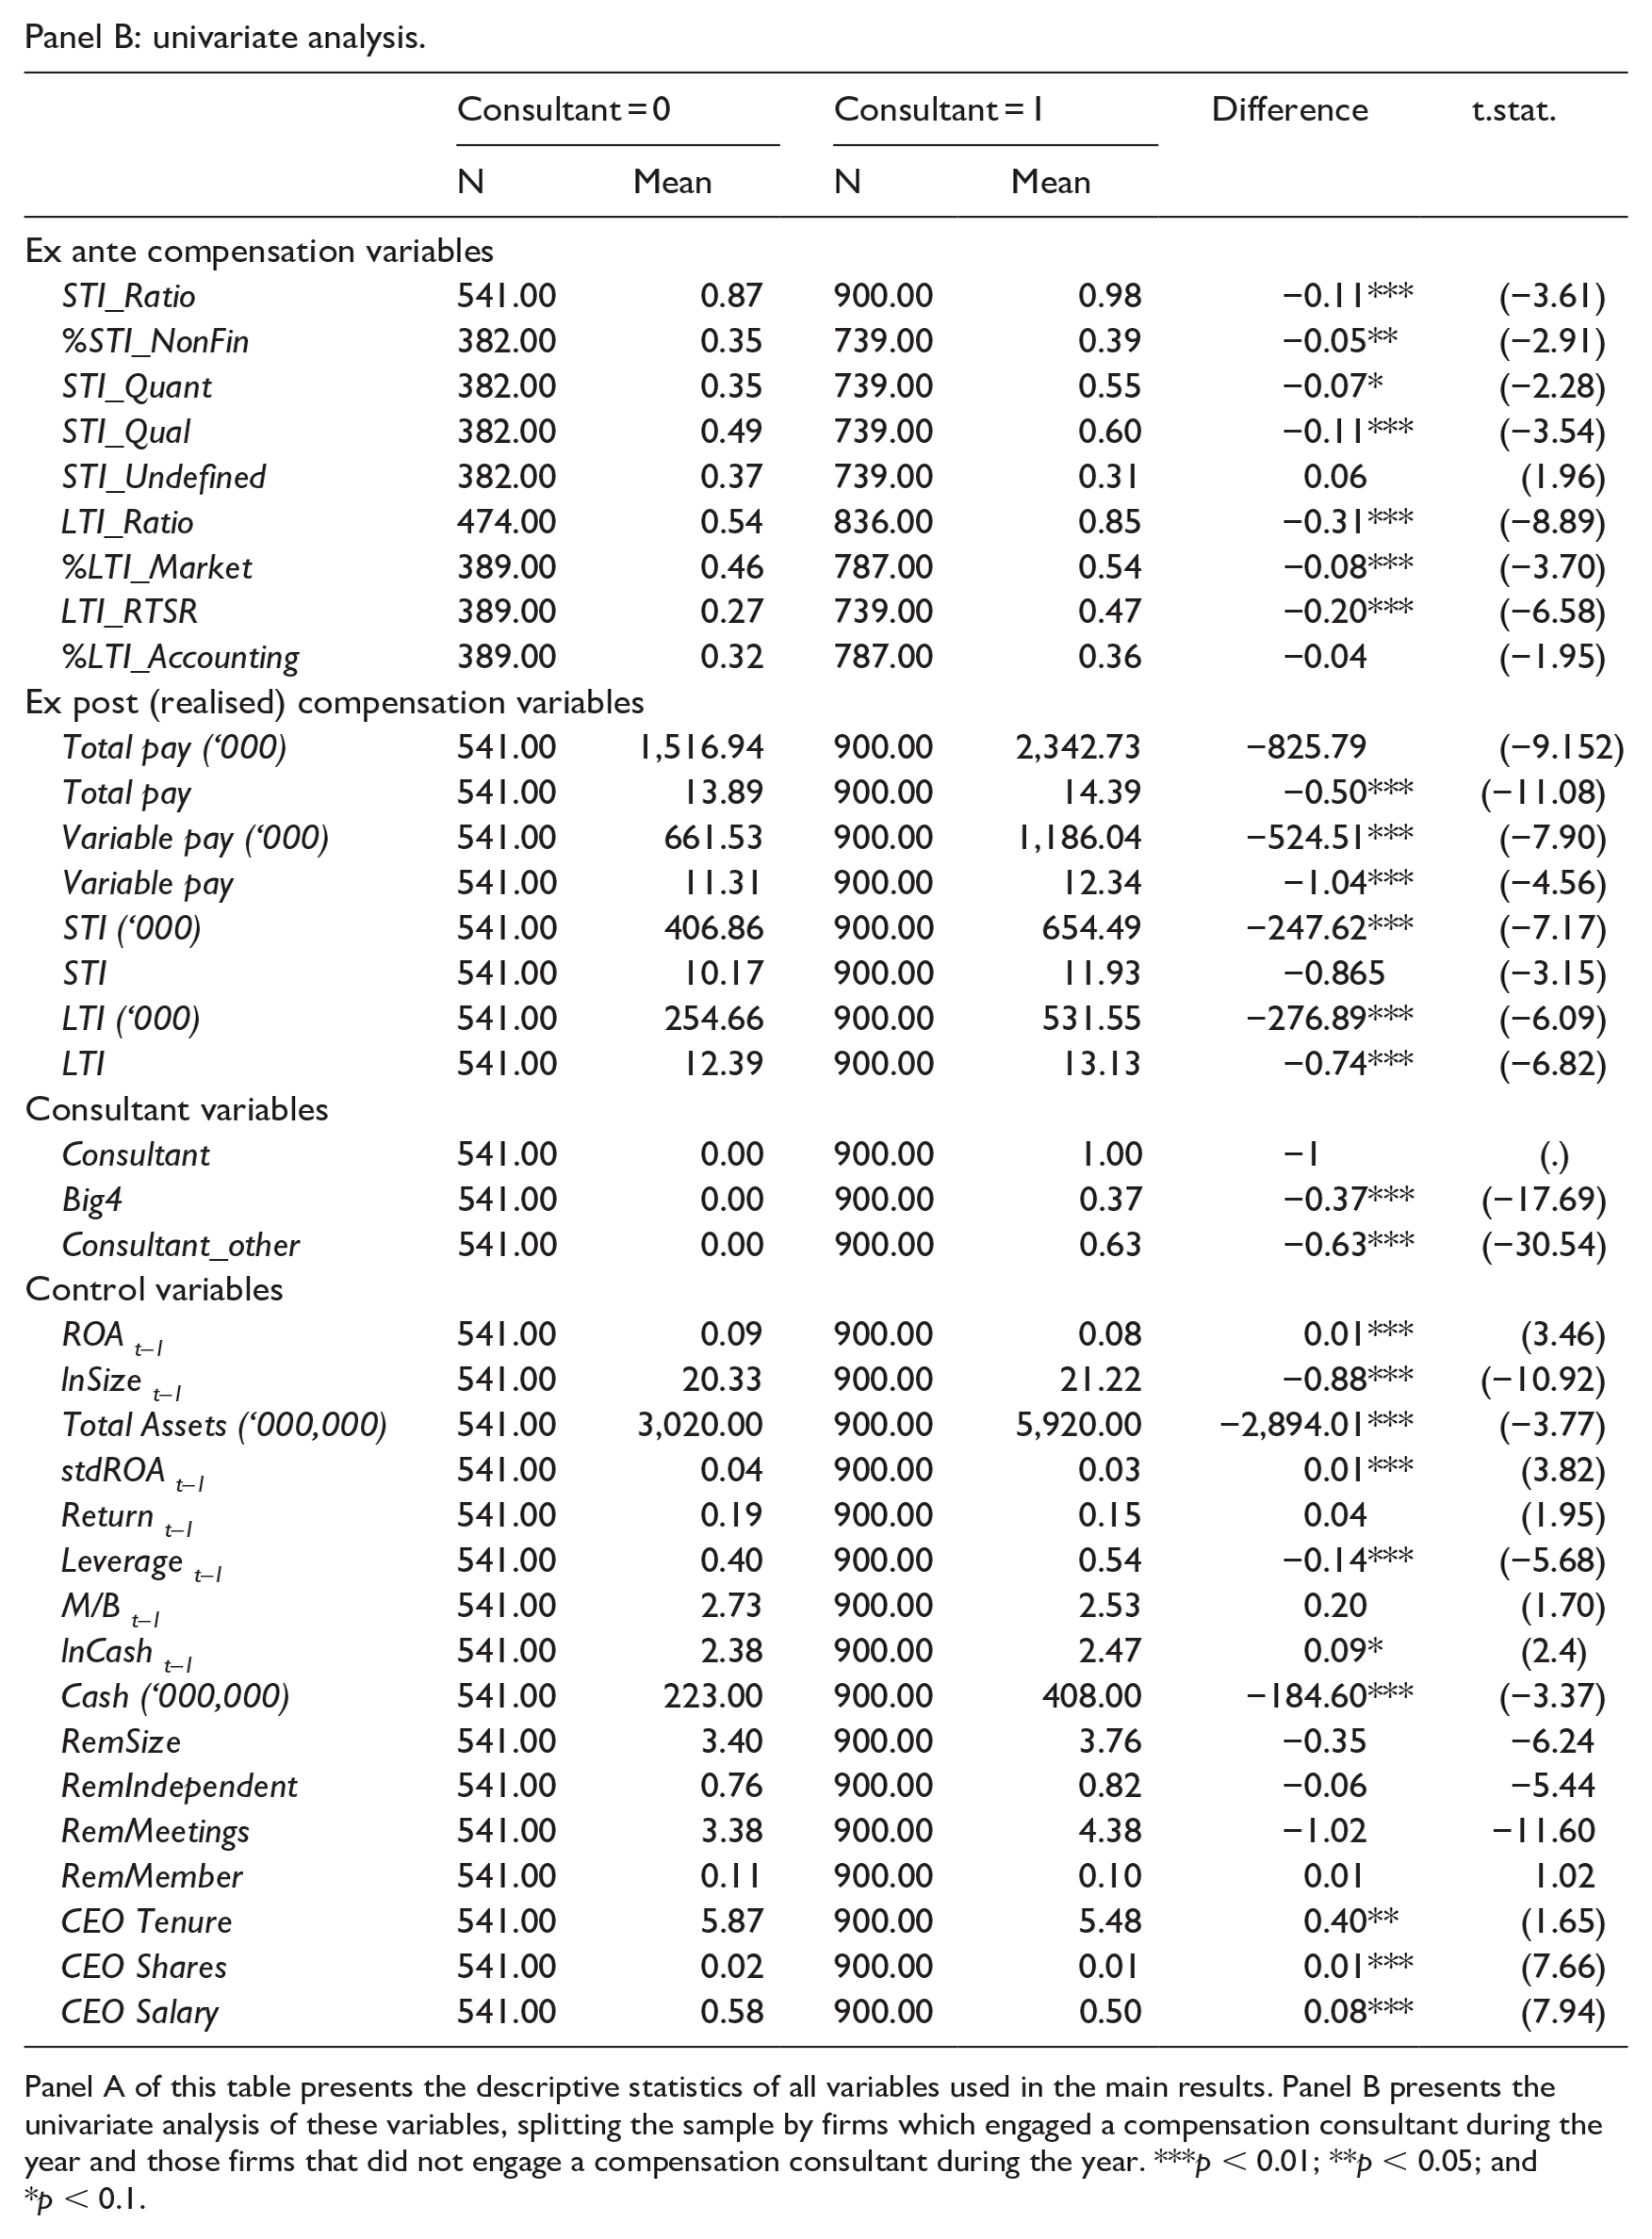
Panel A of this table presents the descriptive statistics of all variables used in the main results. Panel B presents the univariate analysis of these variables, splitting the sample by firms which engaged a compensation consultant during the year and those firms that did not engage a compensation consultant during the year. ***p < 0.01; **p < 0.05; and *p < 0.1.
Of the dependent variables, the mean percentage of short-term incentives (STI_Ratio) across the entire sample is 94%. This indicates that, on average, CEOs in our sample are eligible for an STI bonus of 0.94 times their base salary, with a maximum potential of 3 times their base salary. When compared to the equity component of their pay (LTI_Ratio), equity, on average, forms a relatively smaller proportion of compensation within the Australian setting. Specifically, the mean LTI is equivalent to 0.73 times the base salary, though it reaches a maximum of 4 times base salary (Panel A). The comparison of firms that engage a compensation consultant to those that do not (Panel B) reveals that both the LTI_Ratio and STI_Ratio are significantly greater in firms engaging compensation consultants (85% and 98%, respectively) compared to firms that do not (54% and 87%). This trend is also reflected in the CEO’s realised pay, indicating that CEOs in firms that engage compensation consultants receive higher pay across all components.
Regarding the STI, firms utilise a mixture of financial and non-financial performance measures. Panel A highlights that, on average, 38% of the potential STI payout for CEOs is predicated on non-financial performance targets (%STI_NonFin). 17 Panel B shows that firms engaging compensation consultants demonstrate a slightly higher percentage (39%) compared to firms that do not (35%). These firms also exhibit a higher propensity to incorporate quantitative performance targets (STI_Quant: 55% vs 35%) and a lower likelihood of incorporating undefined performance targets (STI_Undefined: 31% vs 37%).
Within the LTI component, performance targets can be differentiated between market-based, accounting-based, and a very small proportion of non-financial targets. As illustrated in Panel B, firms engaging compensation consultants weight a greater proportion of LTI towards market-based (%LTI_Market: 54%) and accounting-based (%LTI_Accounting: 36%) targets than firms without compensation consultants (46% and 32%, respectively). These initial insights suggest that compensation consultants can play a significant role in shaping a company’s compensation policies and practices.
Within the category of market-based performance targets, most firms tie compensation to achieving a specified total shareholder return (TSR) (62%, not tabulated), while the rest adopt relative TSR (RTSR) (38%, not tabulated), which captures a firm’s relative performance ranking within a selected peer group of firms. These results are consistent with prior studies examining the US setting (Abernethy et al., 2015; Ittner et al., 2003).
When it comes to accounting-based targets within LTI, a diverse array of targets are employed. Although we did not examine these more closely in our multivariate analysis, Figure 1 depicts the most used targets. 18 Among firms incorporating accounting-based performance targets, EPS (Earnings Per Share) is the predominant metric, employed by 63.7% of firms that use accounting metrics. This result is consistent with prior studies examining performance targets within the US setting (e.g. Abernethy et al., 2015; Ittner et al., 2003). Profitability ratios (such as return on equity) are the second most prevalent accounting metric (26.0%), followed by a limited use of cash flow targets such as free cash flow or funds from operations (3.6%), profit targets such as net profit after tax (2.3%) and revenue targets (2.3%).
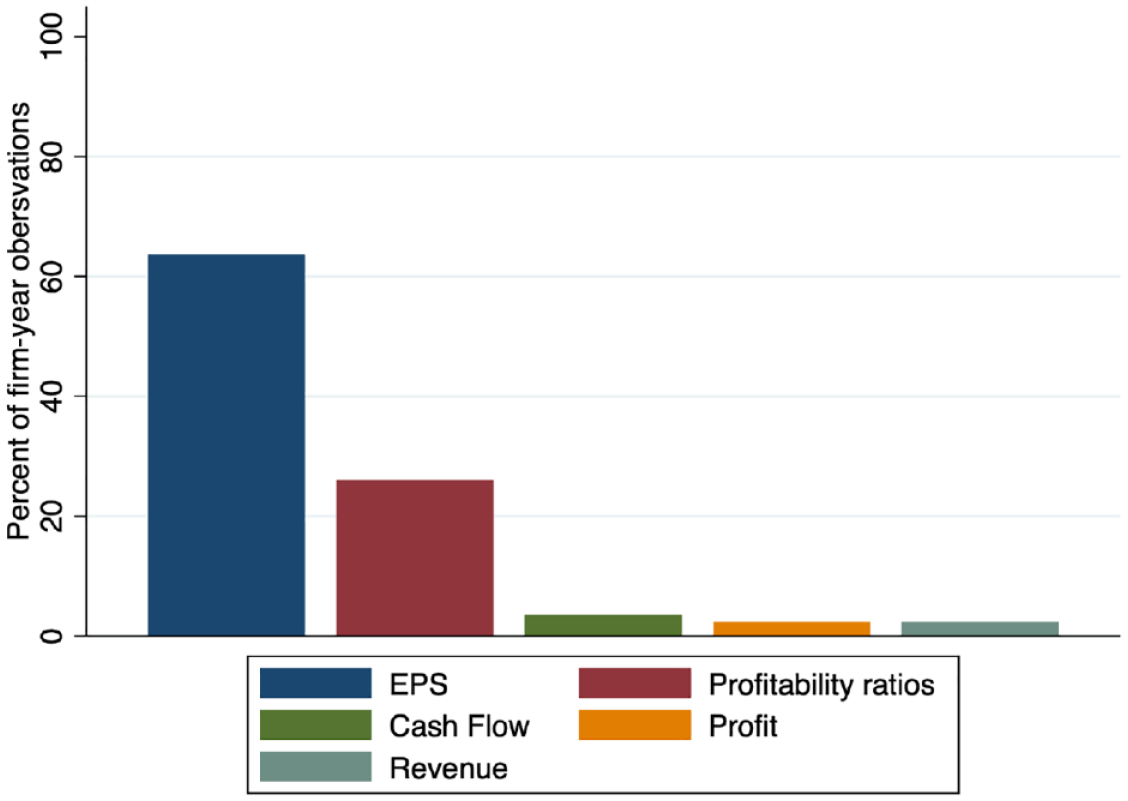
Visual representation of the types of performance targets within the LTI component that are directly linked to accounting numbers. Firms can use more than one, as a result, these are not mutually exclusive categories.
The primary independent variable in this study is Consultant. As illustrated in Panel A of Table 2, on average, 62% of firms within our sample engage a compensation consultant. 19 This representation is larger than that documented by Grosse et al. (2020), who found that 37.6% of their sample engage either a compensation consultant or advisor. 20 This difference likely reflects the inclusion of large listed firms within our sample as well as a longer sample period. The proportion of firms that do not engage a compensation consultant make up a greater proportion in the Australian setting compared to the United States and United Kingdom (e.g. Armstrong et al., 2012; Cadman et al., 2010; Chu et al., 2018; Conyon et al., 2019). Control variables capturing the economic characteristics of firms are largely in agreement with the extant literature (e.g. Conyon et al., 2019).
Panel B provides a univariate analysis between firms that engaged a compensation consultant and those that did not, indicating that in instances where a compensation consultant was engaged, 37% were engagements with a Big 4 firm. Figure 2 demonstrates that, over the sample period, the frequency with which firms sought advice from compensation consultants has remained relatively stable, though the tendency to engage a Big 4 consultant has seen a gradual increase. It is worth noting that the obligation to disclose the identity of the compensation consultant did not come into effect until 1 July 2011, a factor contributing to the observable surge in disclosures following the implementation of this regulation. 21
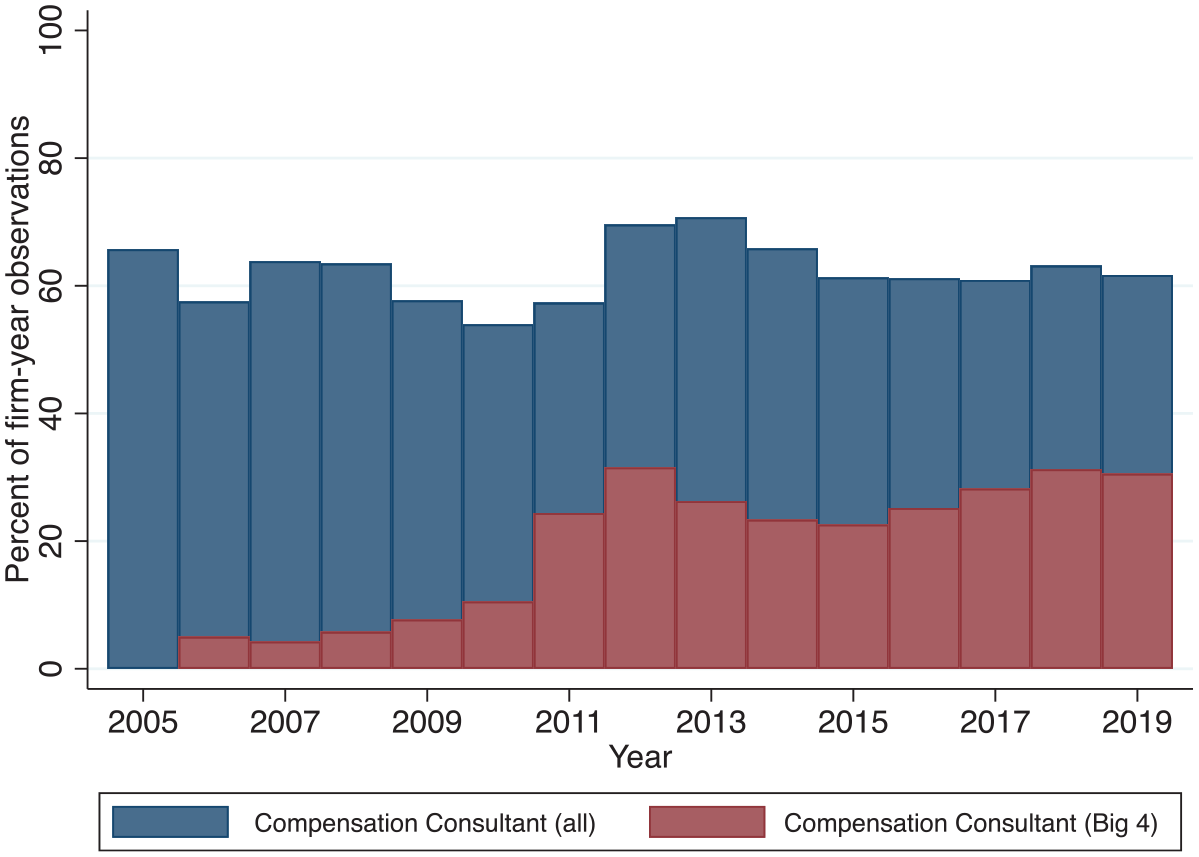
Visual representation of the market for compensation consultants over time.
Table 3 displays the correlation matrix for all variables used in our main analysis. Consultant is positively and significantly associated with STI_Quant and %LTI_Market, and negatively associated with STI_Undefined, providing initial support for H1a and H2a. No large correlations exist between variables used in the same analysis.
Correlation matrix.
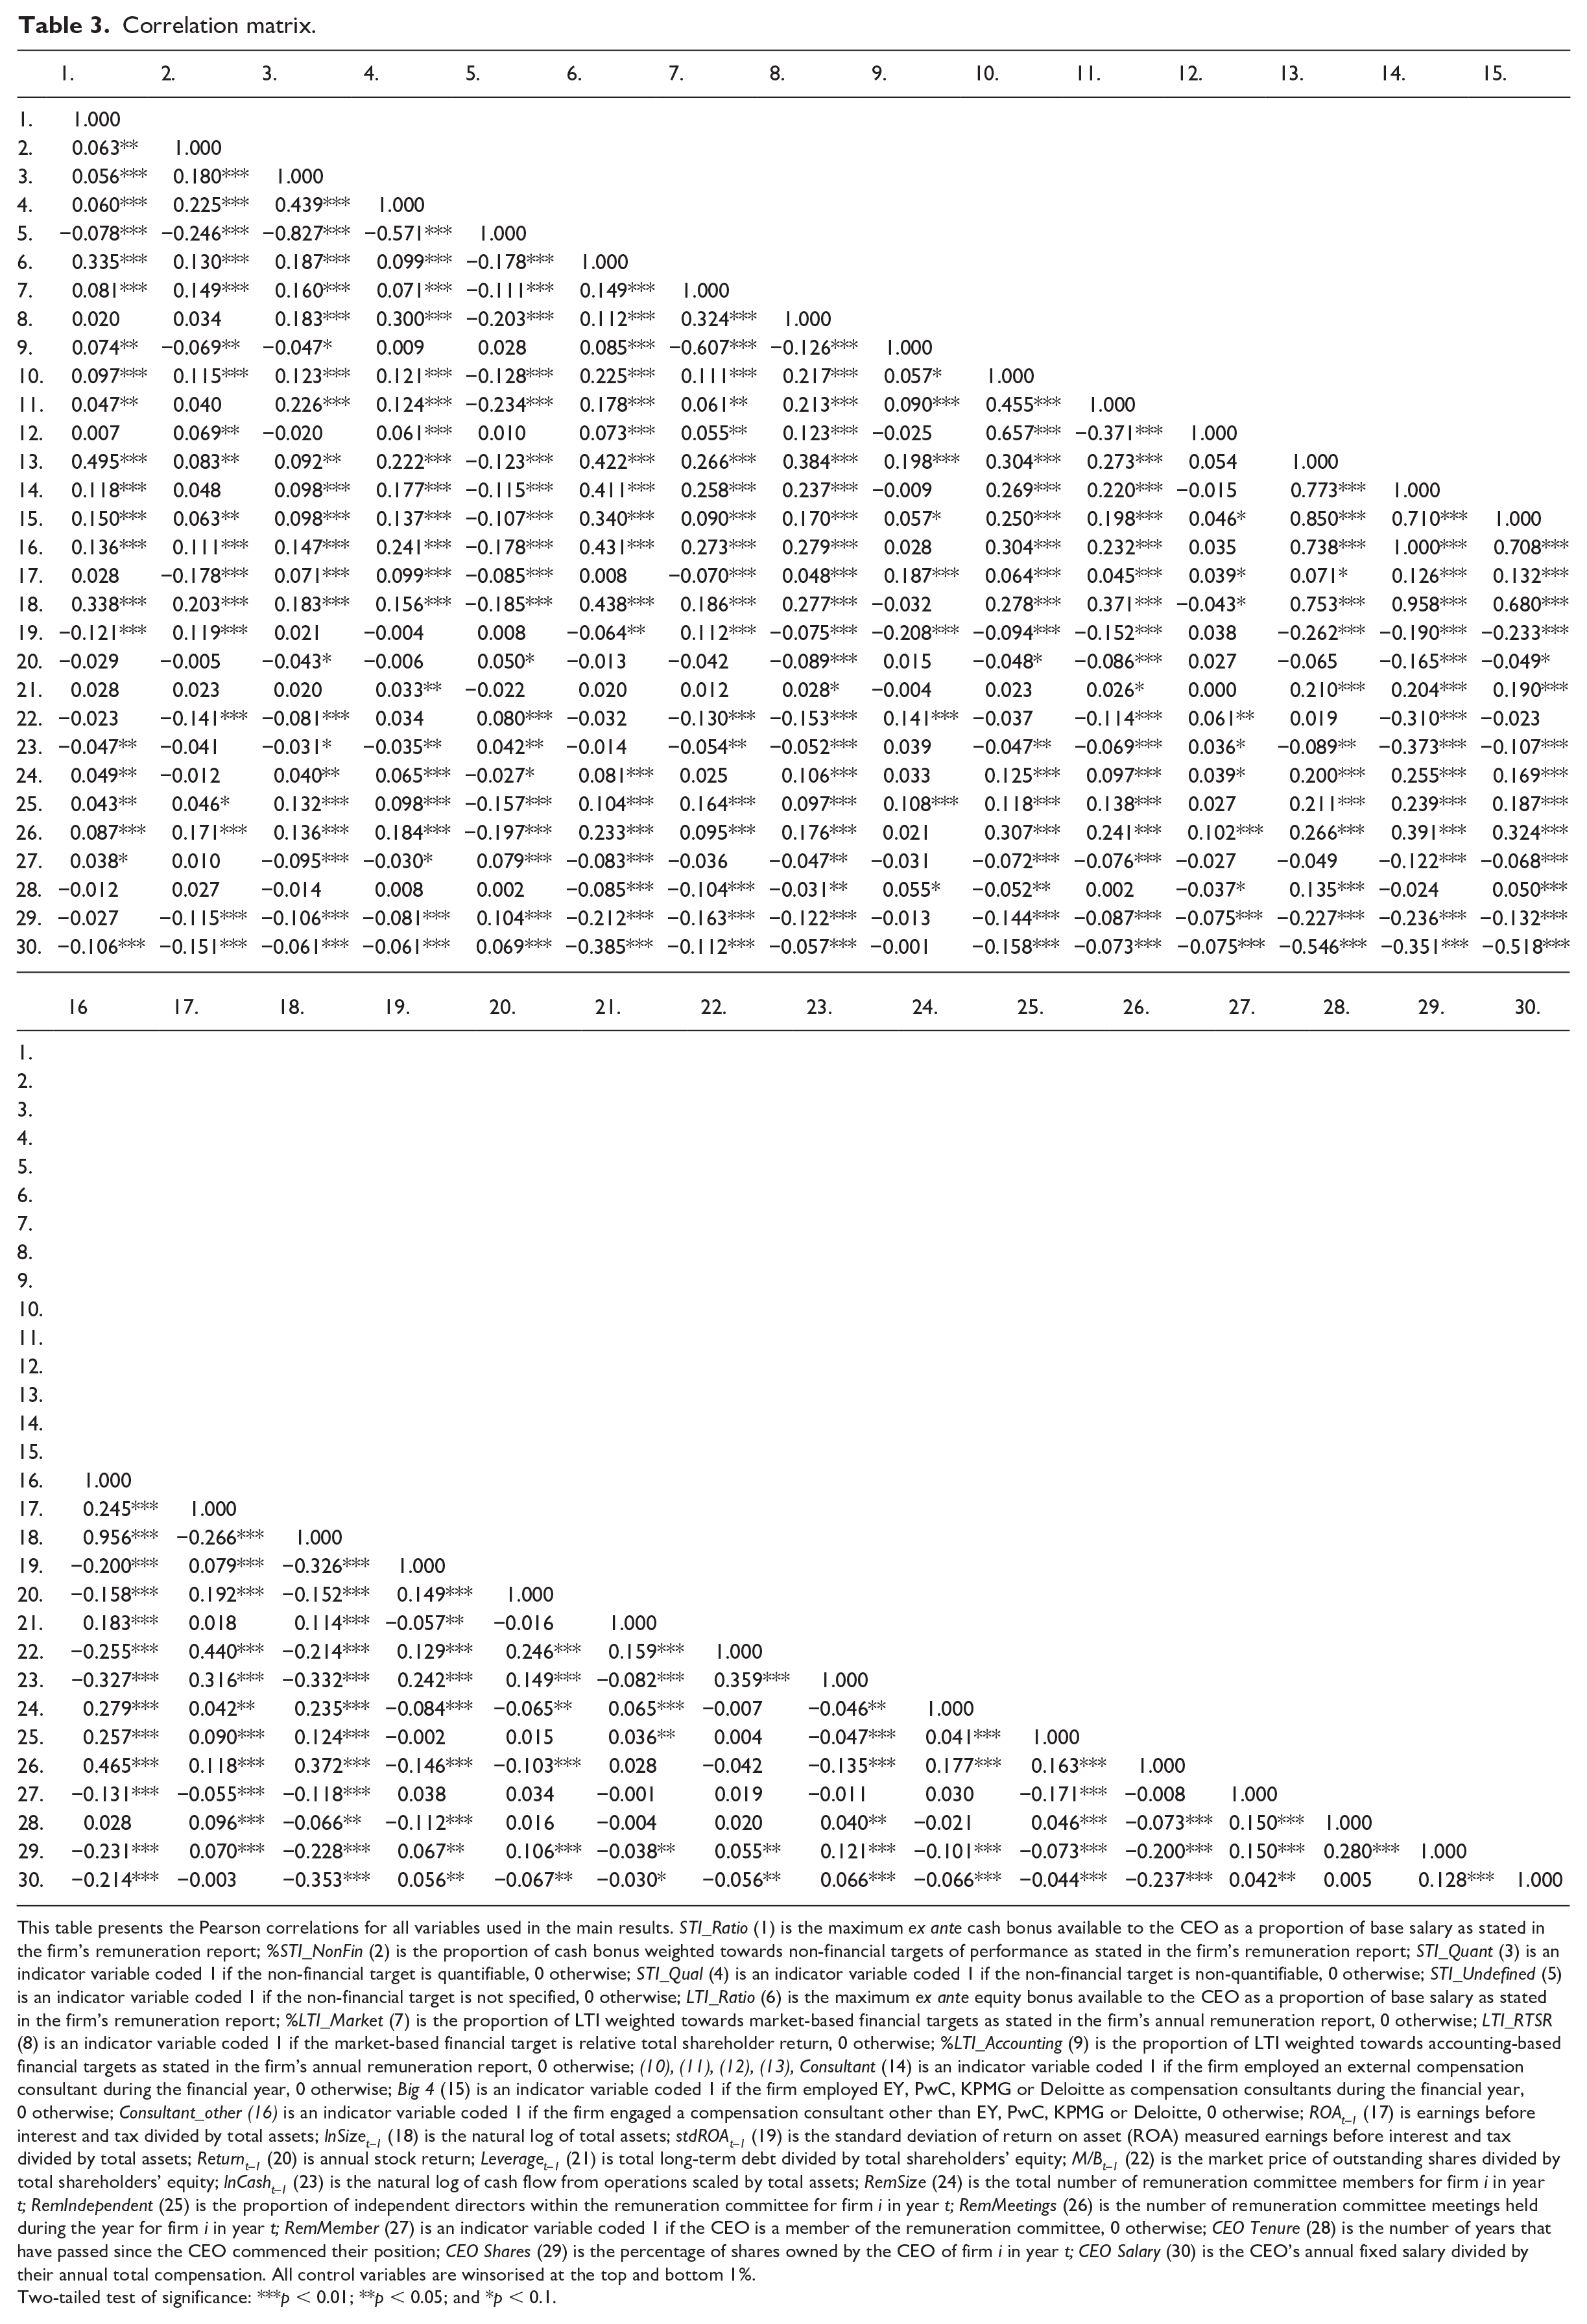
This table presents the Pearson correlations for all variables used in the main results. STI_Ratio (1) is the maximum ex ante cash bonus available to the CEO as a proportion of base salary as stated in the firm’s remuneration report; %STI_NonFin (2) is the proportion of cash bonus weighted towards non-financial targets of performance as stated in the firm’s remuneration report; STI_Quant (3) is an indicator variable coded 1 if the non-financial target is quantifiable, 0 otherwise; STI_Qual (4) is an indicator variable coded 1 if the non-financial target is non-quantifiable, 0 otherwise; STI_Undefined (5) is an indicator variable coded 1 if the non-financial target is not specified, 0 otherwise; LTI_Ratio (6) is the maximum ex ante equity bonus available to the CEO as a proportion of base salary as stated in the firm’s remuneration report; %LTI_Market (7) is the proportion of LTI weighted towards market-based financial targets as stated in the firm’s annual remuneration report, 0 otherwise; LTI_RTSR (8) is an indicator variable coded 1 if the market-based financial target is relative total shareholder return, 0 otherwise; %LTI_Accounting (9) is the proportion of LTI weighted towards accounting-based financial targets as stated in the firm’s annual remuneration report, 0 otherwise; (10), (11), (12), (13), Consultant (14) is an indicator variable coded 1 if the firm employed an external compensation consultant during the financial year, 0 otherwise; Big 4 (15) is an indicator variable coded 1 if the firm employed EY, PwC, KPMG or Deloitte as compensation consultants during the financial year, 0 otherwise; Consultant_other (16) is an indicator variable coded 1 if the firm engaged a compensation consultant other than EY, PwC, KPMG or Deloitte, 0 otherwise; ROAt–1 (17) is earnings before interest and tax divided by total assets; lnSizet–1 (18) is the natural log of total assets; stdROAt–1 (19) is the standard deviation of return on asset (ROA) measured earnings before interest and tax divided by total assets; Returnt–1 (20) is annual stock return; Leveraget–1 (21) is total long-term debt divided by total shareholders’ equity; M/Bt–1 (22) is the market price of outstanding shares divided by total shareholders’ equity; lnCasht–1 (23) is the natural log of cash flow from operations scaled by total assets; RemSize (24) is the total number of remuneration committee members for firm i in year t; RemIndependent (25) is the proportion of independent directors within the remuneration committee for firm i in year t; RemMeetings (26) is the number of remuneration committee meetings held during the year for firm i in year t; RemMember (27) is an indicator variable coded 1 if the CEO is a member of the remuneration committee, 0 otherwise; CEO Tenure (28) is the number of years that have passed since the CEO commenced their position; CEO Shares (29) is the percentage of shares owned by the CEO of firm i in year t; CEO Salary (30) is the CEO’s annual fixed salary divided by their annual total compensation. All control variables are winsorised at the top and bottom 1%.
Two-tailed test of significance: ***p < 0.01; **p < 0.05; and *p < 0.1.
4. Empirical results
4.1. Performance targets used in CEO compensation contracts
Table 4 reports the results of estimating Model (1), which examines the association between compensation consultants and the various performance targets used in CEOs’ STI.
Association between compensation consultants and STI compensation.
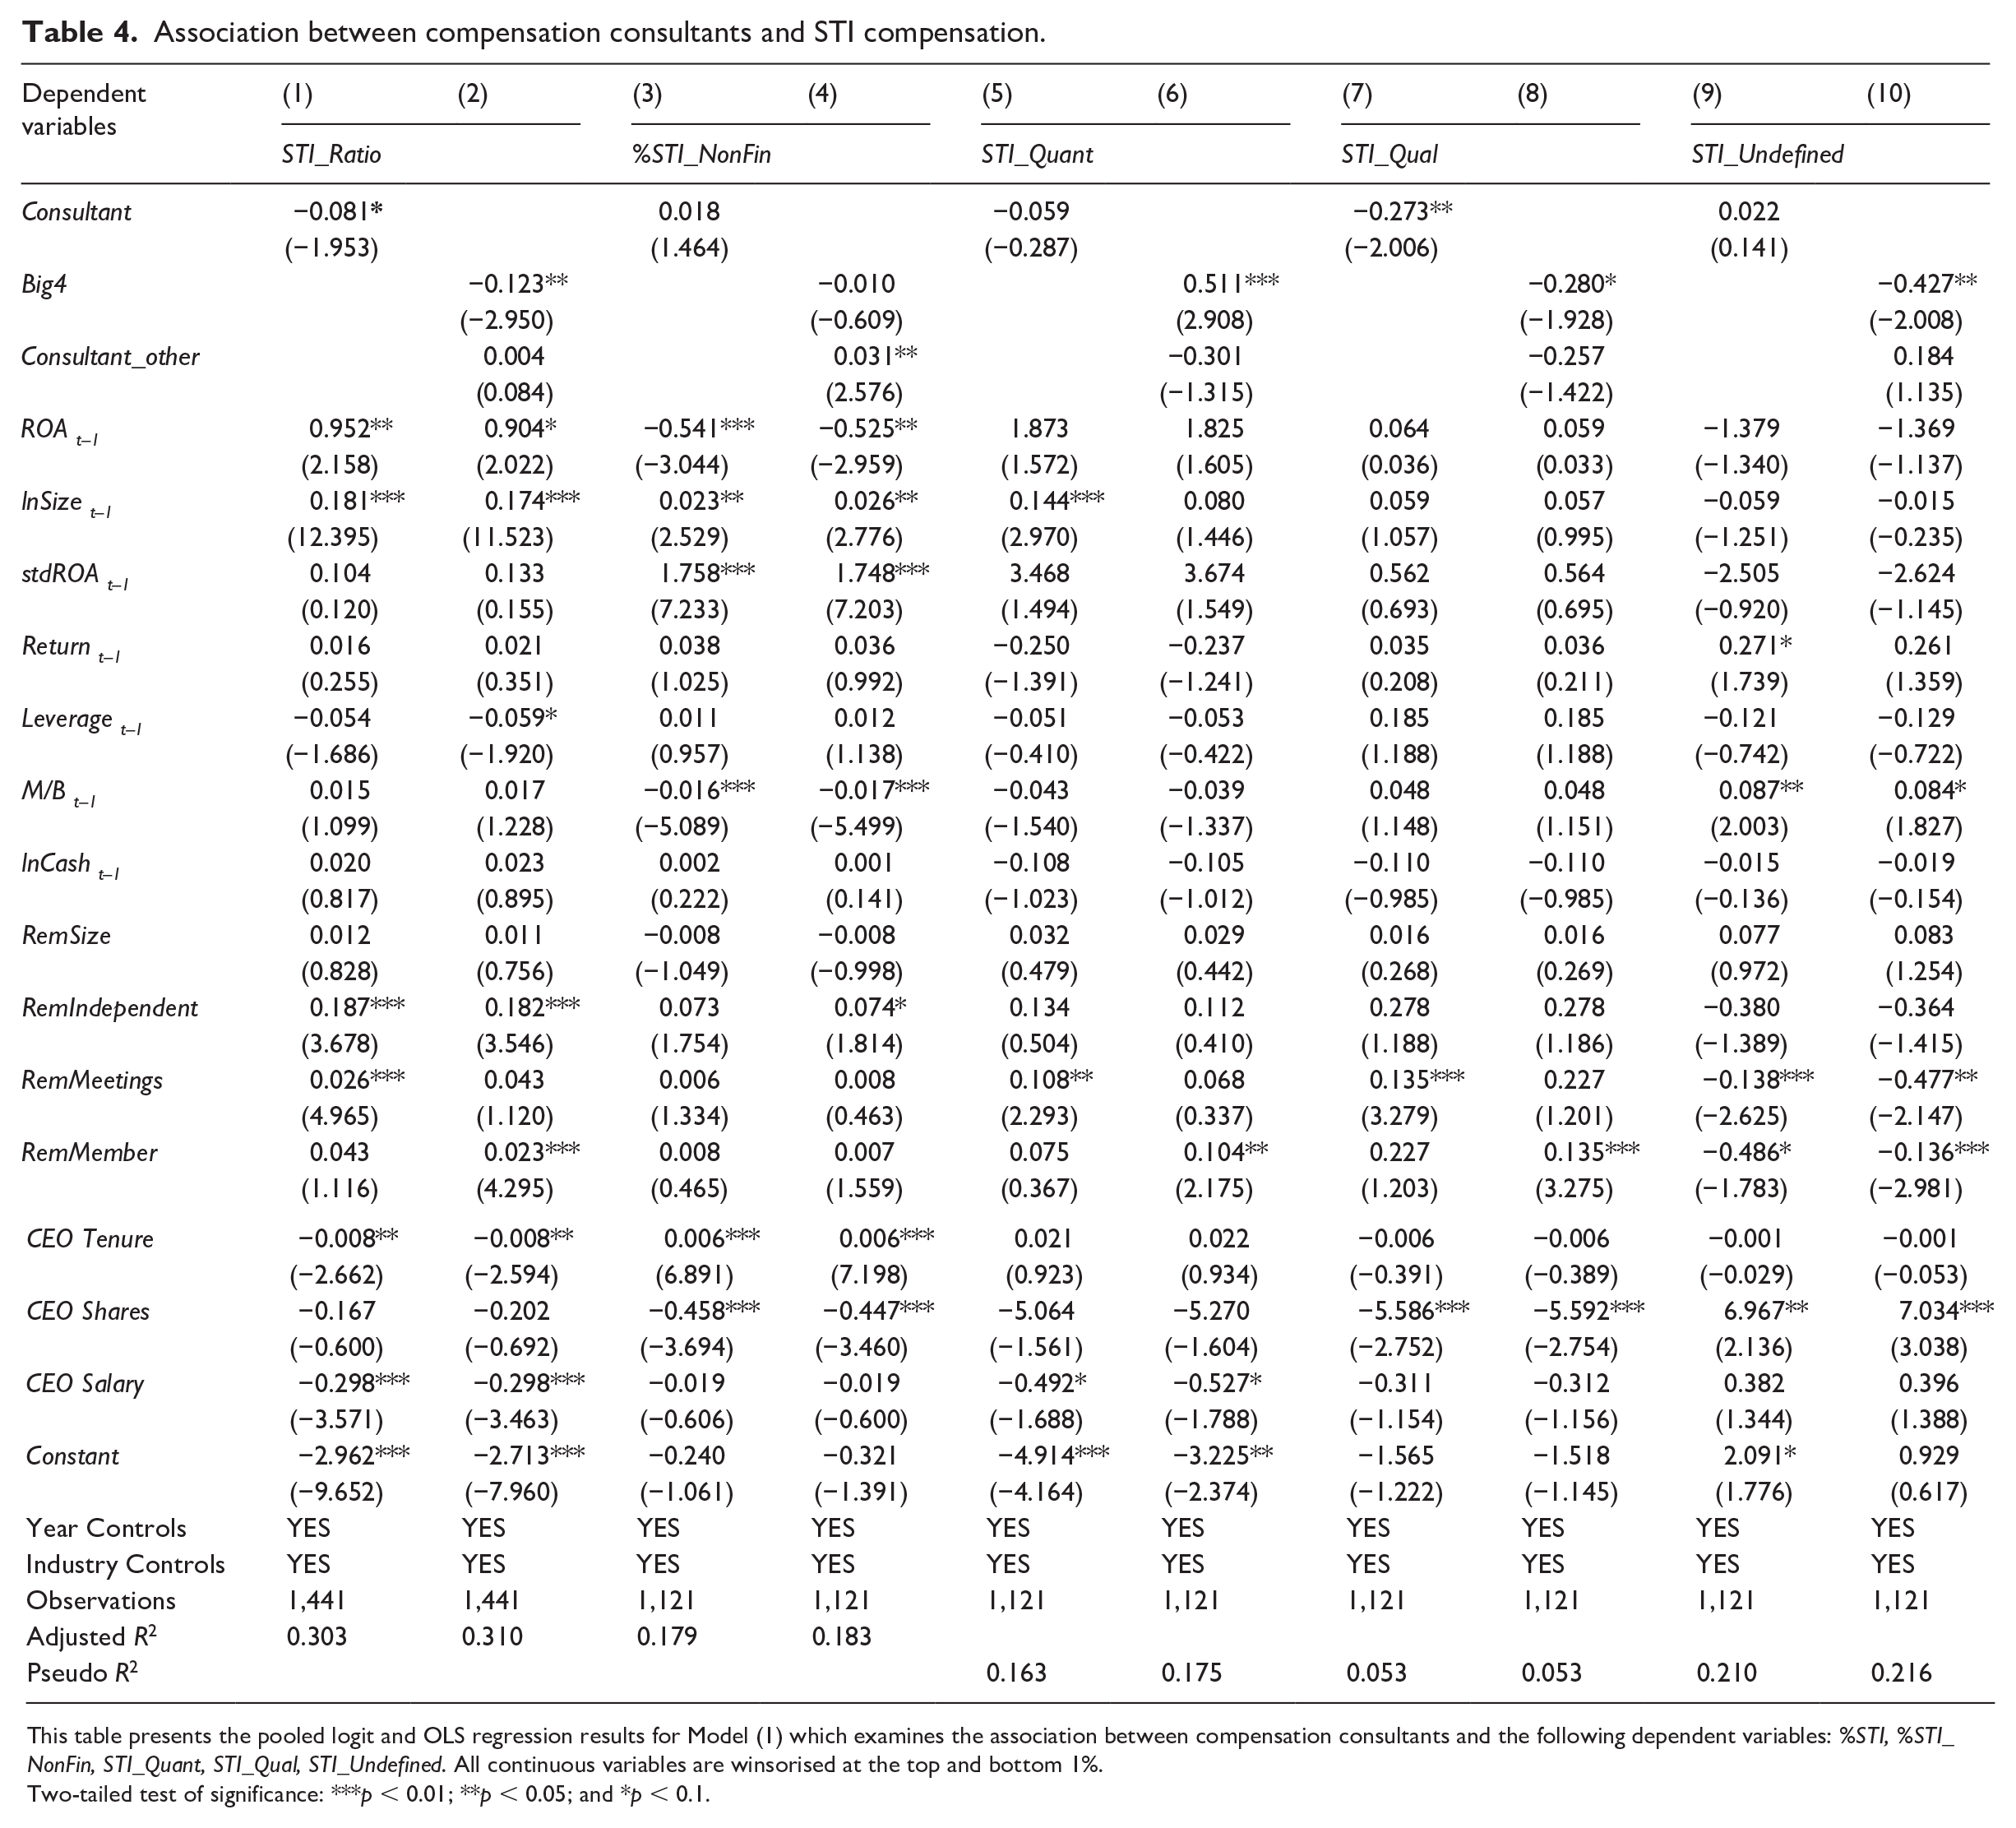
This table presents the pooled logit and OLS regression results for Model (1) which examines the association between compensation consultants and the following dependent variables: %STI, %STI_NonFin, STI_Quant, STI_Qual, STI_Undefined. All continuous variables are winsorised at the top and bottom 1%.
Two-tailed test of significance: ***p < 0.01; **p < 0.05; and *p < 0.1.
Focusing on the consultant variables (Consultant, Big4, and Consultant_other), the results in Table 4 suggest that firms engaging Big 4 accounting firms have different compensation arrangements compared to firms that engage other compensation consultants and firms that do not engage compensation consultants at all. Specifically, when considering non-financial targets on a spectrum from least to most explicit, Big 4 firms are less likely to incorporate undefined and qualitative targets (β = 0.427, p < 0.05; β=-0.280, p < 0.10), and more likely to include quantifiable targets (β= 0.511, p < 0.01) (Columns (6), (8) and (10)). This approach aligns with the ASX Corporate Governance Council’s guidelines and is consistent with the principles of efficient contracting theory (H1a). Such patterns are not evident in firms engaging other compensation consultancy firms.
These results are consistent with the findings reported in Grosse et al. (2020), suggesting a tendency among Big 4 accounting firms to mitigate CEO overcompensation relative to other compensation consultants, a finding of particular significance given the existing literature’s lack of consensus on the influence of compensation consultants on CEO compensation arrangements.
Table 5 focuses on the LTI component of CEO compensation, showing significant differences across the types of compensation consultants. First, consistent with evidence from prior research (e.g. Armstrong et al., 2012; Cadman et al., 2010; Grosse et al., 2020; Murphy and Sandino, 2010), we found that compensation consultants are associated with greater ex ante LTI compensation, as shown in Column (1). This effect is pronounced for Big 4, as shown in Column (2) (β= 0.086, p < 0.05). Moreover, the Big 4 assign a greater proportion of the LTI towards market-based performance targets (β= 0.077, p < 0.05), which are less susceptible to manipulation (Abernethy et al., 2015), and are more likely to use relative total shareholder return (LTI_RTSR) as the market-based performance target (β = 1.522, p < 0.01). RTSR, as a performance target, is designed to mitigate paying CEOs for luck by adjusting for broad economic and industry-specific cycles, thereby focusing on company-specific achievements. We found no significant result on the weighting towards accounting-based targets, consistent with prior evidence examining accounting-based hurdles in stock options (Qu et al., 2018). 22 Collectively, the results in Table 5 provide support for H2a, but specifically within the context of the Big 4 firms. When considered alongside the results reported in Table 4, on average, Big 4 accounting firms appear to encourage more efficient contracting practices between firms and CEOs, distinguishing them from other compensation consulting providers.
Association between compensation consultants and LTI compensation.

This table presents the pooled logit and OLS regression results for Model (1) which examines the association between compensation consultants and the following dependent variables: LTI_Ratio; %LTI_Market, LTI_RTSR and %LTI_Accounting. Variable definitions are provided in the Appendix 1. Observations vary across tests due to missing compensation information and/or compensation consultant data. All control variables are winsorised at the top and bottom 1%.
Two-tailed test of significance: ***p < 0.01; **p < 0.05; and *p < 0.1.
4.2. Pay-for-performance
Table 6 displays the results of estimating Model (2), which examines any variance in the pay-for-performance relation between firms that engage compensation consultants and firms that do not.
Compensation consultants and pay-for-performance.

This table presents the pooled logit and OLS regression results for Model (2) which examines the pay-for-performance association and includes the following dependent variables: Total Pay, Variable Pay, STI, LTI. Variable definitions are provided in the Appendix 1. All control variables are winsorised at the top and bottom 1%.
Two-tailed test of significance: ***p <0.01; **p <0.05; and *p <0.1.
First, it is worth noting that ROA is positive and significant across all compensation components, indicating that ROA, as expected, significantly influences realised pay by CEOs. This effect is largely driven by the LTI component, as evidenced by the large coefficients (β = 4.098, p < 0.01 and β = 1.907, p < 0.05 in Columns (7) and (8), respectively).
Our key variables of interest are the interaction terms between ROA and the different consultant variables. If compensation consultants facilitate efficient CEO compensation contracts, changes in CEO wealth should be positively related to changes in firm performance (and therefore shareholder wealth). Notably, when focusing on compensation consultants in general, negative coefficients are observed on the interaction terms in relation to total, variable, and equity pay (Columns (1), (3), and (7)), which suggest that factors other than firm performance may be influencing realised pay.
Interestingly, this pattern is predominantly attributed to compensation consultants outside the Big 4 accounting firms. This result is consistent with findings from Table 5, which highlighted a tendency among the Big 4 to avoid performance targets that are subject to managerial influence and to favour more market-based and relative performance targets in the LTI component. Consequently, it is not surprising that firms receiving remuneration advice from consulting firms other than the Big 4 exhibit a diminished pay-for-performance relation. Overall, these results suggest a lower pay-for-performance relation in firms engaging non-Big4 compensation consultants, providing support for H3b. Taken together, these results suggest that compensation consultants differ in their recommendations with respect to CEO compensation contracts.
5. Additional analysis and robustness checks
5.1. Addressing endogeneity
Acknowledging the potential endogeneity of compensation consultant engagement due to firms’ economic characteristics, we employed entropy balancing to address these concerns. This method ensures that observations are matched such that they differ in their engagement of a compensation consultant (or a Big 4 firm), but are otherwise comparable in terms of industry, year and economic characteristics. Accordingly, we can more accurately attribute any differences in the design of CEO compensation to the use of a compensation consultant (or Big 4 firm) rather than to other covariates (Armstrong et al., 2012).
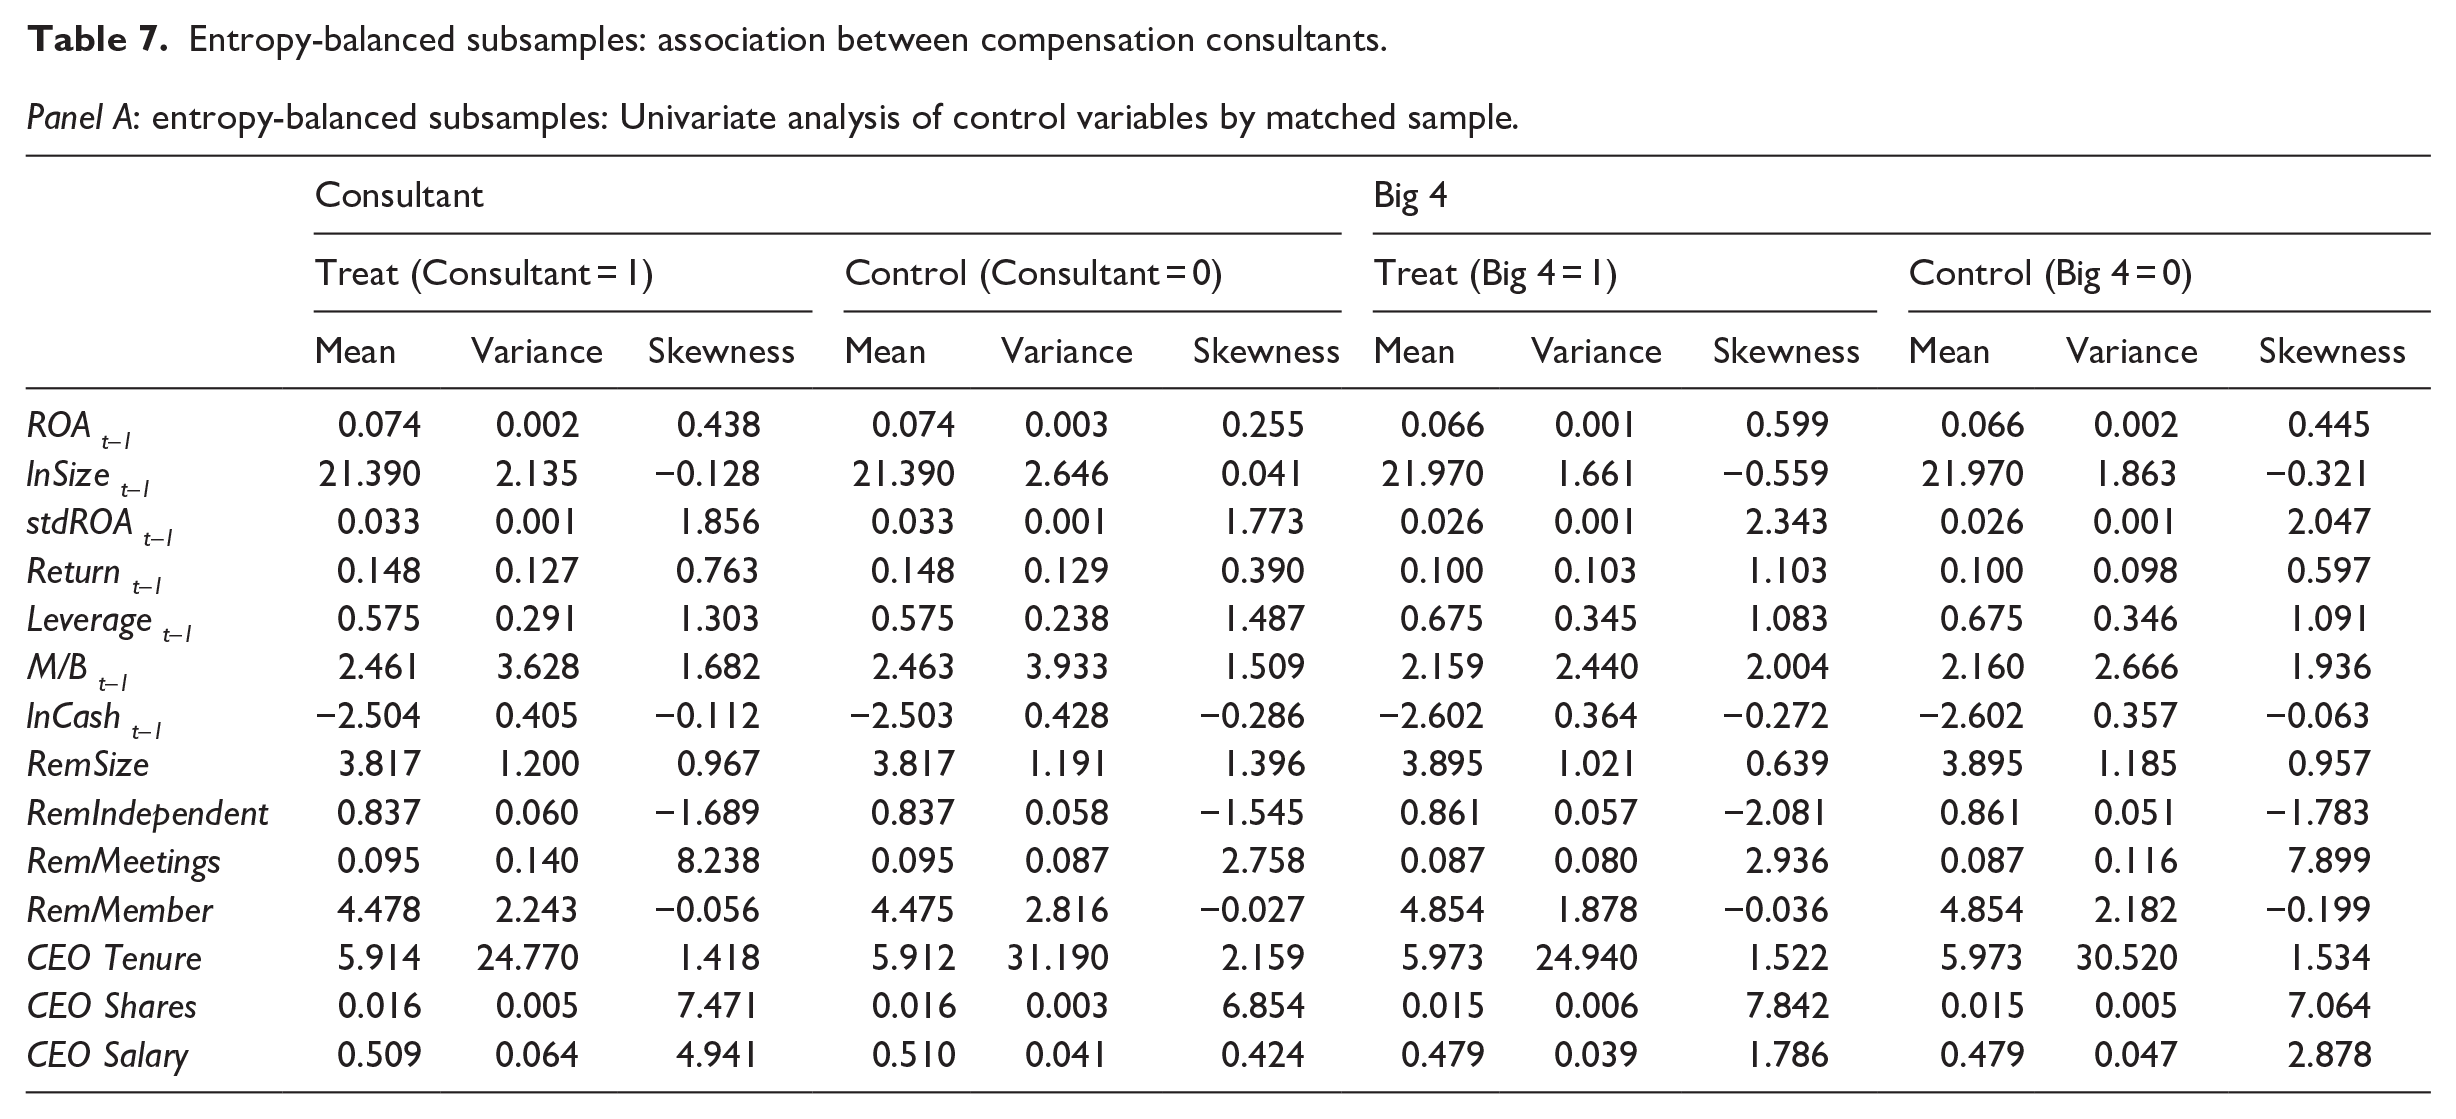
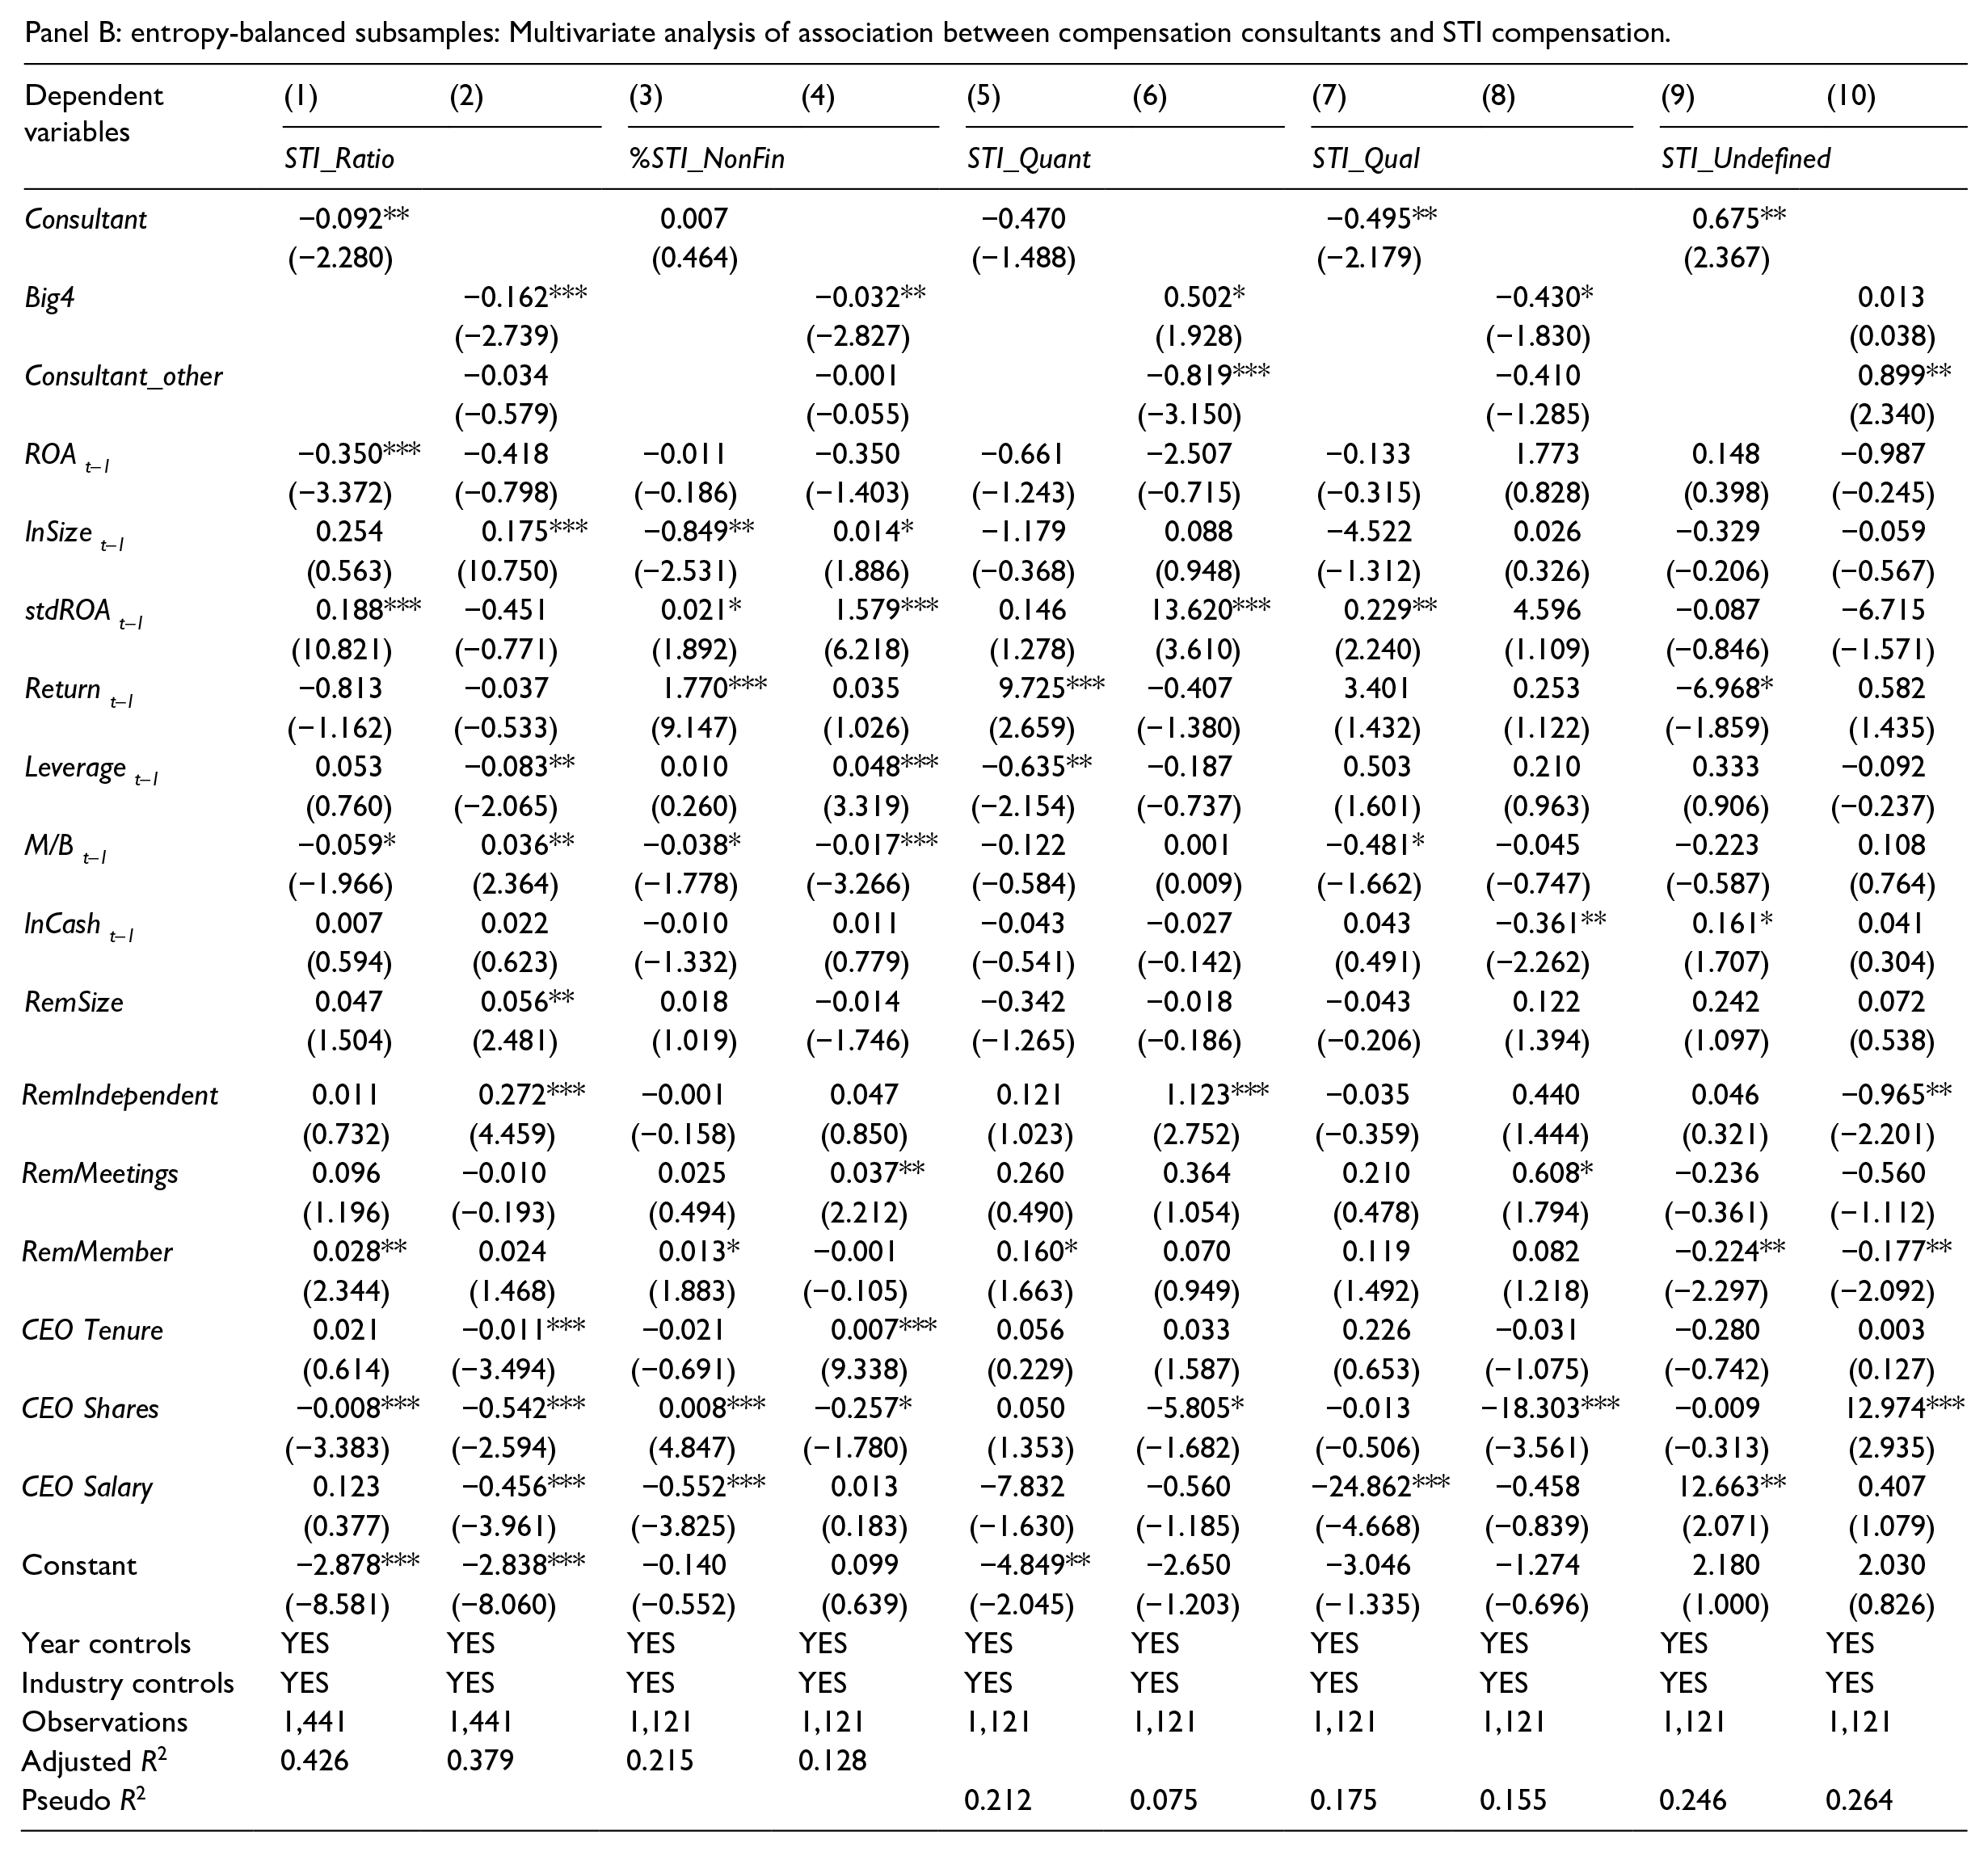
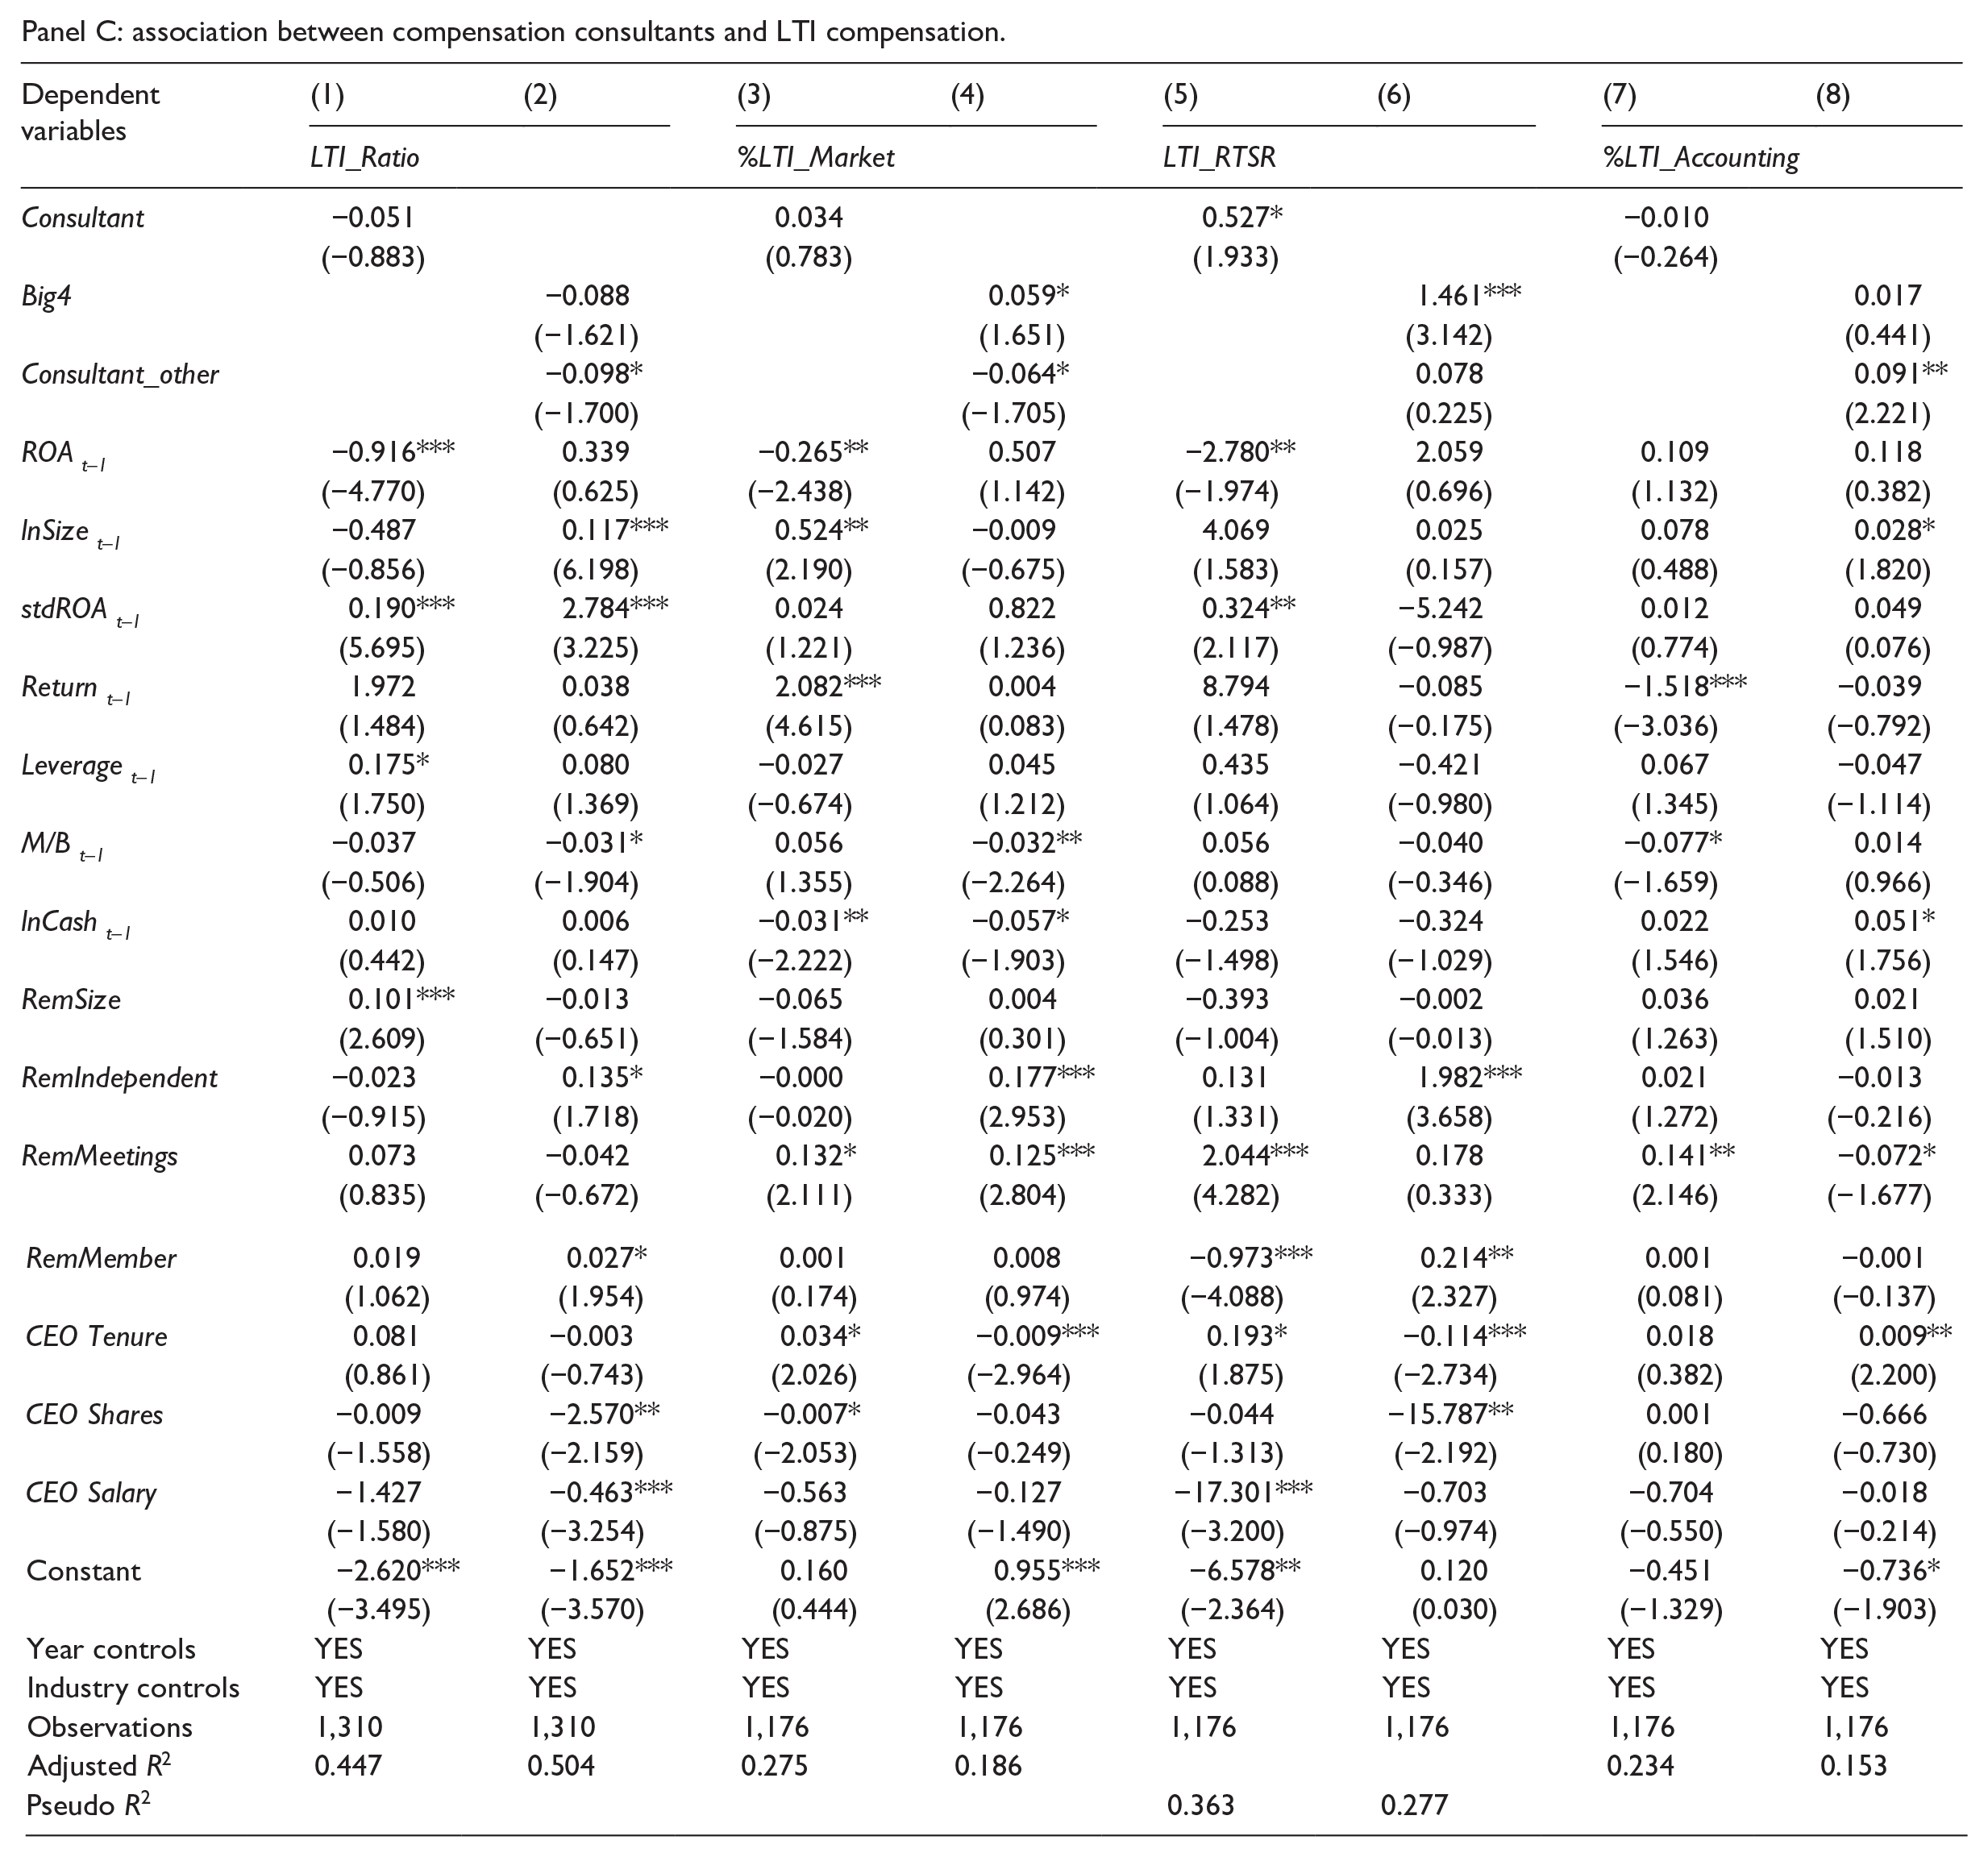
Table 7, Panel A, presents an overview of the various control variables after entropy balancing. All controls are consistent across the subsamples after matching. Panel B provides results of estimating Model (1), which examines the association between compensation consultants and STI, while Panel C provides the results of the LTI component. Overall, the findings across both Panels B and C are consistent with our main results presented in Tables 4 and 5, affirming the robustness of our conclusions.
Entropy-balanced subsamples: association between compensation consultants.
Panel A: entropy-balanced subsamples: Univariate analysis of control variables by matched sample.
Panel B: entropy-balanced subsamples: Multivariate analysis of association between compensation consultants and STI compensation.
Panel C: association between compensation consultants and LTI compensation.
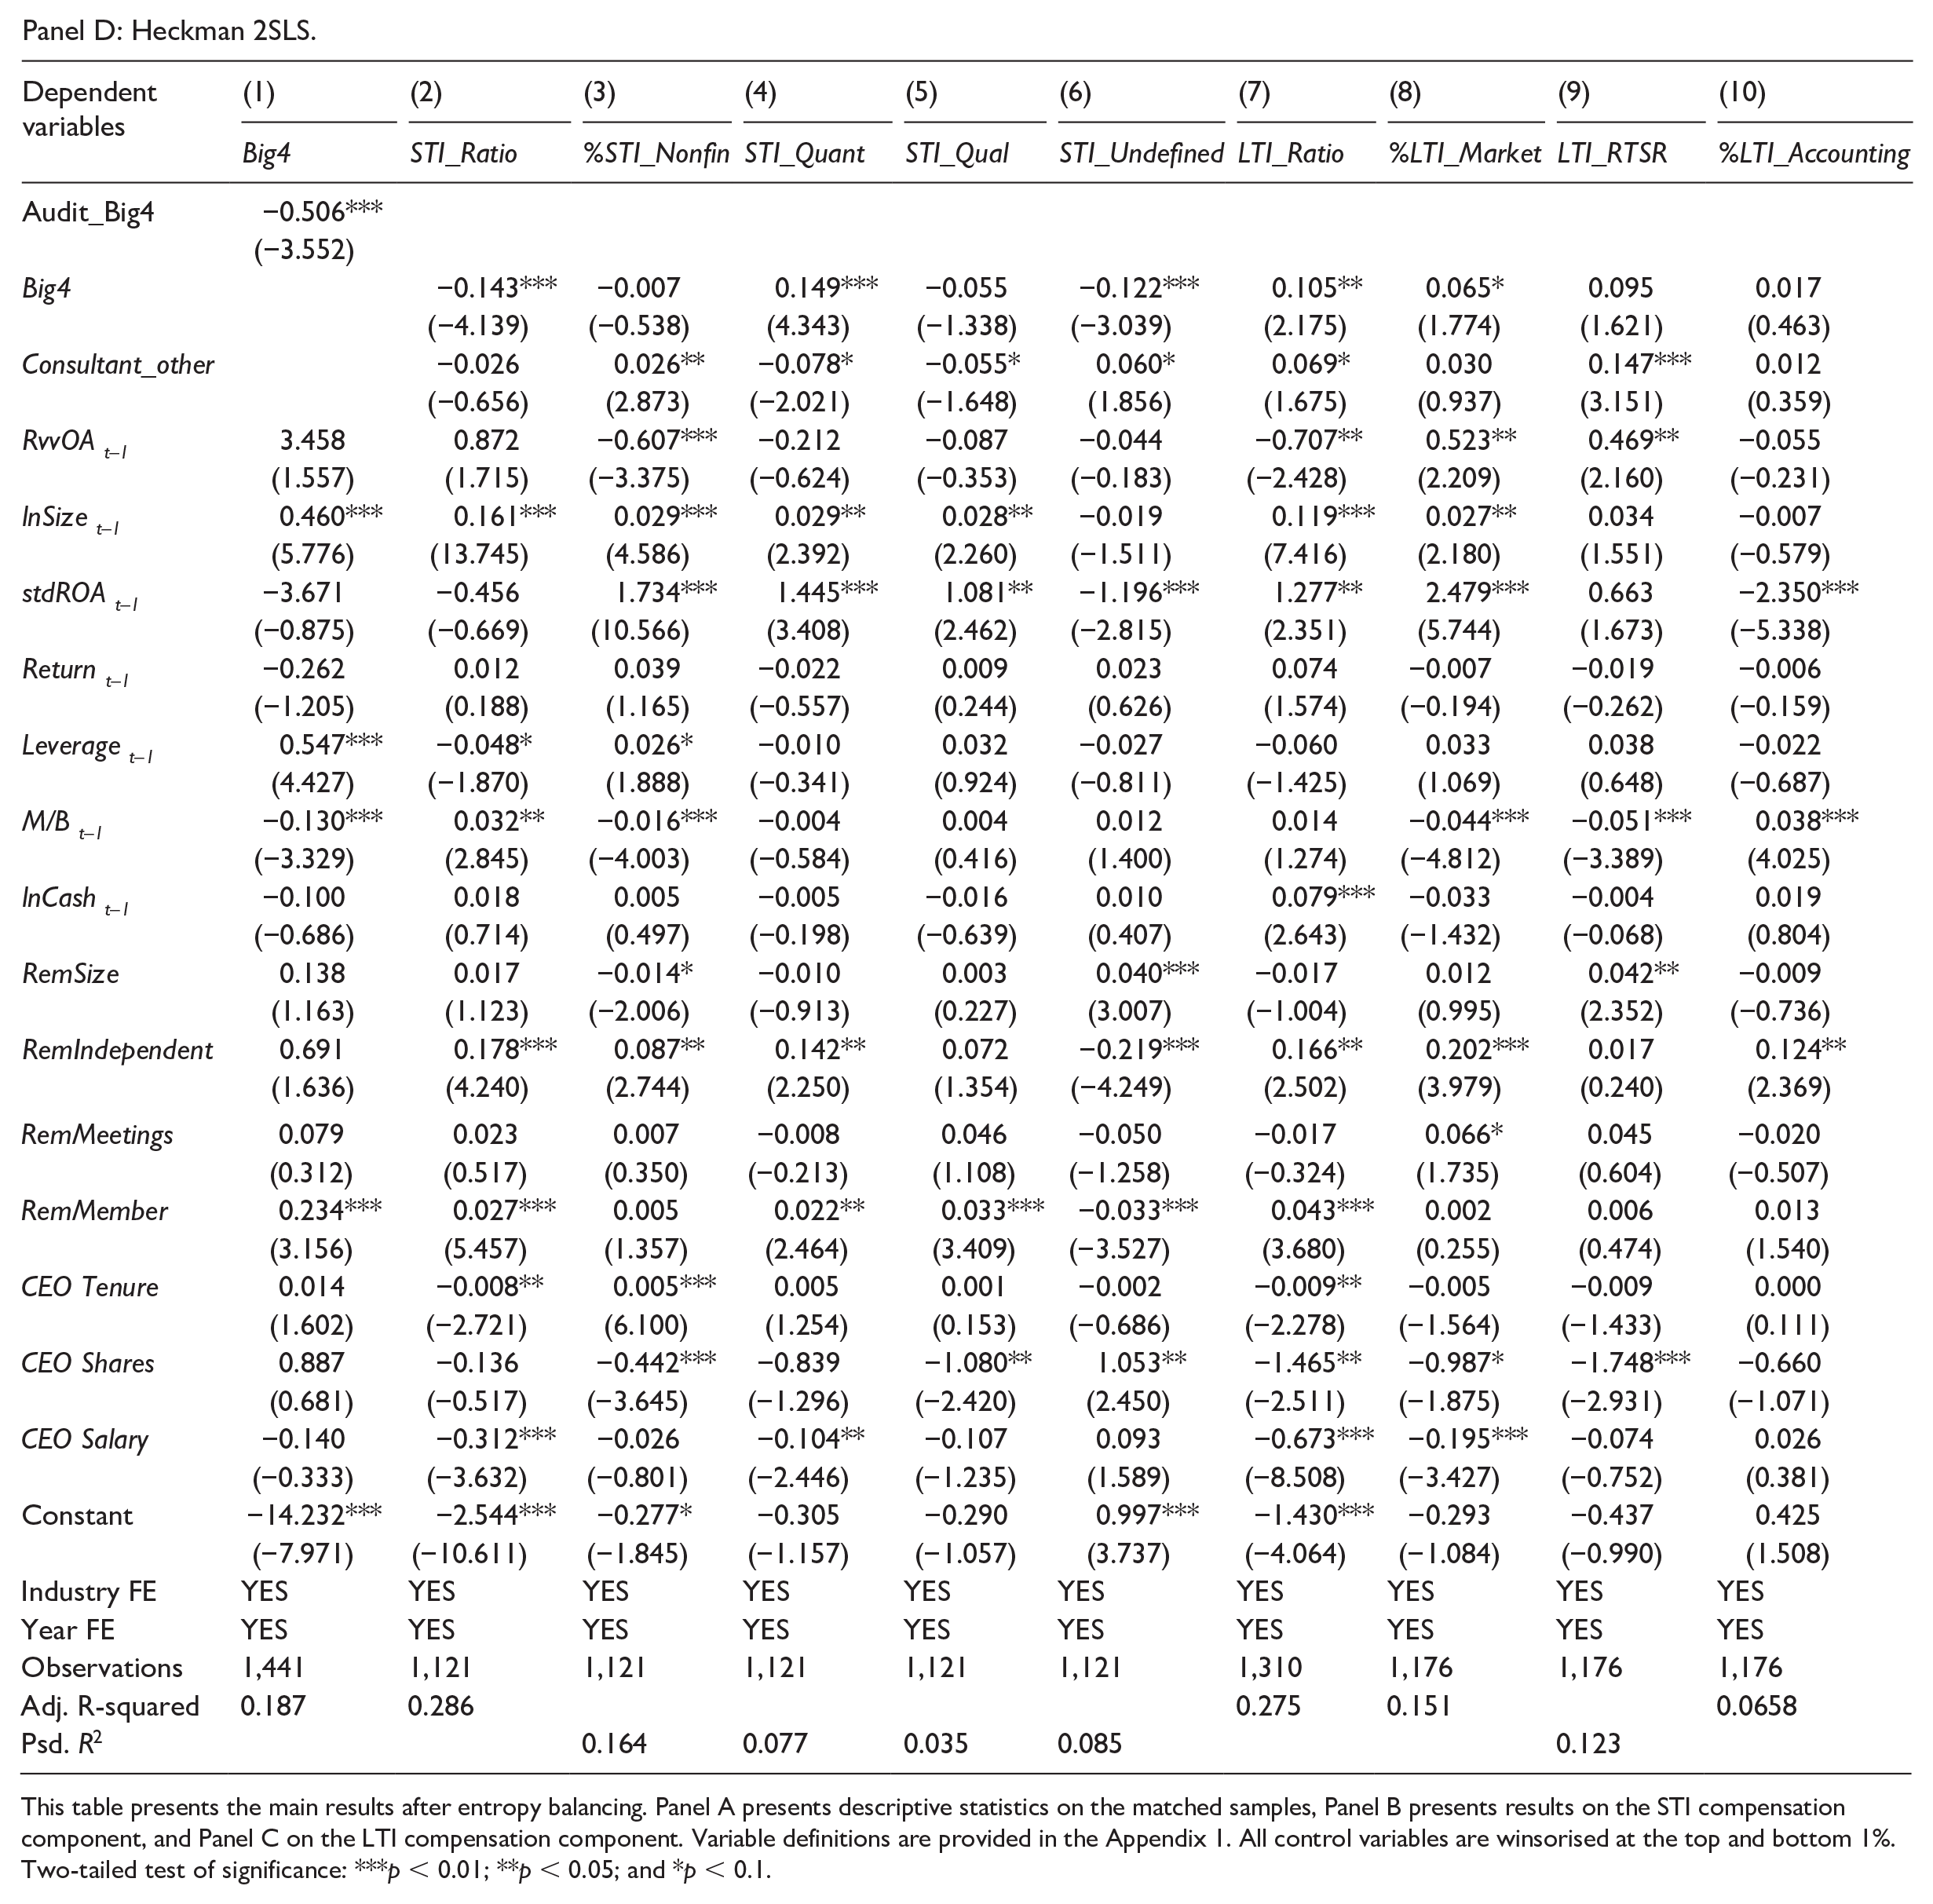
Panel D: Heckman 2SLS.
This table presents the main results after entropy balancing. Panel A presents descriptive statistics on the matched samples, Panel B presents results on the STI compensation component, and Panel C on the LTI compensation component. Variable definitions are provided in the Appendix 1. All control variables are winsorised at the top and bottom 1%.
Two-tailed test of significance: ***p < 0.01; **p < 0.05; and *p < 0.1.
An alternative method to address endogeneity is a 2-stage Heckman estimation. Cadman et al. (2010) applied this method in the US setting, using the number of reported business segments as the instrumental variable to proxy for firm complexity. However, given the challenges in obtaining such data within the Australian setting due to limited disclosures, we followed Bachmann et al. (2020) and use a firm’s choice of auditor as an alternative instrumental variable. This decision is premised on the expectation that the decision to hire a Big 4 accounting firm to audit the financial statements, influences the selection of a Big 4 accounting firm as the compensation consultant. As illustrated in Table 7, Panel C, the results remain largely consistent with our main findings reported in Tables 4 and 5. 23
5.2. Additional tests
5.2.1. Regulatory changes
It could be that amendments to the Australian Corporations Act, aimed at enhancing compensation disclosure transparency and scrutiny, resulted in changes to the way CEOs were compensated. These regulatory changes came into effect on 1 July 2011, therefore we repeated our analyses on subsamples of firms before and after the year 2011. Results (not tabulated) remain largely consistent with our main findings, even in the post-legislation environment and after we re-estimated our analyses using entropy balanced subsamples. 24
5.2.2. Opinion shopping
We considered the possibility that our results may be driven by firms engaging in ‘opinion shopping’ among compensation consultants to secure favourable compensation arrangements (Grosse et al., 2020). This may be the case when firms receive advice from multiple compensation consultants in the same financial year. We repeated our analyses after excluding 151 firm-year instances where multiple compensation consultants were engaged. Results (not tabulated) remain consistent with our main findings. Another approach to address these concerns is to examine changes in compensation arrangements for firms that switched to engaging a compensation consultant after a period of not engaging one, or firms that switched between compensation consultants. However, due to a very limited sample size, we were unable to perform this additional analysis.
5.2.3. Pay for luck
We extended our examination of pay-for-performance dynamics by estimating Model (2) with a relative-based performance target (BEAT_ROA) to assess whether firms outperform their industry averages. This approach aims to address concerns around compensating CEOs for external factors beyond their control (i.e. pay for ‘luck’). To measure relative performance, we grouped firms into industry-year-size portfolios using the median value of total assets within each industry-year. BEAT_ROA is equal to 1 if ROA of firm i in year t is greater than the industry-size mean ROA, and 0 otherwise. We replaced ROA in Model (2) with BEAT_ROA. The results (not tabulated) are consistent with our main findings reported in Table 7. We found no significant association on the interaction between BEAT_ROA and consultant apart from LTI where it is negative and significant (β = −0.152, p < 0.01). This result is driven by non-Big 4 consultants which exhibit a negative coefficient on the interaction term with BEAT_ROA for LTI (β = −0.228, p < 0.01). Big 4 consultants, however, demonstrate no significant differences from firms that do not engage a compensation consultant.
5.2.4. Market leader effect
Given EY and PwC are the largest two providers of remuneration advice in our sample, it could be that the results on Big 4 accounting firms are capturing a ‘market leader’ effect among compensation consultants. To examine whether this is the case, we repeated our analyses for the third largest provider of remuneration advice, Guerdon Associates, which has a similar market share to PwC (10.00% and 10.78%, respectively). Results (not tabulated) show that Guerdon Associates behaves the same as other non-Big 4 consultants in our sample, despite having a market share similar to PwC. These results suggest that Big 4 accounting firms behave differently to other compensation consultants of a similar size (number of engagements) and confirm the conclusions from our main analysis.
6. Conclusion
We examined the types of performance targets associated with compensation consultants and whether differences exist in the pay-for-performance relation between firms that engage compensation consultants and those that do not. Based on a sample of ASX 500 firms that provide detailed disclosures on CEO STI and LTI compensation, we documented diversity in remuneration practices between firms that receive advice from Big 4 compensation consultants and those that do not.
Big 4 accounting firms appear to recommend remuneration packages that adhere to measurable and explicit targets within CEOs’ STI, thereby adhering to recommendations by the ASX Governance Council and frameworks provided in the academic literature. Within the LTI component, Big 4 accounting firms are also more likely to incorporate market-based performance targets that are aligned with shareholder wealth and less likely to be manipulated ex post. This includes greater use of relative total shareholder return as a performance target, which reduces the propensity to pay CEOs for luck (i.e. market- or industry-wide factors affecting performance that are outside of their control).
The insights derived from our study hold relevance for regulators and academics, offering a nuanced understanding of the role of compensation consultants in facilitating efficient contracting. The observed variance among compensation consulting firms underscores the potential influence of a consultant’s reputational capital on the efficacy of CEO compensation contracts and highlights a potential explanation for mixed findings in the extant literature regarding the effect of compensation consultants on CEO pay.
Notwithstanding, we acknowledge a limitation of our study, particularly concerning the sample’s reliance on firms providing comprehensive CEO compensation disclosures, which may restrict the generalisability of the findings. Accordingly, we are unable to comment on firms that withhold this information. Future research may wish to replicate our study in different institutional settings and markets to determine whether our findings in relation to Big 4 accounting firms hold, particularly in the United Kingdom where these firms account for approximately 20% of engagements (Conyon et al., 2019). There is also scope to examine the effects and drivers of changes in the engagement of compensation consultants in settings that provide adequate variation, as well as empirically examining the consequences of having the same consulting firm provide both audit services and compensation advice (e.g., Tadros and Poljak 2019), or the implications of engaging more than one compensation consultant at a time. Last, given Big 4 accounting firms appear to facilitate efficient compensation arrangements, scholars may wish to investigate market reactions to initial engagements of Big 4 accounting firms as compensation consultants to determine whether the market perceives the quality-of-service provision to be value enhancing.
Key practical and research implications
• The market for compensation consulting services in Australia is concentrated with approximately 40% of ASX500 firms employing one of the Big 4 accounting firms as their compensation consultant or advisor between the years 2005 and 2019.
• Firms that engage a Big 4 accounting firm incorporate different types of performance targets in CEOs’ compensation contracts compared to firms engaging other compensation consultants providing a potential explanation for mixed findings in the extant literature regarding the effect of compensation consultants on levels of CEO pay. This highlights the importance of a nuanced treatment of these firms in academic research.
• Firms engaging a Big 4 accounting firm for compensation consulting services are more likely to adopt explicit non-financial targets that are quantifiable and clearly defined within the CEO’s short-term incentive plan and more likely to incorporate relative performance targets that help mitigate pay for ‘luck’ within the long-term incentive plan. These types of targets are less susceptible to manipulation ex post therefore encourage efficient contracting.
• Future research may wish to replicate our study in different institutional settings and markets where the Big 4 accounting firms represent a smaller proportion of the market as well as examining the consequences of having the same consulting firm provide both audit services and compensation advice or the implications of engaging more than one compensation consultant at a time.
Footnotes
Appendix
Definition of variables.
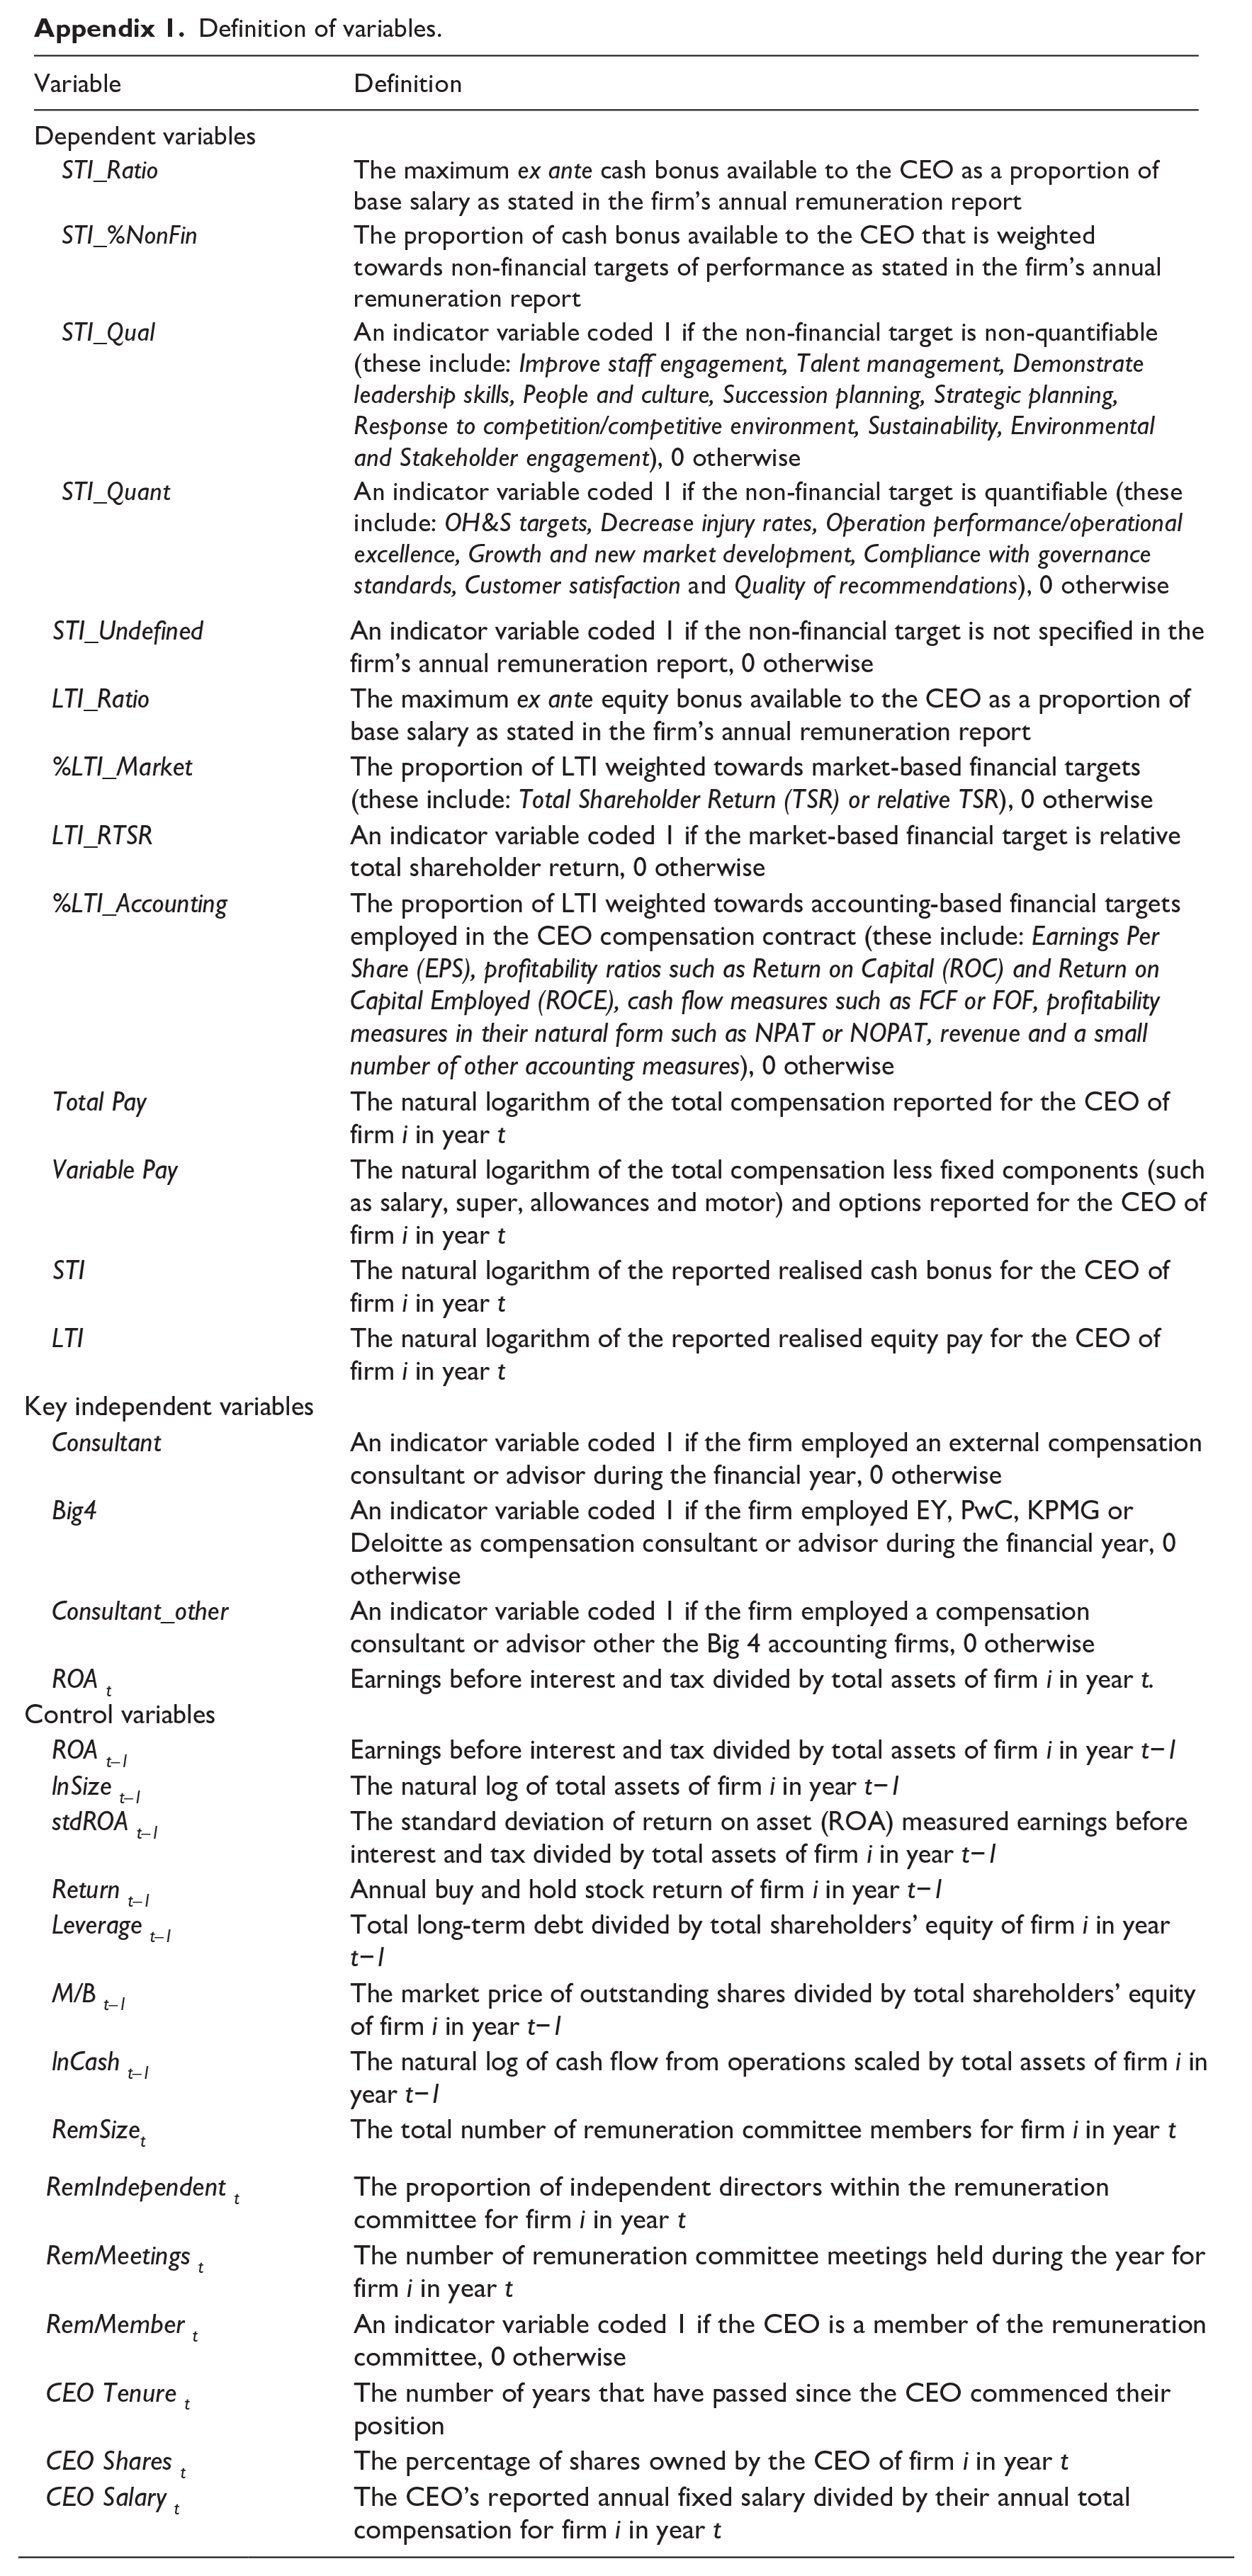
| Variable | Definition |
|---|---|
| Dependent variables | |
| STI_Ratio | The maximum ex ante cash bonus available to the CEO as a proportion of base salary as stated in the firm’s annual remuneration report |
| STI_%NonFin | The proportion of cash bonus available to the CEO that is weighted towards non-financial targets of performance as stated in the firm’s annual remuneration report |
| STI_Qual | An indicator variable coded 1 if the non-financial target is non-quantifiable (these include: Improve staff engagement, Talent management, Demonstrate leadership skills, People and culture, Succession planning, Strategic planning, Response to competition/competitive environment, Sustainability, Environmental and Stakeholder engagement), 0 otherwise |
| STI_Quant | An indicator variable coded 1 if the non-financial target is quantifiable (these include: OH&S targets, Decrease injury rates, Operation performance/operational excellence, Growth and new market development, Compliance with governance standards, Customer satisfaction and Quality of recommendations), 0 otherwise |
| STI_Undefined | An indicator variable coded 1 if the non-financial target is not specified in the firm’s annual remuneration report, 0 otherwise |
| LTI_Ratio | The maximum ex ante equity bonus available to the CEO as a proportion of base salary as stated in the firm’s annual remuneration report |
| %LTI_Market | The proportion of LTI weighted towards market-based financial targets (these include: Total Shareholder Return (TSR) or relative TSR), 0 otherwise |
| LTI_RTSR | An indicator variable coded 1 if the market-based financial target is relative total shareholder return, 0 otherwise |
| %LTI_Accounting | The proportion of LTI weighted towards accounting-based financial targets employed in the CEO compensation contract (these include: Earnings Per Share (EPS), profitability ratios such as Return on Capital (ROC) and Return on Capital Employed (ROCE), cash flow measures such as FCF or FOF, profitability measures in their natural form such as NPAT or NOPAT, revenue and a small number of other accounting measures), 0 otherwise |
| Total Pay | The natural logarithm of the total compensation reported for the CEO of firm i in year t |
| Variable Pay | The natural logarithm of the total compensation less fixed components (such as salary, super, allowances and motor) and options reported for the CEO of firm i in year t |
| STI | The natural logarithm of the reported realised cash bonus for the CEO of firm i in year t |
| LTI | The natural logarithm of the reported realised equity pay for the CEO of firm i in year t |
| Key independent variables | |
| Consultant | An indicator variable coded 1 if the firm employed an external compensation consultant or advisor during the financial year, 0 otherwise |
| Big4 | An indicator variable coded 1 if the firm employed EY, PwC, KPMG or Deloitte as compensation consultant or advisor during the financial year, 0 otherwise |
| Consultant_other | An indicator variable coded 1 if the firm employed a compensation consultant or advisor other the Big 4 accounting firms, 0 otherwise |
| ROA t | Earnings before interest and tax divided by total assets of firm i in year t. |
| Control variables | |
| ROA t–1 | Earnings before interest and tax divided by total assets of firm i in year t−1 |
| lnSize t–1 | The natural log of total assets of firm i in year t−1 |
| stdROA t–1 | The standard deviation of return on asset (ROA) measured earnings before interest and tax divided by total assets of firm i in year t−1 |
| Return t–1 | Annual buy and hold stock return of firm i in year t−1 |
| Leverage t–1 | Total long-term debt divided by total shareholders’ equity of firm i in year t−1 |
| M/B t–1 | The market price of outstanding shares divided by total shareholders’ equity of firm i in year t−1 |
| lnCash t–1 | The natural log of cash flow from operations scaled by total assets of firm i in year t−1 |
| RemSizet | The total number of remuneration committee members for firm i in year t |
| RemIndependent t | The proportion of independent directors within the remuneration committee for firm i in year t |
| RemMeetings t | The number of remuneration committee meetings held during the year for firm i in year t |
| RemMember t | An indicator variable coded 1 if the CEO is a member of the remuneration committee, 0 otherwise |
| CEO Tenure t | The number of years that have passed since the CEO commenced their position |
| CEO Shares t | The percentage of shares owned by the CEO of firm i in year t |
| CEO Salary t | The CEO’s reported annual fixed salary divided by their annual total compensation for firm i in year t |
Acknowledgements
The authors would like to thank the anonymous reviewers and participants of the AFAANZ Annual Conference 2021 and the 2023 European Accounting Association Conference for their insightful comments and feedback. They are also grateful for the valuable comments received from participants of the research seminars hosted by Australian National University, University of Technology Sydney, Otago University and Deakin University.
Final transcript accepted 11 July 2024 by Andrew Jackson (Editor-in-Chief ).
Funding
The author(s) received no financial support for the research, authorship and/or publication of this article.