
Abstract
In this article, we investigate the impact of the influx of retail investors during the COVID-19 lockdowns on the New Zealand Stock Exchange on the efficiency of the market. On one hand, these investors bring added liquidity to the market, which generally improves market efficiency, and on the other hand, many of these investors were inexperienced retail traders who are often viewed as noise traders harming market efficiency. This natural experiment allows us to investigate the impact of retail investors. Using a sample of 99 New Zealand Exchange listed companies, we collect intraday price and quote data from 1 January 2019 to 24 March 2021. We compute a range of market quality measures across three categories: trading costs, price efficiency and speed of information incorporation. Our results clearly indicate that the influx of retail investors has reduced market quality; in particular, we observe more price predictability and information being impounded into prices more slowly.
1. Introduction
Stock markets in many countries have seen a massive increase in the amount of trading in 2020 (Chiah and Zhong, 2020; Fitzgerald, 2021). In many countries, this increase in trading has been driven by unprecedented increases in retail investors’ participation in equity markets. For instance, in the year to October 2020, 20% of all trades in the United States were estimated to be made by retail investors (Ponczek and Greifeld, 2020) while in Australia the number of retail investors nearly doubled from 650,000 to 1.25 million (AUSIEX, 2021). This dramatic increase in stock market participation can be mainly attributed to three factors: the rise of low-cost online brokerage platforms that have made trading much easier and cheaper than previously, the lockdowns instituted as part of many countries reaction to the COVID-19 pandemic which gave potential investors time to experiment with trading (Ponczek and Greifeld, 2020), and historically low interest rates as a result of the pandemic resulting in typical investment classes like bonds and cash returning extremely low yields. Consequently, stock markets have seen unprecedented growth in the number of traders and with them a considerable injection of liquidity.
On the face of it, the resulting increases in the volume of trading occurring on stock markets should lead to more depth in the stock markets, enhancing their efficiency (Chordia et al., 2008). However, the extant literature has argued that retail investors bring both positives and negatives for the market. On one hand, the liquidity that retail investors provide is crucial for markets to function as it provides informed traders a counterparty to trade with, allowing them to embed their information into prices. As noted by Easley et al. (2011), reduced participation by retail investors results in greater order toxicity. In addition, several studies have noted that retail investors tend to provide liquidity during periods where institutional investors stop providing liquidity (Barrot et al., 2016) including during the COVID pandemic (Ozik et al., 2021). Kelly and Tetlock (2013) further suggest that retail investors are less uninformed than traditionally have been assumed in the literature.
In contrast, a number of studies have argued that retail investors, who are typically seen as noise traders, make markets less informationally efficient. Specifically, Black (1986) argues that retail traders make stock selection independently from fundamental analysis, while Kumar and Lee (2006) show that these traders spend less time on analysis and use different information than their informed counter parts. Moreover, Barber and Odean (2008) argue that retail investors make systematic mistakes in their investing. These arguments raise the prospect that retail investors are either not trading on appropriate information, due to lacking required financial knowledge, or lacking access to resources, or are misinterpreting the information they have which could move prices away from their intrinsic values. Furthermore, retail investors appear to be driven by momentum (Kumar and Lee, 2006), which can lead to increased order imbalances, and can cause information cascades and herding behaviour as investors disregard their own private information in favour of following market trends (Cipriani and Guarino, 2014). Finally, retail investors have been shown to increase market volatility (Foucault et al., 2011). In summary, while the absence of retail investors could lead to less liquid markets and higher trading costs, their presence could also lead to less informationally efficient prices and more volatility in markets. In this article, we explore the impact that retail investors have on the quality of New Zealand (NZ) stock market.
Several recent studies have investigated the behaviour of retail investors during the COVID-19 pandemic. For instance, Ortmann et al. (2020) found that retail investors were more active during the COVID outbreak. They trade more frequently, open more new accounts and add to their investment deposits. Giglio et al. (2020) investigated retail investors’ expectations at key points during the outbreak and found that disagreement about future expectations between investors increased during the outbreak. Our study is close to Pagano et al. (2021) who investigated the way Robinhood, an online brokerage platform, investors reacted to COVID. They observe that initially Robinhood investors reduced momentum trading and increased contrarian trading and that Robinhood investors increased market quality during quiet periods, but worsened market quality during the early phase of the pandemic. Our study, however, differs from Pagano et al. (2021) in that we explore retail investors across the entire market rather than focusing on investors from one particular trading platform who make up a fraction of the total market volume.
The NZ context provides an interesting setting within which to focus on the impact of retail investors on market efficiency. NZ has traditionally had low retail investor stock market participation with surveys indicating less than one in five respondents had stocks that they had purchased themselves (Financial Markets Authority, 2020) prior to 2020. As a result, a recent study by Bialkowski et al. (2024) found NZ retail traders were more likely to behave as noise traders than their US counterparts. Given the established negative consequences of noise traders in the literature we would expect that an influx of new inexperienced traders would exacerbate the negative effects of noise traders. In contrast, the NZ market is relatively low liquidity compared with developed market peers globally. Therefore, if there are positive impacts on market efficiency of the increase in liquidity from the influx of new retail investors, we would expect these to show clearly.
NZ experienced a significant increase in retail trading during the COVID period. Online platforms such as Sharesies and Hatch (NZ equivalents of Robinhood), which were set up in recent years, have seen massive growth in memberships. In the 6 months to June 2020, Sharesies grew from 91,000 members to 166,000 and has since increased to more than 500,000 members managing New Zealand dollar 1.9 billion in funds. According to Sharesies, 70% of the owners of new accounts identify themselves as new investors suggesting that their financial acumen and trading experiences are likely to be low. As an indication of the size of the influx of new investors, the annual Investor Confidence Survey saw the percentage of investors with self-bought shares increased from 17% in 2019 to 24% in 2022. The lack of experience combined with the disproportionately high increase in retail investors makes NZ an interesting setting to understand the impact of retail investors on market quality.
We focus on several important aspects of market quality including trading costs, informational efficiency and the speed information is incorporated into prices. In general, markets with lower transaction costs are viewed as having higher quality, and they exhibit greater price efficiency. A key function of financial markets is adjusting prices as new information is discovered. Efficient markets will swiftly integrate new information into prices resulting in markets where prices follow random walks. We study the impact of retail investors on a range of microstructure measures across three categories: trading costs, informational efficiency and reaction to new information for companies listed on the New Zealand Stock Exchange (henceforth, NZX) over the period January 2019 to March 2021. We compile intraday trade and quote data for all listed companies on the NZX over the sample period. We find that following the reduction in interest rates and the lockdown imposed because of COVID, there has been a doubling of the number of retail trades on the NZX resulting in greatly increased market trading volumes. We find strong and consistent evidence that shows that the influx of retail investors into the NZX has generally reduced the overall market quality suggesting that the potential liquidity benefits from these investors is undermined by the informational costs of large numbers of uninformed traders.
The remainder of the article is organized as follows. Section 2 reports the sample and provides a detailed analysis of the data. Section 3 discusses the methodology and microstructure measures that we employ are presented. Section 4 discusses our empirical findings. Section 5 concludes the article.
2. Sample and data analysis
To estimate the impact that small trades by retail investors might have on the market quality, we collect intraday trade and quote data for all NZX listed companies between 1 January 2019 and 24 March 2021. Trade and quote data are obtained from Refinitiv’s Tickhistory database. We use data from 2019 as our pre-period, and COVID was first mentioned in media on 31 December 2019 and started to impact global markets in early 2020. We use 24 March 2020 to 24 March 2021 as our post-period. Early 2020 saw several significant events that contributed to the influx of new investors into the NZ stock market. The first was the 0.75% decrease in the Official Cash Rate (OCR), the benchmark interest rate, by the Reserve Bank of NZ on 16 March 2020, which dropped the OCR to 0.25%. The reduction in the OCR reduced commercial bank deposit rates below the inflation rate and also greatly reduced bond yields. For many investors, this left the stock market as one of the few options for earning higher returns. In addition, NZ instituted a full (Level 4) 1 lockdown because of the COVID-19 pandemic on 24 March 2020, which resulted in non-essential workers being largely confined to their homes. As a result, a lot of people found that they had excess time on their hands, time many used to acquire new skills. As shown in Figure 1, March saw a significant growth in trading activity. This also coincided with the start of a significant increase in new investor enrolments in local low-cost online brokerage platforms such as Sharesies and Hatch.
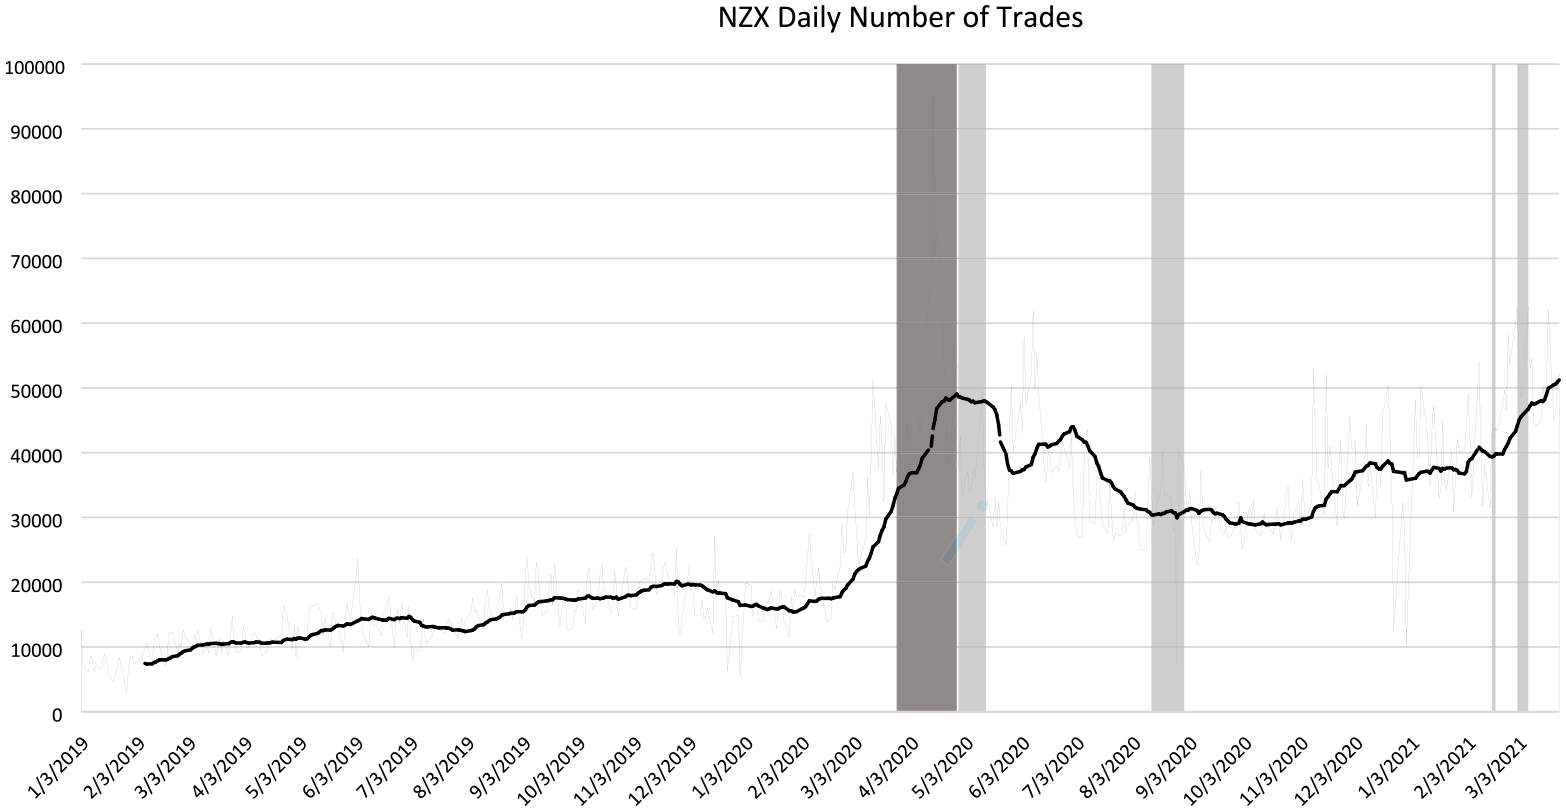
Daily total trades of NZX-listed equities.
For each firm in our sample, we collect all trades and quotes over the sample period. We consolidated trades by combining trades that occur at the same timestamp (to the millisecond) into a single trade at their volume-weighted average price (VWAP) and use the prevailing quotes at the time of the trade. We exclude trades that occur prior to the market open or after the market close. We further exclude those companies that had fewer than five trades per day. On average, we have 98 companies in the sample period. For the volatility sensitivity and persistence, however, we need higher liquidity. We chose to consider those companies having, on average, 50 trades per day, in line with other studies applying these methods such as Indriawan (2020), which reduces the sample to 42 companies.
To measure the share of retail trades, we use information from the NZX that identifies whether a trade is for a retail investor. Based on this identifier, we collect daily summaries of the number of trades and the volume of trades conducted by retail investors for each company.
Figure 1 presents the changes in trading activity on the NZX over the sample period based on the number of trades per day. We observe that over 2019 the average number of trades doubles from just below 10,000 trades per day to around 20,000 trades per day before dropping in early 2020. Following the reduction in the OCR in early March 2020 in response to the pandemic, many investors, looking for opportunities for higher returns, appear to have turned to the stock market. As such, we see the number of trades begin to increase peaking in early May at just below 50,000 shares, roughly three times the number of daily trades compared with the early stages of 2020. In addition, trading activity does not start to decline until after the country moves out of Level 3 lockdown. In Level 3 lockdown, most businesses were reopened and economic activity returned nearly to normal. Following the easing of the Level 3 lockdowns, trading activity drops to around 30,000 trades per day, still nearly double the level at the start of the year. By the end of the sample period in March 2021, trading activity had increased again to around 50,000 trades per year, higher even than during the first lockdowns.
Figure 2, which focuses on volume traded, shows a slightly different picture. For most of 2019 and early 2020, the NZX traded around 30 million shares per day. Around the beginning of March 2020, we observe an increase in volume traded, spiking to more than 70 million shares per day towards the end of the Level 4 lockdown. Once the lockdowns are lifted, the number of shares traded declines over the rest of the sample period to end at just below 50 million shares per day. The volume traded at the end of the sample period is still nearly double the average for 2019 but is considerably lower than the lockdown peak. This contrasts with the number of trades, which was at its highest point at the end of the sample, suggesting that the average trade size was decreasing throughout 2020 into early 2021. As a result of the increasing number of trades but declining volume, Figure 3 shows that the value of shares traded stayed relatively static following the lockdown peak in May 2020. The NZX value of trading was still about 50% higher at the end of the sample period than it was at the start after peaking at more than double. The three graphs present a consistent picture showing that the NZX, starting in March 2020, gained a significant amount of extra liquidity in the market reaching roughly 50% more shares and volume traded per day.
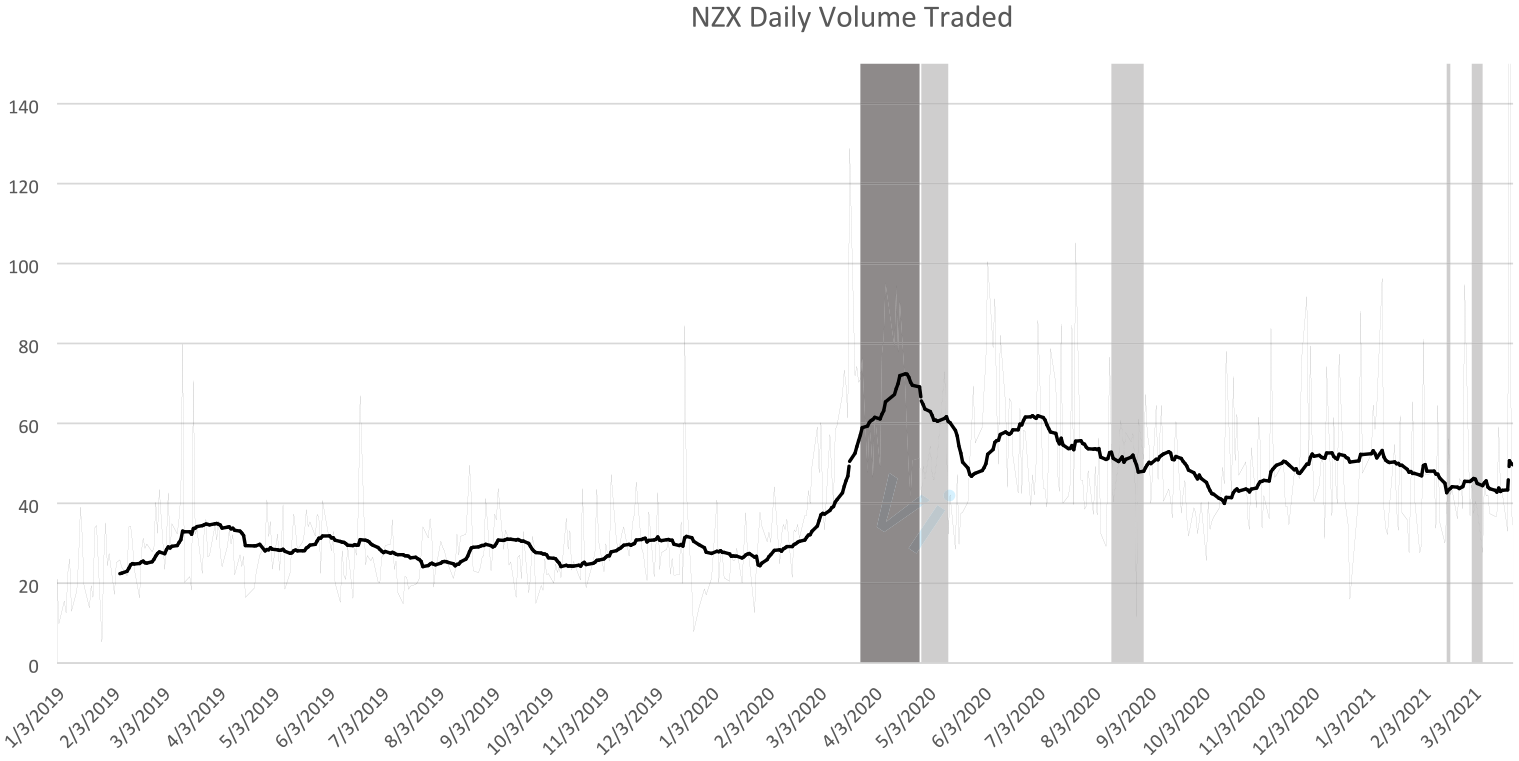
Daily total volume traded of NZX-listed equities (millions of shares).
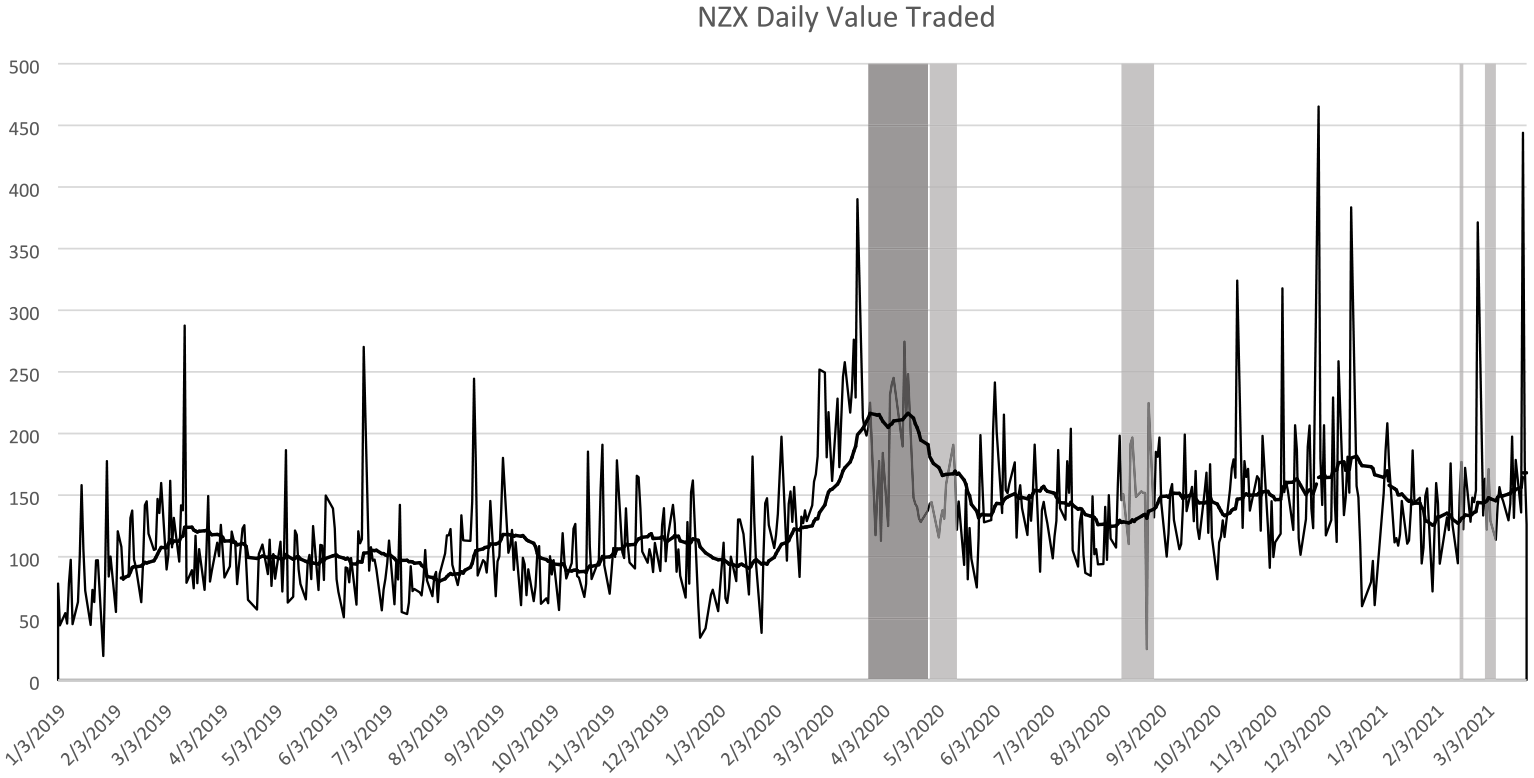
Daily total value traded of NZX-listed equities (millions of NZD).
The composition of traders has changed markedly, with much of the extra liquidity coming from retail investors. Figure 4 presents the percentage of daily trades for both the retail and non-retail trades. We observe a dramatic shift in the composition of the trades on the NZX. Between the start of the sample period and October 2019, retail traders make up about 20% of the daily trading activity. This then increases over the early parts of 2020 to 40% in the middle of 2020 where it stays relatively consistently until the early parts of 2021 when the uptick in non-retail trades pushes down the retail share. Overall, we see that the percentage of retail trades has doubled with much of the increase occurring during the COVID period.
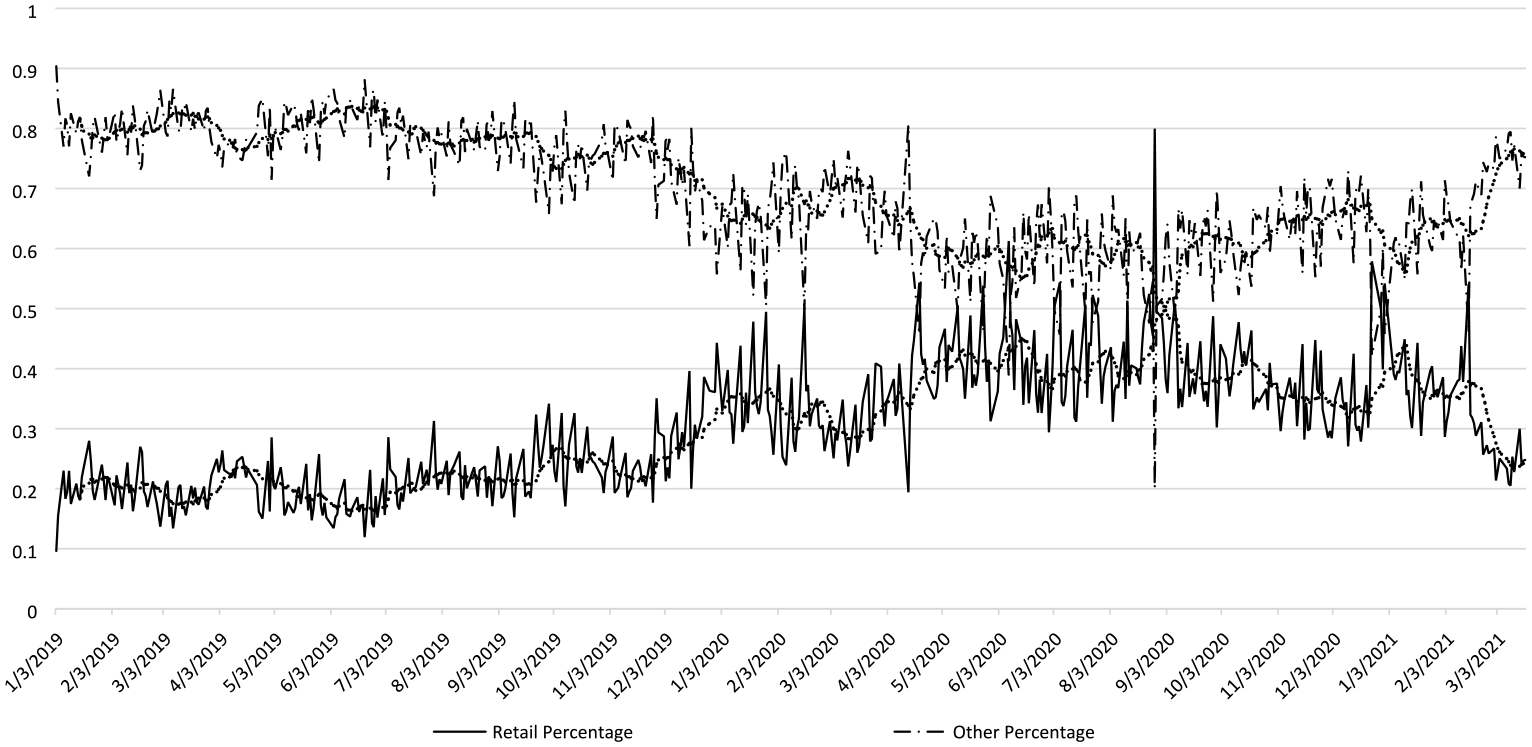
Daily trades by trade size – percentage of trades.
3. Methodology
We examine the impact that the introduction of considerable numbers of new investors has had on various aspects of the market quality. If retail investors are creating more noise in the market, by not trading on fundamental information or engaging in momentum-type trading, we would expect the market to become less informationally efficient, with more predictable prices and slower reactions to new information despite the additional liquidity they are bringing. Alternatively, if retail investors are adding liquidity without generating additional noise, that is are trading on fundamentals, we would expect the market to become more informationally efficient with prices that more closely follow a random walk and more efficient reactions to new information. We focus on three aspects of the market to assess the impact of small trades: the cost of trading as measured by the spread, the price efficiency of the market and the market reaction to new information via the impact on the sensitivity and persistence of volatility shocks. Below, we provide more detail on each of these measures and how they are implemented in our study.
3.1. Cost of trading
We start by considering the impact on trading frictions and in particular the bid-ask spread. It has been widely argued that markets are more efficient when spreads, which represent the cost of trading, are lower (Chordia et al., 2008). Lower costs to trading are likely to stimulate additional liquidity into the market and allow for investors to successfully exploit smaller price divergences from the intrinsic value. Considerable effort has been made by stock exchanges to reduce the spread in an effort to increase the liquidity of markets. We estimate the effective spread as the difference between the actual price at which a trade occurs and the midpoint of the prevailing quoted spread at the time of the trade, that is
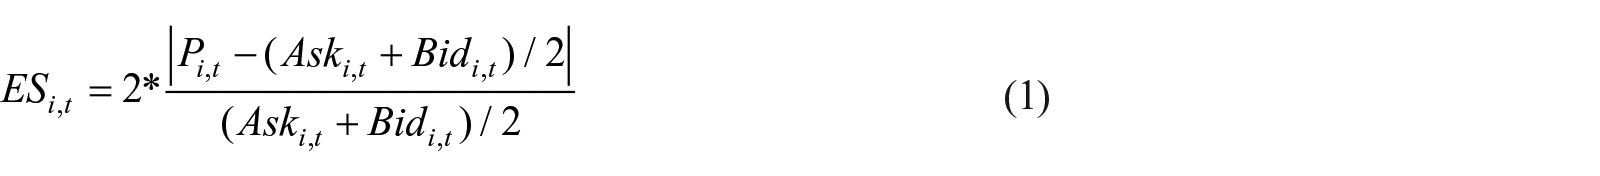
We prefer the effective spread for two reasons. First, the effective spread, as it relies on the actual price, is a more accurate reflection of the cost of trading than using the quoted percentage spread. This is particularly true in opaque markets where liquidity may not be fully reflected in quotes and opportunities exist to trade within the spread (Ready, 1999). But even in electronic markets traders can better-existing quotes, or large orders can exhaust the shares available at the best price, resulting in execution prices that differ from quoted prices (Bessembinder and Venkataraman, 2010). In such cases, the effective spread is a more accurate measure of the actual trading costs.
In addition, Lin et al. (1995) proposed a model for decomposing the effective spread into the two main costs facing liquidity providers: order processing (OP) and adverse information (AI) costs. 2 They argue that in response to an order, market specialists will revise the quotes they offer. They do this to attract order flow to balance their position and to ensure their costs are covered. If market participants trade according to this pattern, that is a buy is followed by a sell and vice versa, then prices will only change temporarily. If we see order persistence (a buy followed by a buy), the impact on prices becomes permanent. Lin et al. (1995) argued that the response of the midpoint to a trade at the bid or ask will reflect the degree of information asymmetry, which can be measured as

where
While permanent price changes represent the cost of AI, the temporary price changes as a result of bouncing between bids and asks measures the OP costs that liquidity providers face. Lin et al. (1995) measured this based on the formula

where
Applying the Lin et al. (1995) model allows us to investigate the impact that small trades have on the cost components of the spread. Small trades made by unsophisticated retail investors could be expected to impact these cost components. In particular, the extra liquidity may reduce OP costs. Alternatively, as Lin et al. (1995) argue, there are the significant fixed costs in supplying liquidity which combined with smaller average trade sizes would require greater compensation to the suppliers of liquidity resulting in larger spreads. For AI, we would expect the proportion of trades against informed counterparties to decrease as the new investors are unlikely to possess unpriced information, effectively diluting the impact of informed traders and reducing the risk of trading against an informed counterparty.
3.2. Price efficiency
Finance theory has long argued that efficient markets are those where prices are not predictable, that is prices follow a random walk model, based on available information. As such, market efficiency is often assessed by examining the predictability of prices. The literature has also found that greater liquidity is often associated with prices more closely following a random walk. We employ two commonly used measures of the short-term predictability of prices, the variance ratio tests and the autocorrelation of returns.
Variance ratio tests measure if the variance of returns is a linear function of the time frequency over which the variance is measured. In other words, it tests if the variance of returns measured at 30-second intervals is 3 times greater than the variance of returns measured at 10-second intervals. The closer to zero the resulting ratio, the more closely prices follow a random walk. We estimate the variance ratio as

where
The autocorrelation of intra-day returns measures the short-run predictability of prices by measuring whether we can predict the returns in the next period based on the current period returns. If there is autocorrelation in returns, then this violates the weak form market efficiency. We measure the autocorrelation by estimating returns on the prevailing quoted midpoint at the end of each interval and then estimating the first-order return autocorrelations for each company on each day, that is

where k represents different intraday intervals; in our study, we use 10-second intervals, and rk,t is the midpoint returns at time t. We then average the absolute value of the autocorrelation over the sample period for each company. Larger values, or greater predictability in returns, indicate less efficient prices.
We will apply these measures of price efficiency to our sample data to investigate whether the arrival of new retails investors has led to more or less price predictability on the NZX.
3.3. Volatility significance and persistence
Our final measures of market quality look at stock return volatility as a measure of the speed with which new information is impounded into prices. New information coming into the market will result in price adjustments, with more efficient markets adjusting to information more quickly and fully. However, this adjustment relies on investors having an accurate view on the impact of information and being driven by news. Retail investors are, however, likely to either over- or under-react to news or even trade on the basis on non-news signals, the consequences of which is to likely delay the speed with which the market reacts to information.
Kavajecz and Odders-White (2001) and Indriawan (2020) both employed the sensitivity and persistence of volatility based on a Generalise Autoregressive Coditional Heteroskedasticity (“GARCH”) (1,1) model to estimate the quality of a market. GARCH models can be used to estimate the time variation in the volatility of stock returns. Specifically, the model allows us to measure the degree to which the variance is impacted by lagged innovations and lagged variance in returns, which can be described as the sensitivity and persistence levels of an asset and can be used to infer the speed with which information is impounded into prices. As per Indriawan (2020), we employ a GARCH (1,1) which has been shown to be a good fit for high-frequency microstructure data and is relatively easy to interpret. The GARCH (1,1) jointly estimates the following two formulas using maximum likelihood


Following Campbell et al. (1997), we rearrange equation (7) to obtain

where
3.4. Sub-sample analysis
In addition to considering the impact on market quality based on 12-month sample periods covering December 2019, January 2019 and March 2020 to March 2021, we also split the sample into five 3-month subperiods with one period prior to 2020, October–December 2019 and four periods running from 24 March 2020 to 24 March 2021. The subperiods will allow us to see whether the market quality impacts of the new retail investors changed as the situation evolved over the sample period.
3.5. Regression analysis
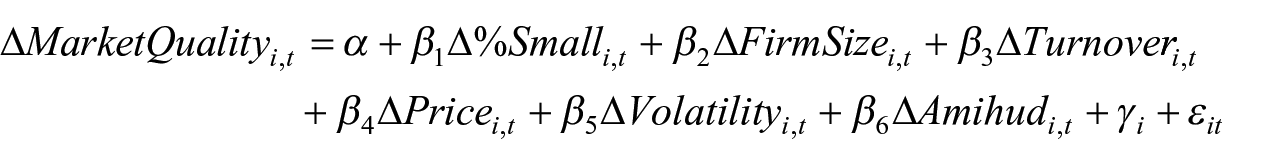
To examine the impact that small trades have on market quality, we employ a multivariate fixed effects regression as follows

We control for other factors that affect market quality. For instance, larger firms typically have more efficient prices and lower spreads but are also more visible to retail investors and so might attract more trading by them (Kim and Ogden, 1996). Therefore, we include the natural logarithm of the market capitalization (Firm size) at the end of the relevant period. We also include Turnover, defined as the number of shares traded over a period divided by the total number of shares available (Tian et al., 2015), the share price (Price) at the end of the period to control for the effects of price discreteness (Tourani-Rad et al., 2016) and Volatility which we define as the standard deviation in daily returns over the period as high-risk stocks have been shown to have higher trading costs (Hsieh et al., 2010; Van Ness et al., 2001). We, in addition, include the Amihud illiquidity measure (Amihud), defined as the absolute return divided by the value of shares traded per day and averaged over the period (Amihud and Mendelson, 1986). Liquidity is often viewed as a measure of market efficiency in its own right. In our case, we observe a general increase in liquidity, driven in large part but not solely, on retail investors. Therefore, we control for the stock liquidity to address the impact of changes in liquidity on the market efficiency measures and to allow us to better investigate the impact of retail investors.
Finally, we add two dummy variables when we consider the subperiods, the first, Lockdown, is 1 if the period covers 24 March 2020 to 25 June 2020 which represents the period where NZ had a national lockdown requiring all but essential workers to stay-at-home. The second dummy, Post, is equal to 1 in any period after 24 March 2020. Our two dummies, Lockdown and Post, should account for changes in our systematic market quality measures not associated with our control variables and the increase in small trades, but associated with COVID-19 and the subsequent economic consequences of it.
4. Empirical findings
Table 1 presents the summary statistics split between the 12-month pre-COVID and COVID periods, covering January 2019, to December 2019 and March 2020 to March 2021. Panel A presents the summary statistics for the trading activity of the sample firms including the trades per day and volume per trade statistics. We observe that there has been a statistically significant increase in both the average number of trades per day, which more than doubles, and the median, which increases over threefold. In contrast, and supporting the earlier conclusion from the figures, we find that the average volume per trade reduces significantly for both the mean and median, both of which more than halve.
Summary statistics.
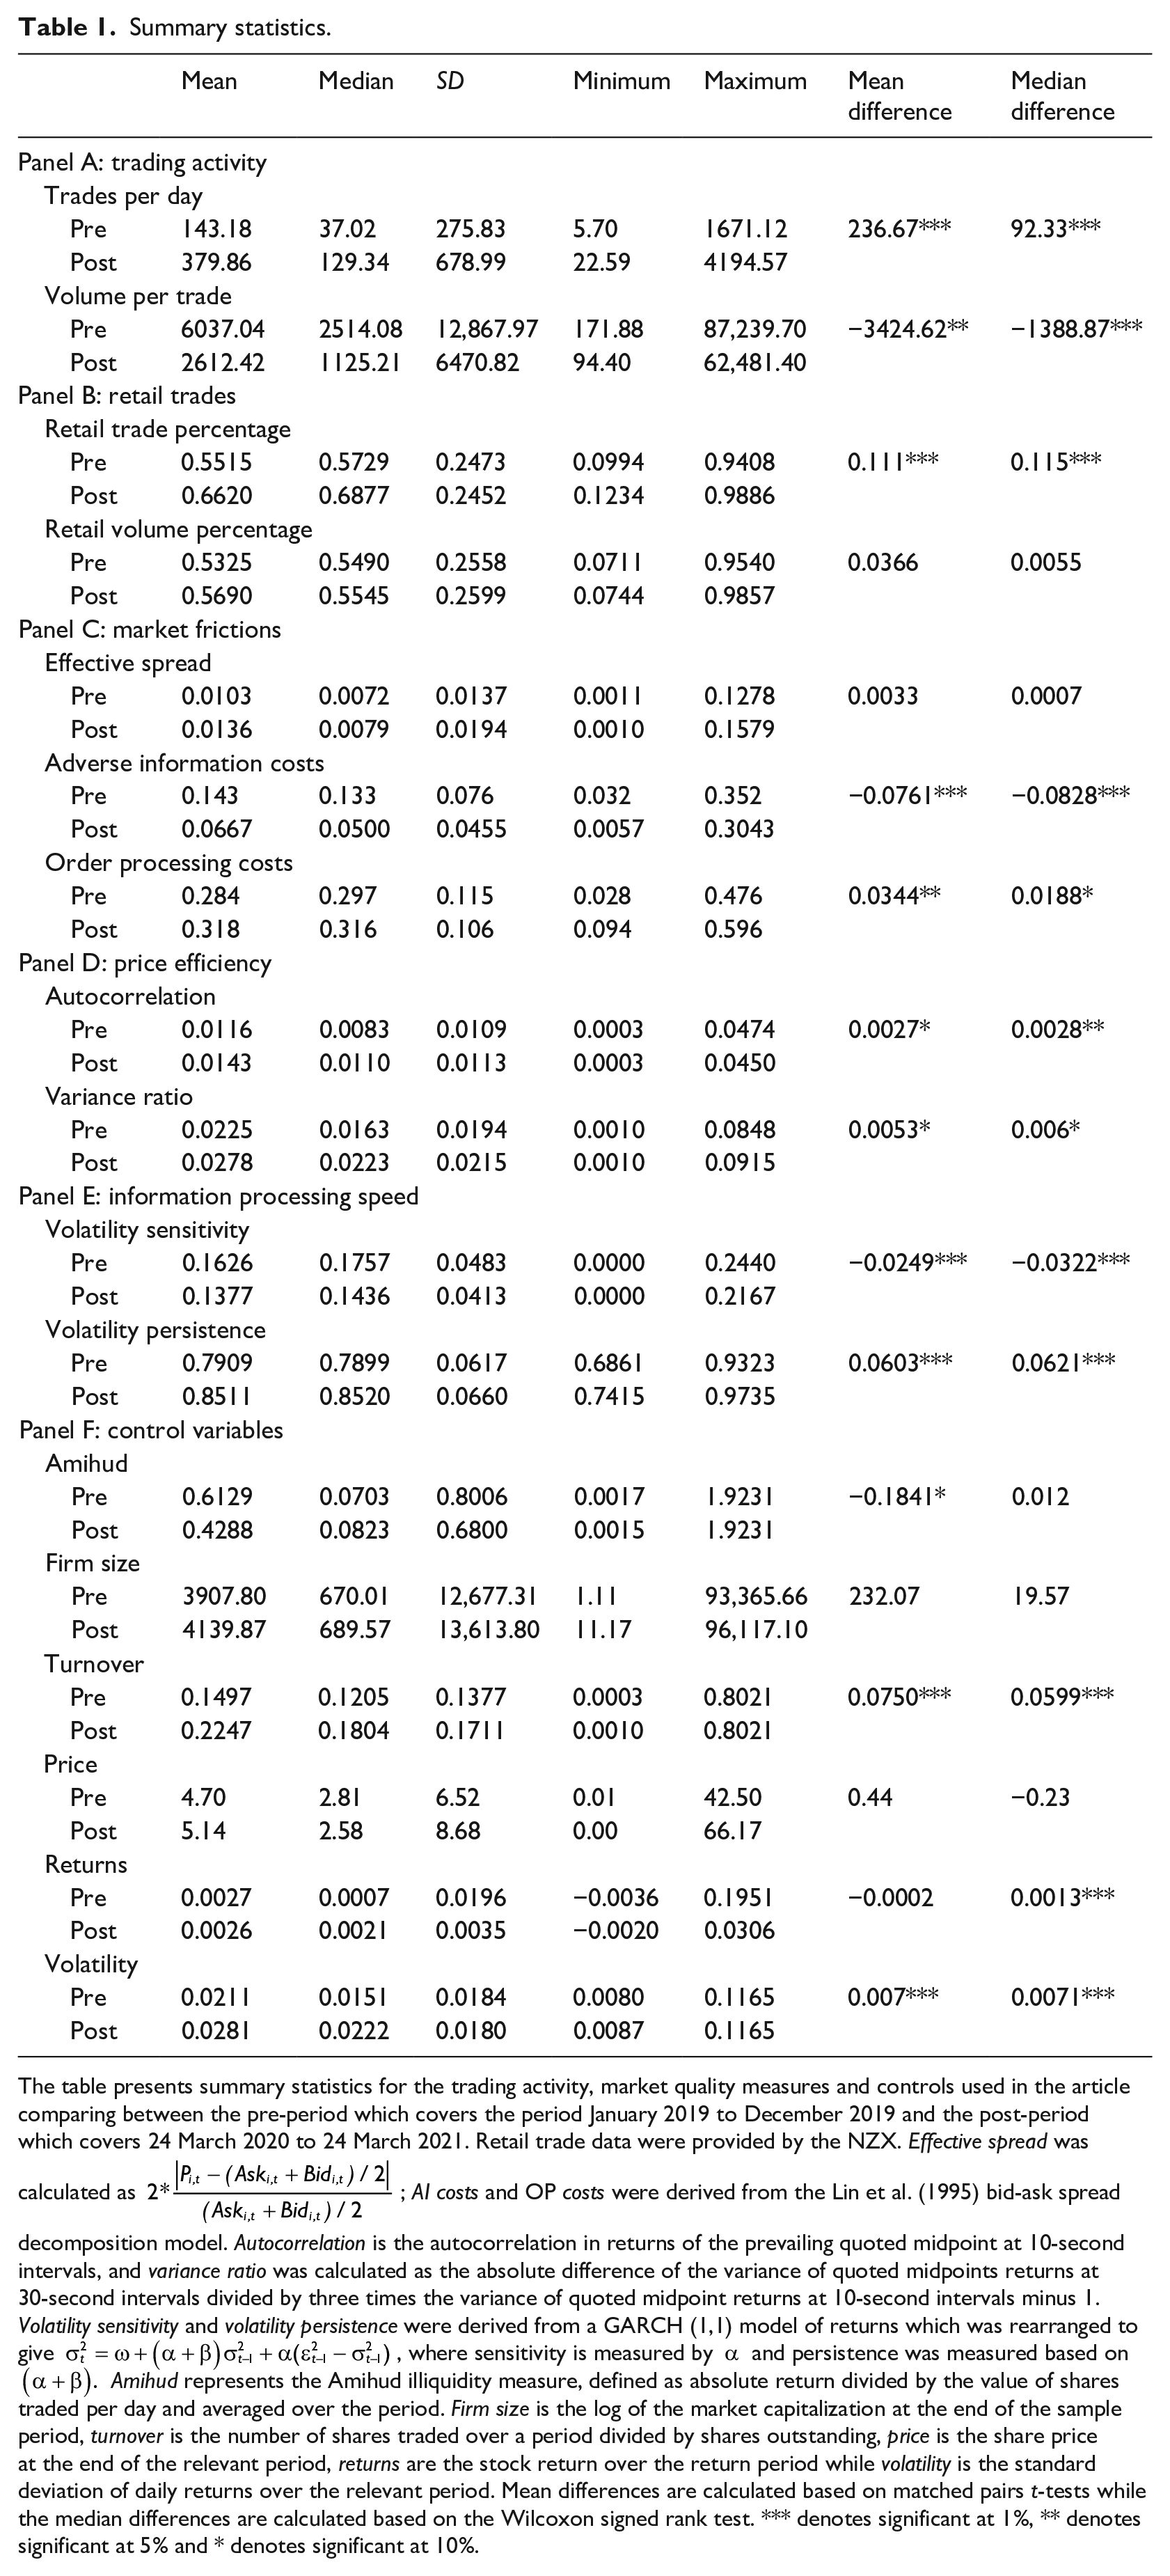
The table presents summary statistics for the trading activity, market quality measures and controls used in the article comparing between the pre-period which covers the period January 2019 to December 2019 and the post-period which covers 24 March 2020 to 24 March 2021. Retail trade data were provided by the NZX. Effective spread was calculated as
Panel B presents the data on the percentage of retail trades and retail volume as a percentage of the total trading activity. When we look at the cross-sectional average of the percentage of retail trades, we observe a marked increase between the pre- and post-periods, going from roughly 55% to 66%, with a similar increase in the median. The cross-sectional averages are much higher than the average daily percentage of retail trades shown in Figure 4. This is driven by companies with high daily trading on average having a higher percentage of non-retail trades resulting in the lower average observed in Table 4. This can be further seen by the extremely wide range which goes from companies with as little as 10% retail trading to those that are nearly entirely retail trades. Interestingly, while the number of trades increases markedly, there is an insignificant increase in the retail volume traded. On average, there is an increase in 3.7% for the mean and about 0.6% for the median. This suggests that on average retail trades are smaller than non-retail trades.
Panel C of Table 1 presents the summary statistics for the market quality measures which overall shows some evidence that the market has become less efficient. We observe positive but insignificant increases in the effective spread, driven by offsetting movements in the cost components of the spread. Specifically, we find that the AI costs decrease which is in line with the finding that retail traders, who are unlikely to be informed, make up a higher percentage of trades, and therefore, the risk of trading against an informed counterparty is lessened. However, the consequence of this may be that prices are becoming less informationally efficient as retail traders drown out the signals from informed traders making it harder for the market to accurately price stocks. We also observe a statistically significant increase in OP costs of around 3.4% on average and 1.9% for the median. Higher-OP costs would increase spreads and increasing trading costs and making it harder for informed traders to exploit smaller mispricing.
In relation to our other market quality measures, we observe weak but significant increases in both the autocorrelation of midpoint quoted returns and in the variance ratio, indicating that prices have become more predictable. More predictable prices mean prices are less likely to follow a random walk and, therefore, indicate that the market is less efficient in the 12 months following the COVID lockdowns. Finally, we also observe a reduction in volatility sensitivity and an increase in volatility persistence, again indicating market quality has declined. These results particularly suggest that new information has a smaller immediate impact and instead takes a longer period for prices to adjust.
Table 1 also contains the 12-month summary statistics of the control variables employed in the later regressions. We see a marked decline in the average Amihud illiquidity measure, which is consistent with an improvement in liquidity. Of note, while the average illiquidity declines, the median is insignificantly different suggesting any improvement in illiquidity is not observed by most of the sample firms. We also see no significant difference in the firm size or share price at the end of the sample periods. In contrast, we observe significantly higher turnover, as measured by the number of shares traded as a percentage of the total shares outstanding per company, with the average increasing by 50% compared with the pre-sample period and the median increasing by just more than 25%. We also see significantly higher volatility in the post-sample period with a 0.7% increase which equates to a roughly one-third increase on average and nearly 50% for the median. Finally, we see a small increase in returns for the median company, but not on average. The summary statistics identify the need to take the natural log of firm size and turnover, and the need to winsorise the Amihud measure at the 5th and 95th percentiles.
Table 2 presents the average and median values for the market quality measures in the five 3-month samples. The pre-period subsample covers the period October–December 2019 while the four post-periods, Post 1–Post 4, cover 3-month periods from 24 March 2020 to 24 March 2021. We also show the difference in the mean and medians of each post-period compared with the pre-period using either a matched pair t-test or the Wilcoxon signed rank test. Panel A considers our three trading cost measures, the effective spread and the two spread cost components, AI and OP costs. We observe no significant difference in either the mean or median values for the effective spread, although we do observe quite large declines in the average amounting to nearly a quarter of the pre-sample average in Post periods 2 to 4. However, we see far less evidence with the medians where there is a sizable increase in Post 1, although still insignificant, and virtually no difference in Post periods 2 to 4. When we examine the cost components, we observe that there is a significant decline in the AI component, again suggesting that the amount of informed trading has markedly declined as a proportion of the total trades for both the mean and medians. For OP, we find a significant decline in OP costs in Post 1, followed by significant increases. It has been argued that OP is largely fixed costs, and therefore, if the average volume size has declined, then it is to be expected that the cost of executing orders would increase.
Market quality measures before and after COVID lockdowns.
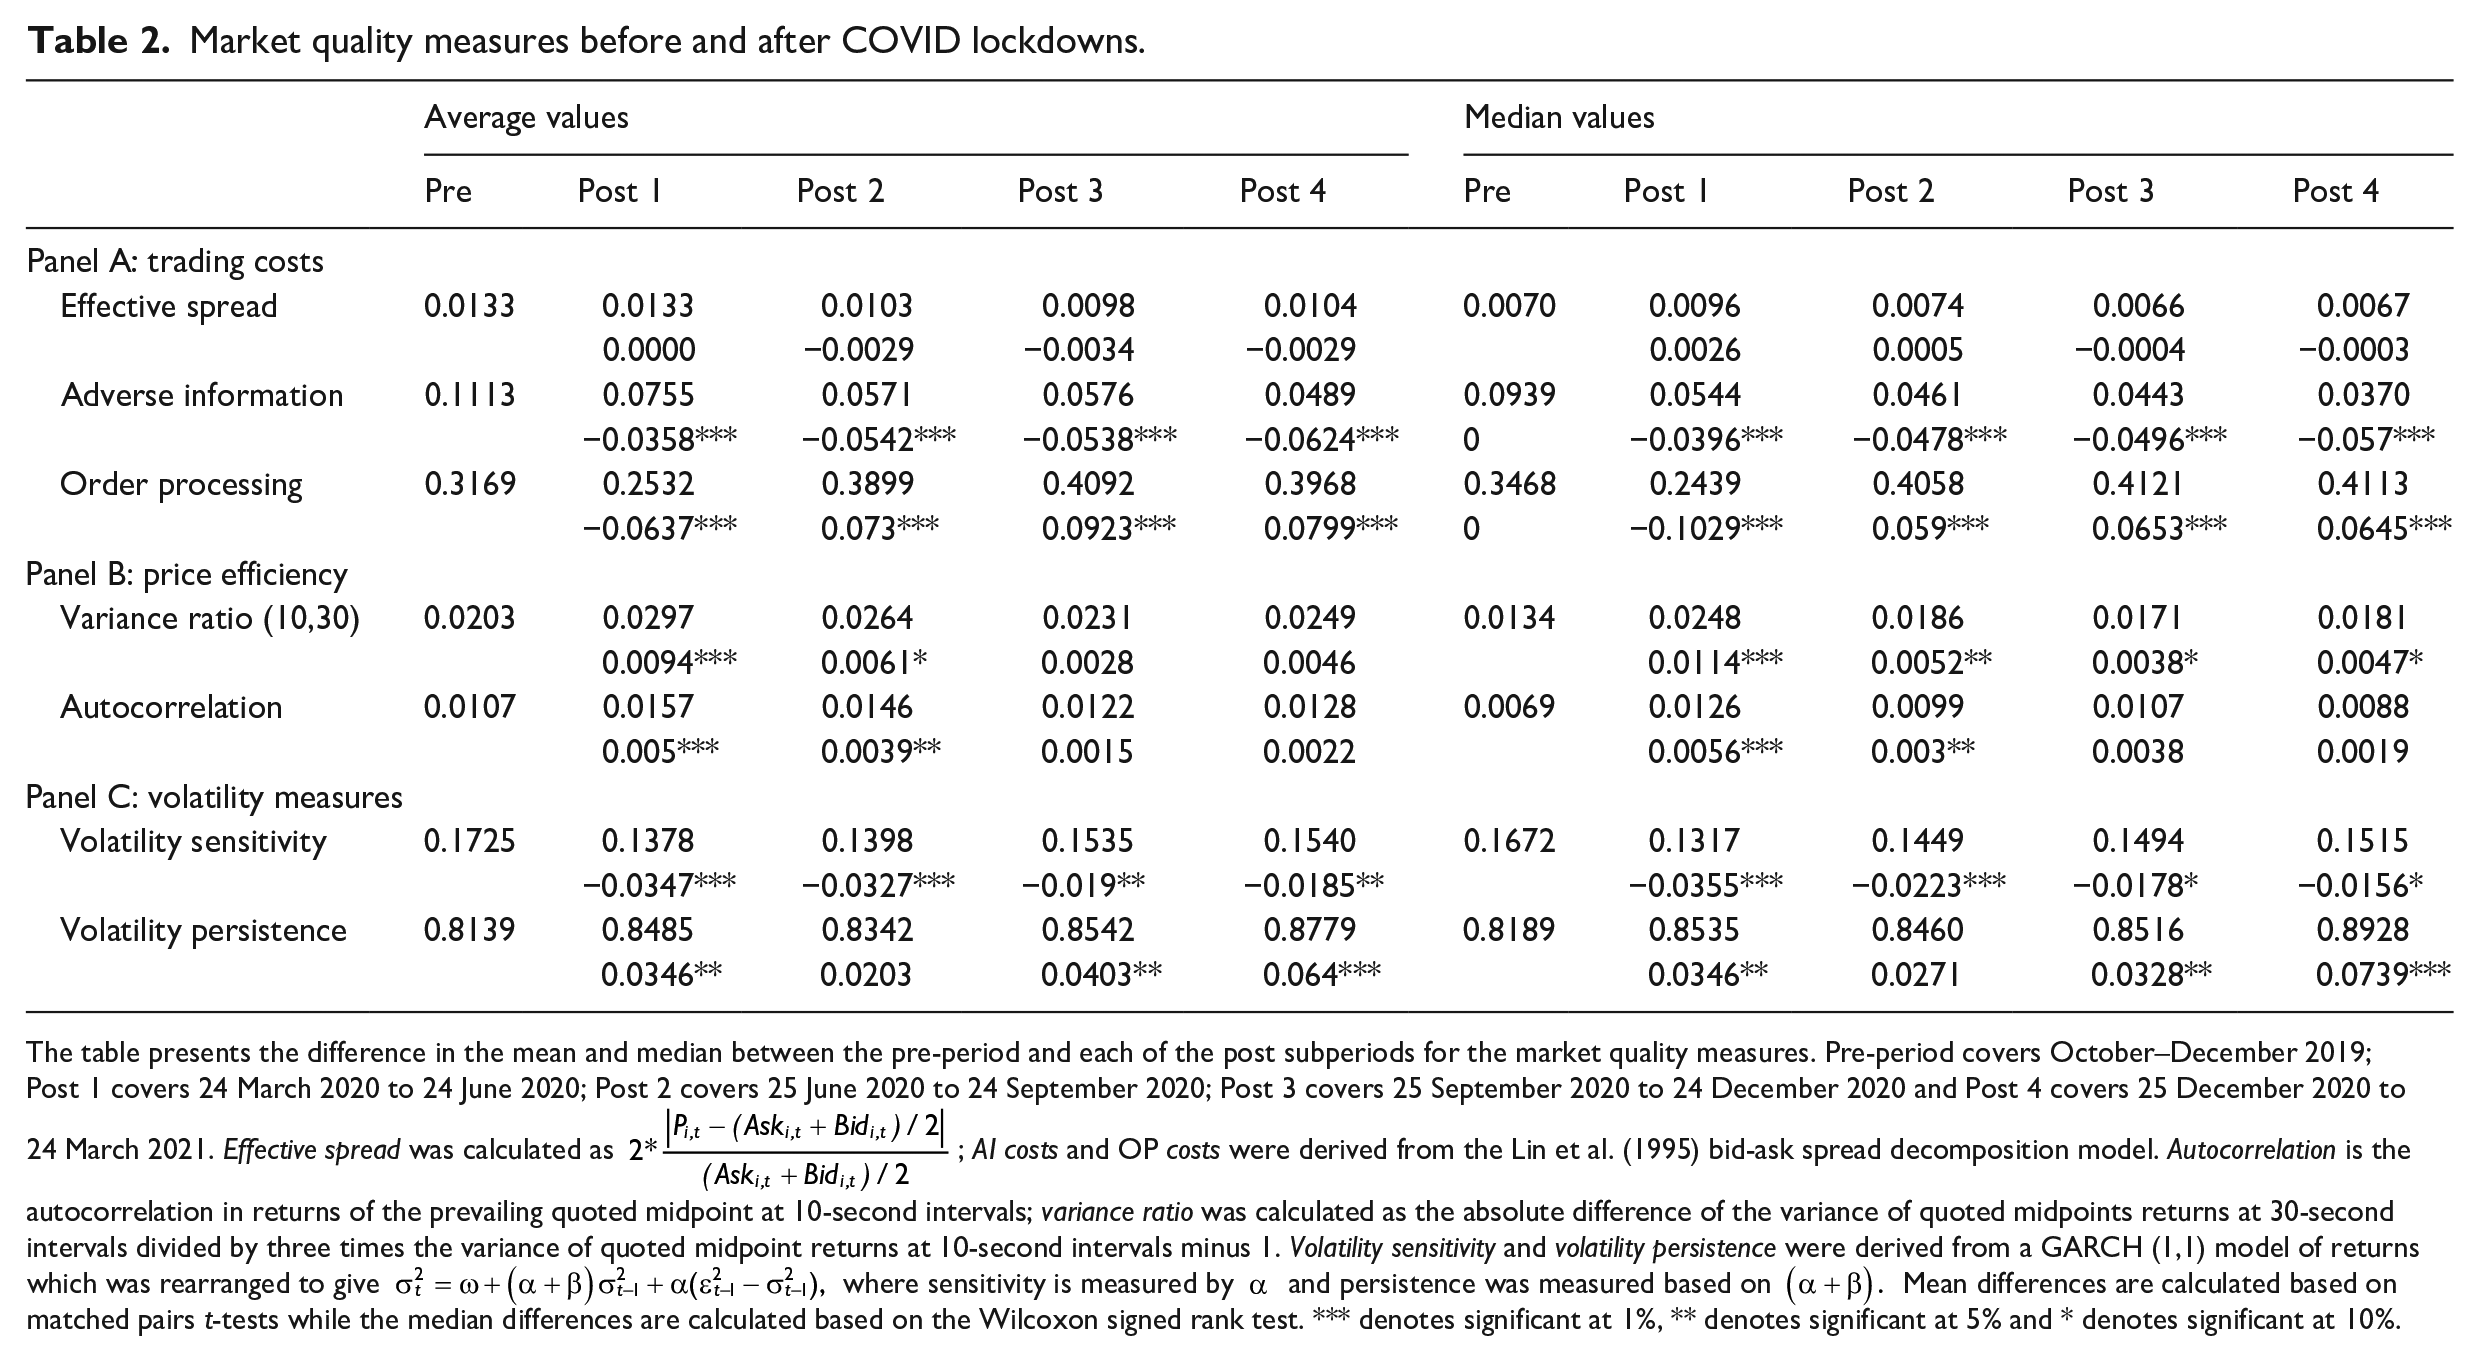
The table presents the difference in the mean and median between the pre-period and each of the post subperiods for the market quality measures. Pre-period covers October–December 2019; Post 1 covers 24 March 2020 to 24 June 2020; Post 2 covers 25 June 2020 to 24 September 2020; Post 3 covers 25 September 2020 to 24 December 2020 and Post 4 covers 25 December 2020 to 24 March 2021. Effective spread was calculated as
Panel B looks at price efficiency measures. Again, we find evidence to suggest that market quality has declined despite considerably more trading activity occurring. We observe that both the variance ratio and the autocorrelation of quoted midpoint returns have increased in Post 1 and Post 2 based on averages and for the median of the autocorrelations while the median of the variance ratio tests has increased across all four post-periods. The significantly increased values indicate that there is now more predictability in prices, indicating lower market quality. This observation is also supported by the results in Panel C where we study the speed with which information is incorporated into prices. We observe statistically significant decreases in volatility sensitivity across all periods for both the mean and median values, denoting less immediate impact from new information. We also note that volatility persistence increases for all bar Post 2, again for both the mean and medians, indicating that it takes longer for information to be impounded into prices. Based on the changes in our market quality measures, we can conclude that there is less informed trading and execution costs have increased, while price efficiency and the speed of impounding information into prices have decreased significantly.
Table 3 presents the correlation coefficients between our variables. Of note, we observe a strong positive correlation between retail trades and the effective spread, suggesting smaller trades increase the effective spread. In addition, retail trades have a moderately positive correlation with OP. We also observe strong positive correlations with autocorrelation and the variance ratio suggesting that retail investors decrease market efficiency by making prices more predictable. The percentage of retail trades is positively correlated with price, returns and liquidity and is negatively correlated with volatility. The rest of the market quality measures are as expected, with positive correlations with size, apart from volatility sensitivity which we would expect to have a negative relationship.
Correlation matrix.
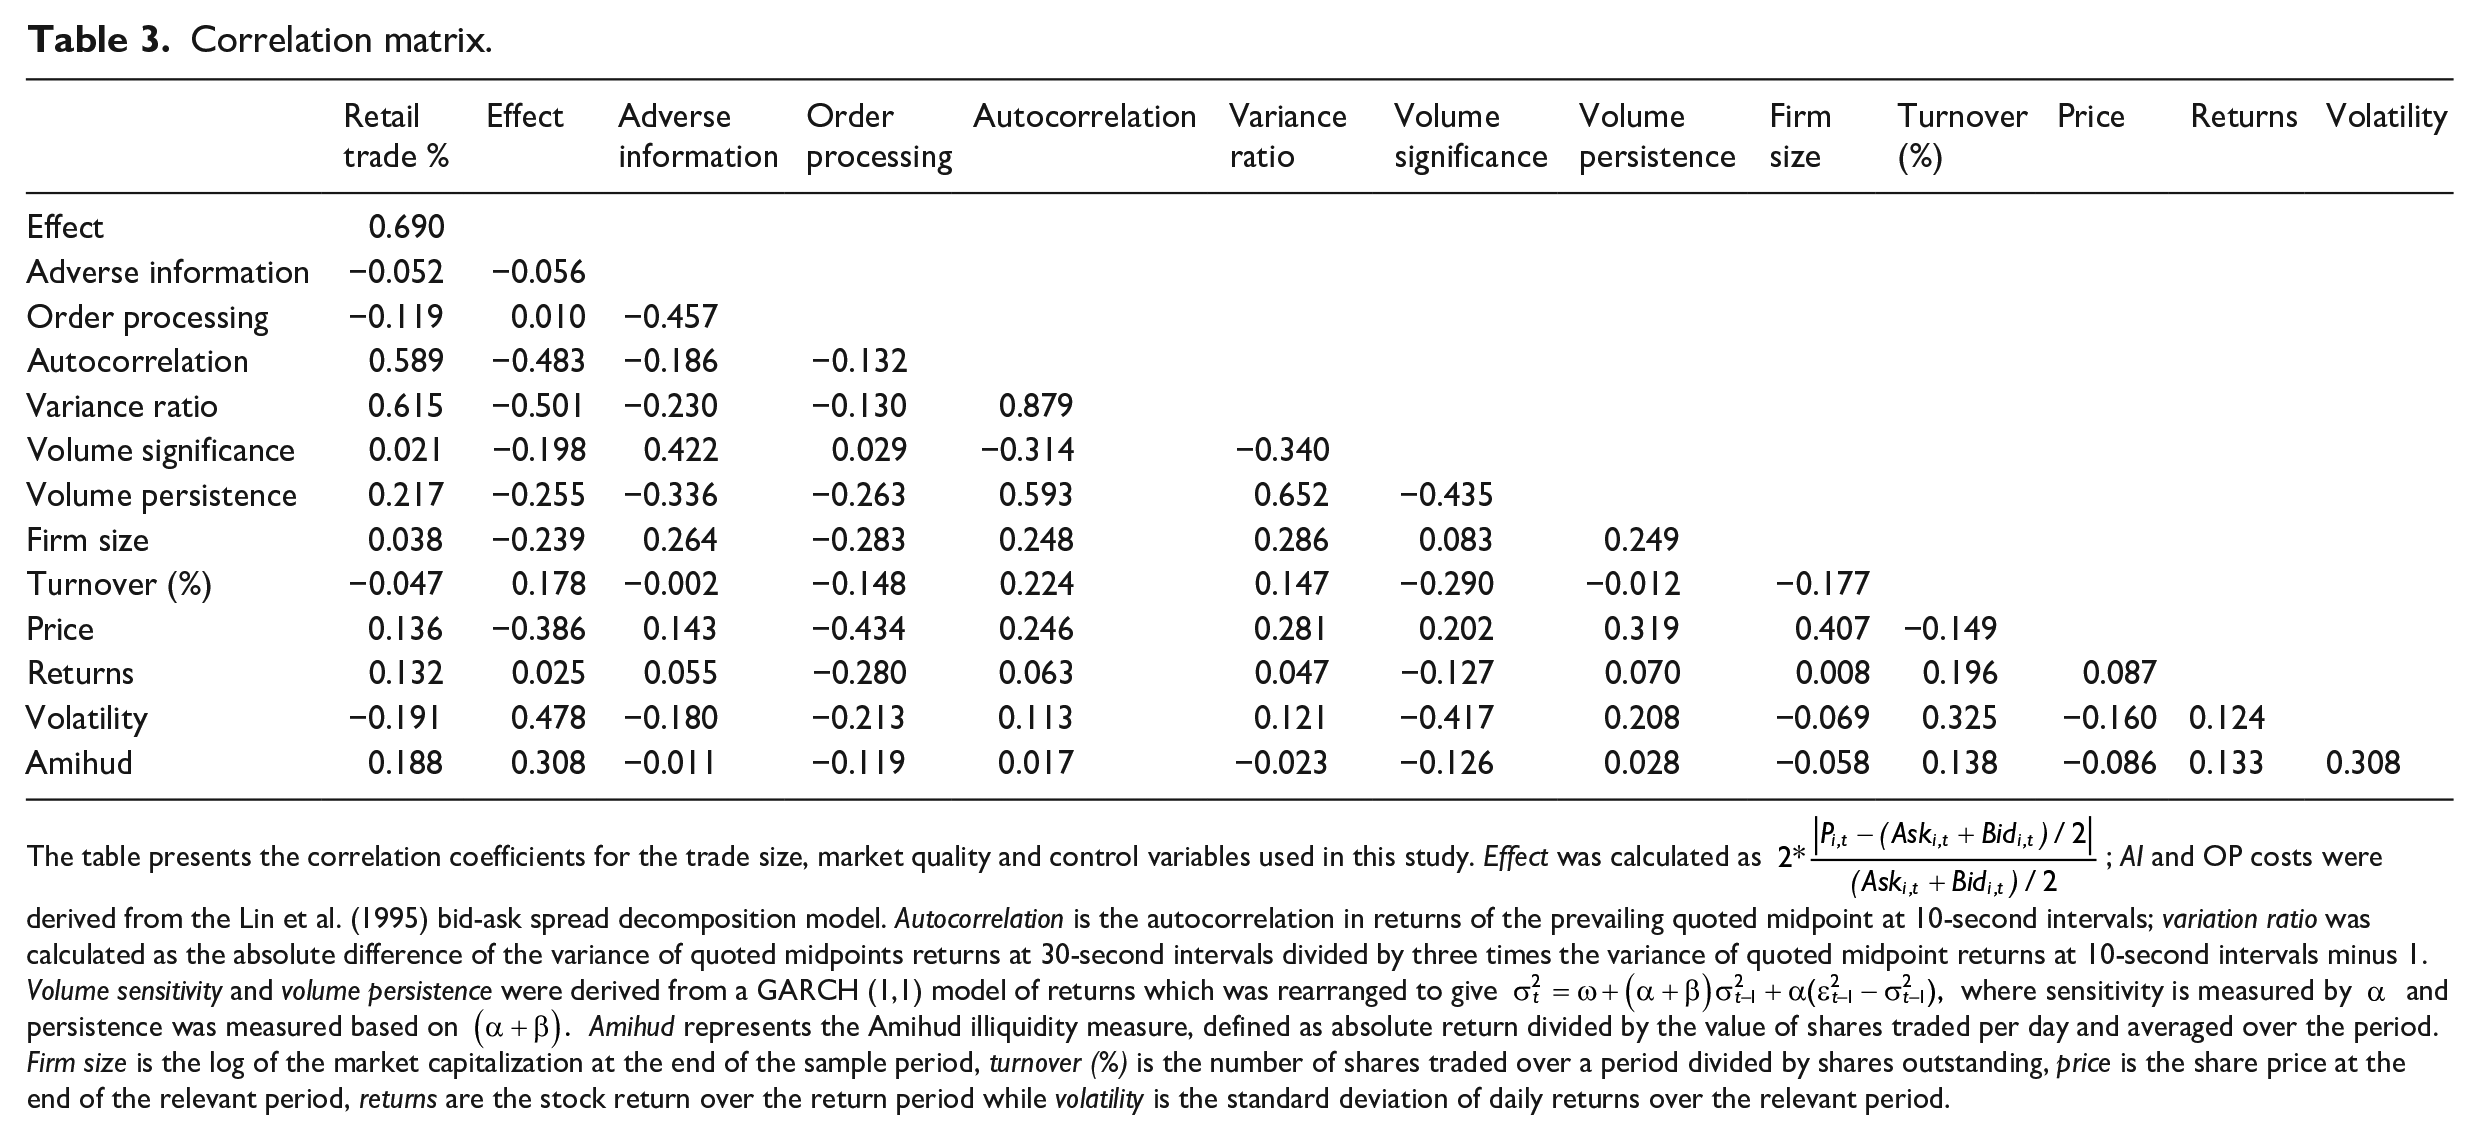
The table presents the correlation coefficients for the trade size, market quality and control variables used in this study. Effect was calculated as
In Table 4, we examine the characteristics and market quality measures of those companies that have high versus low percentages of retail trades. We rank firms into quartiles based on the pre-COVID percentage of retail trades and then look at the mean and median differences between the first (lowest percentage of retail trades) and fourth (highest percentage) quartile observations. In terms of firm characteristics, we observe that the firms with the highest percentage of retail trades are significantly smaller, NZD 204 million versus 4.8 billion on average and NZD 154 million versus NZD 3.2 billion for the median values, have lower prices, less stable stock prices (higher volatility), and have a significantly lower number of trades per day. We also observe large differences in liquidity with the Q4 firms having much lower liquidity based on the Amihud measure.
Difference in firm characteristics and market quality measures between high and low small trade firms.
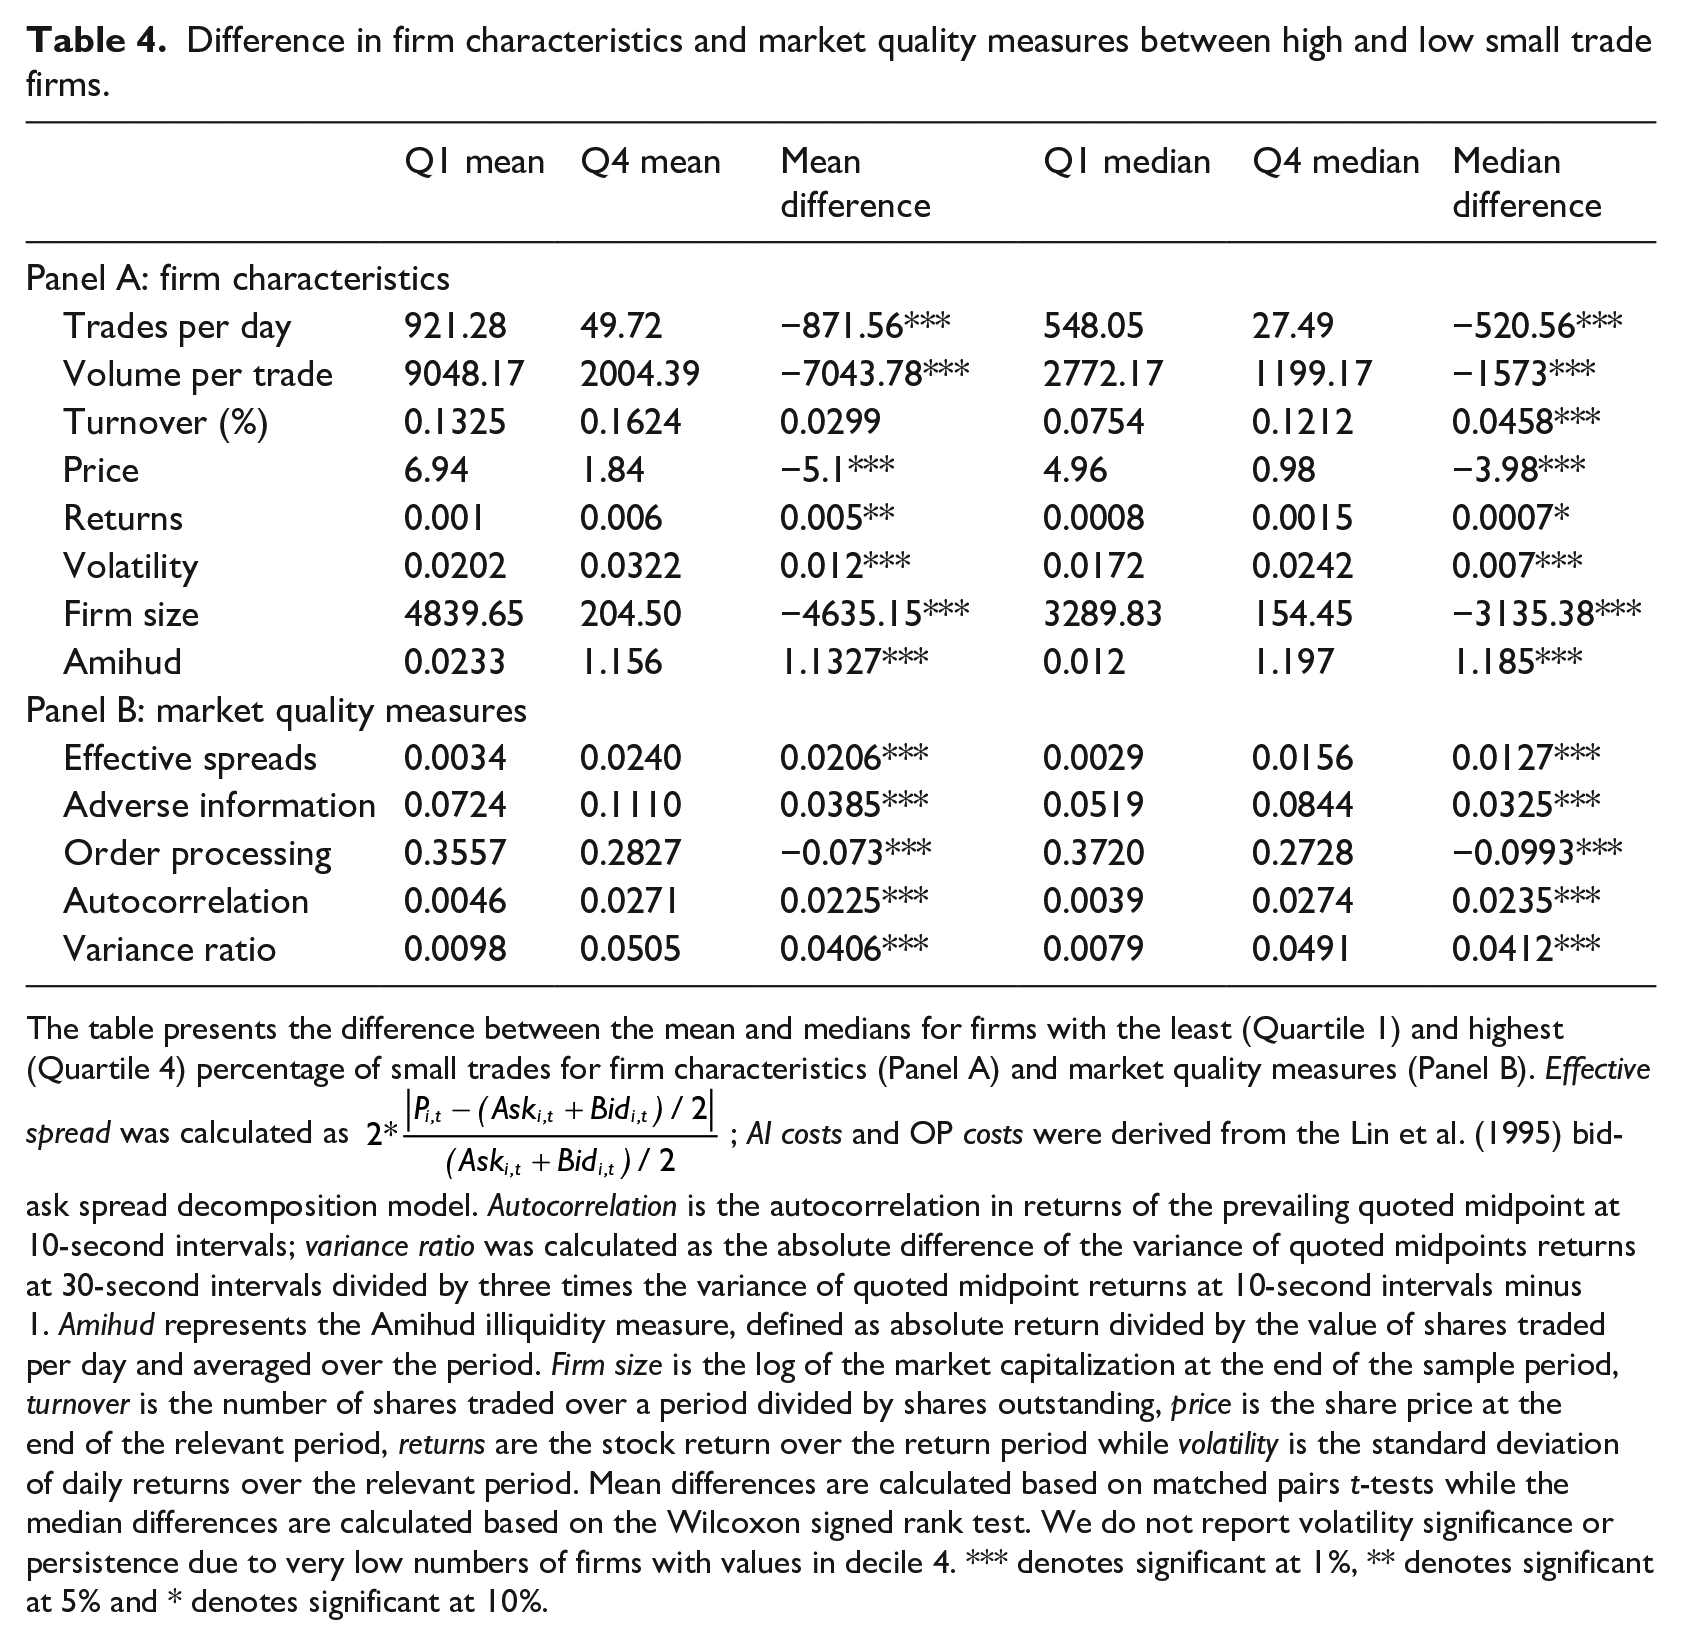
The table presents the difference between the mean and medians for firms with the least (Quartile 1) and highest (Quartile 4) percentage of small trades for firm characteristics (Panel A) and market quality measures (Panel B). Effective spread was calculated as
In terms of market quality, we observe large differences in most of our measures between firms with the highest and lowest percentage of small trades. We observe that firms with the lowest percentage of small trades have the lowest effective spreads, higher adverse selection and lower-OP costs. Finally, we find that both the autocorrelation and variance ratio measures are higher for firms with more retail trades. In essence, we see that greater percentages of retail trades result in more predictable prices. The results provide further support for our hypothesis that retail investors reduce market quality.
We next regress each of our market quality measures against the percentage of retail trades and a range of control variables that should account for other factors that may influence market quality. We start by conducting fixed effect regressions for the 12-month period sample. The results are shown in Table 5. We find further evidence to support the hypothesis that small trades diminish market quality. We observe that effective spreads are higher for firms with a higher percentage of retail trades. We observe that a greater proportion of small trades result in lower AI costs once we control for other factors, which suggests that informed trading makes a smaller percentage of all trades. One consequence of this might be to make prices contain less information as the signals from informed traders may become harder to see in the order flow. We also find further evidence of reduced market quality in the other market quality measures. Both autocorrelation and variance ratio are positively related to the percentage of small trades, indicating that more small trades result in more price predictability. However, in terms of information processing speed, we find no significant change. This result may be impacted by the fact that we only have 80 observations.
Ordinary Least Square regression for the 12-month sample period.
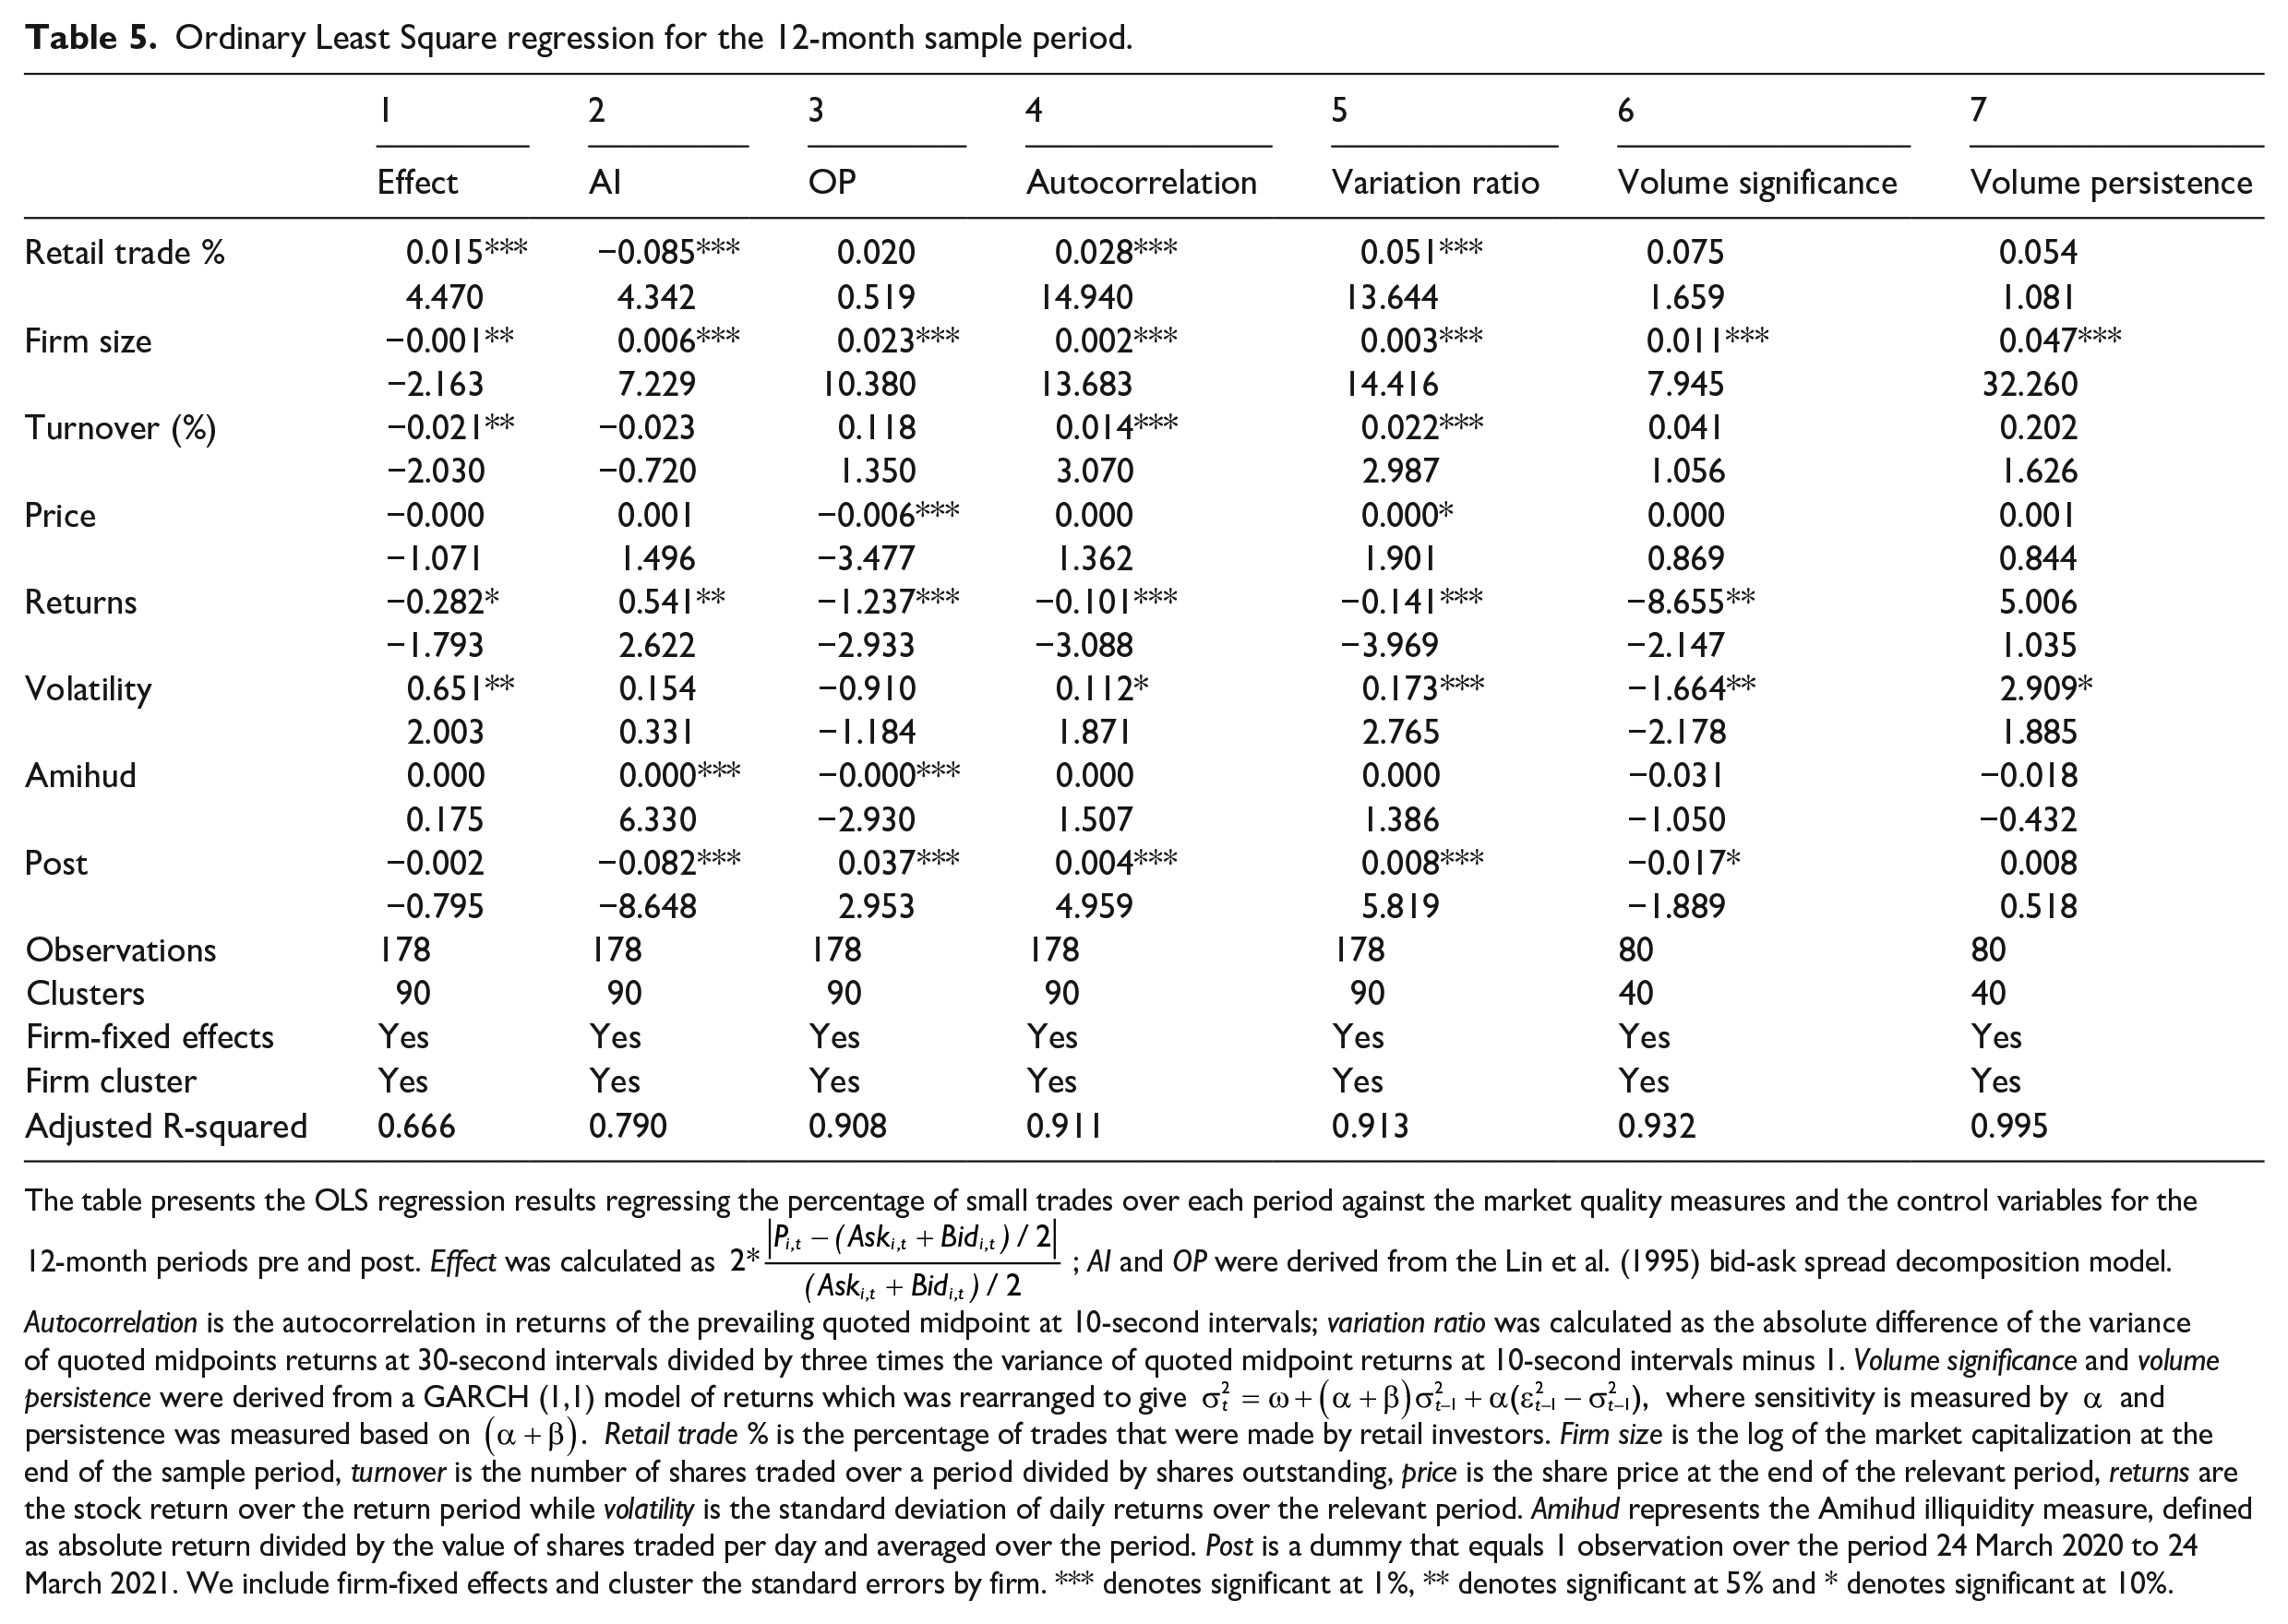
The table presents the OLS regression results regressing the percentage of small trades over each period against the market quality measures and the control variables for the 12-month periods pre and post. Effect was calculated as
In terms of the control variables, we observe that firm size is negatively related to the effective spread as expected, but is positively related to price efficiency. Larger firms also see a greater immediate impact from new information but also a more prolonged impact. Higher turnover reduces price efficiency but lowers effective spread. Higher returns result in lower effective spreads, OP costs and price efficiency but increase AI costs. Greater volatility increases effective spreads and reduces price efficiency, while greater illiquidity increases AI. The post-COVID dummy also shows that in general market quality was lower during the 12 months from March 2020 to March 2021. Specifically, we observe less informed trading costs, greater price predictability and less immediate impact from new information.
Table 6 presents the same regression model but for the 3-month period samples and reports similar findings for many of the market quality measures as above. Specifically, we find a significantly negative relationship between AI and volatility significance. We also observe significantly positive relationships with effective spreads, autocorrelation and the variance ratio. However, volatility persistence and OP remain insignificant. The positive significant coefficient for the effective spread suggests that a greater proportion of retail trades increases the effective spread, and all other factors held equal. All the results remain supportive of the conclusion that increasing number of retail trades has lowered market quality.
OLS regression for the 3-month subsample periods.
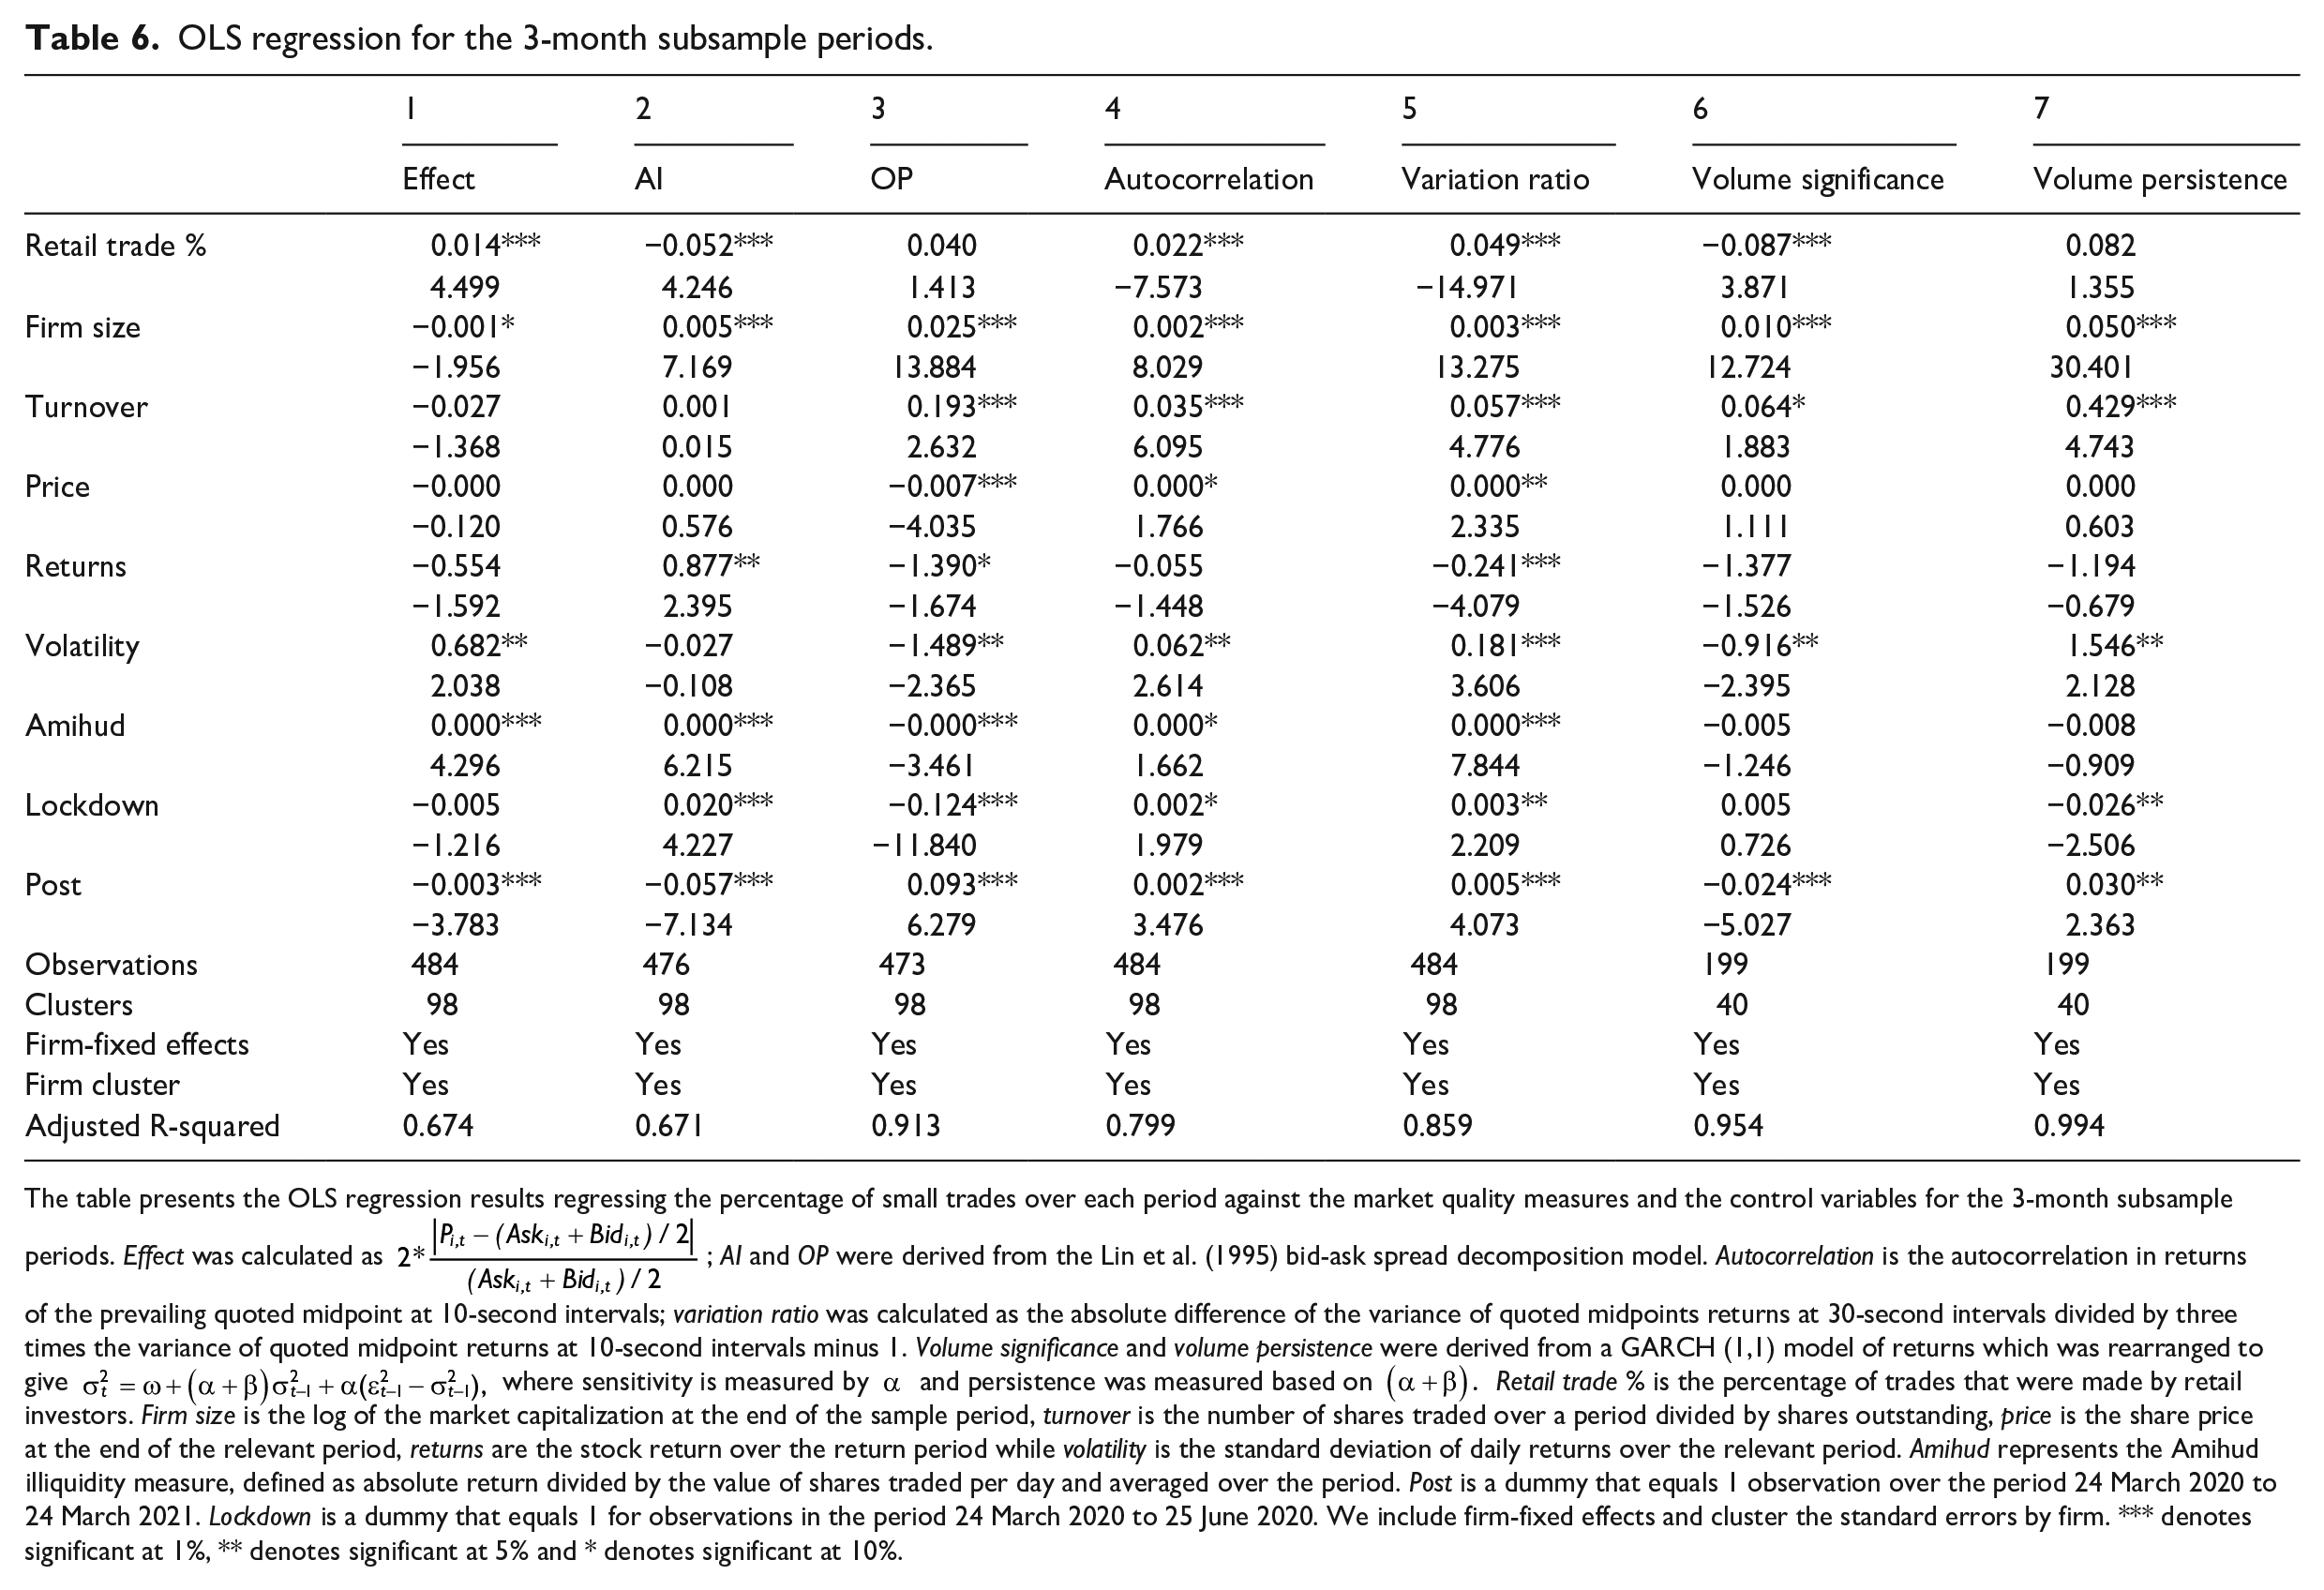
The table presents the OLS regression results regressing the percentage of small trades over each period against the market quality measures and the control variables for the 3-month subsample periods. Effect was calculated as
The control variables remain similar with firm size, turnover and volatility highly related to many of the market quality variables. Other control variables are more varied in their significance. We also observe even stronger evidence that the market has seen lower market quality during the post-COVID period with all our market quality measures significantly related to the post-dummy variable, and in the expected direction for lower market quality. In addition, we also added a dummy for the period when the national Level 4 lockdown was instituted, Post period 1. The results of the lockdown variable are less clear as we find that returns became more predictable but that there was more informed trading, lower-OP costs and finally less volatility persistence. The improvements in the spread components and volatility persistence may relate to large increase in trading, both retail and non-retail especially as the effect is after we control for the percentage of retail trading.
As a further check on our results, we conduct change regressions to see whether an increase (decrease) in small trades results in worsening (improvement) market quality as per the following equation.
The change regressions examine the impact that a change in %Retail has on the change in our market quality measure. As noted earlier, our sample period saw considerable volatility and change in markets which should be accounted for in the change in our control variables. We start by conducting the change regressions on the 12-month sample. Table 7 presents our findings, which are similar to the base regressions reported in Table 5. We find that an increase in retail trades is associated with a reduction in AI and volatility sensitivity, but increases in effective spreads, OP, autocorrelation and volatility persistence. These results, therefore, suggest that when the proportion of retail trades increase spreads increase, prices become more predictable (based on the autocorrelation measure) and it takes longer to impound new information into prices.
Change regressions for the 12-month sample period.
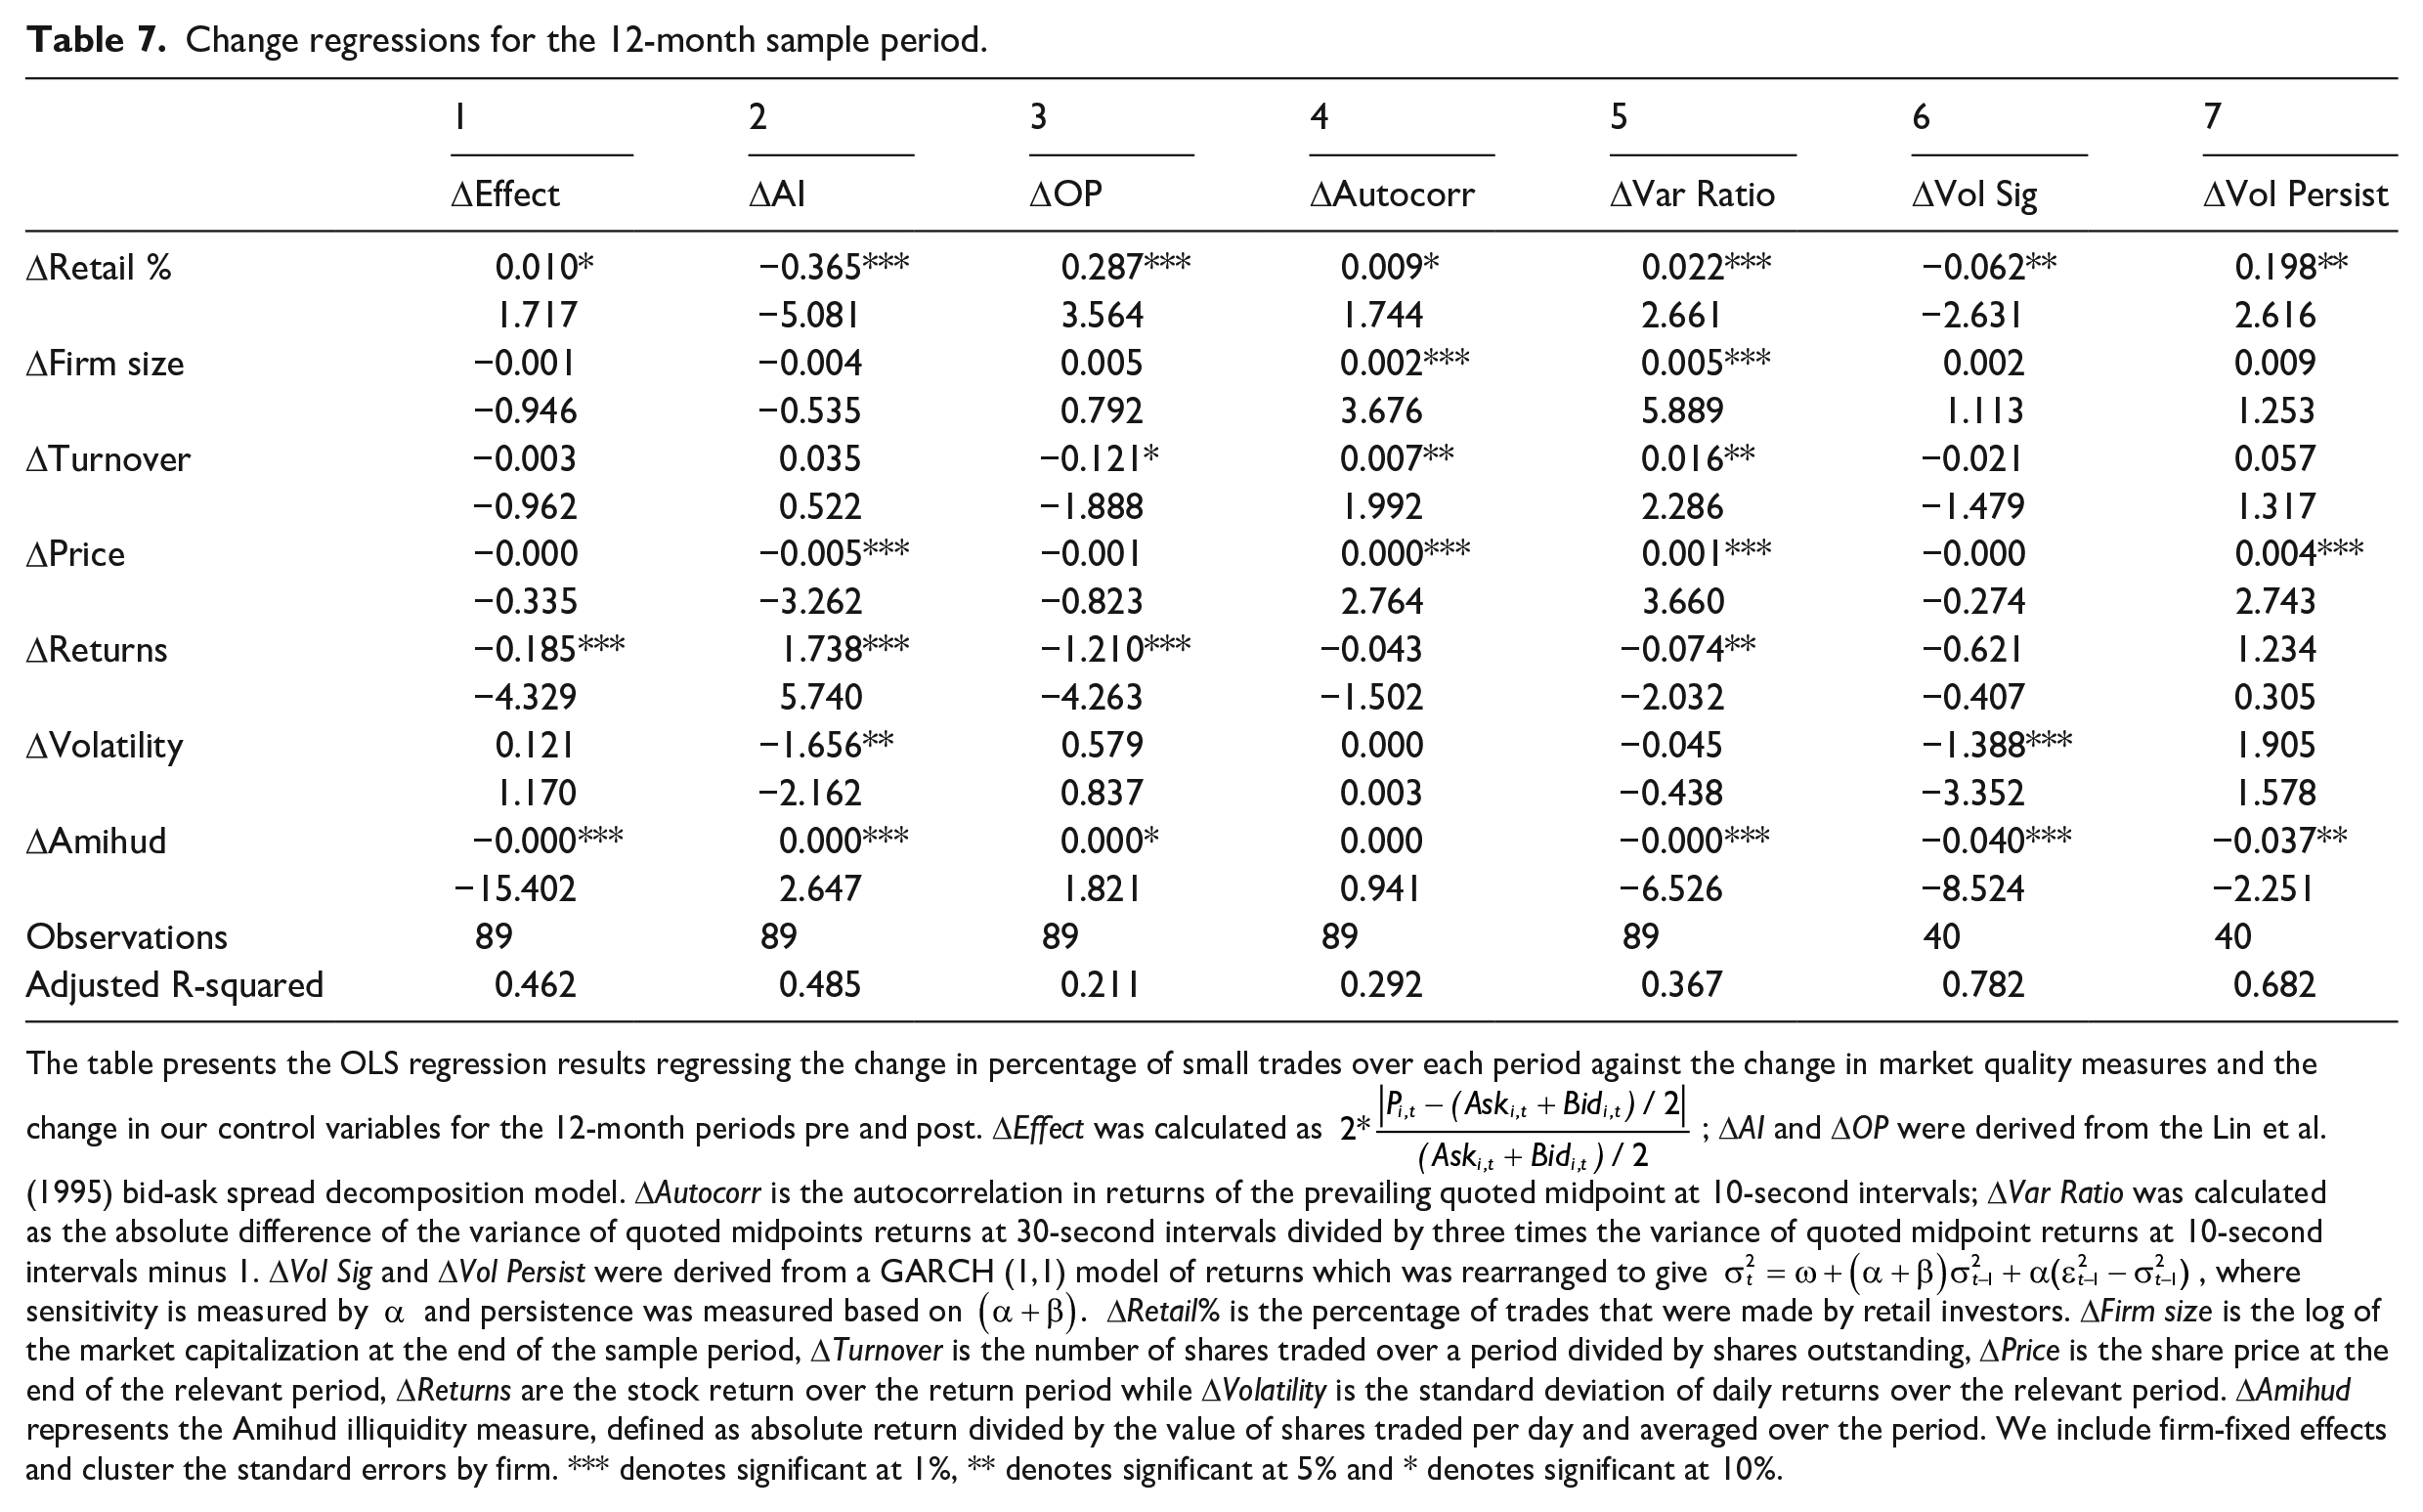
The table presents the OLS regression results regressing the change in percentage of small trades over each period against the change in market quality measures and the change in our control variables for the 12-month periods pre and post. ΔEffect was calculated as
Next, we conduct change regressions on the 3-month subsample periods. The results are reported in Table 8 and are similar to those in Table 7. We observe the same significant relationships for all the market quality measures except for volatility persistence which ceases to be significant. Overall, the change regressions present strong and consistent evidence that the influx of retail investors has harmed market quality on the NZX.
Change regressions for the 3-month subsample periods.
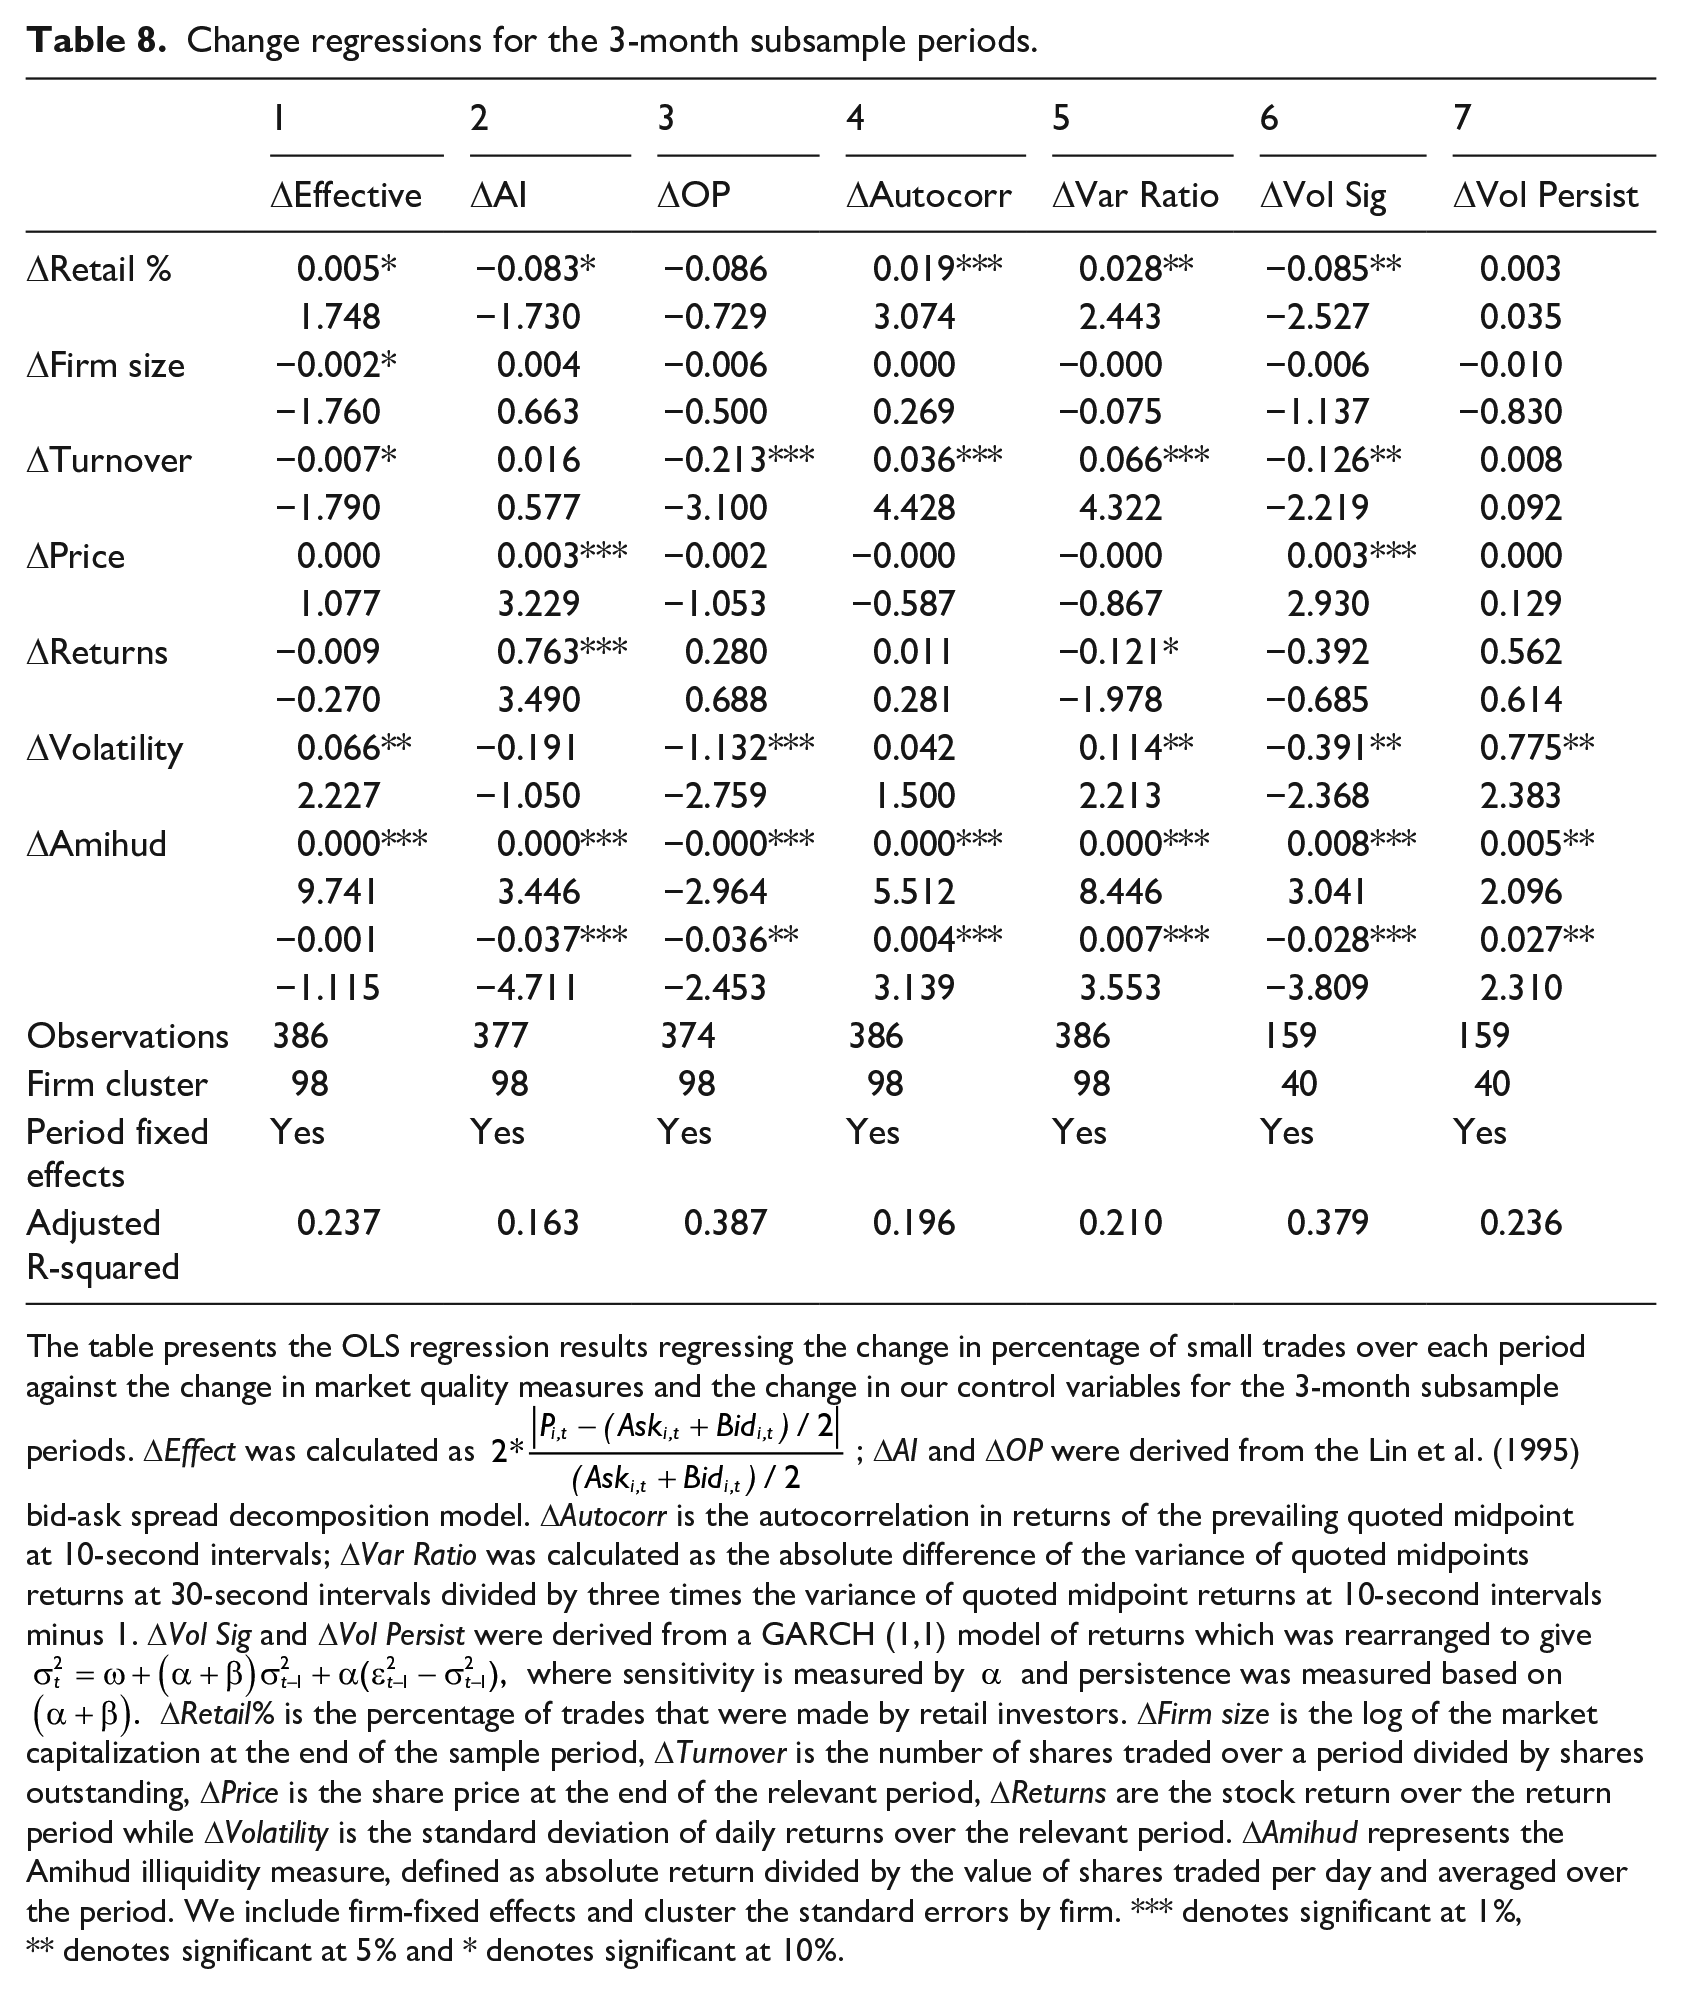
The table presents the OLS regression results regressing the change in percentage of small trades over each period against the change in market quality measures and the change in our control variables for the 3-month subsample periods. ΔEffect was calculated as
5. Conclusion
In this article, we look at the impact of the influx of retail investors on the NZX. The influx of new liquidity had the potential to be beneficial for the NZX which has typically had lower trading activity than other developed market countries, especially the Australian Stock Exchange which has become a popular replacement for the NZX with NZ-listed companies in recent years. In theory, higher liquidity should make the market more efficient and result in better pricing of securities. However, much of the influx of new liquidity has come from new retail investors who lack the knowledge and experience of institutional investors. Prior literature has found that retail investors behave as noise traders, engaging in herding behaviours or trading on inaccurate or non-existent information signals. The extant literature has previously established that noise traders have a negative effect on market efficiency. This article set out to explore whether the improvements from the extra liquidity would be enough to outweigh the previously established negative impacts of noise traders.
The COVID period offers an excellent opportunity to explore these issues as low interest rates, making other financial asset classes more attractive, combined with fintech investing platforms making trading cheaper and easier than ever before and lockdowns/stay at home orders in many countries due to the COVID-19 pandemic created a unique environment that resulted in significant increases in number of retail investor participating in many markets since early 2020. NZ saw more than 50,000 new retail investors in the first 6 months of 2020 and hundreds of thousands over the following 18 months. Using a sample of 99 New Zealand Exchange listed companies, we collect intraday price and quote data from 1 January 2019 to 24 March 2021. We compute a range of market quality measures across three categories: trading costs, price efficiency and speed of incorporating information, and market volatility. Our results show clear evidence that the negative consequences of retail traders behaving as noise traders dominated the additional trading activity. In particular, the influx of retail investors has reduced market quality; in particular, we see more price predictability and information being impounded into prices more slowly. This suggests that not all liquidity is good liquidity.
Footnotes
Acknowledgements
The authors wish to thank an anonymous referee and the editor for their suggestions for improving this study.
Final transcript accepted 20 March 2024 by Tom Smith (AE Finance).
Funding
The author(s) received no financial support for the research, authorship and/or publication of this article.