
Abstract
Digital transformation (DT) is a complex, socio-technical, strategic, and often radical change influenced by various aspects, among which non-technological, organizational factors play significant roles. The literature on DT enablers suggests sensitivity to the organizational context, especially to the technology intensity of companies. This article analyzes the variations in non-technological DT enablers in high-tech and low-tech manufacturing companies. Through a systematic literature review, using coding techniques and cluster analysis, we created 20 aggregated enabler categories. With the Decision Making Trial and Evaluation Laboratory (DEMATEL) method, clustered DT enablers in high-tech and low-tech companies were compared. High-tech companies enable DT with the factors related primarily to organizational flexibility and dynamism. In contrast, low-tech firms propel DT with the enablers connected to more stable, traditional, managerial practices.
JEL Classification:
031 and 032
Keywords
1. Introduction
The frequent and widespread introduction of new digital technologies in various areas of human life is accompanied by radical changes in organizations, industries, and societies (Kraus et al., 2021). The scale and pace of these technology-enacted changes force companies not just to implement new technological advancements into their processes and products, but also to drastically transform the very principles of doing business. As a result, digital transformation (DT), widely understood as strategic large-scale organizational change enabled by the integration of digital as well as non-digital technological innovations (Jones et al., 2021), has stimulated a large set of studies, with both theoretical (Loon and Quan, 2021) and practical implementations (Chawla and Goyal, 2022).
DT is becoming a strategic imperative for all industries and sectors of the economy, and particularly so where globally competitive forces are sharp, such as for companies in the manufacturing industries. The significance of DT for manufacturing companies is reflected in the nationwide programs initiated by many countries. The “Advanced Manufacturing Partnership” in the United States, “La Nouvelle France Industrielle” in France, “Future of Manufacturing” in the United Kingdom, and “Digital economy” in Russia are just a few notable examples of such programs (Liao et al., 2017).
The benefits that DT can potentially bring about to manufacturing businesses are multifaceted and include improved productivity and reduced costs (Hess et al., 2020), redesigned products and services (Nambisan et al., 2017), reinvented supply chains (Choudhury et al., 2021), enhanced innovativeness through better decision making (Carlsson, 2018), and new competitive advantages (Leão and Da Silva, 2021). At the same time, DT is associated with high risks and disruptions for companies and is characterized by meager success rates. According to Morakanyane et al. (2020), only 20% of companies succeeded in realizing full value from DT. These mixed results are conditioned by DT’s complex nature, dependent on the interplay of various socio-technical factors that are not fully within managers’ control (Nadkarni and Prügl, 2021; Wiggins et al., 2020). That is why there is an increasing emphasis on research investigating barriers, enablers, antecedents, drivers, success factors, and other ingredients of DT grouped into various sets and classifications (Ghobakhloo and Iranmanesh, 2021; Gölzer and Fritzsche, 2017; Kohnke, 2017; Moreira et al., 2018; Schallmo et al., 2017; Stentoft et al., 2021; Trenerry et al., 2021; Wolf et al., 2018; see Appendix 1 for a complete view). We, therefore, contend that there is a lack of coherence between different classifications of enablers, and there is a need to systematize them in a comprehensive structure.
One of the sources for different views on DT enablers is that they are analyzed from different angles and contexts. First, some authors focus more on particular technologies enabling DT in companies (Schallmo et al., 2017), whereas others also include a broader range of non-technological, primarily organizational, business-oriented factors (Moreira et al., 2018). DT can be considered to encompass both technical and non-technical enablers and success factors, drawing on the rich traditions of socio-technical systems (Boeing et al., 2020). Second, one of the dimensions that distinguish companies by their readiness for DT is the technological or R&D intensity, traditionally measured as the ratio of technological research and development expenditure to its revenues (Galindo-Rueda and Verger, 2016). Moreover, technology intensity influences many aspects of corporate innovativeness and related capability factors (Dong et al., 2021). Therefore, low-tech and high-tech manufacturing companies are expected to have different conditions for DT and different sets of DT enablers relevant to their contexts. Third, the variety of DT enablers observed in the current literature is accompanied by a multitude of different interpretations. For DT, as a corporate-wide and often radical change, the factors related to organizational flexibility and agility and “change readiness” are important. According to Evans and Bahrami (2020), corporations facing the challenges of necessary radical change should possess and use dynamic capabilities of flexibility encompassing all functions and subsystems of a business.
This study focuses on non-technological DT enablers and aims to test and evaluate whether these enablers are different in low-tech and high-tech manufacturing companies. We approach this question with a methodology including the extensive review of the studies related to DT enablers, qualitative coding technique and cluster analysis of the identified enablers, and the Decision Making Trial and Evaluation Laboratory (DEMATEL) method (Si et al., 2018). Our research is based on the expert knowledge of DT professionals from Russian low-tech and high-tech manufacturing industries. The study contributes to contemporary knowledge by systematizing DT enablers relevant to manufacturing companies, identifying DT enablers typical for low-tech and high-tech companies, and interpreting the identified differences from the perspectives of organizational flexibility theory and practice (Sharma et al., 2010).
The rest of this article is organized as follows. In the following section, a concise review of theoretical concepts of DT, its enablers, and their sensitivity to technology intensity is provided, followed by the research methodology. Subsequently, the findings are presented and then discussed. Finally, we conclude by presenting the theoretical contributions, managerial implications, limitations of the study, and suggestions for further research.
2. DT and its enablers
There is extensive research on DT identifying the essential features of this complex phenomenon. Compared with other concepts related to “digital” research discourse, such as digitization, digitalization, and Industry 4.0, the concept of DT is more oriented to business and organizational facets of digital technology implementation than purely technical considerations. DT is associated with major business changes (Fitzgerald et al., 2013), new business models, innovations, and performance of whole enterprises (Westerman et al., 2011), changing the rules of the game within organizations and industries (Hinings et al., 2018), and integration of technologies and business processes (Liu et al., 2011). It goes beyond trivial automation, referring to fundamentally new capabilities (Martin, 2008), change in a whole value creation process (Gölzer and Fritzsche, 2017), change in the business logic and model of a firm (Li et al., 2018), and the transformation of the entire company and its ways of doing business (Amit and Zott, 2001). DT goes beyond applying particular technologies in specific organizational processes. It is “a company-wide phenomenon with broad organizational implications in which, most notably, the firm’s core business model is subject to change through digital technology” (Verhoef et al., 2021: 892). Therefore, from a discipline perspective, DT fits more closely to strategic management than technology management. As a result, it is sensitive to many non-technological influences.
Such a multidimensional endeavor as DT cannot be implemented with only traditional management of organizational assets based on the formal strategies, plans, procedures, and commands. Managing DT is more like a choreography or orchestration of many internal and external factors than pure administration of a company’s resources (Chen and Tian, 2022). The current research focuses on identifying DT’s barriers, enablers, antecedents, contextual situations, and success factors. However, the current knowledge in this area is unsystematic. First, some researchers consider only digital technologies (Schallmo et al., 2017) as enablers, whereas others pay more attention to non-technological, organizational factors (Stentoft et al., 2021) or combine both technological and non-technological enablers (Moreira et al., 2018). Second, scholars approach DT enablers from various levels of analysis—national or regional economy (Alibekova et al., 2020), industry or a group of industries (Sanchis et al., 2019), or a focal company (Bouwman et al., 2019). Third, some authors construct complete classifications of enablers, sometimes overlapping (Ghobakhloo and Iranmanesh, 2021; Trenerry et al., 2021) and sometimes totally different (Kohnke, 2017; Wolf et al., 2018). Others identify only one or a couple of enablers (Dombrowski and Fochler, 2018). Finally, one group of researchers analyzes DT enablers relevant to a particular type of company or industry. For instance, Garzoni et al. (2020) investigated DT enablers in small- and medium-sized enterprises (SMEs). Büyüközkan et al. (2019) examined DT enablers in aviation companies. Some other authors analyzed manufacturing companies in different sectors (Liere-Netheler et al., 2018). The identified enablers are different, but the reasons for the observable similarities or dissimilarities are not clear.
In sum, the current understanding and state of knowledge of DT enablers comprises many studies of varying quality and degree of rigor, from surveys to reviews, often without controlling or measuring factors such as the degree of technological sophistication within firms. To partially deal with this problem, we focus our study on the following:
The identification and structurization of: ▪ Non-technological enablers, because they mostly correspond to the strategic nature of DT; ▪ Enablers relevant to manufacturing companies, because they are highly affected by digital technologies; ▪ Enablers pertinent to a company’s level of analysis, because companies are the most active agents of DT (even in global, national, or industrial contexts);
Testing the hypothesis that DT enablers in low-tech and high-tech companies are different.
The last aspect needs additional clarification. Although DT is a strategic, company-wide venture, technologies play a significant role. It is reasonable to expect that DT enablers in companies are conditioned by technology intensity (Galindo-Rueda and Verger, 2016). This conjecture is supported by the research on DT (not explicitly related to its enablers) in companies with different technological levels. Siachou et al. (2021) studied the specificities of DT in traditional companies and concluded that absorptive capacity and strategic interdependence determine the outcomes of DT. Bertello et al. (2021) discovered DT barriers in low- and medium-tech firms related to administration/finance, organization, strategy, and collaboration. Borovkov et al. (2021) identified DT barriers specific to high-tech manufacturing firms. These barriers included outdated manufacturing technologies, limited IT infrastructure capacity, special software infrastructure availability, lack of financial resources, and lack of qualified specialists. Baber et al. (2019) found that effectuation capability plays a significant role in DT, specifically in high-tech firms in Japan. Therefore, the current research suggests that DT and its enablers are sensitive to firms’ technology intensity. However, there are very few studies explicitly comparing DT enablers in companies of different levels of technology intensity.
Addressing the research and literature gaps as mentioned above, we hypothesize that DT enablers vary for companies with different technology intensity and formulate our research question as follows:
RQ. Are non-technical DT enablers in high-tech and low-tech manufacturing companies different?
Being a corporate-wide, complex socio-technical change, DT implies the vital role of dynamic capabilities related to flexibility, agility, and change management (Ghosh et al., 2021). Therefore, the answers to the research question are interpreted with particular attention to the role of the enablers associated with organizational flexibility and other dynamic capabilities relevant to corporate change management, across firms with varying technological intensity.
3. Method
The study is based on a systematic literature review, qualitative coding technique, cluster analysis, and the DEMATEL method. The flow diagram of the research is presented in Figure 1.
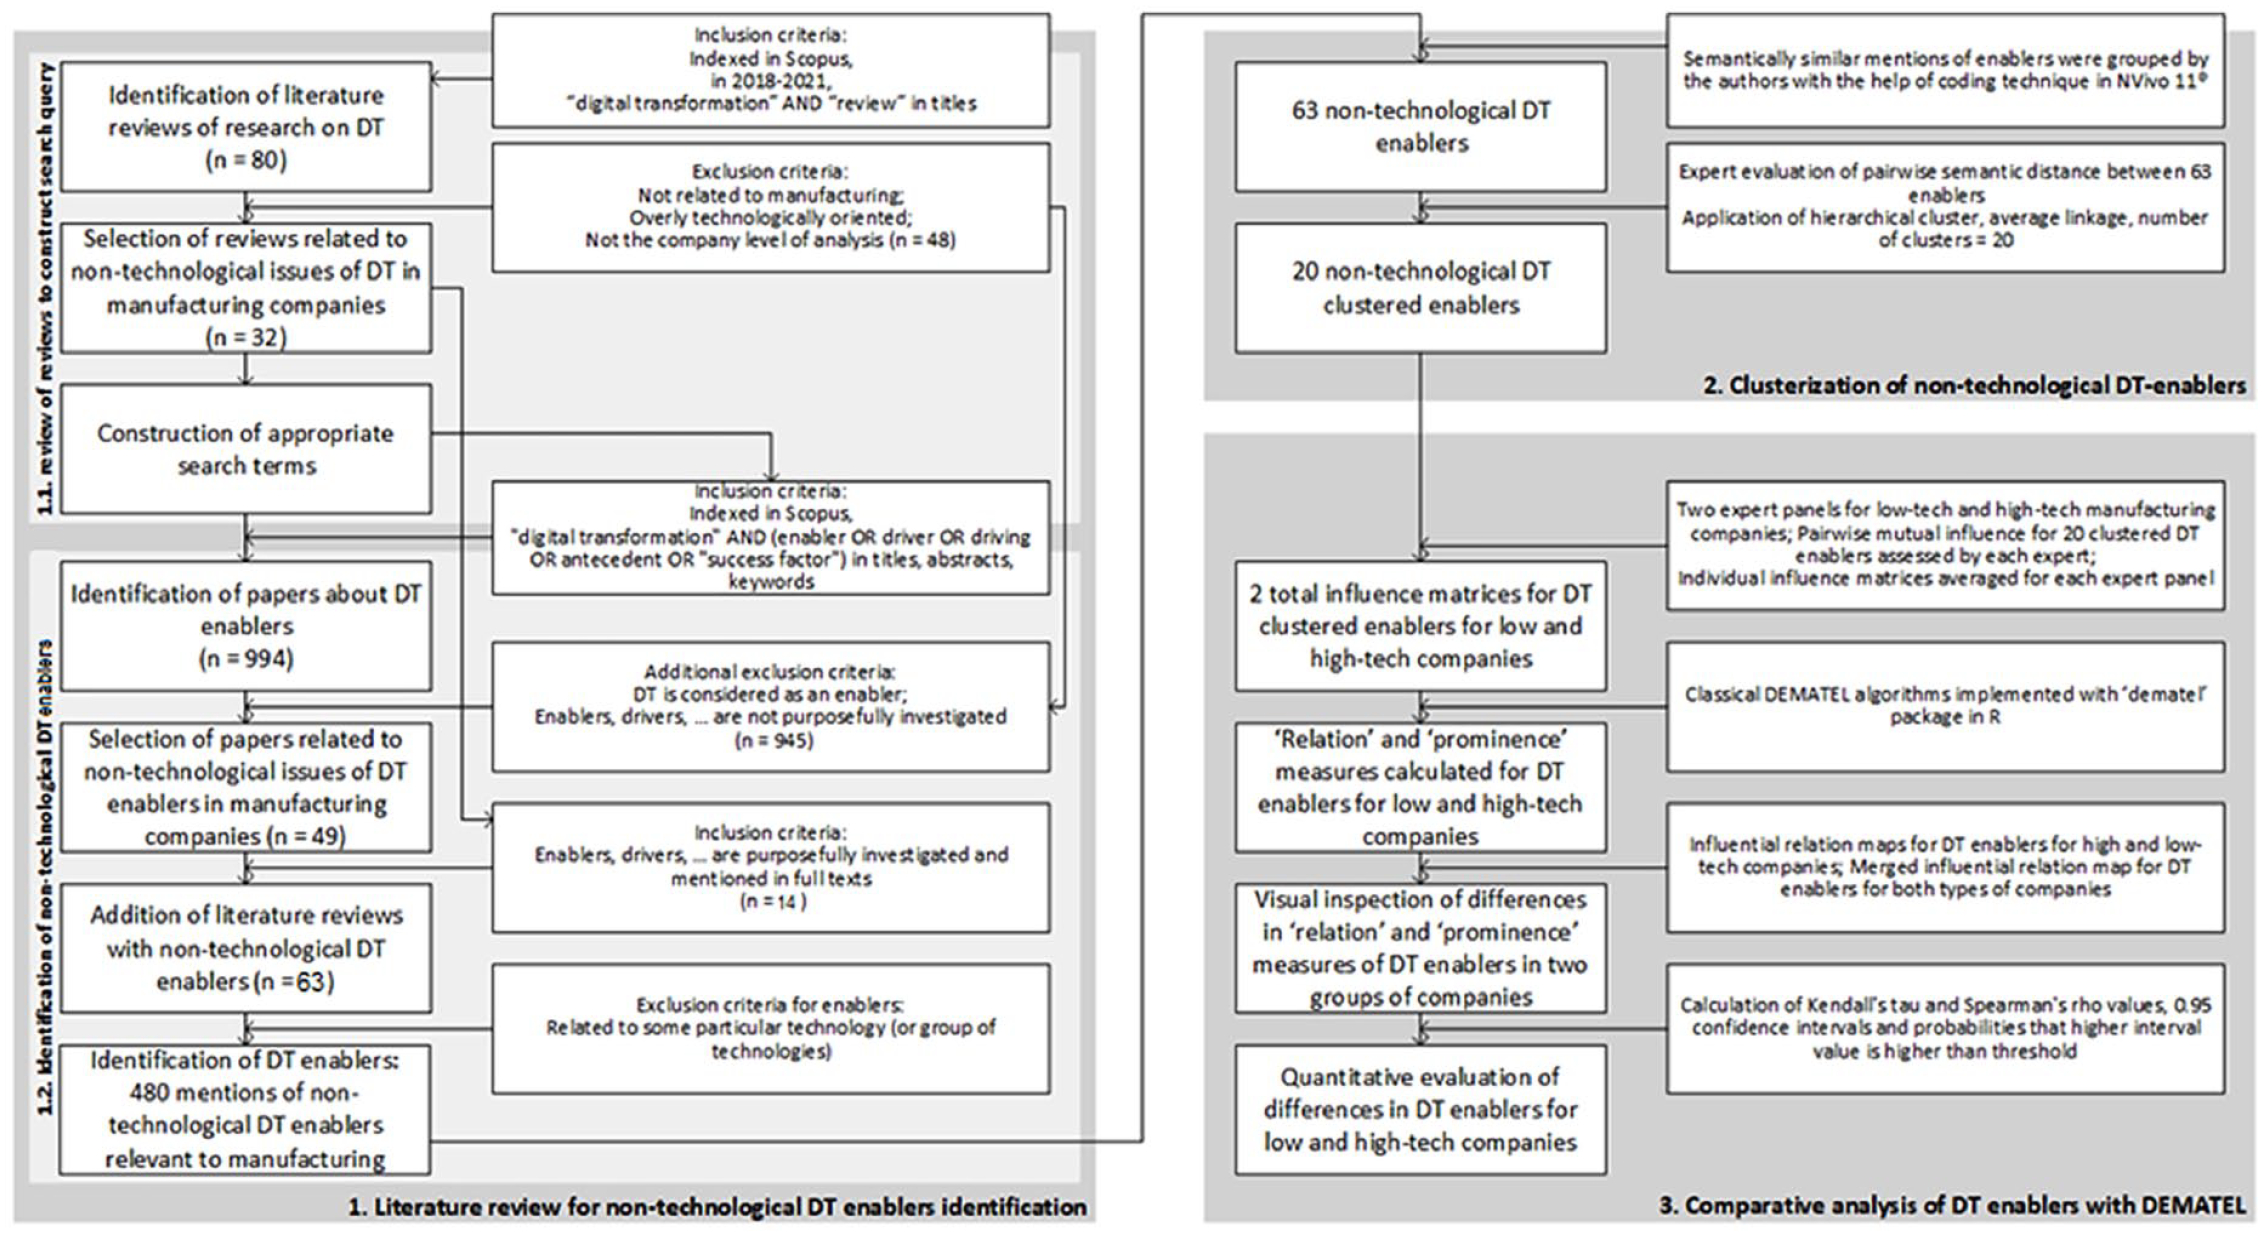
Research methodology flow diagram.
The left part of the diagram represents the literature review conducted to identify the comprehensive list of DT enablers in manufacturing companies. It includes two steps. First, the existing literature reviews of studies of DT in manufacturing companies were reviewed to identify the proper search terms needed to find DT enablers. Second, the papers related to non-technological DT enablers in manufacturing companies are selected and all mentions of the enablers were identified.
The right part of the diagrams shows the structurization of enablers and their comparison in high-tech and low-tech companies. The identified DT enablers were structured based on the authors’ judgment and coding technique in NVivo® software (QSR International Pty Ltd, 2018). Then the enablers were grouped into a smaller number of categories using a cluster analysis approach, based on the experts’ assessment of semantic distance between DT enablers. After that, the DT enablers in high-tech and low-tech manufacturing companies were compared with the DEMATEL method based on experts’ evaluations of the pairwise influence of DT enablers on each other and calculated quantitative measures for the differences between the two groups of DT enablers. A more detailed methodology is provided below.
3.1. Literature review for DT enablers’ identification
As DT enablers may be clothed in different linguistic forms (antecedents, drivers, stimulators, imperatives, just to name a few) (Lokuge and Duan, 2021), the appropriate search terms were constructed. As the first step, the existing literature reviews on DT published in 2019–2021 were searched in Scopus; as Jones (et al., 2021) suggested, it comprises a representative collection of papers on DT. A total of 80 items with “digital transformation” and “review” in titles were identified. With the exclusion criteria mentioned in Figure 1 (top-left part, “1.1. review of reviews to construct search query”), 48 papers were eliminated and 32 articles were read in full text. It was found that such terms as “digitization,” “digitalization,” “digitalizing,” ‘digitizing,” and “Industry 4.0” were typical for the research related to the technological aspects of DT. Only “digital transformation” refers to the strategic business-oriented nature of DT. Based on the most frequently used synonyms of “enabler” (such as “driver,” “driving . . .” “antecedent,” and “success factor”), the search query was developed as TITLE-ABS-KEY (“digital transformation”) AND TITLE-ABS-KEY (enabler OR driver OR driving OR antecedent OR “success factor”).
In the second step, the non-technological DT enablers relevant to manufacturing companies were identified. With the constructed search term, 994 items indexed in Scopus till 2021 were found. Based on the selection process and criteria shown in the bottom-left part of Figure 1 (“1.2. identification of non-technological DT enablers”), 49 papers were included. The final list consisted of 63 papers which also included 12 articles from the first step and 2 papers recommended by the reviews at the final stage of publication. The descriptive information on the final list is present in Table 1.
Descriptive information on literature reviewed.
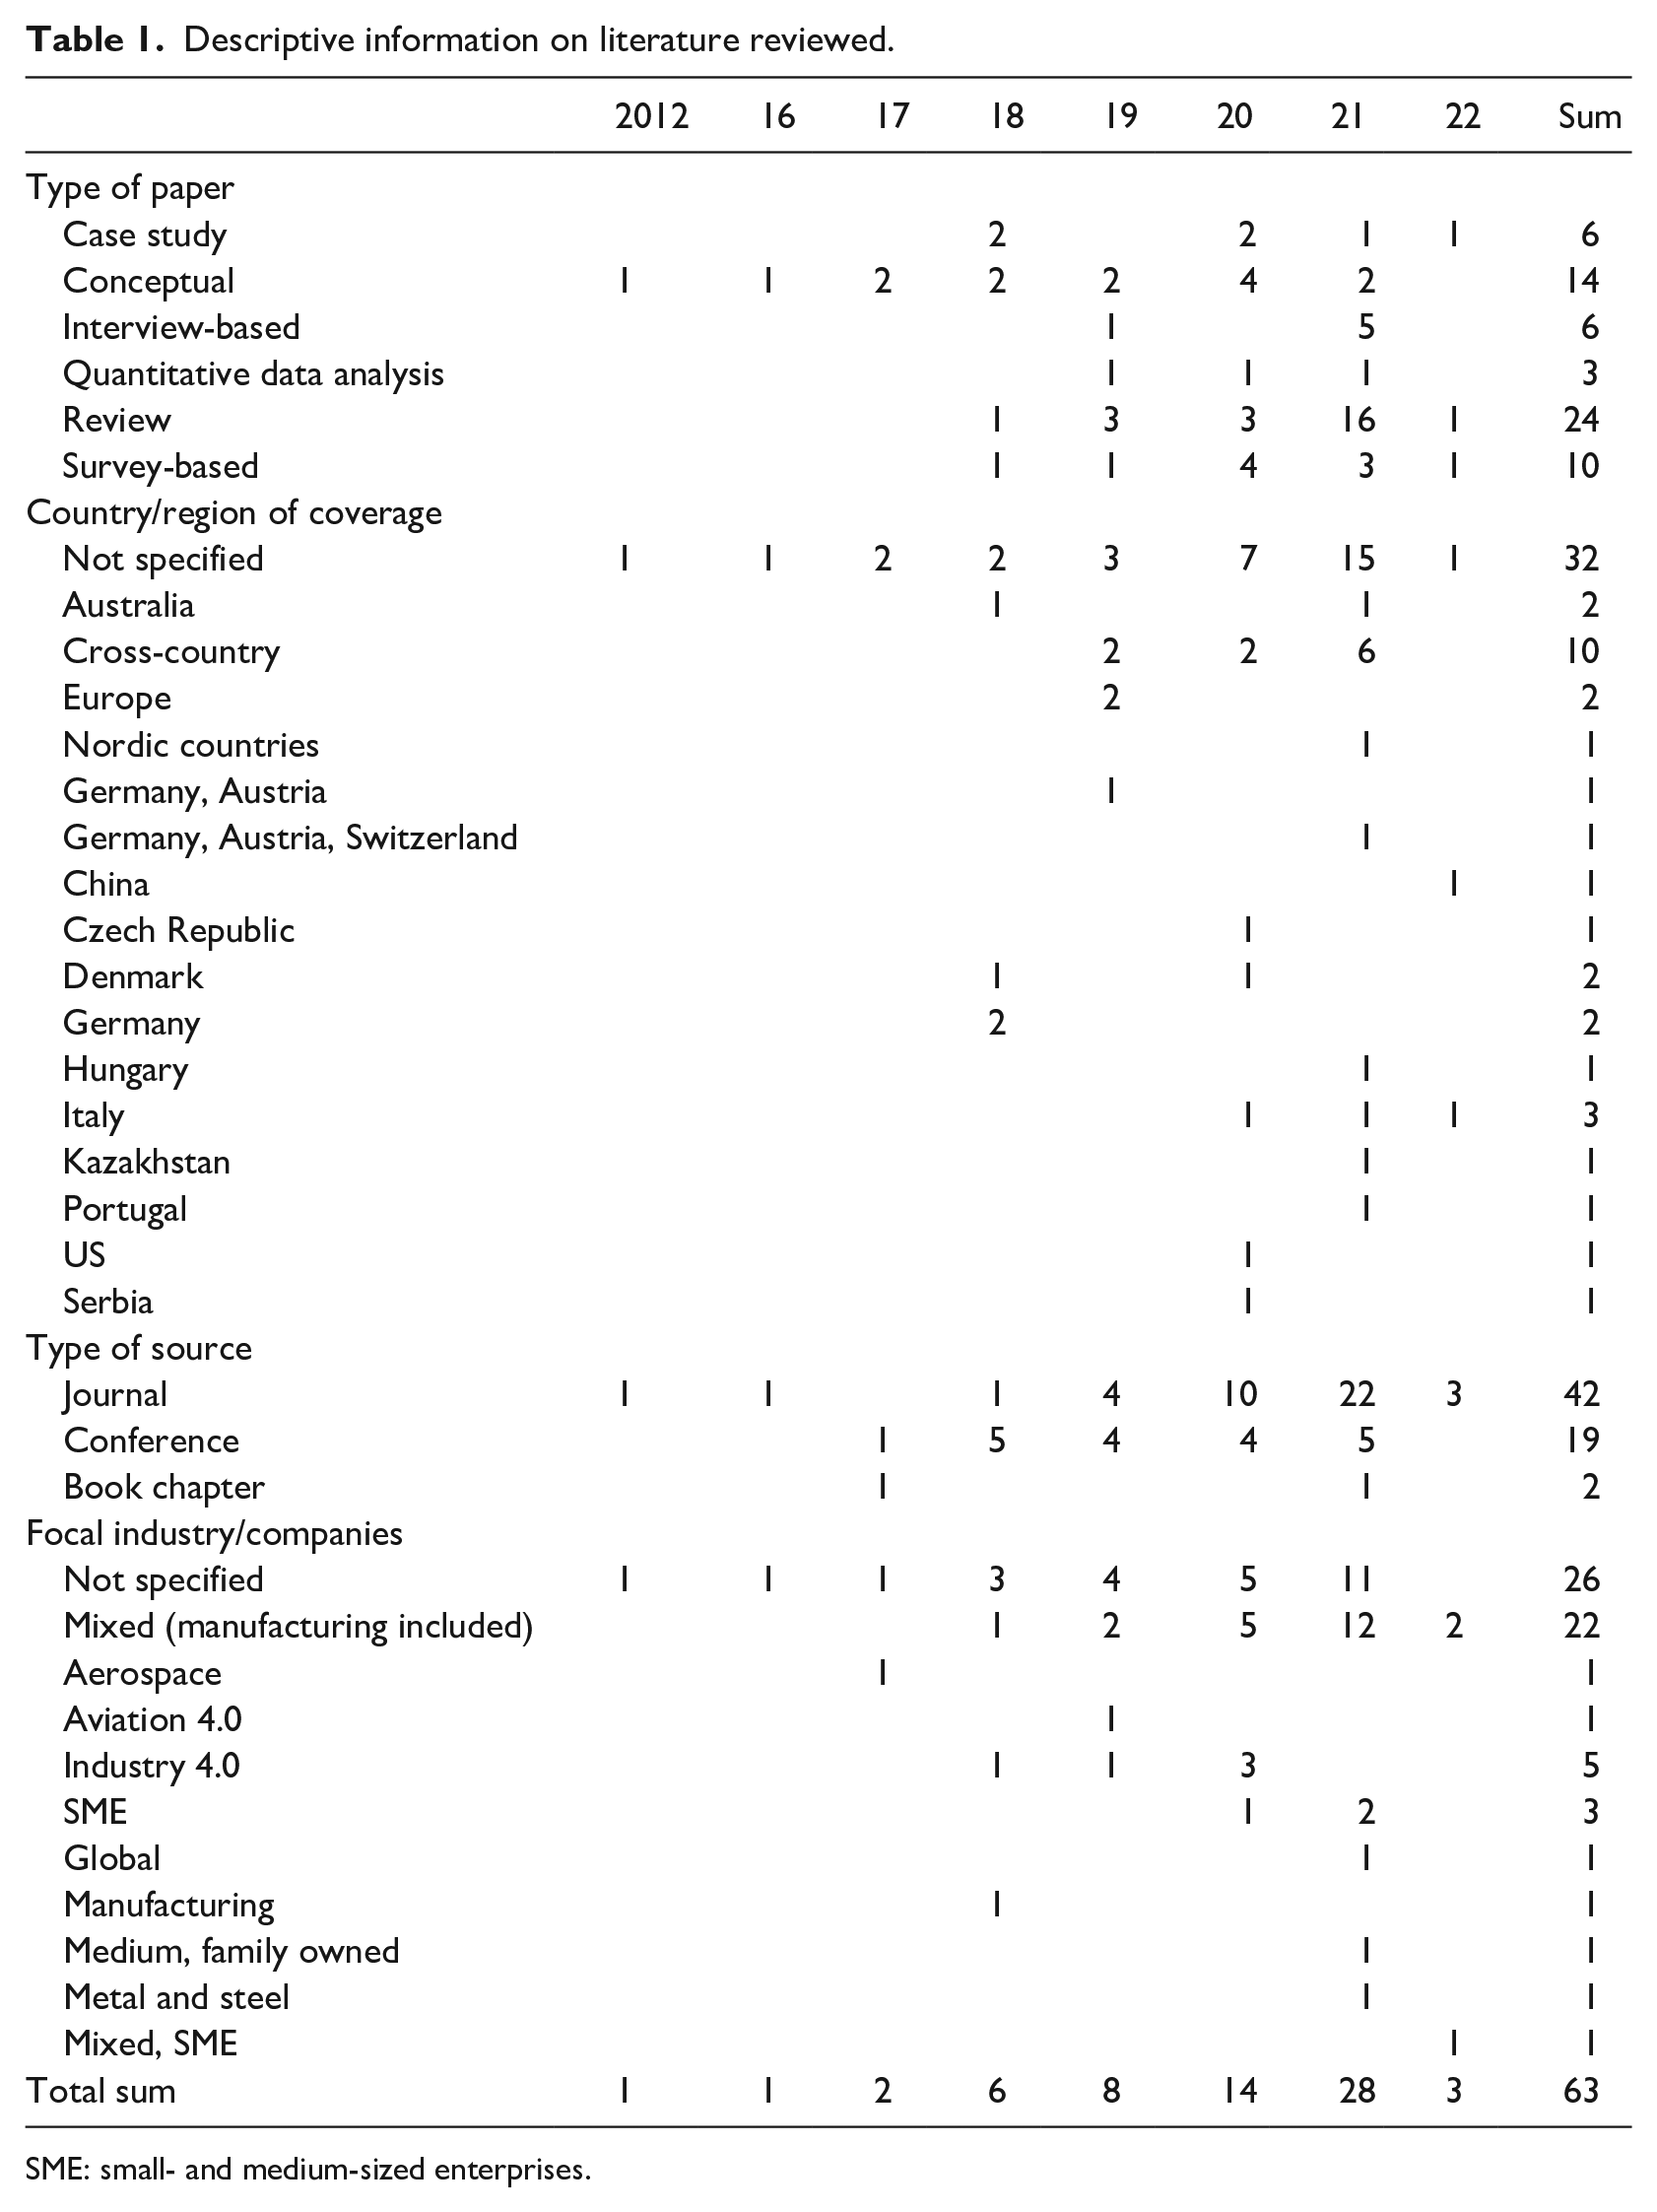
SME: small- and medium-sized enterprises.
3.2. Structurization of DT enablers
The list of all enablers included full synonyms, different wordings with the same or close meaning, and very different terms. The number of enablers was reduced in two steps.
Within the first step, the semantic similarity of the identified enablers was analyzed using a coding technique widely known in qualitative research (Saldana, 2015). The aim was to group all identified mentions of enablers into a smaller number of enablers with close meanings. Using NVivo 11® and following the recommendations of Bazeley and Jackson (2013), autocoding techniques were performed and, as a result, eight broad themes were found. Then, each author subcoded the initial items by more detailed codes. All discrepancies were identified, discussed, and resolved collectively. As a result, from 480 mentions in papers, 63 DT enablers were formulated.
Then the number of enablers was reduced even further by applying clustering analysis. Authors of similar research preferred to deal with 10–20 factors (in Asadi et al. (2022) – 12 items; Raj et al. (2020) – 15; Machado et al. (2021) – 16; Rajput and Singh (2019) – 20). To avoid arbitrariness in categorizing and making the enablers’ structure more practice-oriented, experts from manufacturing companies were approached (see section 3.4 of this article) and asked to evaluate the pairwise semantic similarity between DT enablers. A 0–9 Likert-type scale was used, with 0 as “complete similarity” and 9 as “maximum dissimilarity.” The aggregate semantic distance matrix was constructed by summing up the matrices from individual experts. The resulting matrix consisted of pairwise meaning distance assessments with possible values from 0 to 108 (maximum distance). The left-bottom triangle of the matrix was filled with transposed values. The resulting total distance matrix was subjected to cluster analysis, which was produced in RStudio with basic functions “factoextra,” and “cluster” packages.
To identify the best clustering algorithm and the optimal number of clusters (within the interval from 10 to 20), internal measures, such as connectivity, Dunn index, silhouette coefficient, as well as stability measures, such as average proportion of nonoverlap (APN), average distance (AD), average distance between means (ADM), figure of merit (FOM), were calculated (Brock et al., 2008) using clValid function from the eponymous package in R. Comparing k-means, k-medoids (PAM), and hierarchical clustering algorithms, we found in 4 measures out of 7 the hierarchical clustering method with 20 clusters showed the best results. In Table 2 the optimal scores and associate metrics and numbers of clusters are highlighted.
Connectivity (min is the best), Dunn index (max), silhouette coefficient (max), average proportion of nonoverlap (APN) (min), average distance (AD) (min), average distance between means (ADM) (min), figure of merit (FOM) for k-means, k-medoids (PAM), and hierarchical clustering algorithms.
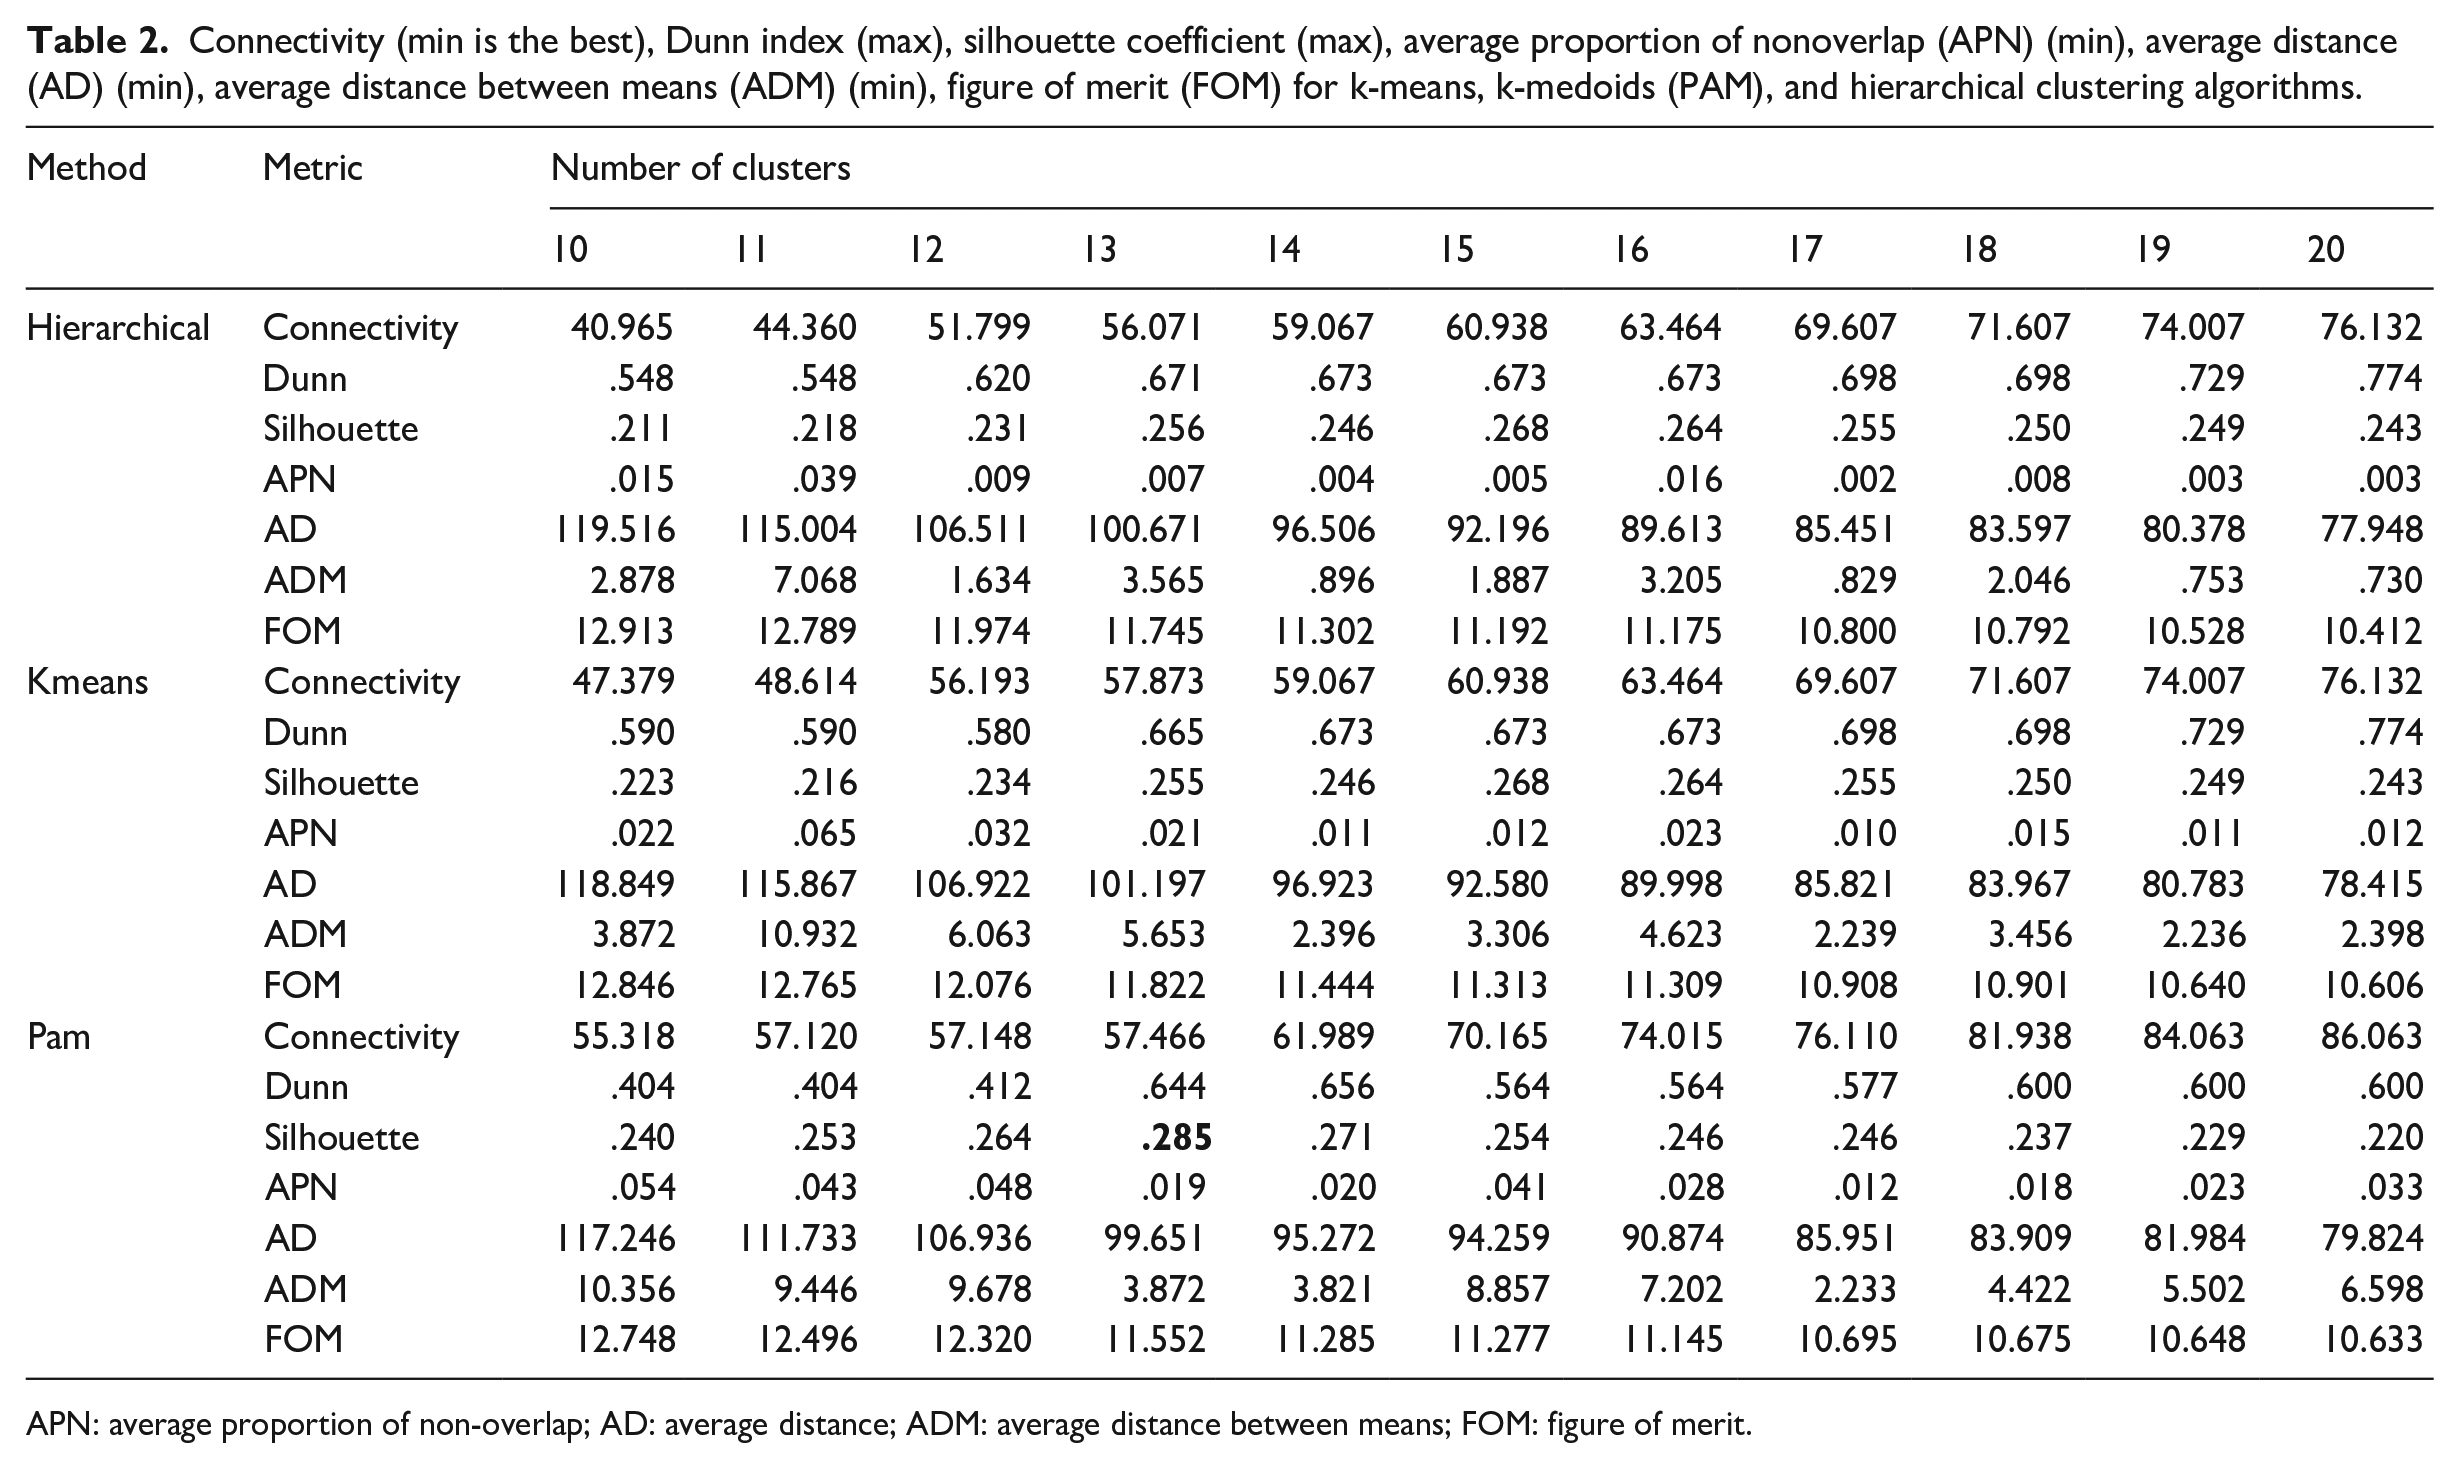
APN: average proportion of non-overlap; AD: average distance; ADM: average distance between means; FOM: figure of merit.
3.3. Comparative analysis of DT enablers with DEMATEL
To compare 20 clustered enablers in high-tech and low-tech companies, the DEMATEL method was used. DEMATEL is an effective method for analyzing relations between factors within complex systems (Si et al., 2018). It has been successfully applied to rank elements of systems in terms of their importance and influence (Raj et al., 2020). DEMATEL is widely used in similar studies of enablers, antecedents, or barriers in different contexts (Asadi et al., 2022; Wang et al., 2021), including the fields related to DT and Industry 4.0 (Machado et al., 2021; Nimawat and Gidwani, 2021; Raj et al., 2020; Rajput and Singh, 2019). It has also been employed in the comparative studies of enablers and barriers (Jafari-Sadeghi et al., 2022). The algorithm of classical DEMATEL is well documented and the research followed the procedures described in Si et al. (2018). A brief explanation needed for the interpretation of DEMATEL results is provided in the next paragraph.
Besides DEMATEL, the contemporary research uses different methods to prioritize and reveal relationships among factors. To investigate enablers in the context of DT, scholars effectively use also MICMAC, ISM, TISM, AHP, and ANP separately or in different combinations (Adebanjo et al., 2022; Jain and Ajmera, 2021; Krishnan et al., 2021; Makki and Alqahtani, 2022). However, AHP does not consider the indirect effects and assumes that factors are independent (Gandhi et al., 2015), which is not relevant for this study. ANP may not be preferred because of its complex use and understanding (Makki and Alqahtani, 2022). TISM is very good in the qualitative and interpretative investigation of factors’ interaction (Sushil, 2012), which is not needed in the present research. A combination of ISM and MICMAC seems to be very close to DEMATEL because it identifies priorities and relations between factors. Although, ISM/MICMAC technique measures relations based on pairwise existence–absence evaluations and prioritizes factors in terms of discrete levels (Agrawal and Narain, 2021). DEMATEL can evaluate relations with the Likert-type-like scale and prioritize factors based on continuous scales, which makes this method more flexible and appropriate for the finer comparative analysis.
Within DEMATEL, experts evaluate the pairwise influence of factors on each other. Using a specific algorithm, these estimates are aggregated and converted into a square total relation matrix where each factor has in rows the assessments of its influence exerted on other factors and the influence received from other factors in columns. Then, each factor is measured with “prominence” and “relation” metrics based on the total relation matrix values. “Relation” (denoted as r—c, where “r” stands for “row” and “c”—“column”) is calculated by deducting the values in a column of a factor from the values in a row. “Relation” shows the net effect that the factor contributes to the system. Formally, it is the strength of influences exerted by a factor minus the strength of influences received. Positive “relation” means that a factor influences more than depends on others. Factors with positive “relation” are often called “causes” and negative “relation”—effects. “Prominence” (r + c) is calculated by summing each factor’s values in columns and rows. “Prominence” indicates the overall strength of the factor’s influences received and exerted. The higher the “prominence,” the more prominent the role of the factor can be considered.
Following the DEMATEL procedure, the evaluations of the pairwise influence of DT enablers (traditional scale from 0—no influence to 4—maximum influence) were collected from two expert panels (see section 3.4 of this article). The values from individual experts were averaged in two direct-influence matrices (for two panels). Then, two total relation matrices were calculated, “relation” and “prominence” for each enabler separately for high-tech and low-tech companies.
The differences in DT enablers were visually analyzed using influential relation maps with “prominence” and “relation” as axes. To measure the difference between DT enablers in low-tech and high-tech firms quantitatively, rank-correlation coefficients (Kendall’s tau-b and Spearman’s rho) were calculated. It was assumed that if the enablers have similar positions on the “relation” or “prominence” axes in both manufacturing companies, correlation coefficients will show a significant positive correlation. Otherwise, coefficients can be close to zero (enablers have different significance in terms of “prominence” and “relation” in two groups of firms) or negative (enablers have quite the opposite significance in two groups). The same coefficients were used to measure consistency of experts’ pairwise evaluations of factors mutual influences. The DEMATEL procedure was applied to experts’ individual matrices. Strong correlations of both prominence and relation were expected for in-group data.
Based on the visual and statistical comparison, the conclusions regarding the research question of whether DT enablers in low-tech and high-tech manufacturing firms are different were made. To validate the findings, they were presented at a panel discussion as part of practical conference dedicated to DT. The feedback did not contradict the findings and was incorporated into the discussion part of this article.
3.4. Expert panel
Scholars do not unequivocally define the size of expert panels appropriate for consistent and valid DEMATEL application. However, Adegoke et al. (2021) noted that “there is no limit (particularly the lower limit) to the number of experts to consider in the DEMATEL method.” Previous research suggests that 4–12 experts for a panel can be an appropriate number, provided that all experts have deep knowledge in the relevant areas and their selection follows applicable criteria (Jafari-Sadeghi et al., 2022; Raj et al., 2020; Shieh and Wu, 2016). The expert selection criteria in this research were based on previous studies (Jafari-Sadeghi et al., 2022; Peleckis, 2021; Raj et al., 2020) and included age (minimum 35 years old), education (minimum bachelor’s degree), work experience (minimum 5 years in a manufacturing company, either low-tech or high-tech), DT-related management experience (minimum 3 recent years of working as an IT-director, chief digital officer, or similar), recognition by other professionals (minimum two recommendations from professional bodies, such as Big Data Association, Digital Transformation Association of Russia, etc.) and a broad knowledge (knowledge of DT projects in a minimum of 5 companies, apart from their own, from the same industry). All experts worked for Russian manufacturing companies, but had the international experience 3 years and more (see Table 3). We selected 12 experts—6 with experience in DT in low-tech manufacturing companies and 6 in high-tech firms. The classification of companies as low-tech or high-tech manufacturing was based on Galindo-Rueda and Verger (2016).
Expert panel profile.
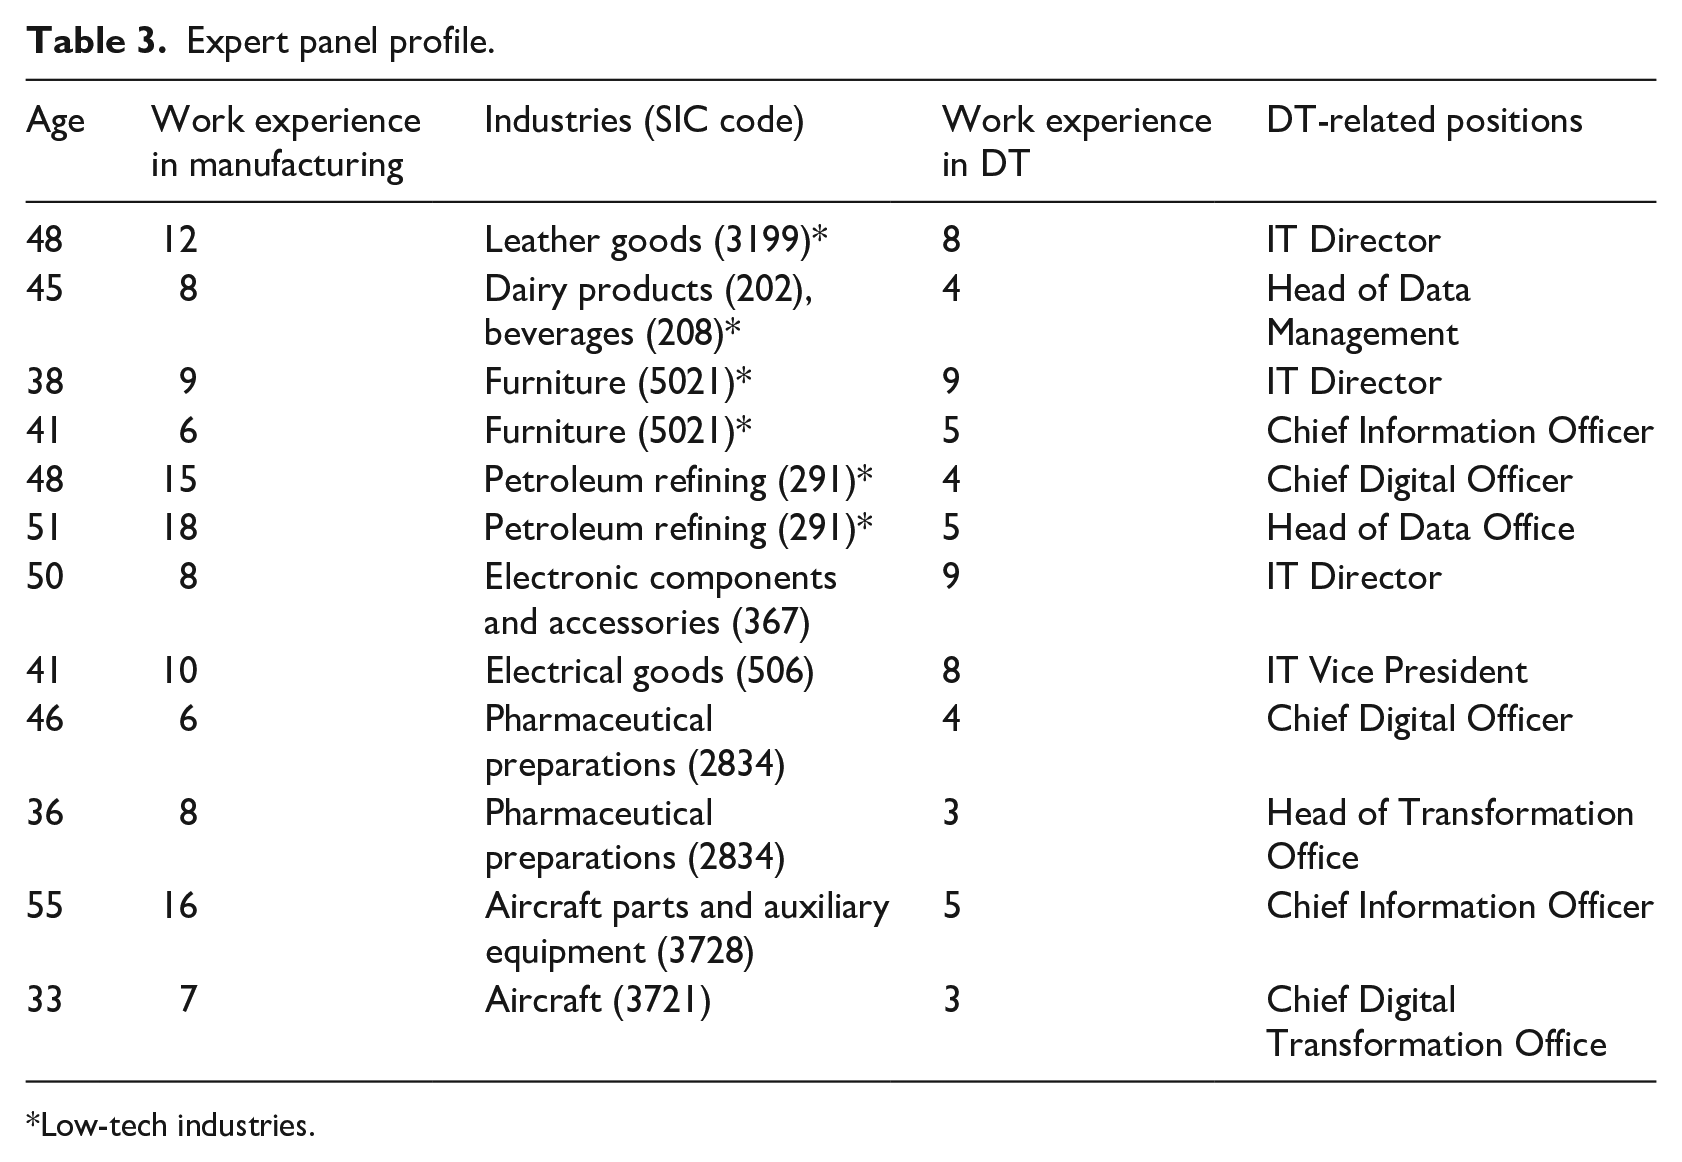
Low-tech industries.
The experts were approached through video conferences in two stages. First, they provided their judgments for DT enablers’ clusterization (see section 3.2). Here, they acted as one group. Second, they participated in the DEMATEL analysis (see section 3.3), where they formed two panels. After each conference, the data received were processed (cluster analysis in section 3.2 and DEMATEL analysis in section 3.3) and the results submitted to the experts for their feedback. Finally, 8 out of 12 experts participated in the panel discussion organized to validate the overall findings.
The unique contributions of this study lie in its rigorous analysis of primary and secondary data, differentiation between high versus low technology firms, and hence the more fine-grained utility of the results that can be of practical use by those different types of businesses. For example, while Jones et al. (2021) provided a recent and useful foundational review of drivers and barriers, their study was a qualitatively constructed literature review, free of analytics and not comparing high- versus low-technology contexts, but rather a summary of past studies. Our research uses cutting edge analytics, builds on the large number of previous qualitative reviews, and provided new data from expert practitioners in both low- and high-technology companies in order to validate what was proposed by previous purely academic studies such as Jones et al. (2021). Furthermore, the present study used DEMATEL and related tools to ensure analytical rigor of the findings, in support of both academic and practitioner judgments. This has resulted in our study being able to identify both major and minor causes and effects of DT enablers, clearly showing for the first time the nature and extent of how these differ across technology sophistication levels. In sum, we build on the previous qualitative literature reviews (Jones et al., 2021) that aggregated and qualitatively identified drivers and barriers, to now provide fine-grained elaboration of these, segmented, informed by expert practitioners, quantified, and parsed in novel ways.
4. Results
In 58 papers, 480 mentions of non-technical enablers relevant to manufacturing companies were found. Purely technical enablers (such as artificial intelligence, robotics, the Internet of Things, etc.) were excluded. The enablers of the mixed socio-technological nature, such as technology management, and digital technology maturity, were included. The spelling was taken from the sources. Some authors provided the groupings of enablers. In these cases, broad categories were mentioned in round brackets after the enabler (for instance, “Collaboration (Human)”). Some authors used rather specific terms. In these instances, short comments in squared brackets were added (e.g., “Reducing transaction costs [expected benefits]” or “Brand permission [brand permission defines the limits of customers” willingness to accept a familiar brand name in new marketplace situations]’). In all, 480 mentions were reduced to 63 enablers, then grouped into 20 clustered enablers based on the experts’ opinions. The engagement of the experts at this stage helped confirm the correctness of 63 DT enablers and made the group of experts closely familiar with the meanings of the enablers, which was crucial for the next stage of research. The results of clusterization are shown in Figure 2. The detailed structure of DT mentions, enablers, and clusters is given in Appendix 1. With “E,” 63 enablers were marked, and “C”—20 clustered enablers.
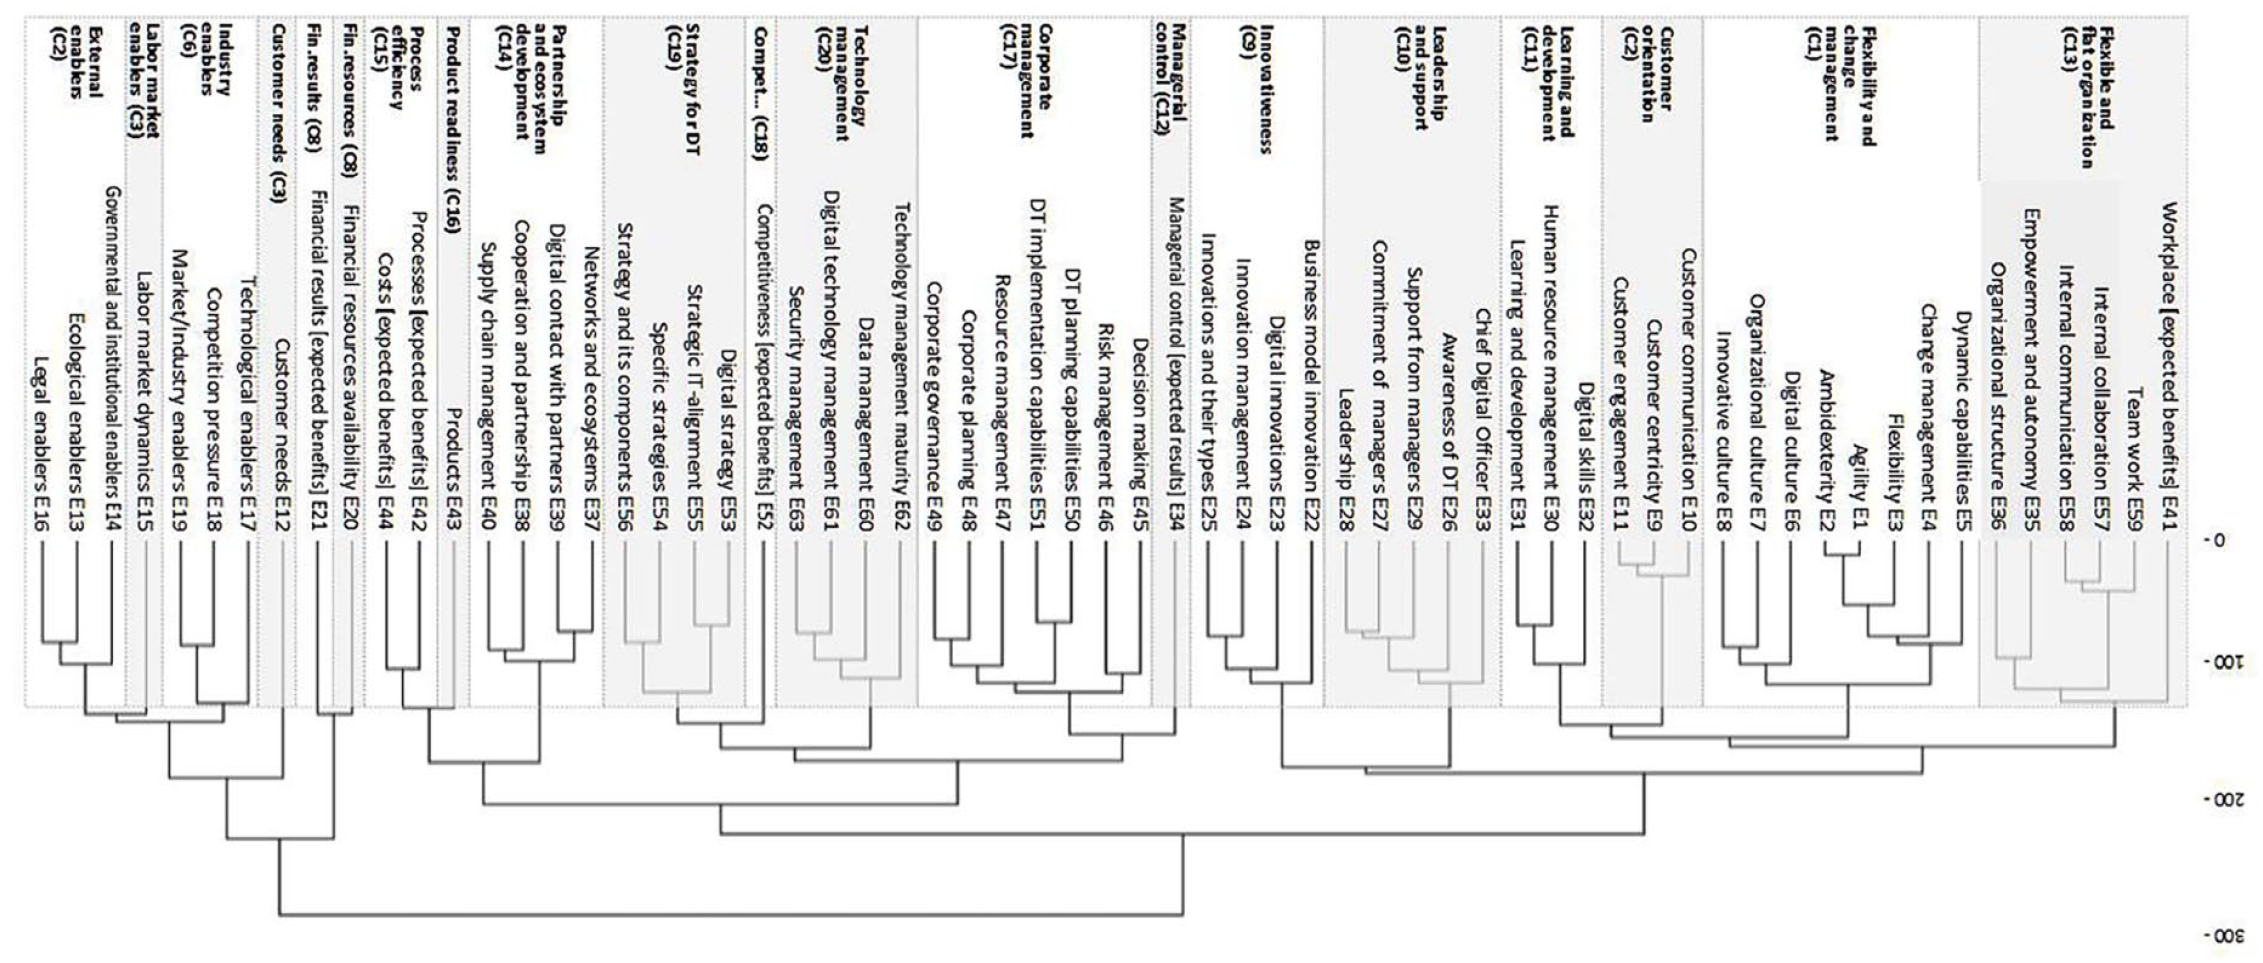
Cluster dendrogram for DT enablers.
Following DEMATEL procedures, experts evaluated 20 enablers in their pairwise mutual influence. The averaged direct-influence matrices for high-tech and low-tech companies are presented in Appendix 2. See Tables 5 through 14 for further details.
Based on the total relation matrices, “prominence” and “relation” for two groups of enablers were calculated and two influential relation maps shown for high-tech and low-tech firms were built. To make the visual analysis of DT enablers clearer, both the maps were merged into one with a horizontal axis representing “prominence” minus average “prominence” for a whole group of enablers as follows
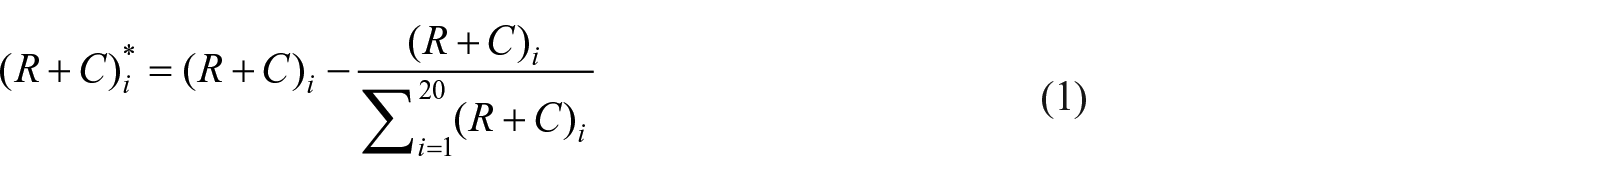
where (R + C)i is the “prominence” of the ith enabler.
The merged influential relation map for enablers in both types of companies is shown in Figure 3.
Merged influential relation map for DT enablers in high-tech and low-tech manufacturing companies.
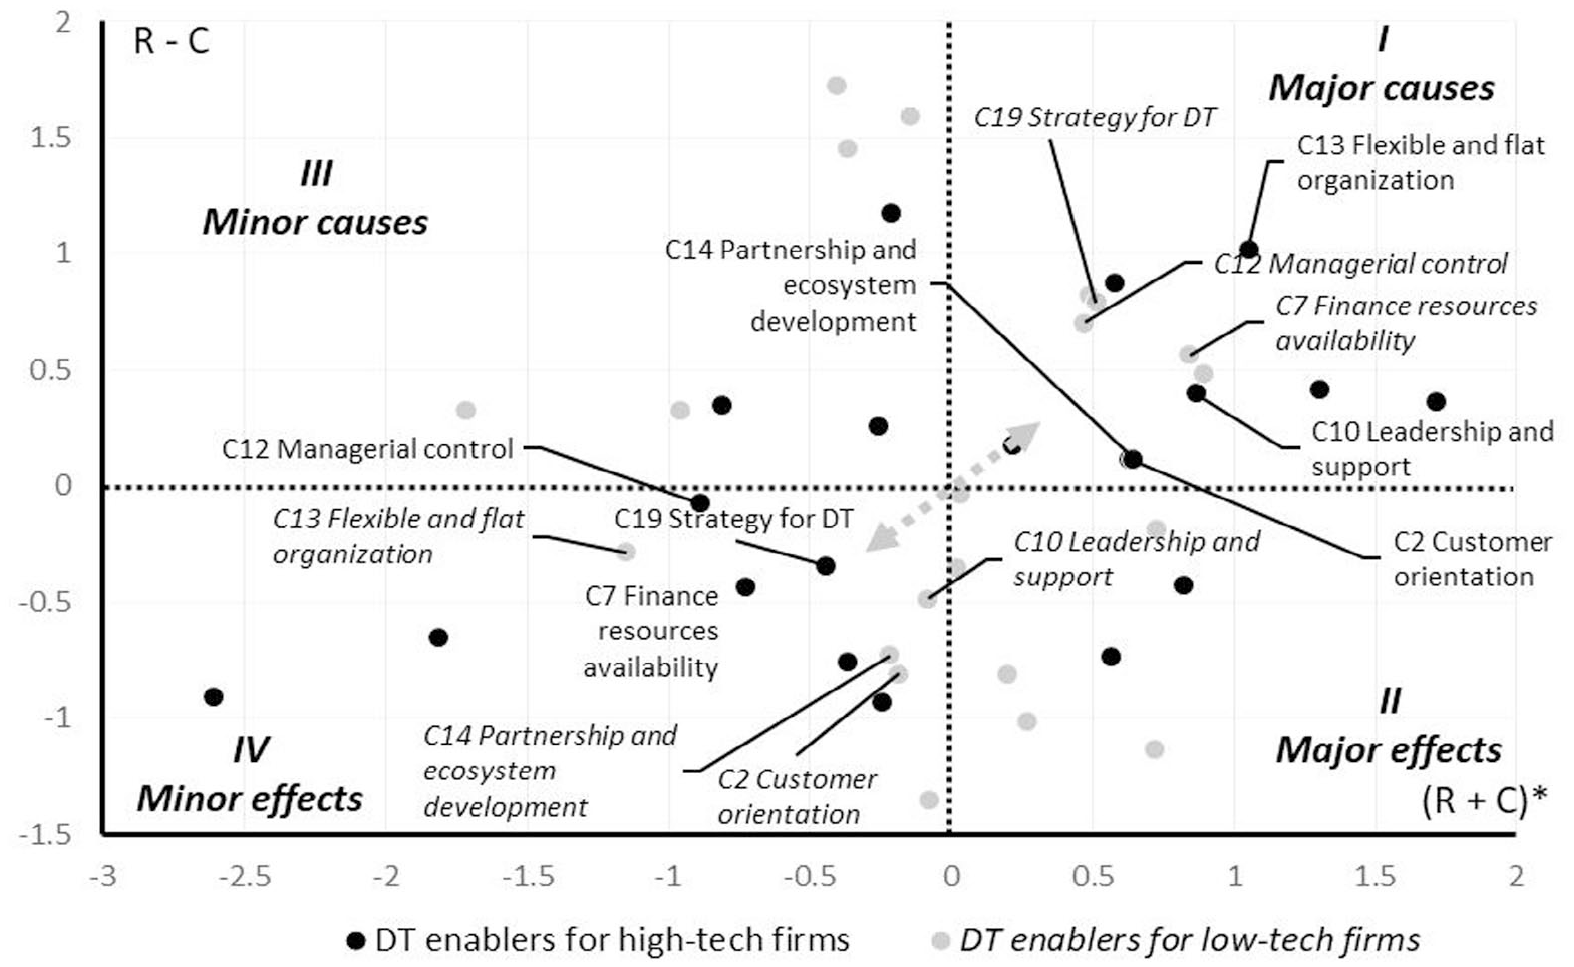
According to the traditional interpretation of the DEMATEL influential relation map, the enablers above the horizontal zero line are called causes, and those below the line are effects. Besides, the enablers at the right of the vertical zero line can be interpreted as prominent or major and, to the left of the line—as minor ones. Gray circles show DT enablers for low-tech companies. Black dots depict enablers for high-tech companies.
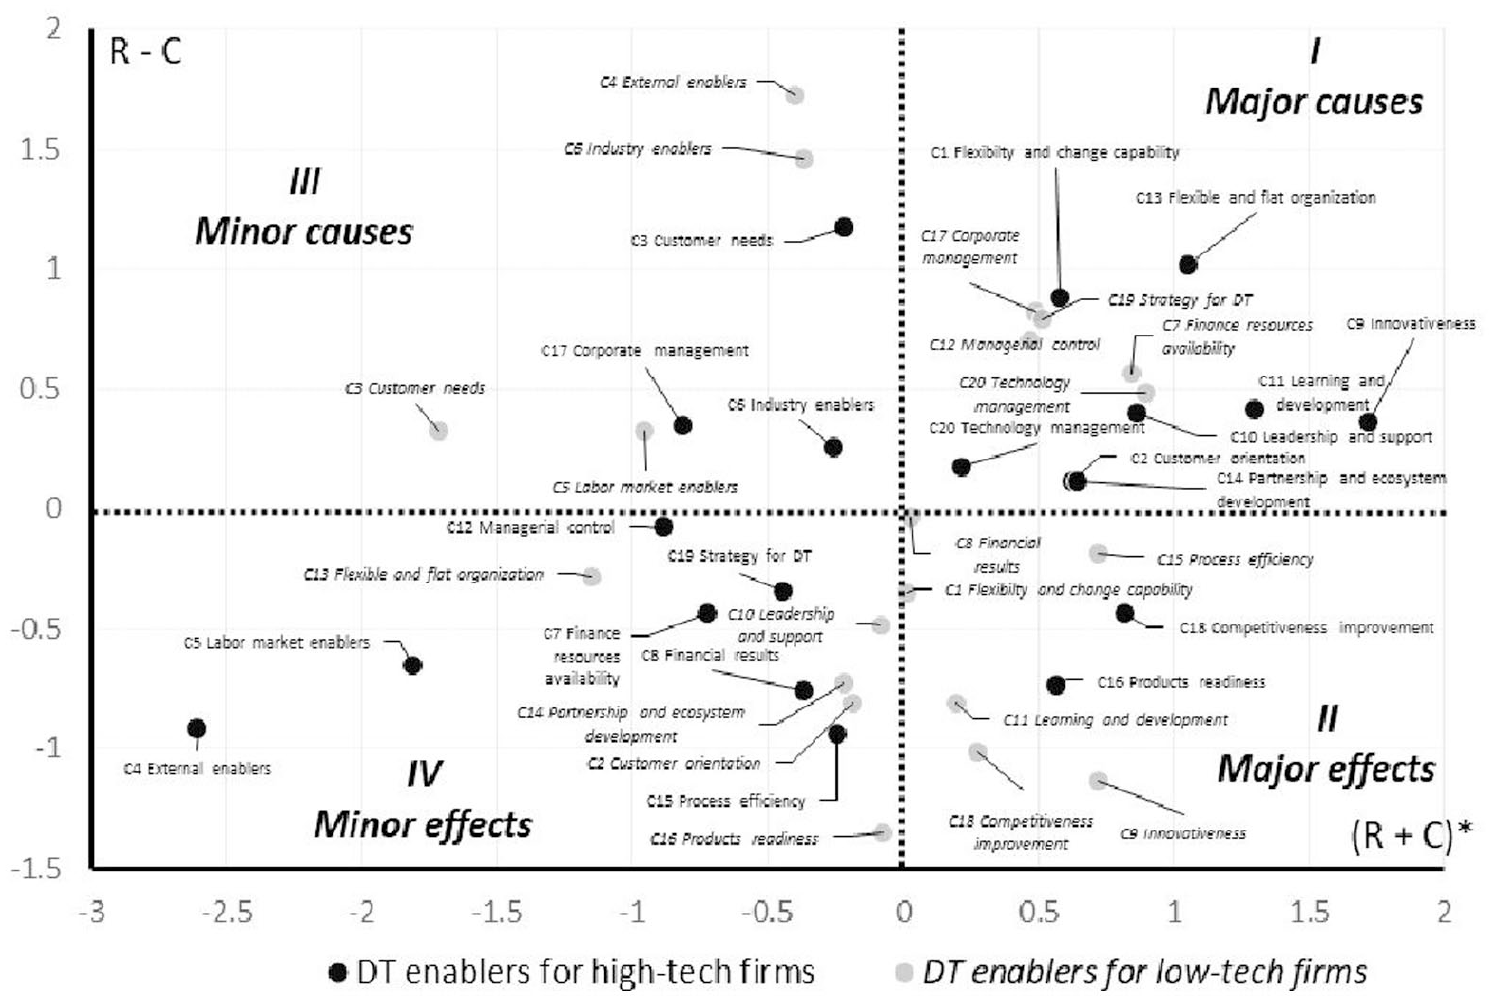
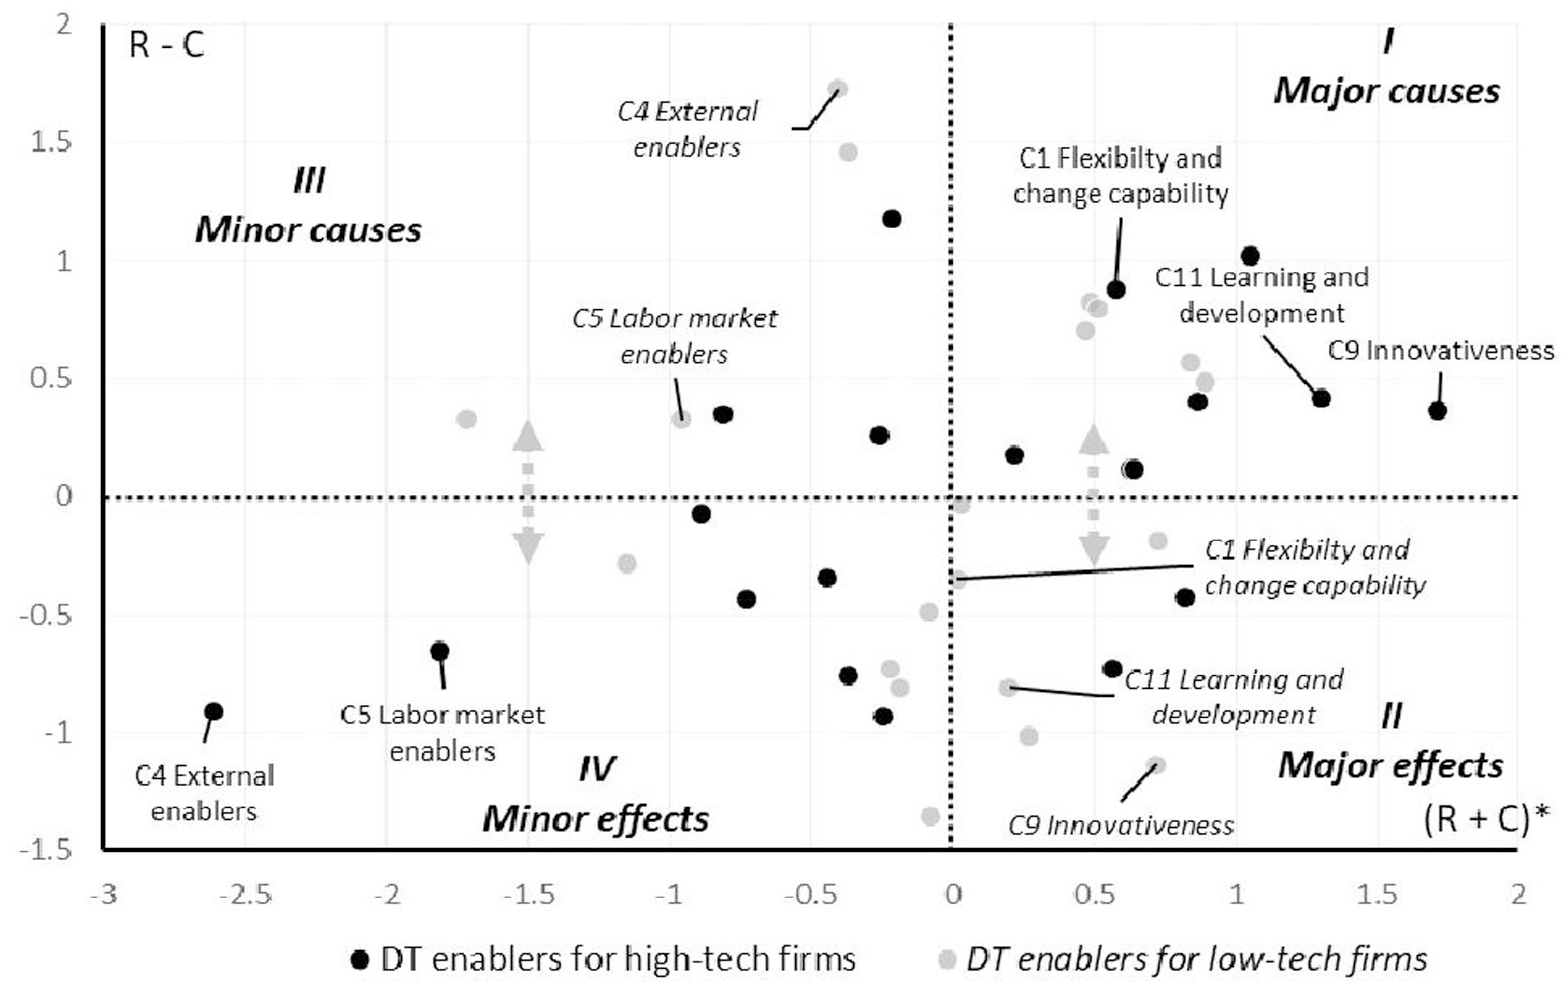
A close look at the merged influential relation map helps to note that only 4 out of 20 DT enablers are in the same areas in both types of companies (see Figure 4), and 7 enablers have positions in the opposite quadrants (see Figure 5). Five enablers have different positions in terms of their “relation” (see Figure 6). Four enablers occupy different positions in terms of “prominence” (see Figure 7).
Merged influential relation map for DT enablers with similar positions for low-tech and high-tech companies.
Merged influential relation map for DT enablers with significantly different positions for low-tech and high-tech companies.
Merged influential relation map for DT enablers with different positions with respect to “relation” (R − C).
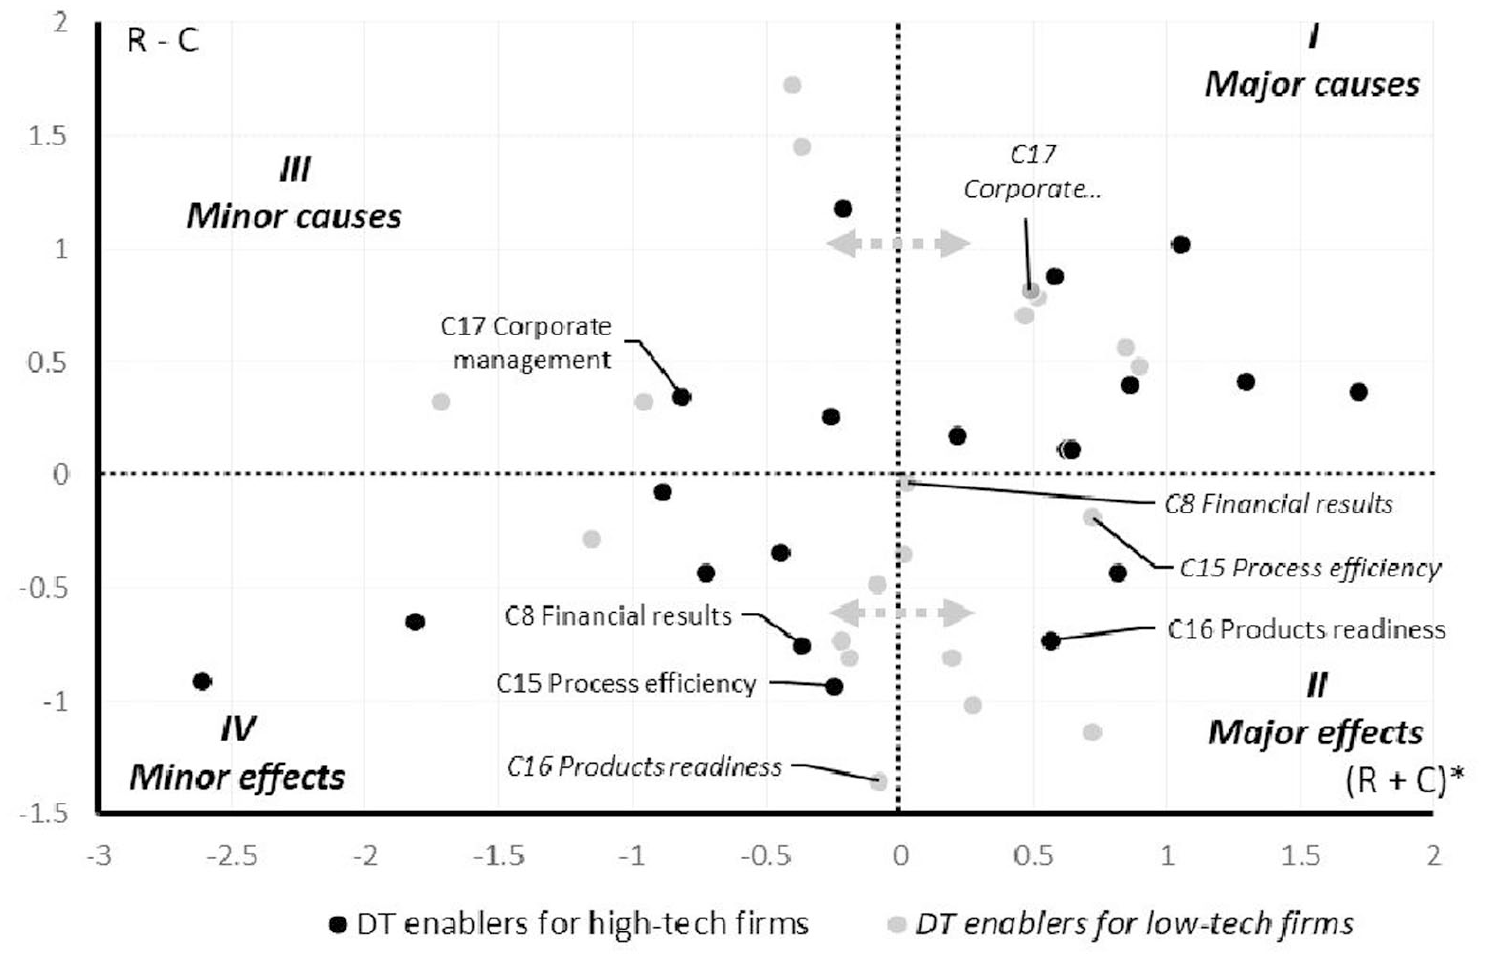
Merged influential relation map for DT enablers with different positions with respect to “prominence” (R + C)*.
To illustrate interaction between DT enablers, digraphs for two groups of companies were built according to the standard DEMATEL procedure (Figures 8 and 9).
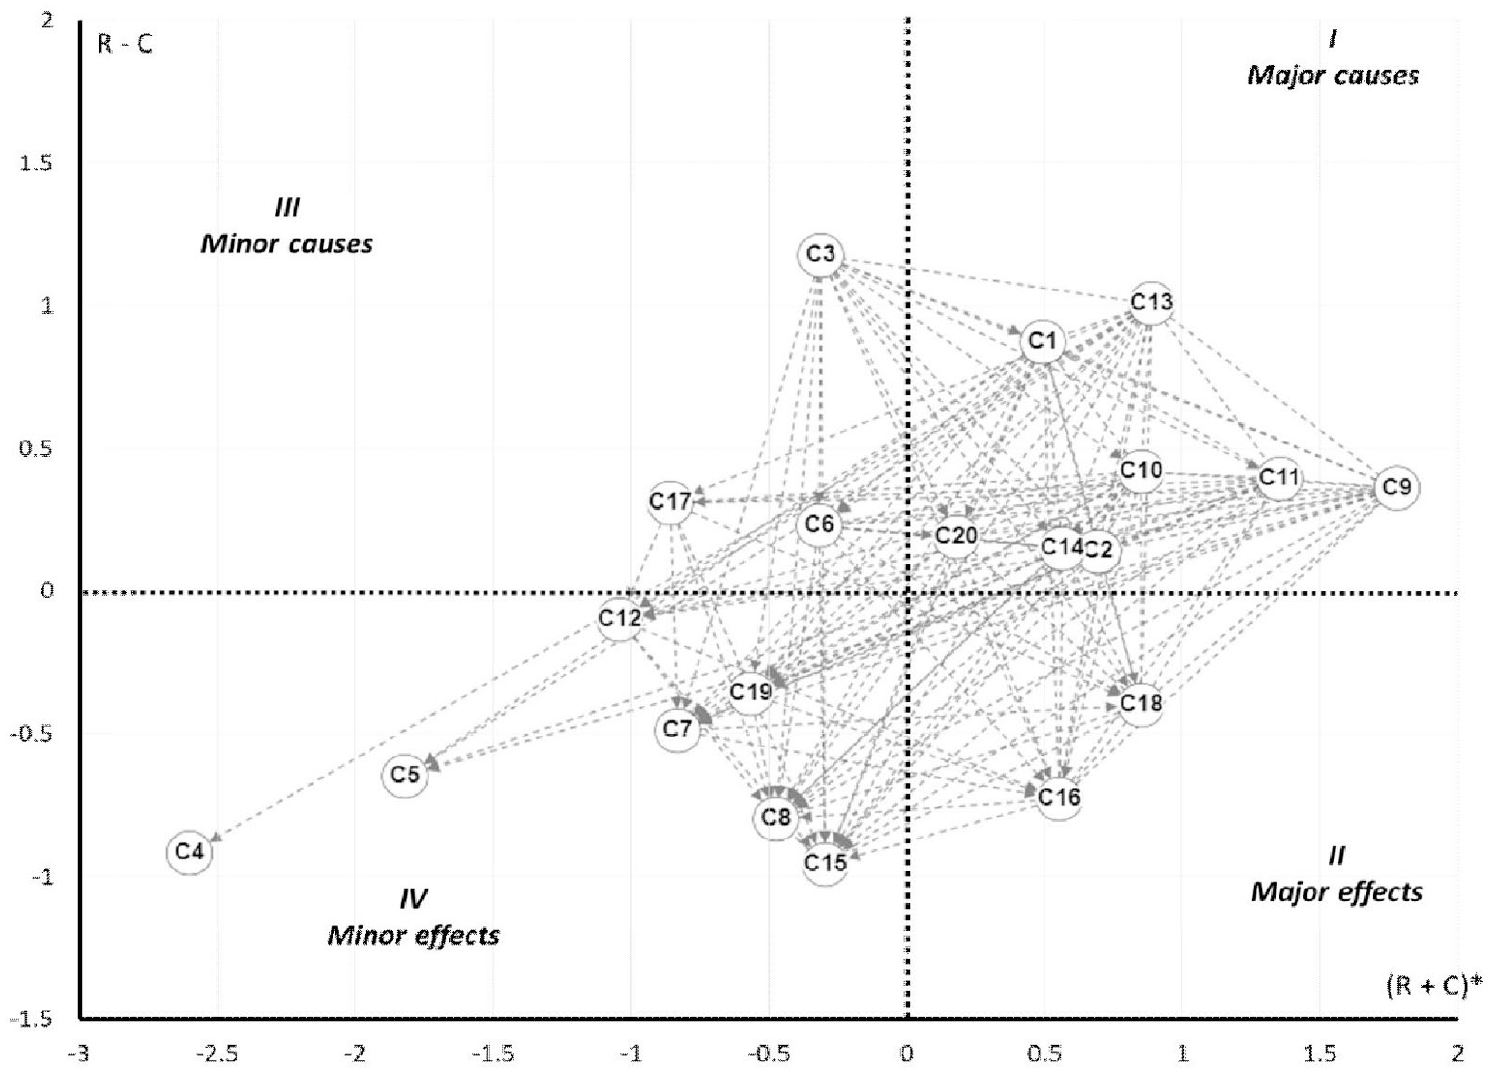
Digraph for high-tech firms’ DT enablers.
Digraph for low-tech firms’ DT enablers.
Threshold values for high-tech and low-tech firms were .14 and .10, respectively. To make enablers and links more visible the enablers were slightly moved from their exact positions. Lines without arrows show mutual influence.
Digraphs are the additional tools to illustrate the prominence (r + c) and relation (r − c). Relation is visualized by the ratio of outbound links to inbound. Causes are characterized by the prevalence of outbound links, whereas effects—by dominance of inbound links. Prominence is characterized by the number of all links.
Based on visual inspection, the DT enablers in low-tech and high-tech companies are very different. Correlation coefficients support this impression. Table 4 shows the results of the calculations of coefficients, their low and upper bound values. p-values were found for the hypotheses that coefficients will be higher than the thresholds associated with a moderate positive correlation (.2 and .3 for Kendall’s tau-b and Spearman’s rho, respectively).
Rank-correlation coefficients of DT enablers in high-tech and low-tech companies.
For the “relation” and “prominence” points, estimates of correlation coefficients are well below the threshold associated with moderate positive correlation. p-values for “relation” are less than .05 and for “prominence”—less than .10. Hence, we found that the correlation between “relation” and “prominence” of DT enablers in high-tech and low-tech is negligible.
To prove the in-group consistency of experts’ judgments, DEMATEL was performed for individual expert direct-influence matrices. Correlations between experts of the same group were measured with the same coefficients of Spearman and Kendall. The results (see Appendix 3) showed positive and strong within-group correlation in terms of relation and prominence, which suggests good consistency of experts’ evaluations.
5. Discussion
Based on the above findings, it can be concluded that high-tech and low-tech manufacturing firms do have different sets of DT enablers. The most critical enablers (quadrant I) group includes only one enabler common for these two types of companies. The minor effects (quadrant IV) can be considered as non-important enablers or not enablers. Here, there are no common factors. In two other quadrants, there are only three enablers with similar importance in both groups of companies. The observed differences are worth noting for both theoreticians and practitioners and can best be interpreted by examining the enablers in all quadrants.
Starting from the most critical enablers (quadrant I), it can be seen that in high-tech companies, DT is promoted by the flexible and flat organizational environment (C13) characterized by a high level of empowerment and autonomy, outstanding collaboration, efficient teamwork, and by flexibility and change capabilities (C1) encompassing ability, innovative and digital culture, ambidexterity, and dynamic capabilities; a critical role of leadership capabilities and commitment from top managers (C10); the accent on learning and development (C11), innovativeness (C9), and to a lesser extent, customer orientation (C2) and development of partnerships and ecosystems (C14). Key DT enablers in high-techs look more connected with the “soft,” dynamic capabilities (communications, learning, leadership, change management, teamwork, customer orientation) and organizational flexibility (innovativeness, agility, flexibility). This finding is consistent, to some extent, with Acharya (2019), who found the notable impact of organizational flexibility on the performance of high-tech e-learning providers.
At the same time, low-tech firms rely more on more formal, tangible, “harder” elements—strategy (C19), corporate management (C17), and managerial control (C12). So it seems natural that for both types, the most critical DT enablers include mostly the internal resources and capabilities—these factors are under the control of companies and can be used as tools to influence other elements, even though they are quite different in nature between high- and low-technology companies.
From digraphs, it is visible that the most influential major causes for high-tech companies relate to dynamic capabilities in terms of innovativeness (C9), learning and development (C11), and flexible and flat organization (C13). They are characterized by the biggest number of all links among enablers for both high-tech and low-tech firms.
Interpreting the observed difference from the resource-based view (Khin and Hung Kee, 2022; Liu et al., 2011), it can be stated that low-tech companies possess lower organizational flexibility because of their more conservative resource base (Evers, 2011; Ghosh et al., 2021). Their structure and processes tend to be more stable. Their management systems are based on more formal administrative capabilities, procedures, and approaches. As a result, they cannot fully and properly use dynamic capabilities to propel DT. They may, however, enforce DT initiatives using more stable, control-oriented organizational competencies. To survive in unpredictable and highly competitive markets, high-tech companies develop their dynamic capabilities continuously (Yu-Yuan Hung et al., 2007). For high-tech companies, it is more typical to rely on flexible rather than hierarchical structures, apply leadership skills rather than administrative management procedures, and organize processes and projects based on agile teamwork rather than formal methodologies. That is why high-tech companies consider traditional managerial capabilities as less appropriate for DT. The enablers that are important for low-tech companies, such as “Strategy for DT” (C19), “Managerial control [expected benefits]” (C12), and “Finance resources availability” (C7), are among the unimportant factors (quadrant IV) for high-tech firms.
In quadrant II, the enablers can be perceived as the expected elements from DT results. Interestingly, low-tech companies have more enablers with (expected benefits) remark. They also have more enablers in this quadrant overall. In quadrant II, low-tech companies also have “Agility and change capability” (C1), “Innovativeness” (C9), and “Learning and development” (C11). These enablers are among the dynamic capabilities mentioned by high-tech companies as major causal enablers. It seems that low-tech companies consider DT as the vehicle for developing their dynamic capabilities, corporate agility, and innovativeness. The major effects of DT are connected with enhanced agility, change management, innovativeness, and organizational learning.
In high-techs, 3 out of 4 enablers with (expected benefits; (“Financial results” (C8), “Managerial control” (C12), “Process efficiency” (C15)) are among unimportant factors (quadrant IV). It does not mean that they are not interested in business results. Different expected benefits drive DT here. However, high-tech companies are interested in external business results, such as improved competitiveness (C18) and products suitable for digital trends (C16). High-tech companies, already being agile and flexible, use DT to increase the digitalization of their products and, as a result, improve competitiveness.
In quadrant III, there are causal but not major DT enablers. From the viewpoint of open systems theory (Roth, 2019), these results seem quite reasonable. The organizational change implied by DT is influenced by external drivers, which are usually out of the full control of companies. As a result, companies view these DT drivers as the causes they need to adapt. External enablers mentioned in this quadrant are more like environmental conditions that motivate DT initiatives to happen. It seems that low-tech companies are more dependent on external factors than high-tech companies. Low-techs have more external enablers and higher causal power (“relation”).
Quadrant IV consists of minor DT enablers with low influence. Here, we can indicate that, in high-techs, DT initiatives seem to be less sensitive to external factors (C4, C5) and financial factors (C7, C8), less reliant on formal management tools (C12, C19), and less focused on internal process efficiency (C15). The last observation seems counterintuitive and needs some consideration. However, it can be explained by the strategic focus of high-tech companies, which is often more connected with product differentiation than internal efficiencies (Treacy and Wiersema, 1993). That is why high-tech firms see product readiness for DT as a major expected effect and process efficiency as an unimportant factor.
Comparison of digraphs reveals that minor effects for high-tech firms have more inbound arrows, than those for low-techs. It means that for high-tech companies these factors are less influential, whereas minor effects for low-techs are slightly more balanced in terms of inbound and outbound links. Hence, for low-tech companies, these minor effects are not totally marginal and should also took into consideration as important effects.
During the panel discussion the experts and other participants paid their attention primarily on major causes and effects (quadrants I and II). They agreed with the findings and notes that DT in high-tech companies is often stimulated by the availability of dynamic capabilities related to innovativeness, flexibility, and organizational learning. Low-tech firms rely more on traditional management practices concerning strategy and control. Low-techs are more dependent on finance resources and technology management, because in comparison to high-techs they are at lower levels of digital maturity and technology change readiness. With the help of DT, high-tech companies are searching for long-term competitive advantages, whereas low-tech firms are more interested in short-term results (process efficiency and financial results) and frequently consider DT as a tool to develop their dynamic capabilities with respect to higher innovativeness, flexibility, and adaptiveness. Unexpectedly for the participants, many external enablers were found in minor causes or effects for both groups. According to their knowledge, DT is significantly driven by the pressure from competitors, clients, and government.
6. Conclusion
This research identified and analyzed the differences between non-technical DT enablers in low-tech and high-tech manufacturing companies. Based on a thorough literature review, the comprehensive structure of DT enablers with 20 clustered categories was built. The comparative analysis with DEMATEL found that high-tech and low-tech firms have significantly different sets of DT enablers. The interpretation of the differences concludes that both high-tech and low-tech companies consider the resources and capabilities already in place as the most critical enablers. High-tech companies rely more on the enablers related to organizational flexibility and dynamic capabilities, whereas low-techs rely on enablers connected with more stable capabilities, considering higher flexibility as the expected outcome effect. Dynamic capabilities make high-tech companies more flexible and adaptive to external drivers. The lower flexibility of low-tech companies motivates them to see DT as the opportunity, first, to develop dynamic capabilities and enhance its flexibility and agility. Organizational flexibility and dynamic capabilities and structures play a significant role in DT in both types of companies, but this role is notably different.
This research deepens our understanding of the DT complexity in manufacturing companies. The DT enablers were systematized and structured. It was found that technological context plays a significant role in DT initiatives in manufacturing companies. It was revealed that DT is primarily driven by organizational flexibility and dynamic capabilities in high-tech companies. In low-techs, DT is stimulated by more stable and traditional resources and capabilities, while dynamic capabilities and flexibility are considered the major effects expected from DT.
Practicing managers may take note of the recommendation to activate DT with the enablers relevant to their technology intensity. Management should also identify the enablers pertaining to their company’s context before initiating DT endeavors. It seems suboptimal to propel DT in low-tech companies by using dynamic capabilities which are not well advanced in these companies. On the contrary, it seems more appropriate to enable DT with the capabilities existing in a company, even if they are more based on the formal, procedural, and traditional management practices.
Practitioners can directly use our findings to assess their DT readiness and propensity using the identified and validated factors that might apply specifically to their level of technological sophistication, using the causes and effects identified in this study to anticipate driers and barriers, and hence be more effectively able to implement DT, or choose not to, or indeed to choose how best to do so, for example to proceed in an evolutionary manner as against more aggressively, to conduct pilot implementations versus proceeding on a more widespread basis within the firm. Our study provides for such thoughtful anticipation and DT management by practitioners based on bringing together and triangulating the previous knowledge in a vast literature with current expert practitioner judgments, from both high- and low-technology environments. These differences that are our novel findings, between low- and high-tech firms, should also lead to anticipation of challenges when mergers or acquisitions occur between firms of substantially varying technology levels.
The major limitation of this study is that the expert panel was represented by a select group of Russian manufacturing companies only and not by all high-tech and low-tech manufacturing industries, more globally based. The conclusion about the importance of DT enablers was derived from applying only one DEMATEL method, whereas, in some studies, authors prefer to use several methods. Perhaps, fuzzy or gray DEMATEL methods may be more appropriate for a few experts, leading to different results in future studies.
The findings suggest that the “technology intensity” conditions DT enablers. However, the causes leading to the differences in DT enablers in high-tech and low-tech companies are not clear. Therefore, further research should look deeper into the interactions between the technology base of companies and particular DT enablers. It will also be fruitful to perform the empirical analysis of relationships between DT enablers used by companies and the results of DT. Finally, we propose that follow-up studies should involve deep case studies using our framework of high- and low-technology firms, questioning just “how” drivers and barriers impact on DT effectiveness. In refining knowledge through such further research, empirical studies that follow this one, whether surveys, mathematical models, or qualitative studies, should structure elements such as industry concentration, competitive dynamics and degree of government support, and economic maturity of development, in order to create even more fine-grained insights than in the present study.
Research Data
sj-xlsx-1-aum-10.1177_03128962231157102 – Research Data for Digital transformation enablers in high-tech and low-tech companies: A comparative analysis
Research Data, sj-xlsx-1-aum-10.1177_03128962231157102 for Digital transformation enablers in high-tech and low-tech companies: A comparative analysis by Titov Sergei, Trachuk Arkady, Linder Natalya, RD Pathak, Danny Samson, Zafar Husain and S Sushil in Australian Journal of Management
Footnotes
Appendix 1. Structure of non-technical DT enablers in manufacturing companies
| Clustered enablers | Enablers | Items from literature |
|---|---|---|
| 1 | 2 | 3 |
| Flexibility and change capability (C1) | Agility (E1) | Agility and ambidexterity (Changes in value creation paths) (Vial, 2019), Agility (Imran et al., 2021), Organizational agility (Del Giudice et al., 2021), Agility and flexibility (Cultural attributes) (Teichert, 2019), Agility and flexibility (Attributes of digital culture) (Teichert, 2019), Organizational agility (Troise et al., 2022), Agility (Jayawardena et al., 2020) |
| Ambidexterity (E2) | Agility and ambidexterity (Changes in value creation paths) (Vial, 2019), Ambidexterity of analog and digital capabilities (Managerial and organizational capabilities) (Nadkarni and Prügl, 2021), Ambidextrous organization model (Rêgo et al., 2021), Organizational ambidexterity (Del Giudice et al., 2021), Resilience and adaptability (Group level) (Trenerry et al., 2021) | |
| Flexibility (E3) | Organizational adaptability (Del Giudice et al., 2021), Agility and flexibility (Cultural attributes) (Teichert, 2019), Agility and flexibility (Attributes of digital culture) (Teichert, 2019), Proactive action (Wolf et al., 2018), Higher flexibility to structure board meetings (Clausen et al., 2018) | |
| Change management (E4) | Radical transformation via successive incremental changes (Jones et al., 2021), Attitudes and perceptions relating to technological change (Individual level) (Trenerry et al., 2021), Change management competency (Ghobakhloo et al., 2021), Change, innovation, people (Capability-based DT) (Brkić et al., 2020), Change (People) management (Romero et al., 2019), Change-ability (Cultural attributes) (Teichert, 2019), Organizational resistance management (Evans et al., 2021), Culture change (Evans et al., 2021), Transformation is different from change (Evans et al., 2021), Change leadership (Evans et al., 2021), Openness toward change (Jayawardena et al., 2020), Change management (Organization) (Büyüközkan et al., 2019), Management competency for digital transformation (Ghobakhloo and Iranmanesh, 2021), Change management competency (Ghobakhloo and Iranmanesh, 2021), Change management (Machado et al., 2021), Major changes to manufacturing processes, distribution channels, and business models (Kraus et al., 2022) | |
| Dynamic capabilities (E5) | Enabling organizational capabilities (Wiesböck and Hess, 2020), Dynamic capabilities (Managerial and organizational capabilities) (Nadkarni and Prügl, 2021), New organizational capabilities (Kohnke, 2017), Dynamic capabilities (Machado et al., 2021), Dynamic capabilities and digital innovation (Kraus et al., 2022), Organization dynamic capabilities (Organization digital transformation capabilities) (Ahmed et al., 2021), Unlock organization (Elements that integrate—Mechanisms) (Hanelt et al., 2021) | |
| Digital culture (E6) | Data-sharing and data-driven corporate culture (Company culture) (Nadkarni and Prügl, 2021), Informational culture (Company culture) (Nadkarni and Prügl, 2021), Digital culture (Teichert, 2019), Digital-first mindset (Attributes of digital culture) (Teichert, 2019), Openness to new technology (Customer and partners) (Schumacher et al., 2019), Openness to new technology (Employees) (Schumacher et al., 2019) | |
| Organizational culture (E7) | Organizational culture (Structural changes) (Vial, 2019), Organizational culture and climate (Organizational level) (Trenerry et al., 2021), People and culture (Governance-led DT) (Brkić et al., 2020), Culture and leadership (Governance-led DT) (Brkić et al., 2020), Organizational culture (Imran et al., 2021), Enabling organizational culture (Wiesböck and Hess, 2020), Culture (Organizational) (Nurbossynova et al., 2021) | |
| Innovative culture (E8) | Management of cultural conflict between younger and older employees (Company culture) (Nadkarni and Prügl, 2021), Dynamic organizational culture (Ghobakhloo et al., 2021), Innovation culture (Lammers et al., 2019), Risk tolerance (Cultural attributes) (Teichert, 2019), Failure tolerance (Cultural attributes) (Teichert, 2019), Open culture (Attributes of digital culture) (Teichert, 2019), Entrepreneurial culture (İnel, 2019), Trust (Jayawardena et al., 2020), Tolerance toward failure (Jayawardena et al., 2020), Start-up culture (Rohn et al., 2021), Openness toward change (Jayawardena et al., 2020) | |
| Customer orientation (C2) | Customer centricity (E9) | Customer Satisfaction/ Trust [expected benefits] (Levkovskyi et al., 2020), Customer orientation (Customer-driven DT) (Brkić et al., 2020), Customer value proposition (Customer-driven DT) (Brkić et al., 2020), Customer centricity (Imran et al., 2021), Customer centricity (Cultural attributes) (Teichert, 2019), Customer centricity (Attributes of digital culture) (Teichert, 2019), Customer centricity (Jayawardena et al., 2020), Focus on customer preferences and anticipation of customer needs (Kraus et al., 2021), Customer focus and value differentiation (Lammers et al., 2019) |
| Customer communication (E10) | Customer Communication (Levkovskyi et al., 2020), Digitalization of customer contact (Customer and partners) (Schumacher et al., 2019), Utilization of customer related data (Customer and partners) (Schumacher et al., 2019), Customer insight and experience (Teichert, 2019), Collection and utilization of customer data (Nimawat and Gidwani, 2022) | |
| Customer engagement (E11) | Customer experience (Customer-driven DT) (Brkić et al., 2020), Customer engagement (Kraus et al., 2021), Customer integration in product development (Customer and partners) (Schumacher et al., 2019), Get the support of end users (Abollado et al., 2017), Digital customer experience (Organization) (Büyüközkan et al., 2019), Customer and supplier integration (Machado et al., 2021), Enhancement of products and services by inputting consumer feedback (Nimawat and Gidwani, 2022) | |
| Customer needs (C3) | Customer needs (E12) | Customer demands (Jones et al., 2021), Digital consumer demand (Environmental determinants—Contextual conditions) (Hanelt et al., 2021), Customer Demand Reaction (Levkovskyi et al., 2020), Customer needs (Vuksanović Herceg et al., 2020), Customer requirements (Strategy) (Stentoft et al., 2021), Customer behavior and demand (Sundaram et al., 2020), Customer demand (Liere-Netheler et al., 2018), Customer expectations (Evans et al., 2021), Consumer behavior (Kraus et al., 2022), Brand permission [brand permission defines the limits of customers’ willingness to accept a familiar brand name in new marketplace situations] (Olokundun et al., 2021), Customer expectations (External) (Wolf et al., 2018), Specifications (External) (Wolf et al., 2018), Customer needs (Environmental) (Nurbossynova et al., 2021) |
| External enablers (C4) | Ecological enablers (E13) | Environmental Friendliness (Levkovskyi et al., 2020), Environmental sustainability (Lammers et al., 2019), Focus on renewable natural resources (Machado et al., 2021), Sharing economy (Machado et al., 2021), Life cycle thinking and circular processes (Machado et al., 2021) |
| Governmental and institutional enablers (E14) | External support for digitalization (Ghobakhloo et al., 2021), Work initiated with input from the public advisor system (Stentoft et al., 2021), External support for digitalization (Ghobakhloo and Iranmanesh, 2021), Government support (Environmental) (Nurbossynova et al., 2021), Government financial support (Environmental) (Nurbossynova et al., 2021), Unified standards and rules (Environmental) (Nurbossynova et al., 2021), Governmental and institutional pressures (Machado et al., 2021), Laws/ Government (Liere-Netheler et al., 2018) | |
| Legal enablers (E16) | Legal and infrastructural conditions (Environmental determinants—Contextual conditions) (Hanelt et al., 2021), Legal Regulation (Levkovskyi et al., 2020), Legal requirements/changed legislation (e.g. CE marking) (Stentoft et al., 2021), Laws/ Government (Liere-Netheler et al., 2018) | |
| Labor market enablers (C5) | Labor market dynamics (E15) | Increasing labor shortages (Szabo et al., 2020), Handling labor market challenges (Szabo et al., 2020), Labor market changes (Vuksanović Herceg et al., 2020) |
| Industry enablers (C6) | Technological enablers (E17) | Technology-driven industry dynamics (Environmental determinants—Contextual conditions) (Hanelt et al., 2021), Diffusion of digital technologies (Lanzolla et al., 2021), Technical uncertainty (Chen and Tian, 2022) |
| Competition pressure (E18) | Market competition (Szabo et al., 2020), Competitors practicing Industry 4.0 (Strategy) (Stentoft et al., 2021), External environmental features like competition (Sundaram et al., 2020), Pressure from competitors (Szabo et al., 2020), Competitive pressure (Nimawat and Gidwani, 2022) | |
| Market/industry enablers (E19) | Market pressure (Liere-Netheler et al., 2018), Market uncertainty (Chen and Tian, 2022), Market Performance (Levkovskyi et al., 2020), Sectorial relevance (Ko et al., 2021), Idiosyncrasies of the industry (Lammers et al., 2019), Follow market trends (Szabo et al., 2020) | |
| Finance resources availability (C7) | Financial resources availability (E20) | Financial resources availability (Ghobakhloo et al., 2021), High cost of digital systems (Lammers et al., 2019), Cost of digitalization (Lammers et al., 2019), Investment and access to finance (İnel, 2019), Smart capital allocation for digital initiatives (Olokundun et al., 2021), Financial resources to realize Industry 4.0 (Strategy and Leadership) (Schumacher et al., 2019), Resource availability (Ghobakhloo and Iranmanesh, 2021), Funding (Organizational) (Nurbossynova et al., 2021), Cost of training and implementation (Nimawat and Gidwani, 2022) |
| Financial results (expected benefits) (C8) | Financial results (expected benefits) (E21) | Revenue Increase [expected benefits] (Levkovskyi et al., 2020), Realizing financial benefits [expected benefits] (Szabo et al., 2020), Increase of ROA [expected benefits] (Szabo et al., 2020), Reducing expenditures [expected benefits] (Szabo et al., 2020), Return of investments [expected benefits] (Lammers et al., 2019), Cash opportunities for digital transformation [expected benefits] (Soluk and Kammerlander, 2021) |
| Innovativeness (C9) | Business model innovation (E22) | Customer value proposition (Customer-driven DT) (Brkić et al., 2020), Value propositions (Changes in value creation paths) (Vial, 2019), Digital channels (Changes in value creation paths) (Vial, 2019), New Business Model [expected benefits] (Levkovskyi et al., 2020), Enhanced Value Proposition [expected benefits] (Levkovskyi et al., 2020), Business model (Teichert, 2019), Servitization of business model (Dombrowski and Fochler, 2018), Resources for business model experimentation (Bouwman et al., 2019), Business model strategy implementation practices (Bouwman et al., 2019), Business model implementation practices (Bouwman et al., 2019), Integration of produces, services and data in the value proposition (Kraus et al., 2021), Securing/ developing business model (Wolf et al., 2018), Digitally modified business models and cultures (Organization) (Büyüközkan et al., 2019), Innovative business models and service design (Machado et al., 2021), Innovative business models and service design techniques (Machado et al., 2021), New Distribution Channel [expected benefits] (Levkovskyi et al., 2020), Servitization and Industry 4.0 (Kraus et al., 2022) |
| Digital innovations (E23) | Creating digital innovation (Elements that innovate—Mechanisms) (Sundaram et al., 2020), Ideating new digitalized working methods and services (Cultural attributes) (Teichert, 2019), Establish Digital Innovation Functional Structure (Establish digital organization) (Morakanyane et al., 2020), Create Digital Innovation Implementation Structure (Establish digital organization) (Morakanyane et al., 2020) | |
| Innovation management (E24) | To improve time-to-market (Strategy) (Stentoft et al., 2021), Innovation strategy (Lammers et al., 2019), Innovation push (Liere-Netheler et al., 2018), Innovation capacity (Troise et al., 2022), Innovativeness (Bouwman et al., 2019), Internal innovation process (Machado et al., 2021) | |
| Innovations and their types (E25) | Innovating by experimenting (Jones et al., 2021), Innovation (Teichert, 2019), Innovation (Attributes of digital culture) (Teichert, 2019), Disruptive innovation (Evans et al., 2021), Innovation (Jayawardena et al., 2020), Open innovation (Müller, 2019), Innovation (Internal) (Wolf et al., 2018), Open innovation (Machado et al., 2021), Experimentation (Machado et al., 2021) | |
| Leadership and support (C10) | Awareness of DT (E26) | Digital transformation awareness of TMT (Organizational determinants - Contextual conditions) (Hanelt et al., 2021), Transformation urgency (Firk et al., 2021), Carry out Digital Present Awareness (Develop digital vision) (Morakanyane et al., 2020), Promotion and sensitization of digital transformation (Rohn et al., 2021), Communication of Industry 4.0 activities (Strategy and Leadership) (Schumacher et al., 2019), Assertive communication, acceptance and commitment (Execution) (Arbaiza, 2018) |
| Commitment of managers (E27) | Management commitment (Ko et al., 2021), Management support and commitment (Ghobakhloo et al., 2021), CEO’s commitment (Evans et al., 2021), Combining strengths (Müller, 2019), Willingness of managers to realize Industry 4.0 (Strategy and Leadership) (Schumacher et al., 2019), Assertive communication, acceptance and commitment (Execution) (Arbaiza, 2018), Top management commitment (Machado et al., 2021), Management motivation (Nimawat and Gidwani, 2022) | |
| Leadership (E28) | Leadership (Structural changes) (Vial, 2019), Transformational leadership (Transformational leadership) (Nadkarni and Prügl, 2021), Nature of leadership (Transformational leadership) (Nadkarni and Prügl, 2021), Leadership (Organizational level) (Trenerry et al., 2021), Change in leadership roles (Rêgo et al., 2021), Leadership (Lammers et al., 2019), Leadership (Imran et al., 2021), Leadership (Teichert, 2019), E-Leadership (İnel, 2019), Employee objectives to realize Industry 4.0 (Strategy and Leadership) (Schumacher et al., 2019), New forms of leadership (Kohnke, 2017), Exhibit Strong Organizational Leadership Traits (Cultivate digital culture) (Morakanyane et al., 2020), Exhibit Strong Digital Leadership Traits (Determine digital drivers) (Morakanyane et al., 2020), Transformational leadership (Machado et al., 2021), Culture and leadership (Governance-led DT) (Brkić et al., 2020), Social influence (Execution) (Arbaiza, 2018) | |
| Support from managers (E29) | Mobilization for and acceleration of digital transformation by TMT (Elements that innovate—Mechanisms) (Hanelt et al., 2021), Management support (Liere-Netheler et al., 2018), Combining strengths (Müller, 2019), Obtaining support of senior management (Abollado et al., 2017), Management support (Organizational) (Nurbossynova et al., 2021), Promotion and sensitization of digital transformation (Rohn et al., 2021), Unconditional support of the high level (Strategy) (Arbaiza, 2018) | |
| Chief Digital Officer (E33) | The emergence of Chief Digital Officers (Transformational leadership) (Nadkarni and Prügl, 2021), Chief digital officer (Rêgo et al., 2021), Chief digital officer (Firk et al., 2021), Chief digital officer (Kessel and Graf-Vlachy, 2021) | |
| Learning and development (C11) | Human resource management (E30) | “Born digital” talents management (Work environment) (Nadkarni and Prügl, 2021), Human resources (Organizational level) (Trenerry et al., 2021), Engagement/ Retention (Levkovskyi et al., 2020), Human resource readiness for digitalization (Ghobakhloo et al., 2021), High readability (Clausen et al., 2018), Talent recruitment (Olokundun et al., 2021), Recruitment for Industry 4.0 (Corporate Standards) (Schumacher et al., 2019), Human resources (Nwaiwu et al., 2020), Composition of the team (Organizational) (Nurbossynova et al., 2021), Experienced workers (Organizational) (Nurbossynova et al., 2021), Individual incentive schemes (Machado et al., 2021) |
| Learning and development (E31) | Employee roles and skills (Structural changes) (Vial, 2019), Leadership education (Transformational leadership) (Nadkarni and Prügl, 2021), Organizational learning (Company culture) (Nadkarni and Prügl, 2021), Skills gap management (Work environment) (Nadkarni and Prügl, 2021), Skills and training (Individual level) (Trenerry et al., 2021), Organizational learning (Cultural attributes) (Teichert, 2019), Willingness to learn (Jayawardena et al., 2020), Employee trainings for digital competences (Corporate Standards) (Schumacher et al., 2019), Experience with interdisciplinary work (Employees) (Schumacher et al., 2019), Willingness for continuous training on the job (Employees) (Schumacher et al., 2019), Knowledge about employee competences (Employees) (Schumacher et al., 2019), Manager trainings for Industry 4.0 (Strategy and Leadership) (Schumacher et al., 2019), New skills and competencies (Kohnke, 2017), Digital education and training (Human) (Büyüközkan et al., 2019), Competence of the team (Organizational) (Nurbossynova et al., 2021), Training (Organizational) (Nurbossynova et al., 2021), Develop early training (Execution) (Arbaiza, 2018), Education and training focused on soft and technical skills (Machado et al., 2021), Entrepreneurship education centers (Kraus et al., 2022) | |
| Digital skills (E32) | Digital competencies development (Rêgo et al., 2021), Digital Literacy (Digital Intelligence) (Boughzala et al., 2020), Digital Emotional Intelligence (Digital Intelligence) (Boughzala et al., 2020), Digital Communication (Digital Intelligence) (Boughzala et al., 2020), Team digital creativity (Boughzala et al., 2020), Capabilities to drive the next-generation operating model (Capability-based DT) (Brkić et al., 2020), Availability of digital knowledge and skills (Lammers et al., 2019), The novel competencies required to adopt the digital technologies in several business processes (Garzoni et al., 2020), Digital skills (Teichert, 2019), Supply and demand of digital skills (İnel, 2019), Knowledge of digital systems (Evans et al., 2021), Digital skills (Evans, 2016), Digital literacy of employees (Cetindamar Kozanoglu and Abedin, 2021), Digital savvy skills (Sousa-Zomer et al., 2020), Competences with modern ICT (Customer and partners) (Schumacher et al., 2019), Competences with modern ICT (Employees) (Schumacher et al., 2019), Awareness of non-IT-employees for cyber security (Employees) (Schumacher et al., 2019), IT professional (Nimawat and Gidwani, 2022), Experience with interdisciplinary work (Employees) (Schumacher et al., 2019), New skills and competencies (Kohnke, 2017), Continuous digital awareness (Human) (Büyüközkan et al., 2019), Digital roles (Human) (Büyüközkan et al., 2019), Determine Skill and Capabilities Required (Determine digital drivers) (Morakanyane et al., 2020), Information and digital technology expertise (Ghobakhloo and Iranmanesh, 2021) | |
| Managerial control [expected benefits] (C12) | Managerial control [expected results] (E34) | Need for higher control for the top management (Szabo et al., 2020), Continuous monitoring of company performance (Szabo et al., 2020), Real-time performance measurement (Szabo et al., 2020), Compliance with management expectations (Szabo et al., 2020), Ensuring full control of corporate processes (Szabo et al., 2020), Compliance and security (Teichert, 2019) |
| Flexible and flat organization (C13) | Empowerment and autonomy (E35) | Decentralization (Action Formation Mechanism) (Haskamp et al., 2021), Empowerment (Cultural attributes) (Teichert, 2019), Staff autonomy and decentralized decision making (Porfírio et al., 2021), Autonomy of shop floor workers (Employees) (Schumacher et al., 2019), Employee’s empowerment (Machado et al., 2021), Employee Engagement (Levkovskyi et al., 2020) |
| Organizational structure (E36) | Organizational structure (Structural changes) (Vial, 2019), Dedicated organizational unites (Digital Innovations Units) (Situational Mechanism) (Haskamp et al., 2021), Organizational structure (Imran et al., 2021), Enabling organizational structures (Wiesböck and Hess, 2020), Organization (Teichert, 2019), Flexible structure (both physical and design features) (Clausen et al., 2018), Create an effective governance structure (Planning) (Arbaiza, 2018), Knowledgeable and innovative management (Organizational) (Nurbossynova et al., 2021), Re-designing and decentralized structure (Machado et al., 2021) | |
| Workplace [expected benefits] (E41) | Workforce improvement [expected benefits] (Jones et al., 2021), Workplace resilience and adaptability (Individual level) (Trenerry et al., 2021), Work-related stress and wellbeing (Individual level) (Trenerry et al., 2021), Improved Workplace [expected benefits] (Levkovskyi et al., 2020), Demanded by employees (to remain attractive employer) (Szabo et al., 2020), Lack of qualified workforce (Stentoft et al., 2021), Workers safety [expected benefits] (Lammers et al., 2019), Workplace improvement [expected benefits] (Liere-Netheler et al., 2018), Digitalization of workplaces (White, 2012), Adjustments of works arrangements (Corporate Standards) (Schumacher et al., 2019), Rules for employees in the digital work environment (Corporate Standards) (Schumacher et al., 2019), Willingness to flexible work arrangements (Employees) (Schumacher et al., 2019) | |
| Internal collaboration (E57) | Team communication and collaboration (Group level) (Trenerry et al., 2021), Workplace relationships and team identification (Group level) (Trenerry et al., 2021), Collaboration environment (Imran et al., 2021), Collaboration (Cultural attributes) (Teichert, 2019), Collaboration (Attributes of digital culture) (Teichert, 2019), Collaboration (Human) (Büyüközkan et al., 2019), All departments operate together digitally (Nimawat and Gidwani, 2022) | |
| Internal communication (E58) | Team communication and collaboration (Group level) (Trenerry et al., 2021), Open communication (Cultural attributes) (Teichert, 2019), Improved communication through more opportunities (Clausen et al., 2018), Communication within the organization (Organizational) (Nurbossynova et al., 2021), Effective communication (Machado et al., 2021), Knowledge sharing (Cultural attributes) (Teichert, 2019), Knowledge sharing (Machado et al., 2021), Improved communication and knowledge sharing between leaders and employees (Clausen et al., 2018) | |
| Team work (E59) | Cross-location teams (Work environment) (Nadkarni and Prügl, 2021), Team communication and collaboration (Group level) (Trenerry et al., 2021), Workplace relationships and team identification (Group level) (Trenerry et al., 2021), Focused teams (Evans et al., 2021), Composition of the team (Organizational) (Nurbossynova et al., 2021) | |
| Partnership and ecosystem development (C14) | Networks and ecosystems (E37) | Value networks (Changes in value creation paths) (Vial, 2019), Digital ecosystem (Teichert, 2019), Creation of ecosystem (Evans et al., 2021), Collaborative networks (Machado et al., 2021) |
| Cooperation and partnership (E38) | Early involvement of interested parties and promoting a transparent environment in Industry 4.0 implementation (Rêgo et al., 2021), Collaboration and cooperation with partners (Lammers et al., 2019), Relational capacity (ability to create and maintain relationships with key players) (Troise et al., 2022), Developing partnerships (Müller, 2019), Communication between organizations/ effective collaborations (Environmental) (Nurbossynova et al., 2021), Support of unconventional partners (Machado et al., 2021) | |
| Digital contact with partners (E39) | New digital value chains (Lanzolla et al., 2021), Digital interconnectivity with partners (Lanzolla et al., 2021), IT collaboration for product development (Customer and partners) (Schumacher et al., 2019), Digital contact with company partners (Customer and partners) (Schumacher et al., 2019), Company partner’s degree of digitalization (Customer and partners) (Schumacher et al., 2019), Business partner digital maturity (Ghobakhloo and Iranmanesh, 2021) | |
| Supply chain management (E40) | Supply chain (Liere-Netheler et al., 2018), Reducing transaction costs [expected benefits] (Müller, 2019), Supply chain management (Environmental) (Nurbossynova et al., 2021), Shifts in supply chain ecosystem (Kraus et al., 2022) | |
| Process efficiency (expected benefits) (C15) | Processes (expected benefits) (E42) | Process improvements (Expected benefits) (Jones et al., 2021), Outsourcing non-essential IT activities, concentration in business activities and expansion of IT knowledge (Rêgo et al., 2021), Process Efficiency [expected benefits] (Levkovskyi et al., 2020), Reducing human work [expected benefits] (Szabo et al., 2020), Allocating workforce to other areas [with higher added value] (Szabo et al., 2020), Cost reduction and performance improvement [expected benefits] (Vuksanović Herceg et al., 2020), Process and governance (Governance-led DT) (Brkić et al., 2020), Cost efficiency—process efficiency (Lammers et al., 2019), Productivity (Lammers et al., 2019), Process improvement [expected benefits] (Liere-Netheler et al., 2018), Expected output [custom application software that can be replicated within the respective supply chains] (Garzoni et al., 2020), Process (Re-) Engineering management (Romero et al., 2019), Operations and processes (Teichert, 2019), Efficiency (Internal) [expected benefits] (Wolf et al., 2018), Operations (Nwaiwu et al., 2020), Well-thought algorithm of business processes reengineering (Organizational) (Nurbossynova et al., 2021), Transparency in operations (Environmental) (Nurbossynova et al., 2021), Overall production data remotely accessed (Nimawat and Gidwani, 2022) |
| Costs (expected benefits) (E44) | Reducing transaction costs [expected benefits] (Müller, 2019), Cost Reduction [expected benefits] (Levkovskyi et al., 2020), Attempt to decrease costs [expected benefits] (Szabo et al., 2020), Reducing costs [expected benefits] (Szabo et al., 2020), Cost reduction and performance improvement [expected benefits] (Vuksanović Herceg et al., 2020), To reduce costs (Strategy) [expected benefits] (Stentoft et al., 2021), Cost efficiency—process efficiency [expected benefits] (Lammers et al., 2019), Expected benefits (Nimawat and Gidwani, 2022), Cost reduction [expected benefits] (Liere-Netheler et al., 2018) | |
| Products readiness (C16) | Products (E43) | Legal protection for digital products and services (Corporate Standards) (Schumacher et al., 2019), Service design (Jiang, 2020), Products and services (Teichert, 2019), Product individualization (Products) (Schumacher et al., 2019), Personalized solutions (Nimawat and Gidwani, 2022), Flexibility of product characteristics (Products) (Schumacher et al., 2019), Collection of product-use-information (Products) (Schumacher et al., 2019), Data processing components in products (Products) (Schumacher et al., 2019), Internet connection of products (Products) (Schumacher et al., 2019), Digital compatibility and interoperability of products (Products) (Schumacher et al., 2019) |
| Corporate management (C17) | Decision making (E45) | Decision-making support (Lammers et al., 2019), Data-driven decision making (Attributes of digital culture) (Teichert, 2019), Real-time data enables efficient decision making (Clausen et al., 2018), Real-time data enables efficient decision making (exploring the future) (Clausen et al., 2018) |
| Risk management (E46) | (Digital) Risk management (Romero et al., 2019), Risk management (Evans et al., 2021), Risk assessment for Industry 4.0 (Strategy and Leadership) (Schumacher et al., 2019) | |
| Resource management (E47) | Resources and capabilities analysis (Rêgo et al., 2021), Resource structuring (Chen and Tian, 2022), Resource bundling (Chen and Tian, 2022), Resource leveraging (Chen and Tian, 2022), Determine Other Resources Impacting Required (Determine digital drivers) (Morakanyane et al., 2020) | |
| Corporate planning (E48) | Resources and capabilities analysis (Rêgo et al., 2021), Digitalization strategic planning capability (Ghobakhloo et al., 2021), Perception of relative advantage (Lammers et al., 2019), Efficacy of strategic planning (Porfírio et al., 2021), Building DX Initiatives (Determine transformed areas) (Morakanyane et al., 2020), Manufacturing digitalization strategic road mapping (Ghobakhloo and Iranmanesh, 2021), Strategic planning (Organizational) (Nurbossynova et al., 2021), Current systems analysis (Planning) (Arbaiza, 2018), Dynamic, sustainable advantages through an evolving portfolio of temporary advantages (Jones et al., 2021), Benchmarking (Müller, 2019) | |
| Corporate governance (E49) | (Digital) Strategic management (Romero et al., 2019), Governance (Teichert, 2019), Coordination needs (Firk et al., 2021), Adopt Good Governance Practices (Cultivate digital culture) (Morakanyane et al., 2020), Management competency for digital transformation (Ghobakhloo and Iranmanesh, 2021) | |
| DT planning capabilities (E50) | Identify Target Transforming Areas (Determine transformed areas) (Morakanyane et al., 2020), Define Expected Customer Facing Impacts (Determine impacts) (Morakanyane et al., 2020), Determine Realized Customer Facing Impacts (Determine impacts) (Morakanyane et al., 2020), Define Expected Organizational Facing Impacts (Determine impacts) (Morakanyane et al., 2020), Determine Realized Organization Facing Impacts (Determine impacts) (Morakanyane et al., 2020), Determine Measure Of Impacts (Determine impacts) (Morakanyane et al. 2020) | |
| DT implementation capabilities (E51) | Resources and capabilities analysis (Rêgo et al., 2021), Early success stories of digital transformation (Soluk and Kammerlander, 2021), Monitoring of Industry 4.0 realization (Corporate Standards) (Schumacher et al., 2019), Central coordination of Industry 4.0 activities (Strategy and Leadership) (Schumacher et al., 2019), Communication of Industry 4.0 activities (Strategy and Leadership) (Schumacher et al., 2019), Implement in phases (Abollado et al., 2017), Focus first on processes that are fully understood (Abollado et al., 2017), Use metrics (Abollado et al., 2017), The first impression counts (Execution) (Arbaiza, 2018), Monitor and correct the course (Training) (Arbaiza, 2018) | |
| Competitiveness improvement (expected benefits) (C18) | Competitiveness (expected benefits) (E52) | Competitive Advantage [expected benefits] (Levkovskyi et al., 2020), Improving market position [expected benefits] (Szabo et al., 2020), Overcoming competitors [expected benefits] (Szabo et al., 2020), Competitiveness and business model innovation (Vuksanović Herceg et al., 2020), Recognizing opportunities to differentiate from competitors (Kraus et al., 2021), Competitiveness (Nwaiwu et al., 2020) |
| Strategy for DT (C19) | Digital strategy (E53) | Developing digital business strategy (Elements that innovate - Mechanisms) (Hanelt et al., 2021), Developing digital transformation strategy (Elements that integrate - Mechanisms) (Hanelt et al., 2021), Shared understanding of DT (Rêgo et al., 2021), Conscious strategy around Industry 4.0 (Stentoft et al., 2021), Digital strategy and common understanding of digital transformation (Soluk and Kammerlander, 2021), Digital strategy (Teichert, 2019), Roadmap for Industry 4.0 realization (Strategy and Leadership) (Schumacher et al., 2019), Digital strategy roadmap (Organization) (Büyüközkan et al., 2019), Know the type of triggers (Determine digital trigger) (Morakanyane et al., 2020), Know the type of inducers (Determine digital trigger) (Morakanyane et al., 2020), Ensure shared conceptualization of digital transformation (Determine digital trigger) (Morakanyane et al., 2020), Formulate Digital Future (Develop digital vision) (Morakanyane et al., 2020), Develop Digital Strategy (Develop digital vision) (Morakanyane et al., 2020), Establish a Digital Communication Strategy (Develop digital vision) (Morakanyane et al., 2020), Determine Transformation Opportunities (Determine transformed areas) (Morakanyane et al. 2020) |
| Specific strategies (E54) | Market focus/ globalization (Lammers et al., 2019), Vertical integration (Liere-Netheler et al., 2018), Horizontal integration (Liere-Netheler et al., 2018), Economies of scale and scope (Müller, 2019), Strategic judgment of platform providers: concentration on a very small niche market in the initial phase; satisfaction of a small-sized client base (Rohn et al., 2021), Sustainable philosophy (Machado et al., 2021), Innovation strategy (Lammers et al., 2019) | |
| Strategic IT-alignment (E55) | Fusion between functional IT strategy and business strategy (Transformational leadership) (Nadkarni and Prügl, 2021), Alignment between business and IT strategy (Kraus et al., 2021), Rapid implementation of IT strategies (Kraus et al., 2021), Alignment of TIC’s to the business strategy (Strategy) (Arbaiza, 2018), Integrate ICT implementation with change management (Planning) (Arbaiza, 2018), Strategic alignment (Machado et al., 2021), Interdisciplinary and holistic integration (Machado et al., 2021) | |
| Strategy and its components (E56) | Organizational strategy and legacy (Organizational determinants—Contextual conditions) (Hanelt et al., 2021), Faster strategy and implementation cycle (Managerial and organizational capabilities) (Nadkarni and Prügl, 2021), Strategic goals (Ko et al., 2021), Strategy and vision (Governance-led DT) (Brkić et al., 2020), Scope (Governance-led DT) (Brkić et al., 2020), Vision (Teichert, 2019), Digital vision (Nimawat and Gidwani, 2022), Coherence of mission (Porfírio et al., 2021), Strategy (Nwaiwu et al., 2020), Strategic responses (Kraus et al., 2022), Organizational fit (Nwaiwu et al., 2020), Clear goals (Organizational) (Nurbossynova et al., 2021) | |
| Technology management (C20) | Data management (E60) | Data-driven decision making (Attributes of digital culture) (Teichert, 2019), Real-time data enables efficient decision making (Clausen et al., 2018), Real-time data enables efficient decision making (exploring the future) (Clausen et al., 2018), Data-centered solutions (Machado et al., 2021), Data resources (Organization digital transformation capabilities) (Ahmed et al., 2021), Organization knowledge and information management (Organization digital transformation capabilities) (Ahmed et al., 2021), Data Governance (Levkovskyi et al., 2020), Manual data update is ineffective (Clausen et al., 2018), Many new data opportunities (Clausen et al., 2018), Higher level of data transparency (Clausen et al., 2018), Analysis of collected data (Data and Information) (Schumacher et al., 2019), Databased decision making (Data and Information) (Schumacher et al., 2019), Automated information provision (Data and Information) (Schumacher et al., 2019), Individualization of provided information (Data and Information) (Schumacher et al., 2019), Integrated system which multiple users can access (Nimawat and Gidwani, 2022), Availability of real-time data (Nimawat and Gidwani, 2022), Digital process visualization (Data and Information) (Schumacher et al., 2019), Knowledge protection (Rêgo et al., 2021), Data-driven software-simulation of future scenarios (Data and Information) (Schumacher et al., 2019), Consistent data flow (Machado et al., 2021) |
| Digital technology management (E61) | Digital technologies impact (for strategy, processes, and organization) (Reframing of digital processes and change management) (Garzoni et al., 2020), Increasing technological flexibility (Elements that integrate—Mechanisms) (Hanelt et al., 2021), Physical-digital harmonizing by TMT (Elements that integrate—Mechanisms) (Hanelt et al., 2021), Scaling digital solutions (Transformational Mechanisms) (Haskamp et al., 2021), IT support of digitalization (Ko et al., 2021), Digitalization preassessment capability (Ghobakhloo et al., 2021), Enabling organizational IT application portfolios (Wiesböck and Hess, 2020), (Digital) Technology management (Romero et al., 2019), Digital technology capacity (Troise et al., 2022), Engagement of appropriate digital tools (Olokundun et al., 2021), Digital intensity (in order to change their operations, companies need to invest in technology-enabled initiatives; this means that they need to improve their digital intensity) (Sousa-Zomer et al., 2020), Digitized solutions (Kraus et al., 2021), Utilization of digital technology (Nimawat and Gidwani, 2022), Infrastructure of machinery and technologies (Nimawat and Gidwani, 2022), IT-services related to physical products (Products) (Schumacher et al., 2019), Integrate the digital workflow with current systems (Abollado et al., 2017), Determine Digital Technologies to Leverage (Determine digital drivers) (Morakanyane et al., 2020), Usefulness and perceived ease of use (Execution) (Arbaiza, 2018), Exploitation and leveraging of digital capabilities (Elements that innovate—Mechanisms) (Hanelt et al., 2021), Merging human-computer interaction (Elements that innovate—Mechanisms) (Hanelt et al., 2021) | |
| Technology management maturity (E62) | Maturity (Jones et al., 2021), Operations technology maturity (Ghobakhloo et al., 2021), Availability of standards and frameworks (Lammers et al., 2019), Technological standards (Corporate Standards) (Schumacher et al., 2019) | |
| Security management (E63) | Digital Security (Digital Intelligence) (Boughzala et al., 2020), Privacy and security concerns (Lammers et al., 2019), Information transparency and data security (Machado et al., 2021) |
Appendix 2. Direct-influence matrix for DT enablers
Low-tech manufacturing companies.
|
|
|
|
|
|
|
|
|
|
|
|
|
|
|
|
|
|
|
|
|
|
|---|---|---|---|---|---|---|---|---|---|---|---|---|---|---|---|---|---|---|---|---|
|
|
0 | 2.67 | .50 | .83 | 1.50 | .33 | 1.00 | .67 | 3.50 | 2.33 | 3.17 | 1.50 | 3.00 | 2.67 | 1.83 | 2.33 | .83 | 2.67 | 1.17 | 2.67 |
|
|
2.83 | 0 | 1.50 | 1.00 | .50 | .83 | 2.17 | 1.50 | 3.17 | 1.83 | 2.33 | .83 | .17 | 1.00 | 1.50 | 1.33 | .83 | 2.50 | .50 | 1.50 |
|
|
1.67 | 3.00 | 0 | .83 | 1.00 | 1.00 | .33 | .33 | 3.00 | 1.17 | 2.50 | .50 | .17 | 1.33 | .33 | 2.17 | .67 | 2.33 | .33 | 2.33 |
|
|
2.83 | 3.00 | 2.67 | 0 | 1.50 | 2.33 | 2.50 | 2.67 | 2.67 | 3.17 | 2.83 | 3.00 | 1.67 | 3.00 | 2.67 | 1.50 | 2.33 | 3.33 | 3.00 | 2.33 |
|
|
3.00 | .33 | .33 | 1.17 | 0 | 1.83 | .83 | .83 | 2.67 | 2.33 | 3.33 | 1.00 | 2.33 | 2.00 | 2.50 | 2.67 | .50 | 1.83 | 1.17 | 1.17 |
|
|
2.50 | 1.50 | 1.67 | 1.67 | 3.17 | 0 | 2.17 | 2.00 | 3.33 | 2.83 | 3.50 | 2.50 | 2.67 | 3.33 | 2.17 | 2.50 | 1.67 | 3.50 | 2.50 | 2.50 |
|
|
2.33 | 2.33 | 1.50 | 1.00 | 2.33 | 1.67 | 0 | 2.33 | 3.83 | 3.00 | 3.33 | 2.67 | 2.17 | 3.17 | 2.83 | 3.17 | 2.17 | 3.50 | 3.67 | 3.33 |
|
|
1.67 | 3.17 | .17 | .67 | .33 | 1.00 | 2.67 | 0 | 2.83 | 1.33 | 2.17 | 2.50 | .50 | 2.50 | 3.50 | 3.50 | 2.67 | 3.00 | 1.33 | 1.17 |
|
|
3.17 | 2.17 | .50 | .83 | 1.67 | 1.17 | .50 | 1.83 | 0 | 2.83 | 2.50 | .67 | 2.50 | 2.33 | 1.17 | 3.17 | .50 | 2.17 | 2.33 | 2.33 |
|
|
1.33 | 2.00 | .67 | .67 | .83 | .50 | 2.50 | 1.33 | 2.33 | 0 | 1.50 | 2.50 | 1.83 | 2.67 | 1.50 | 1.83 | 2.33 | 3.00 | 1.50 | .83 |
|
|
2.33 | 2.33 | 1.50 | .67 | 1.17 | .33 | 2.50 | .83 | 3.50 | 1.50 | 0 | 1.33 | 2.50 | 1.83 | 1.50 | 1.33 | .50 | 1.83 | 1.33 | 2.83 |
|
|
1.33 | 3.17 | .83 | 1.33 | 1.50 | 1.33 | 3.17 | 3.67 | 3.00 | 3.33 | 2.83 | 0 | 2.00 | 2.33 | 3.33 | 3.17 | 3.00 | 2.50 | 2.83 | 2.83 |
|
|
3.00 | 2.00 | .67 | .50 | .67 | 1.00 | .33 | .67 | 3.00 | .83 | 1.83 | .67 | 0 | .33 | 2.00 | 1.17 | .50 | .33 | 2.50 | 1.50 |
|
|
.50 | 1.00 | 1.17 | 1.67 | 1.33 | 2.00 | 2.67 | 1.83 | 1.50 | .83 | .67 | .67 | .33 | 0 | 2.67 | 2.33 | 1.17 | 2.00 | 1.50 | 1.33 |
|
|
1.33 | 1.33 | .17 | .33 | 1.33 | .50 | 2.17 | 3.83 | 3.17 | 1.00 | 3.33 | 3.50 | 1.33 | 2.67 | 0 | 3.67 | 3.00 | 3.50 | 1.33 | 4.00 |
|
|
1.33 | 2.67 | 1.33 | .67 | .50 | .67 | 1.33 | 1.33 | 1.50 | 1.33 | 2.00 | 1.00 | .17 | 1.33 | 2.33 | 0 | 1.00 | 2.17 | 1.17 | .17 |
|
|
3.67 | 2.50 | .33 | .67 | 1.67 | .50 | 2.83 | 3.17 | 3.00 | 3.17 | 2.50 | 3.50 | 2.50 | 2.67 | 3.33 | 2.83 | 0 | 3.17 | 3.33 | 3.50 |
|
|
.83 | 1.50 | .33 | .00 | 1.17 | .50 | 2.67 | 3.00 | 2.00 | 1.33 | 1.17 | .50 | .33 | 1.33 | 3.67 | 3.00 | 3.33 | 0 | 1.00 | 1.67 |
|
|
2.67 | 3.83 | .67 | 1.33 | 1.33 | 1.67 | 3.50 | 2.33 | 3.33 | 3.67 | 2.67 | 3.50 | 1.50 | 2.33 | 2.50 | 2.83 | 3.67 | 2.17 | 0 | 2.83 |
|
|
2.67 | 2.33 | 2.00 | 1.67 | 1.83 | 1.50 | 3.00 | 2.50 | 3.50 | 3.33 | 3.00 | 2.83 | 1.33 | 3.00 | 3.67 | 3.50 | 2.67 | 3.50 | 2.17 | 0 |
Appendix 3. Correlation of relation and prominence between DEMATEL results from individual experts of the same group
Kendall correlation for relation measure within low-tech group.
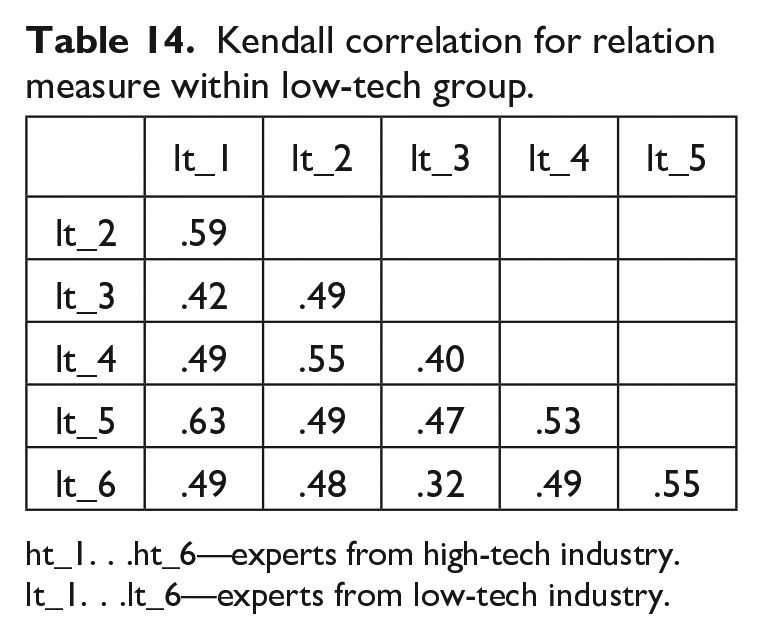
| lt_1 | lt_2 | lt_3 | lt_4 | lt_5 | |
|---|---|---|---|---|---|
| lt_2 | .59 | ||||
| lt_3 | .42 | .49 | |||
| lt_4 | .49 | .55 | .40 | ||
| lt_5 | .63 | .49 | .47 | .53 | |
| lt_6 | .49 | .48 | .32 | .49 | .55 |
ht_1. . .ht_6—experts from high-tech industry.
lt_1. . .lt_6—experts from low-tech industry.
Acknowledgements
The authors acknowledge the useful comments and suggestions on the first draft of this paper from Professor Terry Noel, Associate Dean of Academic Programs and Curriculum, College of Business, Illinois State University.
Final transcript accepted 29 January 2023 by Sam Kirshner (AE Information Systems and Operations Management).
Funding
The author(s) received no financial support for the research, authorship, and/or publication of this article.
References
Supplementary Material
Please find the following supplemental material available below.
For Open Access articles published under a Creative Commons License, all supplemental material carries the same license as the article it is associated with.
For non-Open Access articles published, all supplemental material carries a non-exclusive license, and permission requests for re-use of supplemental material or any part of supplemental material shall be sent directly to the copyright owner as specified in the copyright notice associated with the article.