
Abstract
Motivated by recent regulatory scrutiny of auditing in Australia, we provide an overview of the audit market for Australian listed companies from 2012 to 2018. Using descriptive analyses, we explore audit market competition, the provision of non-audit services (NAS), and audit firm tenure. We find that the Australian audit market is highly segmented. Big 4 firms increasingly dominate the larger client segment, while Non-Big 4 firms focus on medium and smaller clients. Auditor-provided NAS fees represent a relatively small fraction of audit fees for smaller clients, but a relatively high fraction for larger clients. We further observe that the share of total revenue from NAS of Big 4 firms increases over time. Finally, a relatively small percentage of clients has long audit firm tenure, and that long tenure is more common in the larger client segments. We discuss the implications of these findings and research opportunities that emerge.
1. Introduction
In recent years, audit quality has received regulatory and public attention in Australia, as highlighted by negative findings in audit inspections of the Australian Securities and Investments Commission (ASIC) as well as a range of high-profile international audit failures (Neate and Davies, 2020; Parliamentary Joint Committee on Corporations and Financial Services, 2020a; Poltz and Schuetze, 2020). This on-going discussion about audit quality culminated in the 2019 Australian parliamentary inquiry on regulation of auditing in Australia (Parliamentary Joint Committee on Corporations and Financial Services, 2020a, 2020b; Tadros, 2020; Wootton, 2019). Among other issues, the parliamentary inquiry probed the lack of competition in the audit market, and particularly the Big 4 firms’ ‘absolute and peerless’ dominance in the global audit market, especially for the largest listed clients (Parliamentary Joint Committee on Corporations and Financial Services, 2020b: 9). The parliamentary inquiry also discussed audit quality concerns related to the provision of non-audit services (NAS), and long audit firm tenure, as threats to auditor independence. The inquiry concluded with several recommendations on the provision, disclosure and ethics rules related to NAS (recommendations 3, 4 and 5) and audit firm tenure (recommendations 6 and 7) (Parliamentary Joint Committee on Corporations and Financial Services, 2020a). 1
These recommendations on the regulation of auditing can profoundly affect the Australian audit market. Yet, as pointed out by many submissions to the parliamentary inquiry, there is little understanding of the current state of the Australian listed company audit market (Parliamentary Joint Committee on Corporations and Financial Services, 2020a, 2020b). 2 This study (1) provides descriptive evidence on audit market competition, the provision of NAS and audit firm tenure of Australian listed companies from 2012 to 2018; and (2) discusses implications of these findings and research opportunities. 3 In doing so, this study also provides a timely update to a previous survey of similar nature, which covers the period from 2000 to 2011 (Carson et al., 2014).
Using a comprehensive dataset of Australian listed clients over the period 2012–2018, we show that the audit market is highly segmented. The Big 4 firms dominate audit services for the largest 200 clients (largest clients by market capitalisation) and play a significant role in the next largest 300 clients (large clients by market capitalisation). However, the Big 4 firms audit a relatively smaller percentage of the medium and small clients, compared to non-Big 4 firms. Hence, market concentration is high in the larger client segments, but less concerning in the smaller client segments. These results indicate that the Australian audit market is complex and imply that a uniform set of audit regulations would affect each market segment differently (i.e. one size does not fit all).
From Australian accounting firm transparency report disclosures, we show that revenue from the non-audit service lines (from both audit and non-audit clients) represents approximately three-quarters of the total revenue of the Big 4 accounting firms. 4 The rapid growth in revenue from consulting, tax and other NAS raises potential concerns about the decreased importance of auditing in large accounting firms. Regarding the source of NAS fees, on average, only 11.6% of all NAS fees are from all audit clients (listed and non-listed), indicating lower economic significance of NAS from audit clients compared to non-audit clients. 5 We further explore whether listed audit clients purchase a significant amount of NAS from their auditors. We find that the average NAS fee to audit fee ratio is about 30% for the largest clients (top 200 companies by market capitalisation), and around 50% for the second-largest clients (companies ranked between 201 and 500 by market capitalisation). This suggests that the second-largest clients could be affected most significantly if regulators introduce additional restrictions on auditor-provided NAS.
Finally, we show that audit firm tenure varies across different client segments. While long audit firm tenure is uncommon for the small and medium clients, it is relatively common for larger and economically significant clients. These clients could be affected more if regulation on mandatory audit firm rotation is introduced. We further examine patterns of audit firm switches and find that switches between Non-Big 4 firms are the most common type, except for the top 200 clients where the vast majority of audit firm switches occur between Big 4 firms.
Overall, this study contributes to an understanding of the current state of the audit market in Australia and its recent trends. It also responds to policy makers’ and regulators’ concerns over audit market dominance, the provision of NAS, and long audit firm tenure by providing empirical evidence on the status quo in Australia. Finally, we discuss some research opportunities based on our observations.
2. Sample selection
Table 1 shows our sample selection method. We first identify all entities listed on the Australian Securities Exchange (ASX) from SIRCA’s Share Price and Price Relative (SPPR) database from 2012 to 2018. We then exclude listed entities that do not issue general-purpose financial reports. 6 From the companies with public financial reports, we identify those that meet the following criteria: (1) they are listed on the ASX, (2) their headquarters are in Australia, (3) the audit opinions are signed in Australia and (4) they report audit fees in Australian dollars in their annual reports. As a result, our sample includes 12,357 observations, representing 81.8% of all companies listed on the ASX. For the analyses of audit firm tenure and audit firm changes, we further exclude 331 observations of newly listed companies from the sample due to unavailable audit firm information, which results in a sample of 12,026 observations.
Sample description.
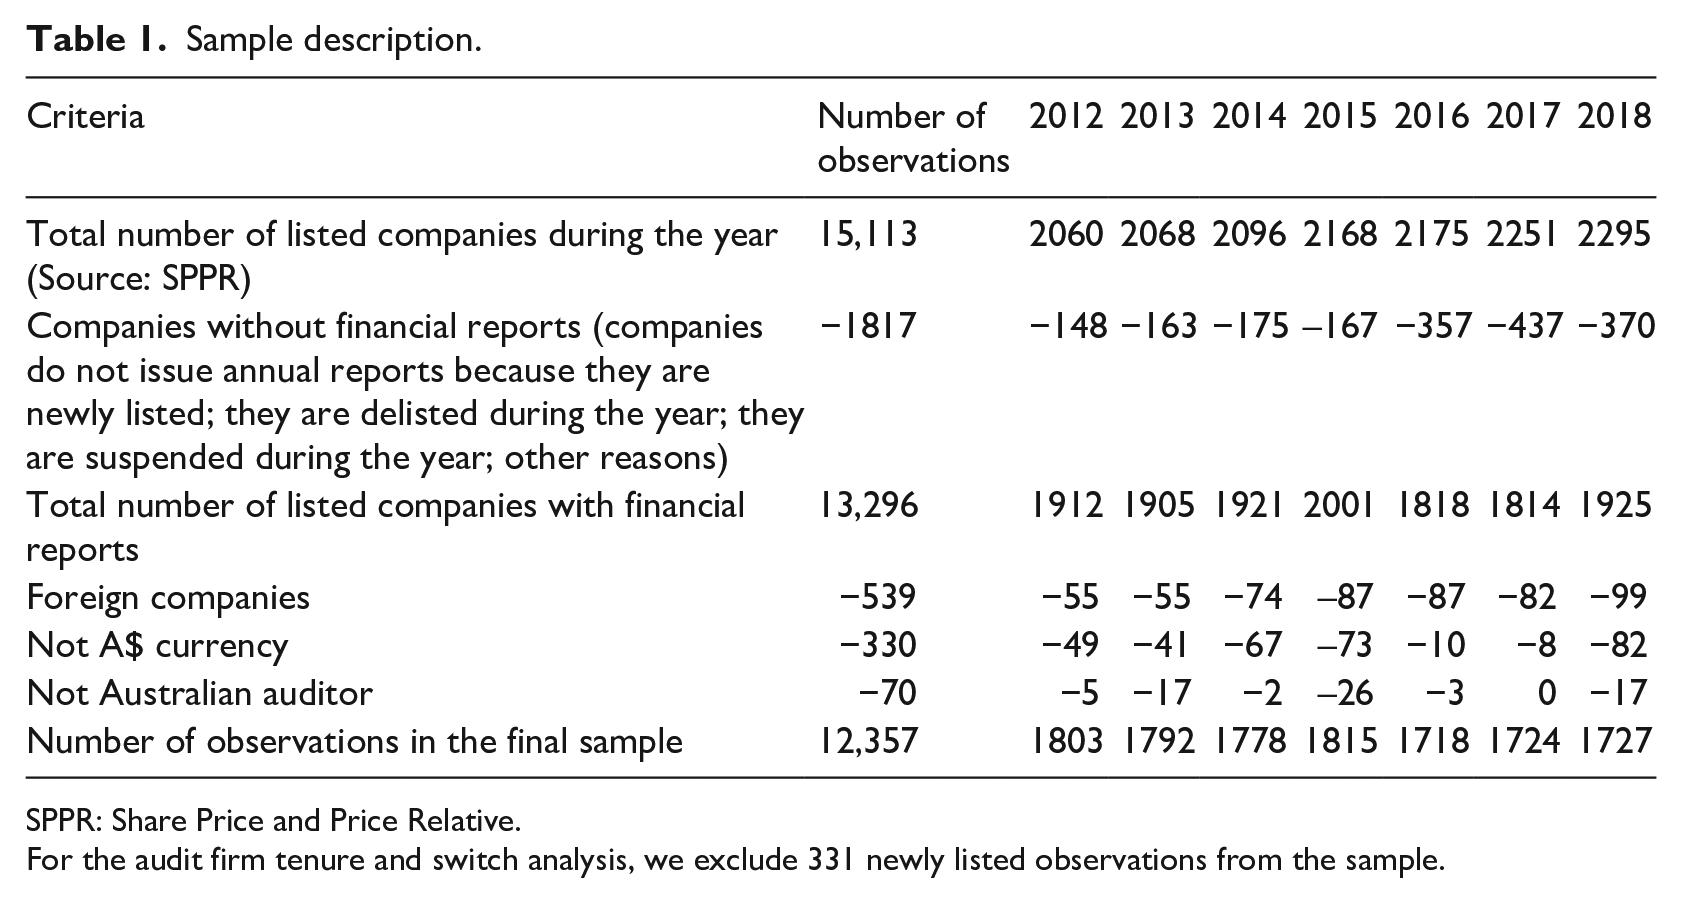
SPPR: Share Price and Price Relative.
For the audit firm tenure and switch analysis, we exclude 331 newly listed observations from the sample.
3. Audit market competition
In this section, we analyse the overall audit market concentration using the Herfindahl–Hirschman Index (HHI). We then break down the market by audit firm size to identify the key players, followed by further splitting the market by client size to investigate the concentration level for each client segment. We then discuss research opportunities.
3.1. Herfindahl–Hirschman Indices
To gain insights into the competitiveness of a market, regulators often focus on metrics such as the HHI. 7 The HHI is the sum of the squares of the audit activities (e.g. audit fees) of each firm in the market and is calculated as HHI = ∑n i = 1 (audit firm market share × 100). 2
The HHI assesses the level of competition of a market considering the relative size of the players. A higher HHI indicates a less competitive market due to relative unevenness of the market shares of large versus small players in the market, indicating a less competitive market. For example, a market with four large providers with 25% of the market each will result in an HHI of (25) 2 + (25) 2 + (25) 2 + (25) 2 = 2500, whereas a market with 25 small providers with 4% of market share each will result in an HHI of 25×42 = 400. In the Australian context, a threshold of 2000 or an increase of more than 100 raises regulatory concerns (Australian Competition and Consumer Commission (ACCC), 2008).
Table 2 shows the HHI of the entire Australian audit market for listed firms and for each client segment over the period 2012–2018. The HHI is calculated based on audit fees and the number of clients. Using audit fees, the HHI indicates that the Australian audit market is highly concentrated, increasing from 2162 in 2012 to a maximum of 2218 in 2014 and declining to 1967 in 2018. This points to a slight reduction in concentration in the audit market over this period: the HHI in 2018 is just under 2000, the regulatory threshold of concern (ACCC, 2008). Based on the number of clients, the HHI shows a maximum of 779 in 2013 and declines steadily to 722 in 2018, indicating a considerably less concentrated market.
Herfindahl–Hirschman Indices.
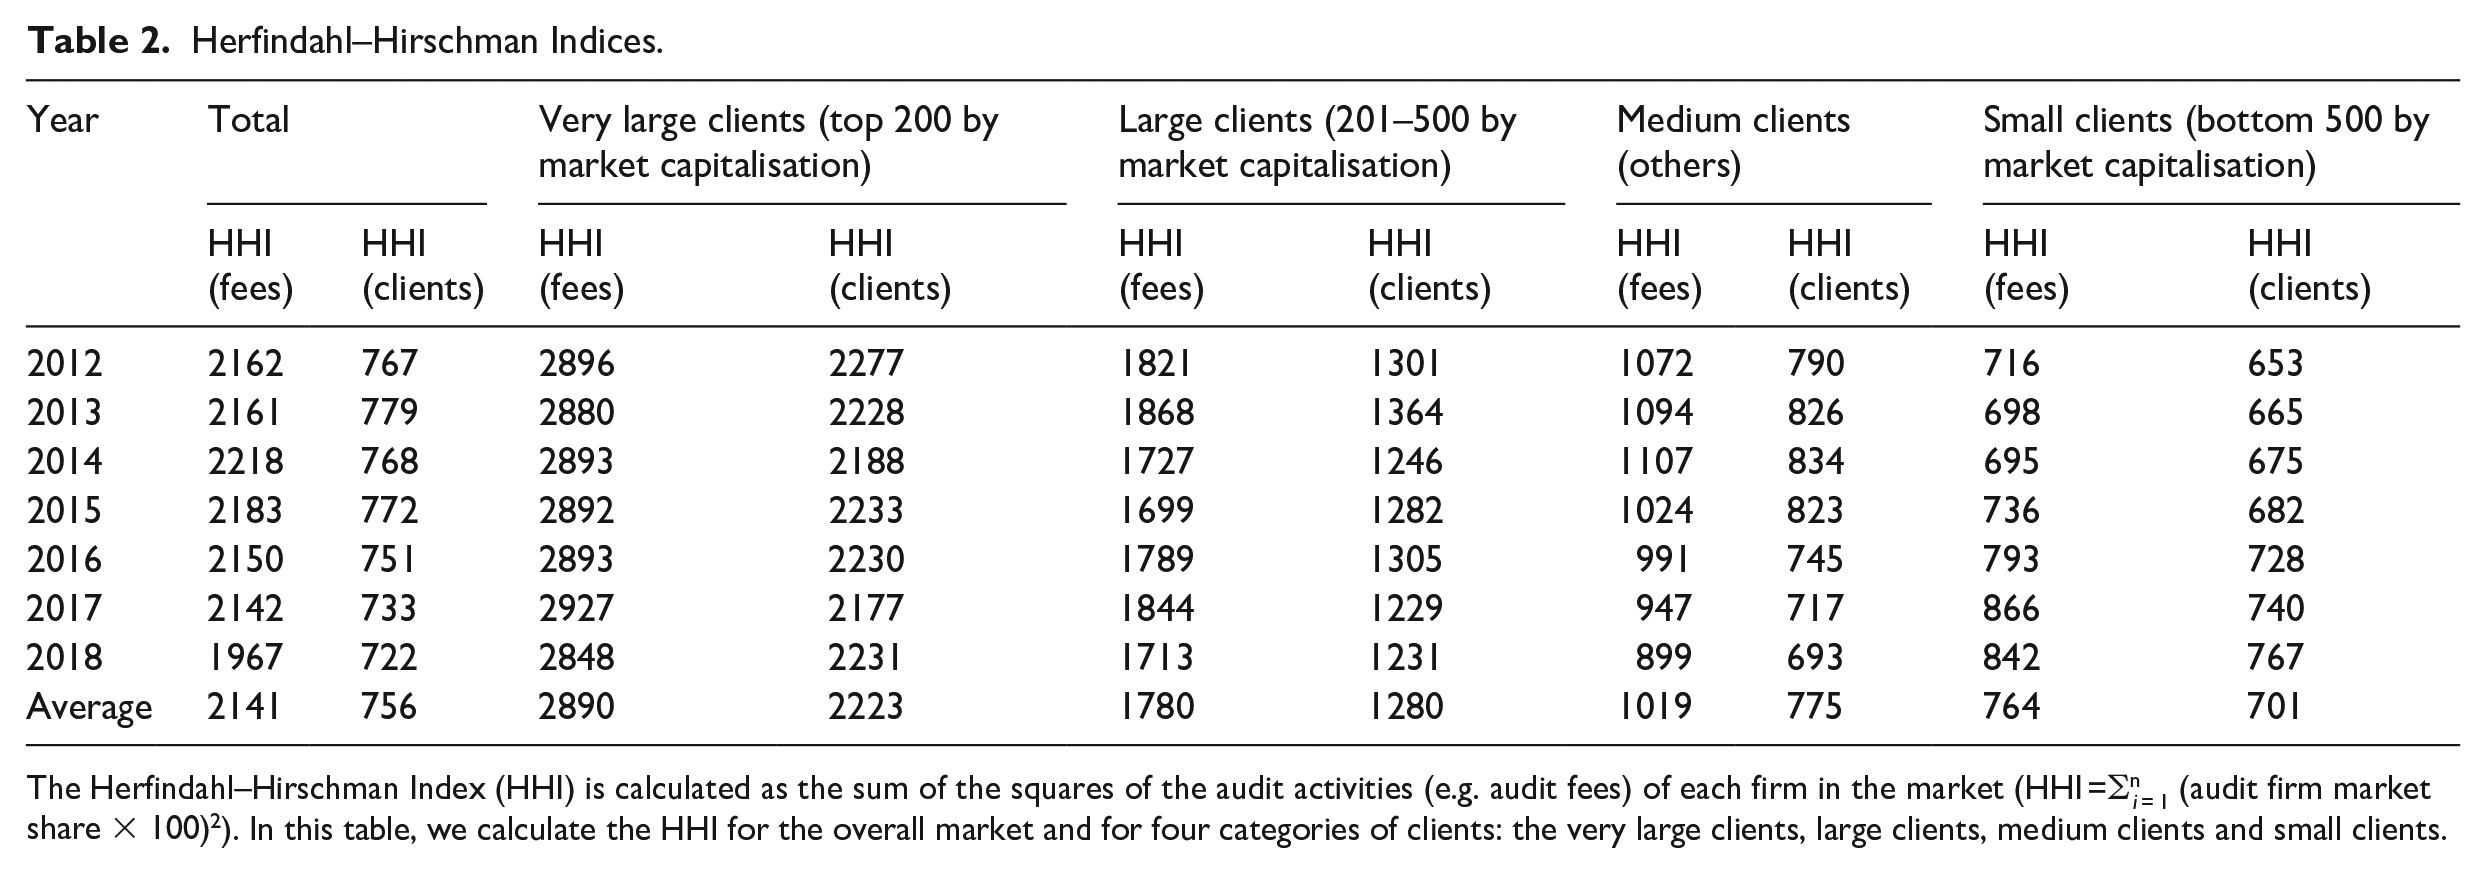
The Herfindahl–Hirschman Index (HHI) is calculated as the sum of the squares of the audit activities (e.g. audit fees) of each firm in the market (HHI =∑n i = 1 (audit firm market share × 100) 2 ). In this table, we calculate the HHI for the overall market and for four categories of clients: the very large clients, large clients, medium clients and small clients.
Table 2 further shows HHIs for four client segments by market capitalisation: the largest 200 clients (‘very large clients’), the next largest 300 clients (201–500 by market capitalisation, ‘large clients’), the smallest 500 clients (‘small clients’) and the remaining clients (‘medium clients’). 8 The audit market for the very large clients has an HHI consistently above 2000 with an average HHI based on audit fees (number of clients) of 2890 (2223). For the large clients, while both HHIs are below the threshold of 2000, the HHI based on audit fees (number of clients) is on average 1780 (1280) and relatively close (distant) to the threshold of 2000. In the medium client segment, the HHI based on audit fees (number of clients) is on average 1,019 (775) and shows a decreasing trend over time. For the small client segment, the HHI is consistently below 900 for both measures, but increases slightly over the sample period.
Overall, the descriptive evidence in this section suggests that (1) the overall audit market concentration based on audit fees (number of clients) is above (below) the ACCC threshold for a highly concentrated market and (2) the audit market concentration differs across various client market segments, and is especially high in the very large client segment.
3.2. Audit market share
To understand the level of market concentration better, this section identifies key players in the audit market for listed firms. Table 3 shows the market share, based on number of clients and audit fees, for four types of audit firms: Big 4, Large Non-Big 4 (BDO and Grant Thornton), Medium Non-Big 4 and Small Non-Big 4. 9 The average total audit fees paid by Australian listed companies are $531.8 million which is an average of 0.65% of clients’ total assets. 10 On average, Big 4 audit firms audit just under 40% of all listed companies in Australia but receive 87.3% of total audit fees, which is an average of 0.35% of their client’s assets. 11 While the proportion of listed clients audited by Big 4 firms is lower than that in the United States (70%) and in the United Kingdom (84%; Competition and Markets Authority (CMA), 2019), the market share by audit fees remains substantial. 12 In contrast, Non-Big 4 firms audit an average of 60.1% of listed clients, but only receive 13.7% of audit fees on average, and earn a higher fraction of total assets as audit fees (0.75% or higher). Overall, Big 4 firms tend to audit larger clients, and their audit fees represent a lower proportion of clients’ total assets compared to Non-Big 4 firms.
Audit market share by audit firm type.
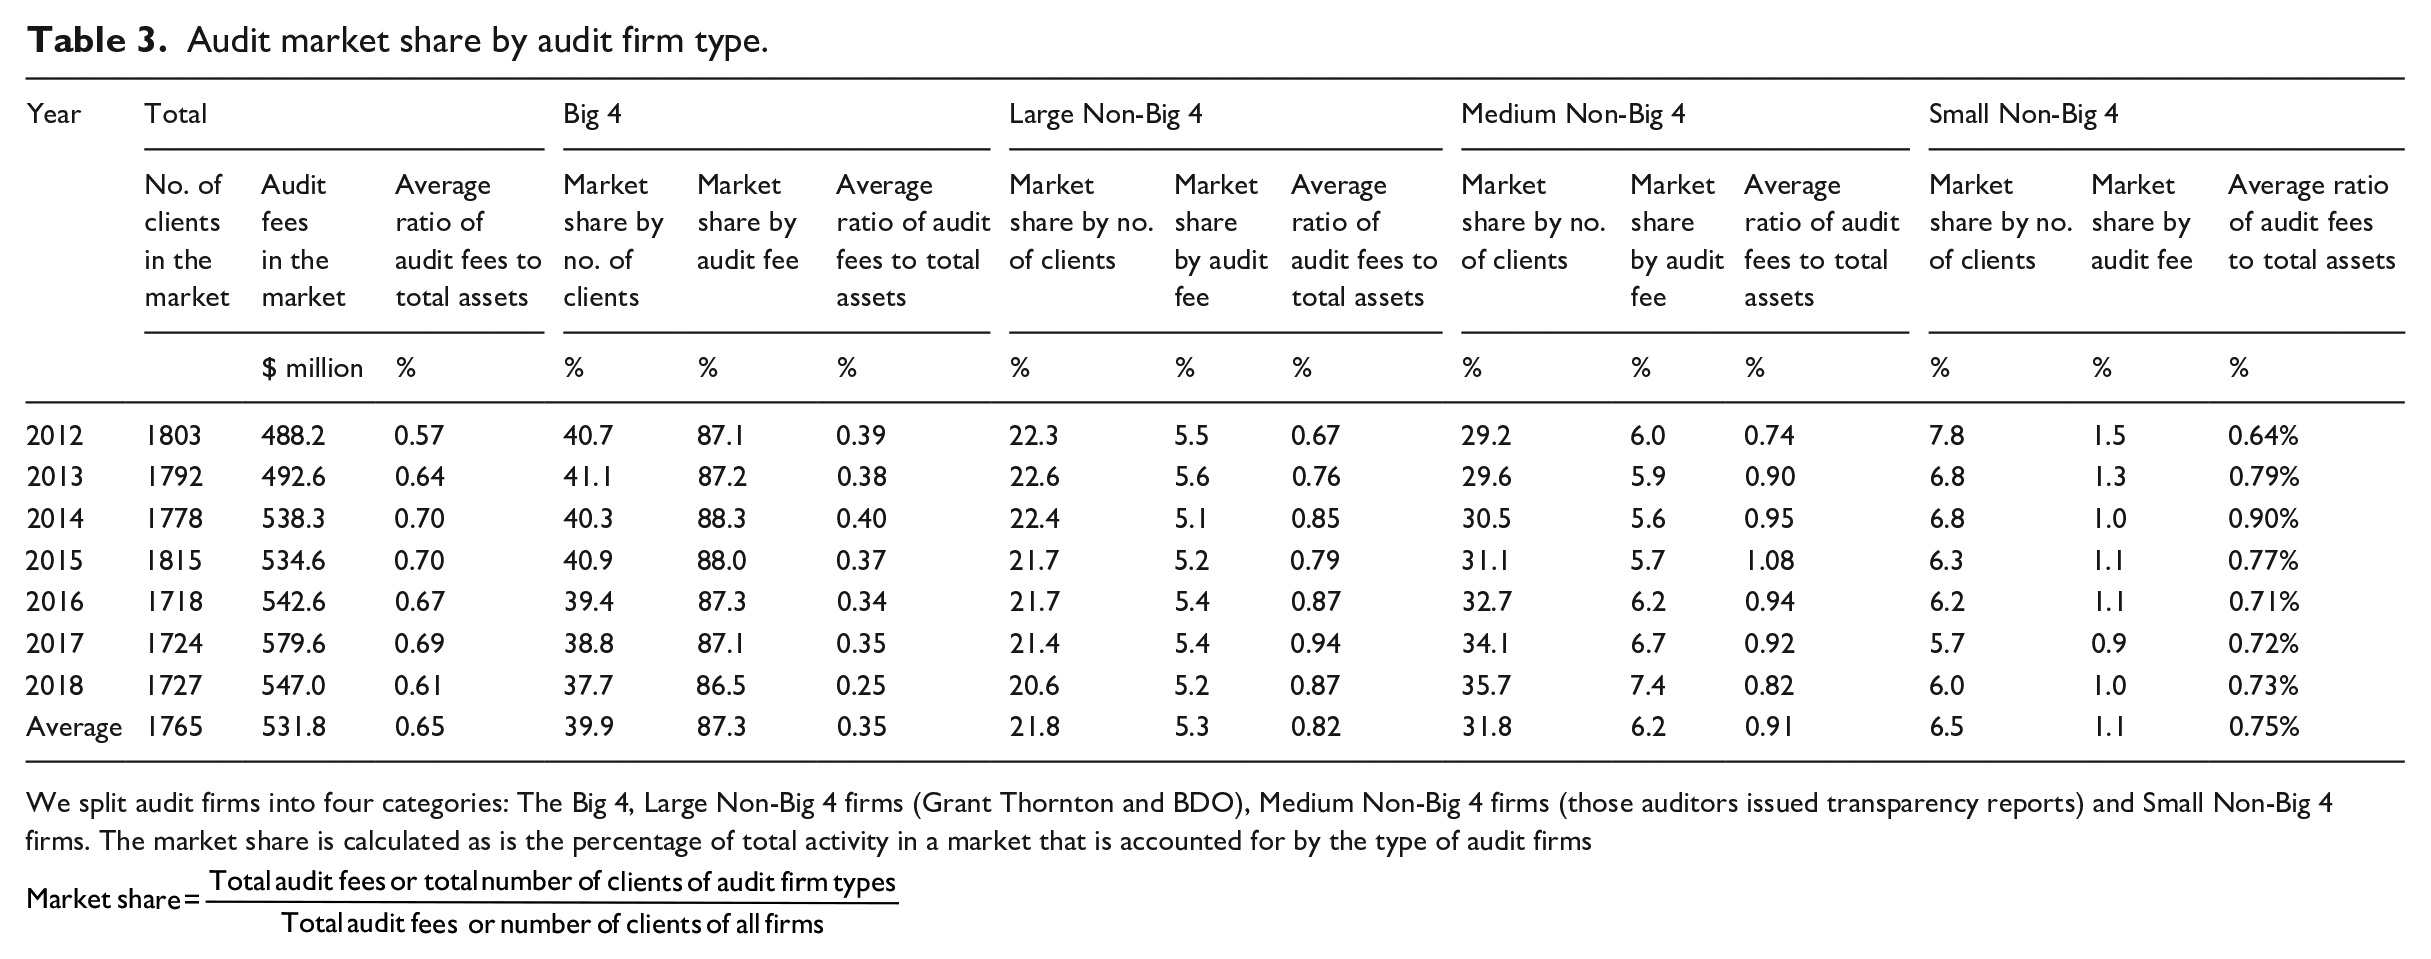
We split audit firms into four categories: The Big 4, Large Non-Big 4 firms (Grant Thornton and BDO), Medium Non-Big 4 firms (those auditors issued transparency reports) and Small Non-Big 4 firms. The market share is calculated as is the percentage of total activity in a market that is accounted for by the type of audit firms
We also observe that market shares by number of clients and audit fees, are relatively stable over this period. Of the four types of audit firms, only the Medium Non-Big 4 firms increased their market share slightly over this period in terms of number of clients and audit fees. The average ratio of audit fees to total assets has varied over the sample period for all types of audit firms, but without following a clear trend.
3.3. Audit market share by client segment and audit firm type
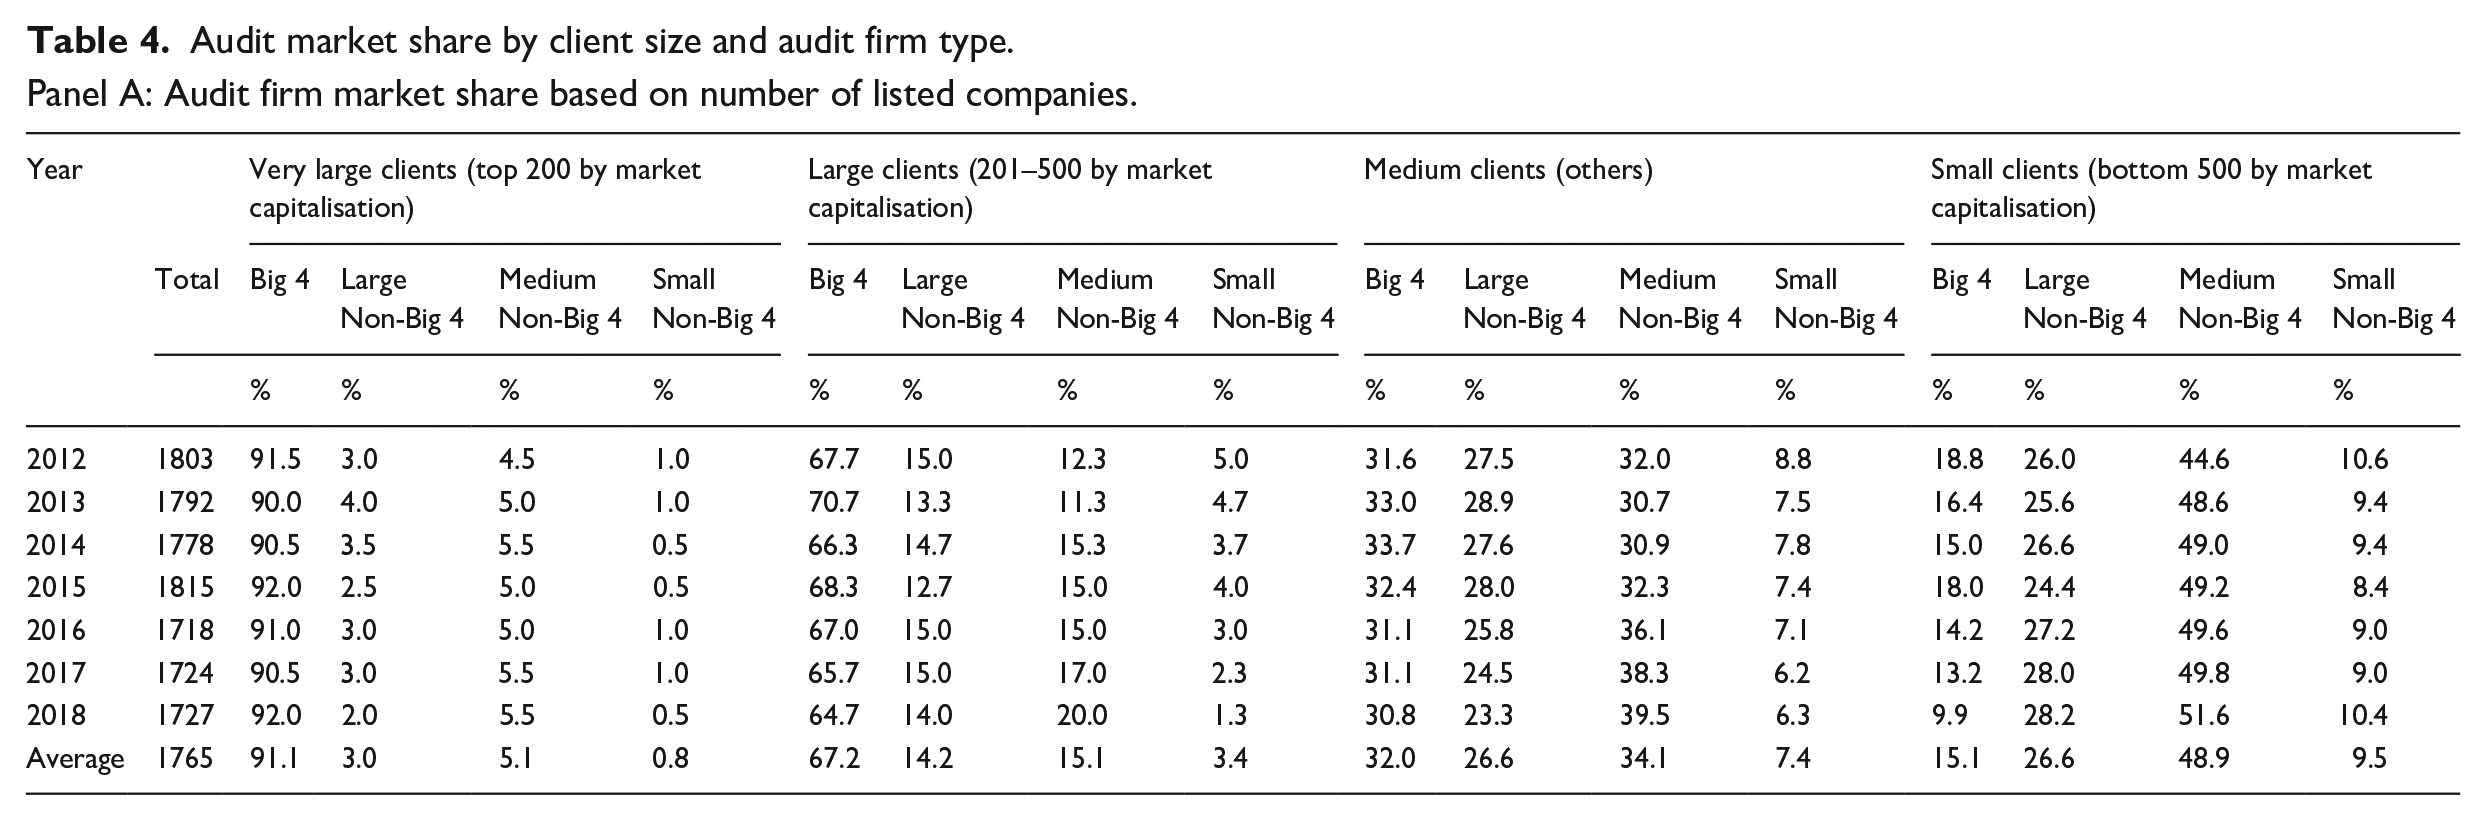
In Section 3.1, we find the audit market is highly concentrated in the largest client segment, but less concentrated in other client market segments. To identify the key players in each client segment and their role in market concentration, we report the audit market by client segments and audit firm type. We report the market shares based on number of clients in Table 4 Panel A, and the market shares based on audit fees in Table 4 Panel B.
Audit market share by client size and audit firm type.
Panel A: Audit firm market share based on number of listed companies.
Panel B: Audit firm market share based on audit fees.
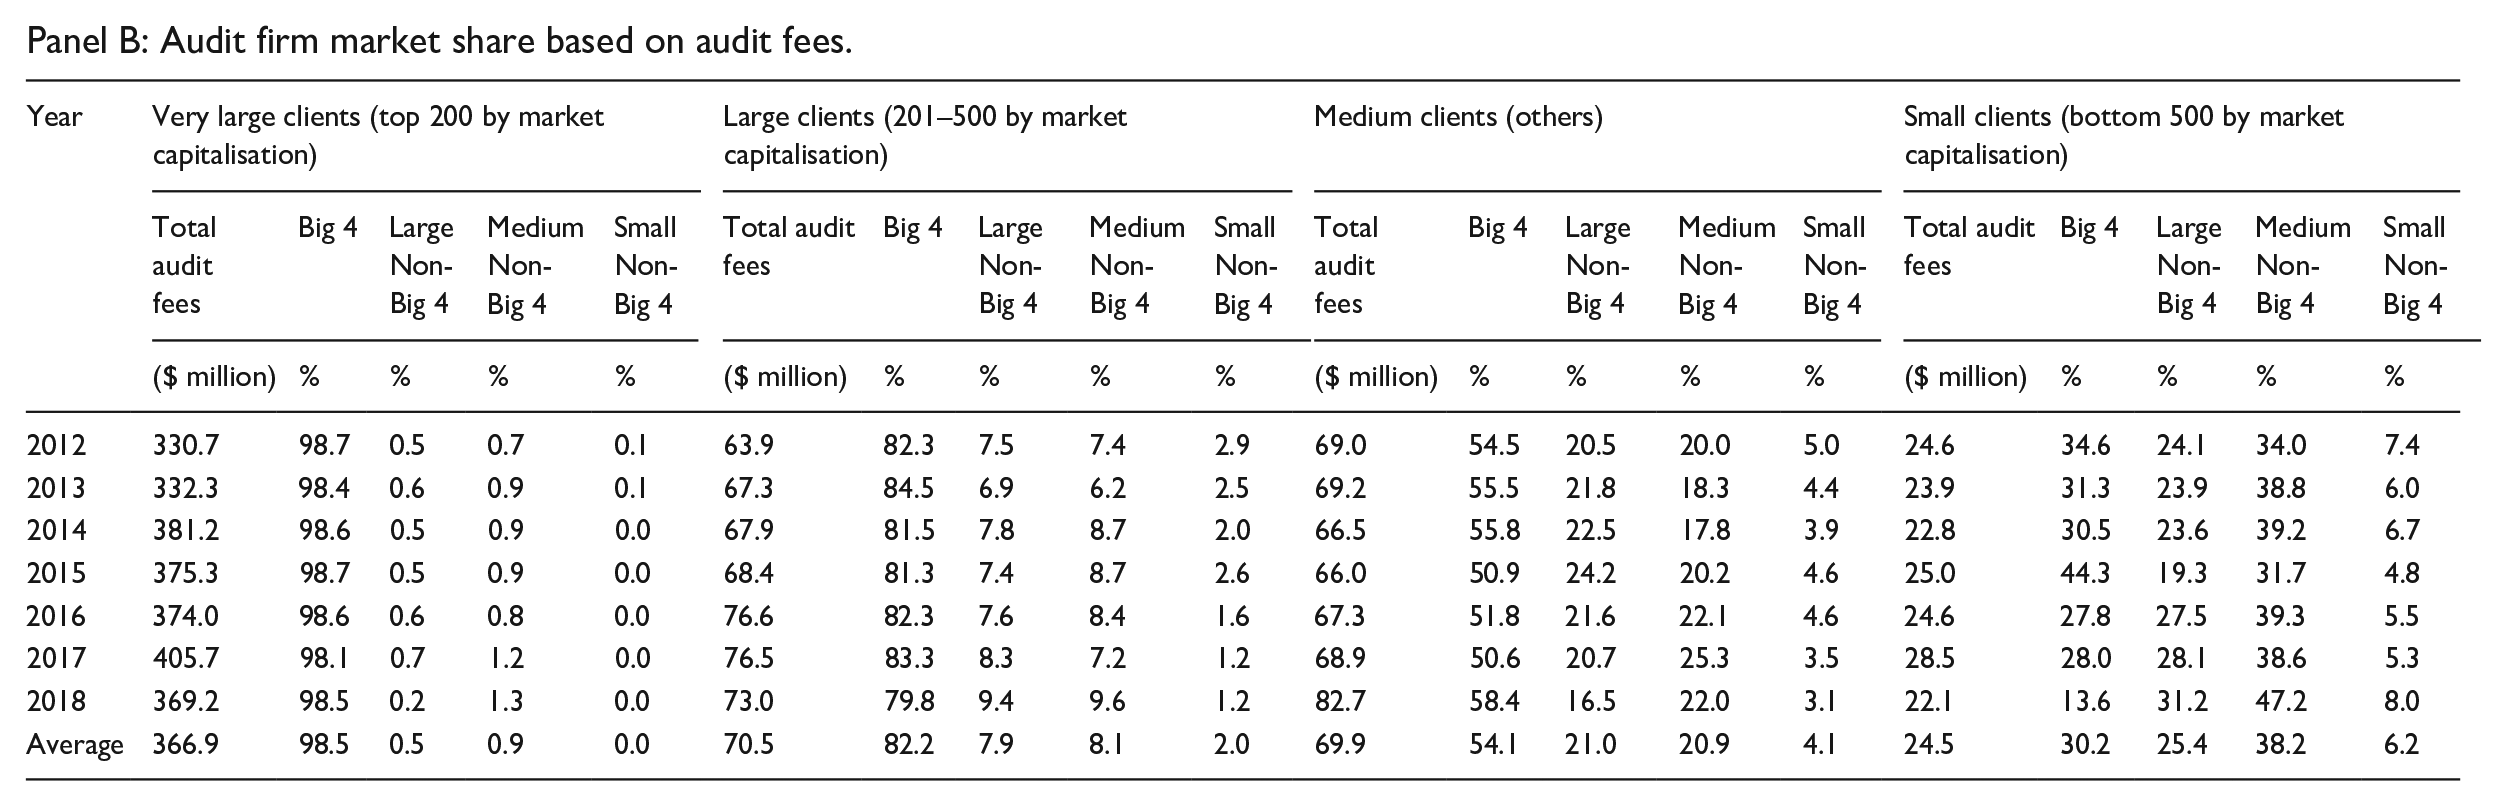
Table 4 Panels A and B shows Big 4 firms’ market share in each of the four client segments. The Big 4 firms clearly dominate the very large client segment, where they audit just over 90% of clients and collect just over 98% of the audit fees. This is unsurprising as the largest clients tend to have complex organisational structures, overseas operations, and therefore require auditors with sufficient resources and a global network (Carson et al., 2022). In addition, the Big 4 firms audit about two-thirds of the next largest group of clients and receive 82.2% of total audit fees in this market segment, with the remainder shared equally between the Large and Medium Non-Big 4 firms. The Big 4 firms audit only 32.0% of medium clients (15.1% of small clients) but earn an average of 54.1% of audit fees (30.2% of audit fees of the small client segment), suggesting a focus on the larger end of the medium/small client segments. In addition, the Big 4 firms lose a substantial market share in the small client segment over the period (8.9% in terms of clients, and 21.0% in terms of audit fees), suggesting a decreasing focus of the Big 4 firms in this segment. 13
In contrast, the Non-Big 4 firms receive most of their audit fee revenues from the medium and small clients: 73.7% of the total audit fees of the Large Non-Big 4 firms, 72.4% of the total audit fees of the Medium Non-Big 4 firms and 74.3% of the total audit fees of the Small Non-Big 4 firms are from the medium and small clients. To summarise, the audit market is segmented by client size, with the Big 4 firms serving most of the large clients and the non- Big 4 firms servicing mainly the small and medium-sized clients.
In conclusion, the analyses in Section 3 indicate that while the Australian audit market for listed clients may not appear concentrated based on number of clients, it appears highly concentrated if measured based on audit fees. Further analyses show that the audit market is highly segmented. The Big 4 firms dominate the largest client segment, where they audit more than 90% of the largest clients, collect over 98% of total audit fees, reflecting high market concentration, which may attract regulatory concerns. In addition, Big 4 firms have a higher market share than Non-Big 4 firms in the large client segment (both based on audit fees and the number of clients), and audit the larger end of the medium and small client segments. In contrast, Non-Big 4 auditors concentrate on small and medium clients, with over 70% of their total audit fees from the small and medium client segments.
3.4. Opportunities for research on the Australian audit market
Based on the observations in the prior sections, one research opportunity is related to better understanding the impact of audit market concentration on audit pricing and quality, considering the differences across client segments and audit firm types as discussed in the prior sections. First, we observe that Big 4 auditors have lower market share in the small client segment. This opens up a unique research opportunity on whether audit quality changes when client firms switch from Big 4 firms to Non-Big 4 firms in this client segment. Second, the change in market shares of the different types of firms in the medium and small client segment raises questions on whether audit firms compete on lower audit fees rather than higher audit quality (Pearson and Trompeter, 1994; van Raak et al., 2020). Competitive pricing could encourage the supplier of a credence good to under-audit their clients compared to a situation in which market players cannot compete on price, resulting in lower audit quality (Mimra et al., 2016).
The second research opportunity relates to understanding how the regulatory activities have and will affect the Australian audit market in the future. Since the audit market is segmented, it is important to consider how regulation could affect different market segments, and whether regulation targeted at a specific market segment can have unintended consequences for other segments. From our analyses, it emerges that the smallest audit firms experienced an overall decline in their market share. One specific research question is whether more regulation, such as ASIC’s audit inspection programme or mandatory partner rotation, affects smaller auditors disproportionately resulting in their exit from the audit market of listed clients (DeFond and Lennox, 2011).
Moreover, research on local geographic markets in Australia is warranted. While this article focuses on the national audit market for listed companies, there is an opportunity to understand local geographic markets (e.g. in Sydney, Melbourne and Perth), given the concentration of economic activities in certain capital cities (Ferguson et al., 2014). Prior research has investigated the impact of auditor industry specialisation on Australian local geographic markets (Ferguson et al., 2003, 2014). Future research can explore the effect of audit market shares and concentration at the local level.
Finally, while this article exclusively focuses on the listed client market, it is also important to understand the dynamics of the audit market for other types of clients, including private companies and not-for-profit organisations, which represent most entities audited in Australia (Carey et al., 2014; Potter et al., 2019; Yang and Simnett, 2020).
4. Provision of NAS
Since the high-profile corporate collapses in the early 2000s, including Enron and WorldCom in the United States and HIH in Australia, provision of NAS to audit clients and its potential effect on auditor independence have become an ongoing concern for regulators worldwide (Accounting Professional and Ethical Standards Board (APESB), 2018; European Parliament, 2014). In Australia, the provision of certain NAS has been prohibited for listed audit clients. 14 The inquiry into regulation of auditing in Australia resulted in additional recommendations related to prohibiting and disclosing NAS (recommendation 3); related to the auditor providing a confirmation in their independence declaration that no prohibited NAS was provided (recommendations 4); and related to revising APES 110 Code of Ethics to ensure that auditors are not incentivised for selling non-audited services (recommendation 5) to ensure that auditor independence is not compromised by selling NAS (Parliamentary Joint Committee on Corporations and Financial Services, 2020a, 2020b). In this section, we provide a comprehensive survey of the Australian NAS market from 2012 to 2018, including the market share of auditor-provided NAS for listed companies, the importance of auditor-provided NAS relative to audit fees for listed companies, and finally the importance of NAS fees in Big 4 accounting firms’ total revenue. This is followed by a discussion of future research opportunities related to NAS in Australia.
4.1. Market share of auditor-provided NAS
This section analyses the market of NAS provided by auditors to their audit clients. 15 Table 5 Panel A shows that the total NAS purchased by Australian listed companies from their current auditor is $183 million in 2012, declines to $162 million in 2014 and grows to $172 million by 2018. The table further shows the amount and percentage of auditor-provided NAS by firm type, and the average ratio of NAS fees to total client assets. 16 Over the period 2012–2018, the total NAS fees paid to Big 4 firms are on average $158.4 million, which represents 90.6% of the total NAS market of audit clients. For clients of the Big 4 firms, the NAS fees paid to their auditors are 0.12% of total assets, which is relatively high compared to the average ratio of audit fees to total assets (0.35%) reported in Table 3. The Large Non-Big 4 firms receive average total NAS fees of $8.5 million per year, representing 4.8% of the total NAS market from audit clients. The average NAS fees to Large Non-Big 4 firms represent an average of 0.27% of clients’ total assets. The Medium Non-Big 4 firms receive an average of $7 million in total NAS fees per year, representing around 4.0% of the audit NAS market. They also report an average of 0.37% of NAS fees to clients’ total assets. Small Non-Big 4 firms have a negligible share of this market and receive an average of $0.6 million per year, representing an average of 0.21% of clients’ total assets. 17 Overall, the Big 4 firms dominate the market of auditor-provided NAS, with 90.6% of NAS being provided by this group of auditors.
Market share of NAS fees from audit clients.
Panel A: Market share of NAS fees from audit clients by audit firm type.
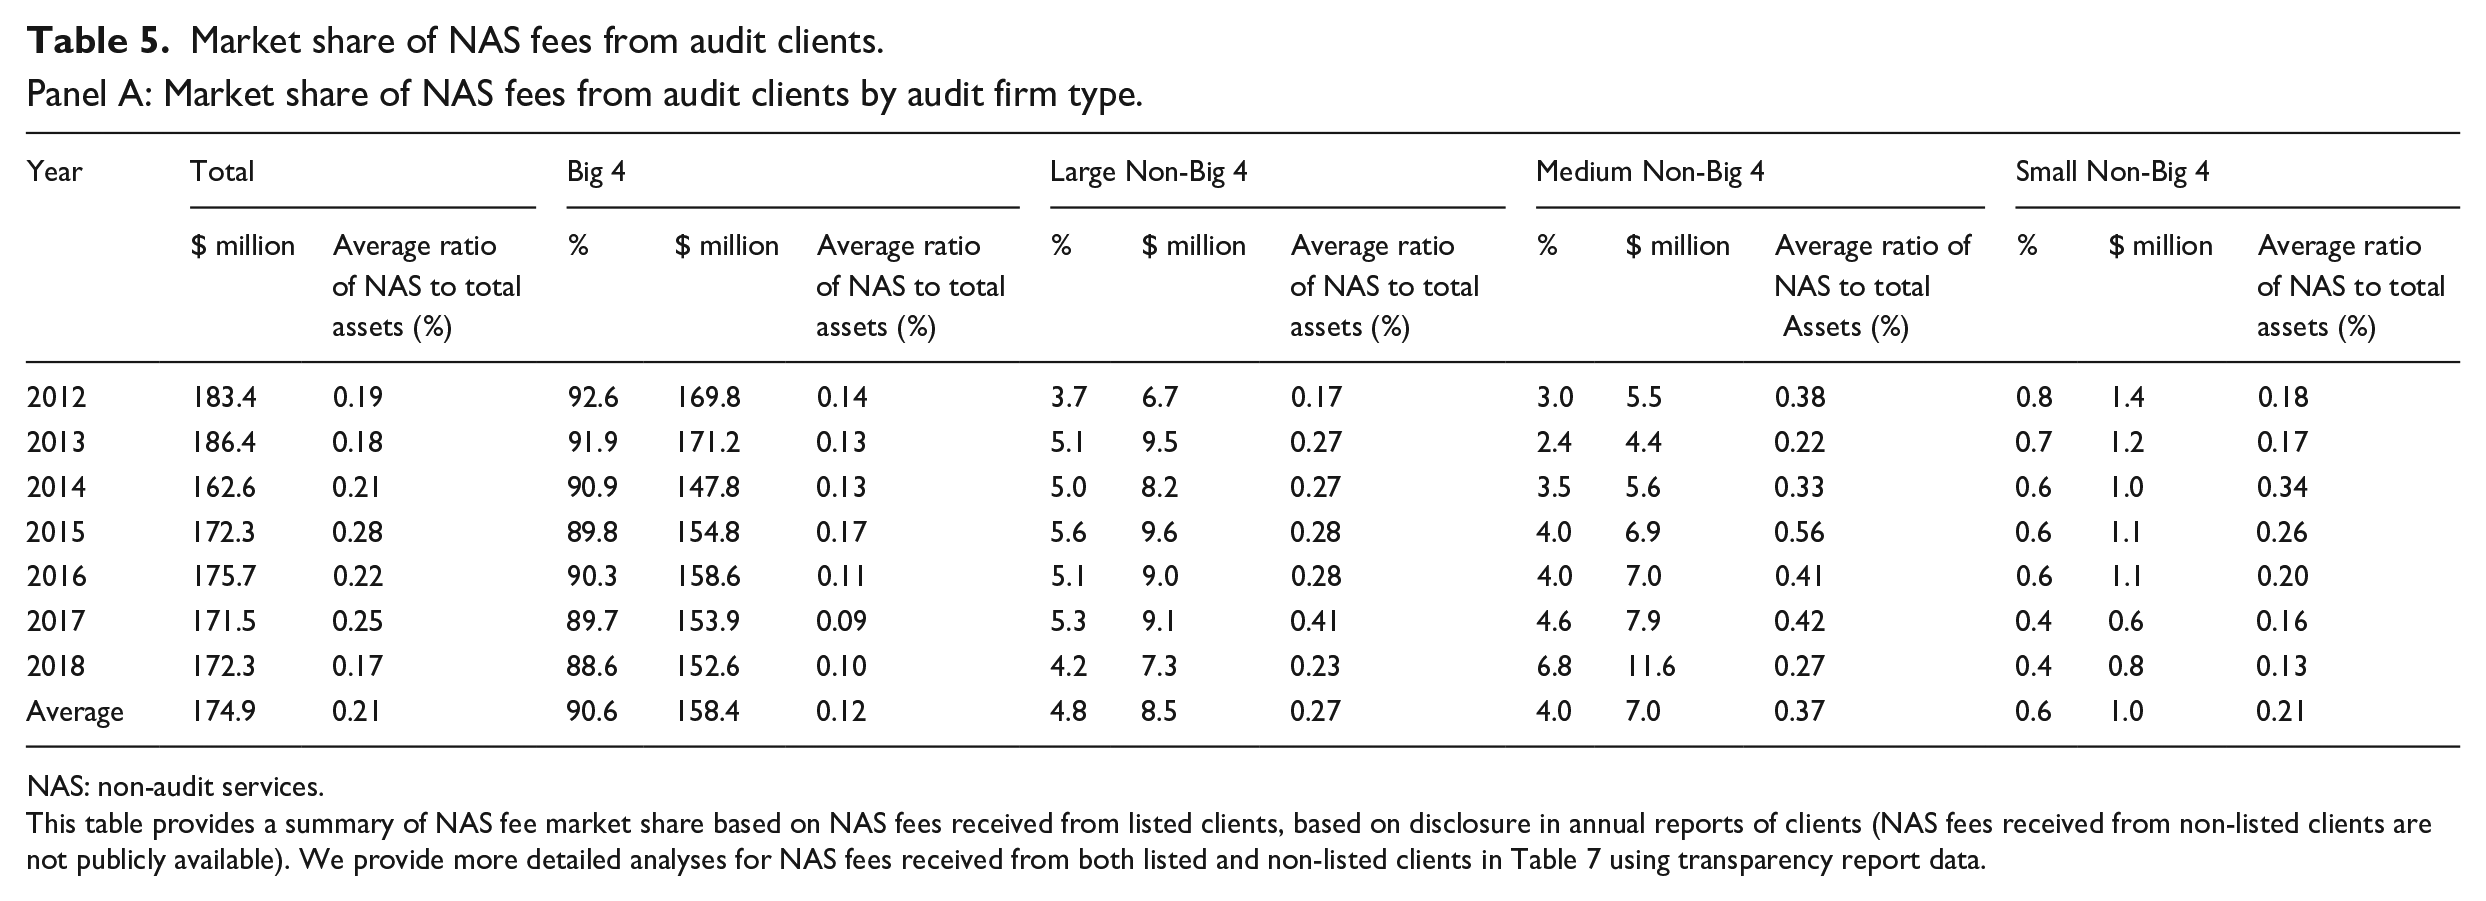
NAS: non-audit services.
This table provides a summary of NAS fee market share based on NAS fees received from listed clients, based on disclosure in annual reports of clients (NAS fees received from non-listed clients are not publicly available). We provide more detailed analyses for NAS fees received from both listed and non-listed clients in Table 7 using transparency report data.
Panel B: Market share of NAS fees from audit clients by client size.
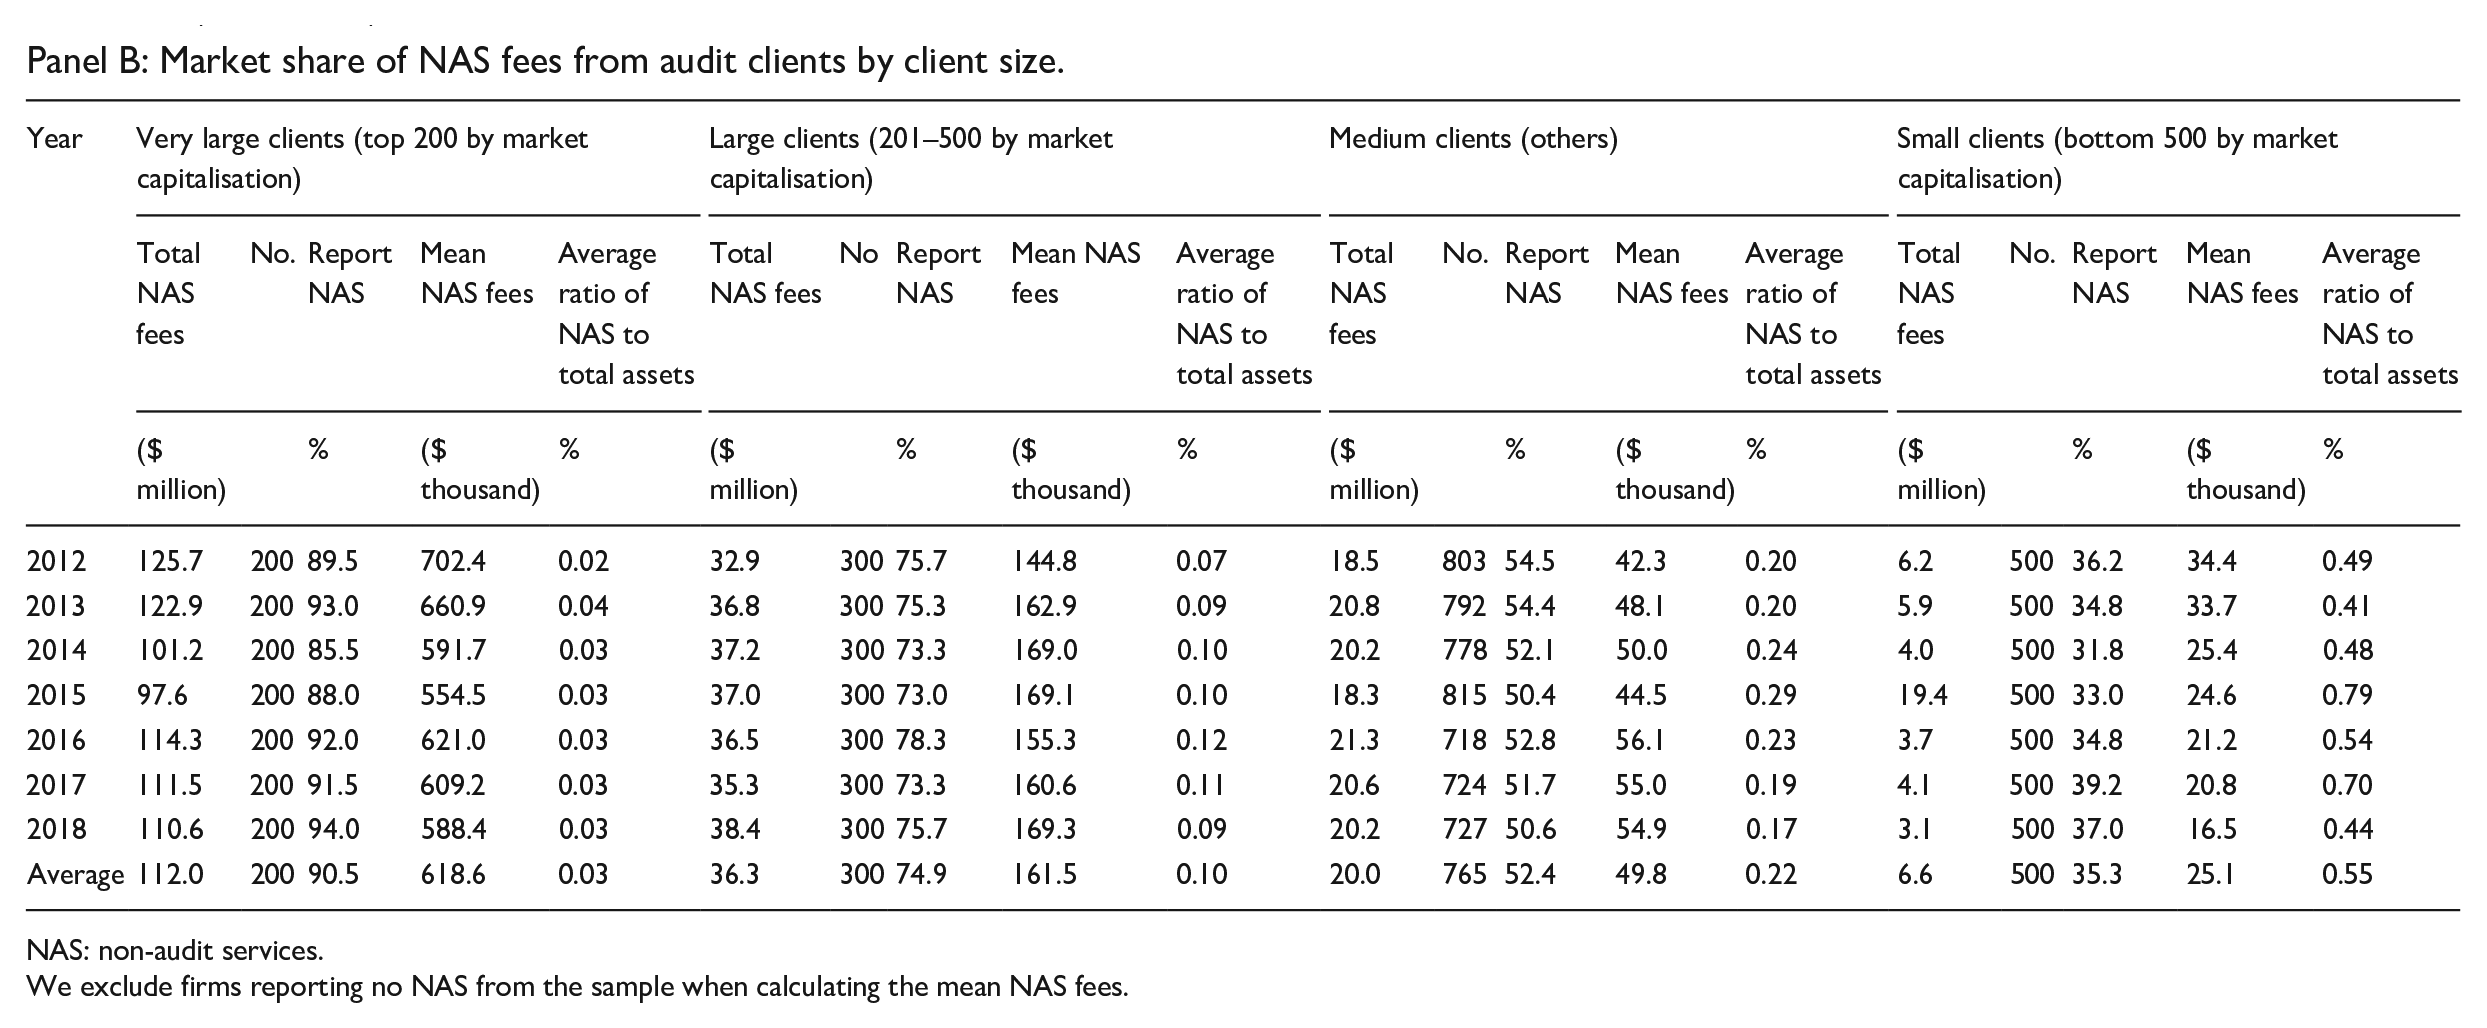
NAS: non-audit services.
We exclude firms reporting no NAS from the sample when calculating the mean NAS fees.
In Table 5 Panel B, we analyse auditor-provided NAS fees by client segment. On average, 90.5% of the largest clients purchase NAS from their auditors, increasing from 85.5% in 2014 to 94.0% in 2018. However, the average amount spent on NAS (around $619,000) has declined over the time period, while the average NAS fees to clients’ total assets has been stable at around 0.03% on average. For the next largest group of clients, approximately three-quarters purchase NAS from their auditors with an average spend of around $160,000, which increased slightly over time and represents 0.10% of total assets on average. For medium clients, just over half purchase other services from their auditors averaging around $50,000, which increased over time and represents 0.22% of total assets on average. Two-thirds of the smallest clients do not purchase NAS from their auditors. For those clients that do, NAS fees are around $25,000 per year on average, which decreased steadily over time and represents 0.55% of total assets. This indicates that the purchase of other services from auditors is associated with client size, suggesting a higher demand for NAS from larger and more complex firms. However, on average, smaller firms that demand NAS pay a higher fee relative to their total assets.
4.2. Fees from audit clients: ratio of auditor-provided NAS fees to audit fees
An area of concern for regulators and investors is economically significant NAS relative to audit fees provided by auditors to their clients. Auditors could use audit service to ‘get in the door’ of key clients to sell additional NAS. This could make auditors economically dependent on a client’s NAS fees and impair auditor independence (DeFond et al., 2002).
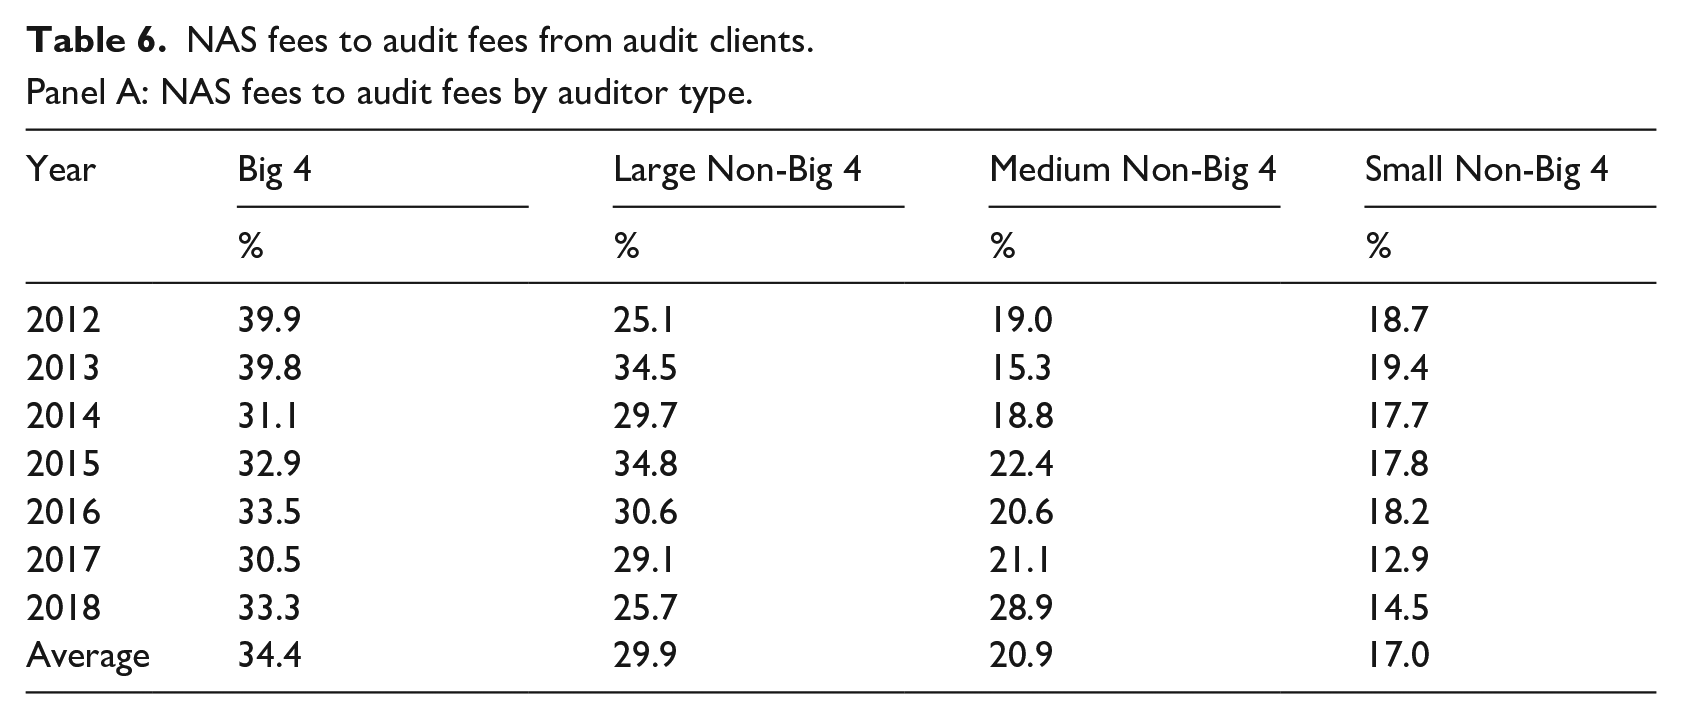
Table 6 Panel A analyses the relative importance of auditor-provided NAS fees to audit fees for listed audit clients by audit firm type. We find that the ratio of NAS fees to audit fees is highest for clients of Big 4 firms (an average of 34.4% relative to 29.9% for Large Non-Big 4, 20.9% for Medium Non-Big 4% and 17.0% for small Non-Big 4 firms). This is probably because Big 4 clients are large and complex and are more likely to demand complex NAS services from their auditors. We also show that Big 4 clients’ ratio of NAS fees to audit fees has declined slightly over the sample period from almost 39.9% in 2012 to 33.3% in 2018. This is lower than the levels documented in the United Kingdom, where this ratio has declined from 55% in 2011 to 38% in 2018 for Big 4 clients (CMA, 2019). This might be of interest to regulators given the constant scrutiny of auditor-provided NAS over the sample period. 18 This also demonstrates that the Australian NAS market is unique in this regard, and regulatory initiatives should be informed by local evidence.
NAS fees to audit fees from audit clients.Panel A: NAS fees to audit fees by auditor type.
Panel B: NAS fees to audit fees by client size.
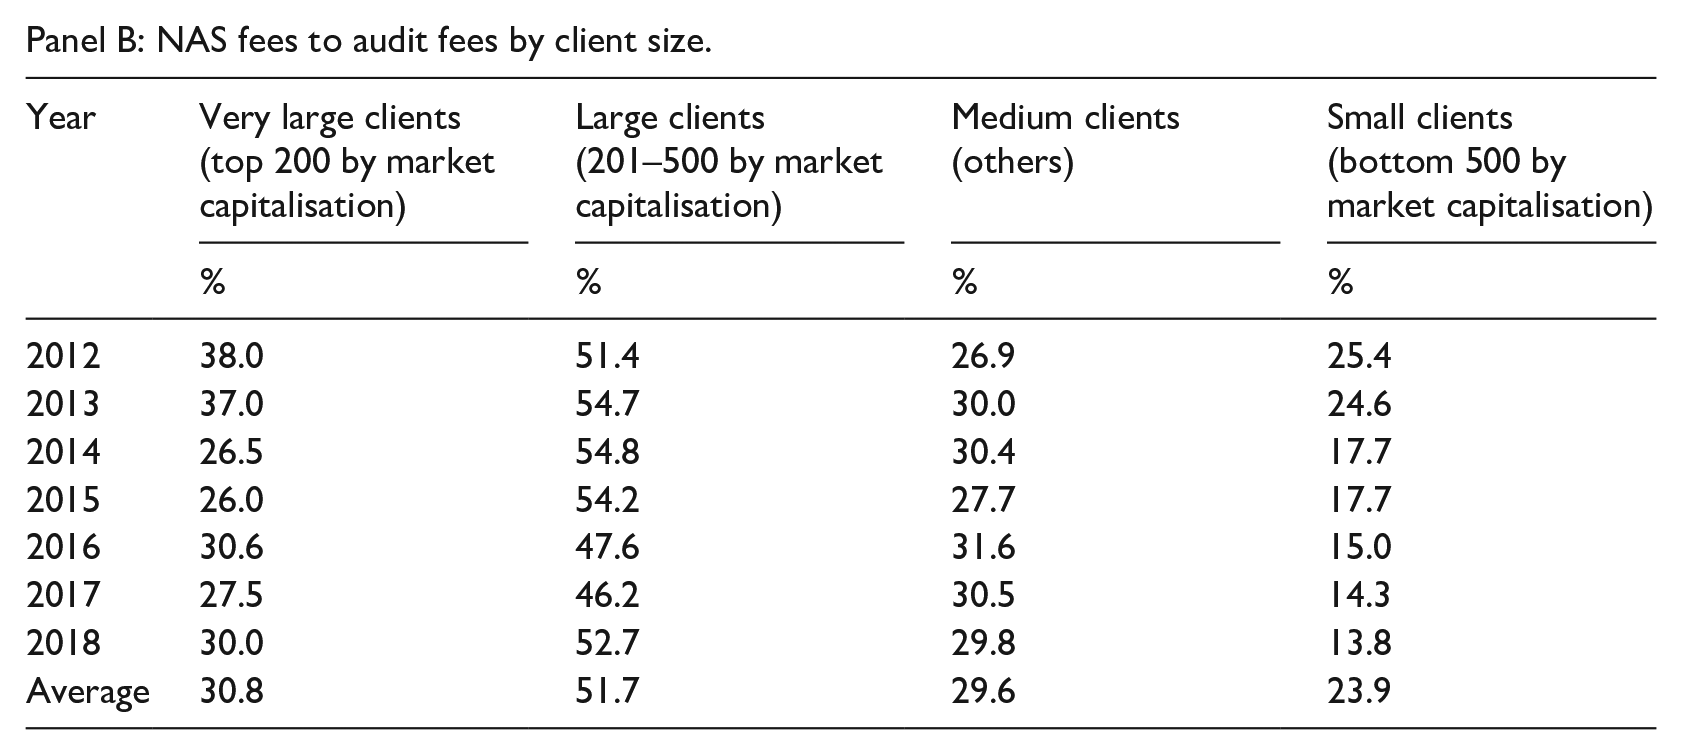
Table 6 Panel B analyses the ratio of auditor-provided NAS fees to audit fees by client segment. The auditor-provided NAS purchased by very large clients equals 30.8% of audit fees on average, declining from 38.0% to 30.0% over the period. Large clients have the highest ratio of the four client segments with an average ratio of 51.7%. Medium-sized clients have an average ratio of 29.6% and the smallest clients have low and declining ratios from 25.4% to 13.8% over the period. This suggests that the large clients, rather than the largest clients are purchasing high amounts of NAS relative to audit fees. If additional regulation is imposed by regulators, these large clients and their auditors would be most affected.
4.3. Total revenue composition in Big 4 accounting firms (transparency report data)
Since 2013, Australian accounting firms have been required to prepare transparency reports if they audit 10 or more ‘significant entities’. 19 Among other information, transparency reports provide information on total firm revenue and its composition, including audit fees, NAS fees from audit clients and NAS fees from non-audit clients (e.g. revenue from services such as consulting and tax). 20 This allows us to investigate (1) the importance of total NAS fees from both audit and non-audit clients, relative to total firm revenue from all sources and (2) the importance of auditor-provided NAS fees to total NAS fees from both audit and non-audit clients. 21
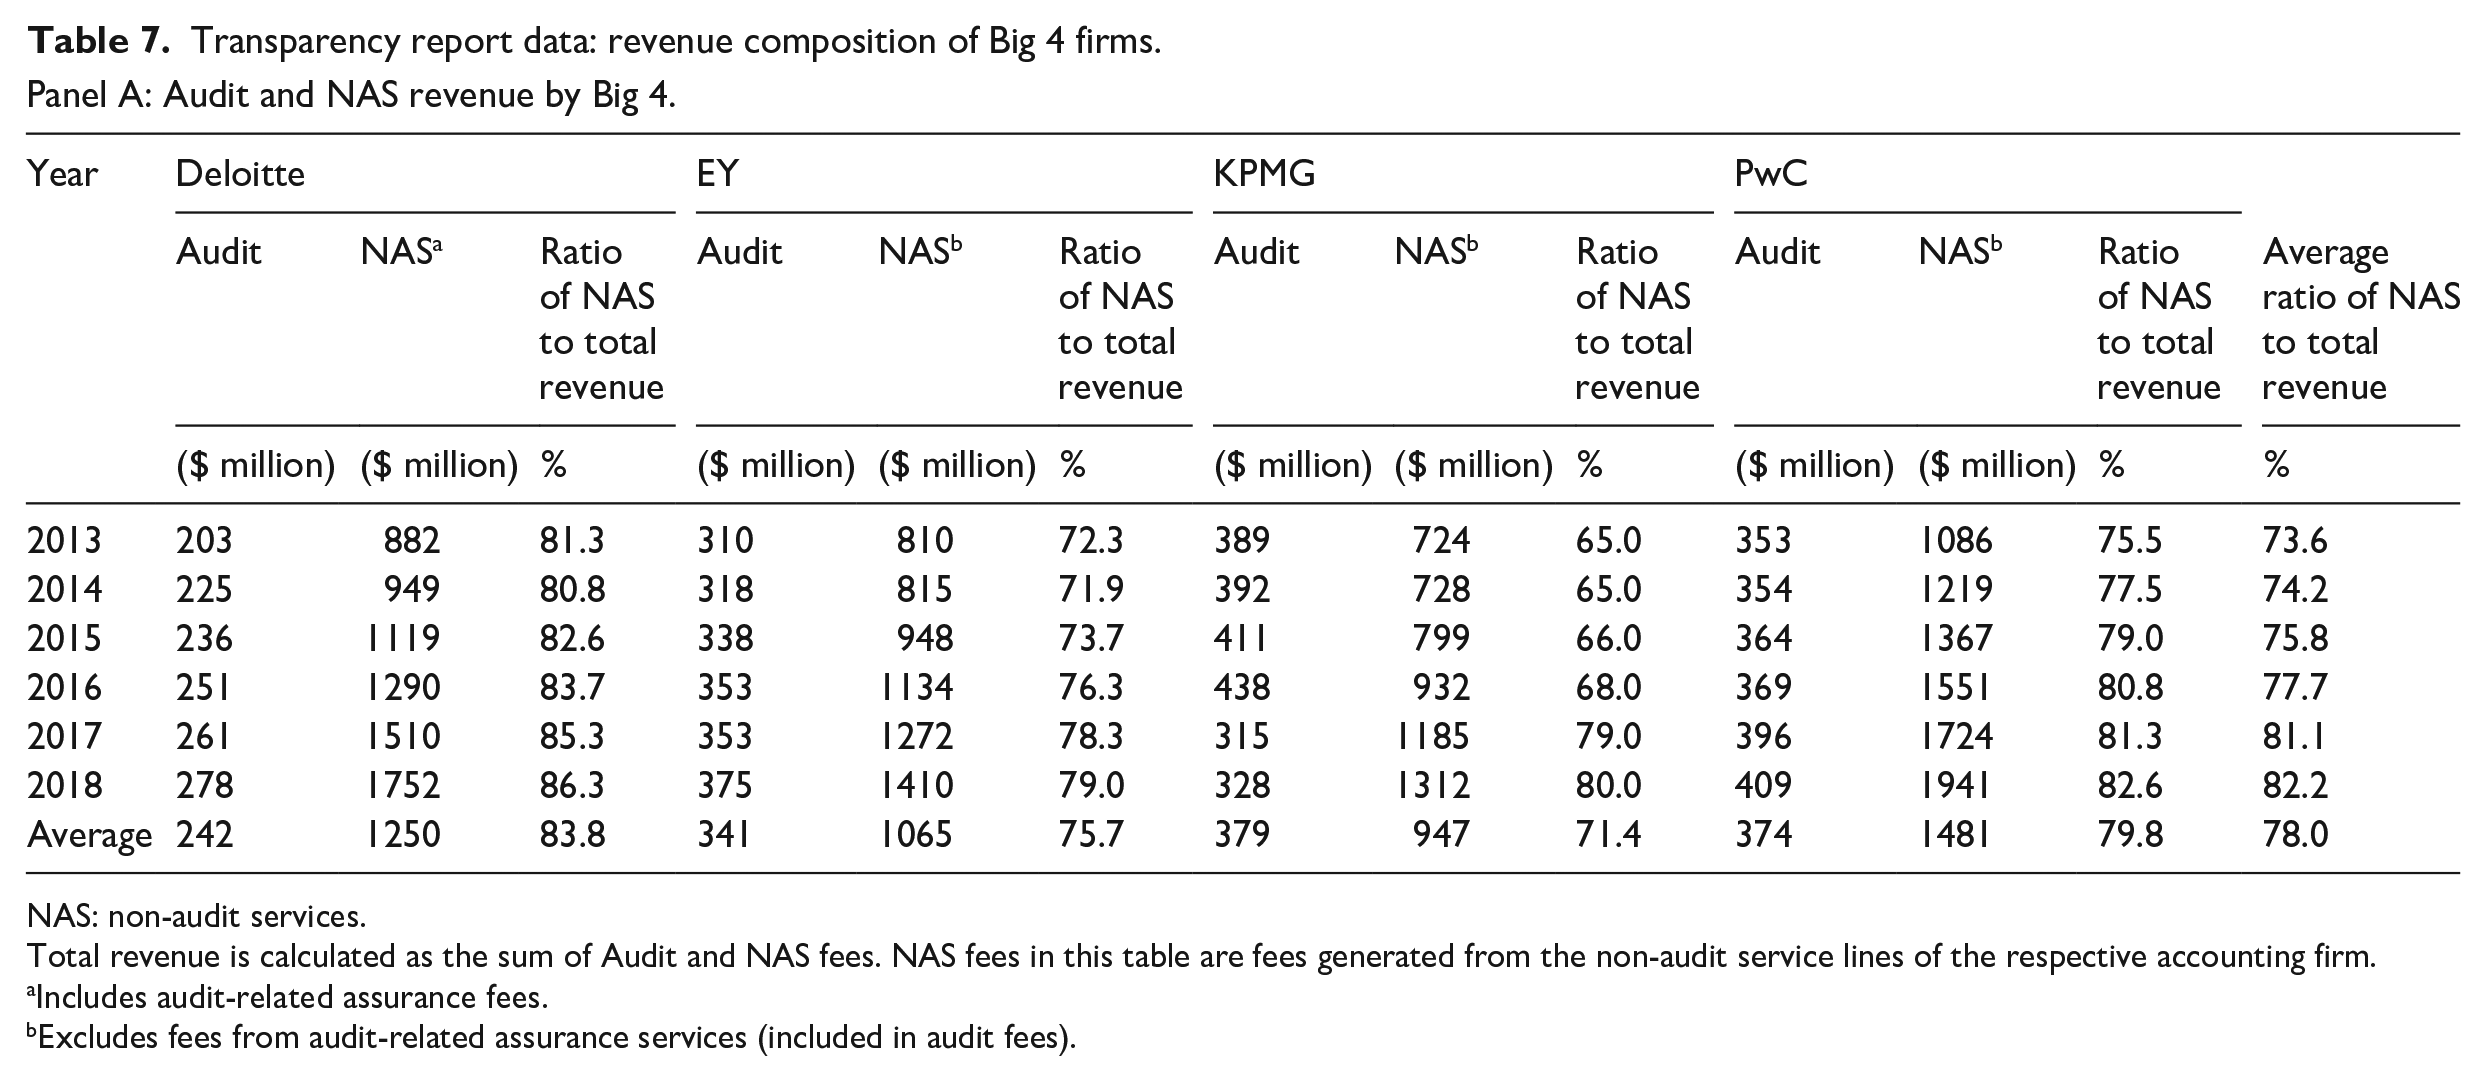
Table 7 Panel A examines the relative importance of NAS to total firm revenue in Big 4 firms. 22 It is evident that both audit and NAS fees grow over the period 2012–2018, but the growth in NAS fees far exceeds that of audit fees. Among the Big 4 firms, the ratio of NAS to total revenue has substantially increased from 73.6% in 2013 to 82.2% in 2018, where total revenue is calculated as the sum of audit and NAS fees. This increase can be observed for all Big 4 firms but is especially pronounced for (KPMG; a 15.0% increase from 2013 to 2018). Hence, revenue from NAS is increasingly important for Big 4 firms. This also points to the diminished financial importance of the audit practice.
Transparency report data: revenue composition of Big 4 firms.Panel A: Audit and NAS revenue by Big 4.
NAS: non-audit services.
Total revenue is calculated as the sum of Audit and NAS fees. NAS fees in this table are fees generated from the non-audit service lines of the respective accounting firm.
Includes audit-related assurance fees.
Excludes fees from audit-related assurance services (included in audit fees).
Panel B: NAS revenue from audit clients versus non-audit clients by Big 4.
NAS: non-audit services.
EY did not disclose detailed NAS information and is, therefore, excluded from this panel.
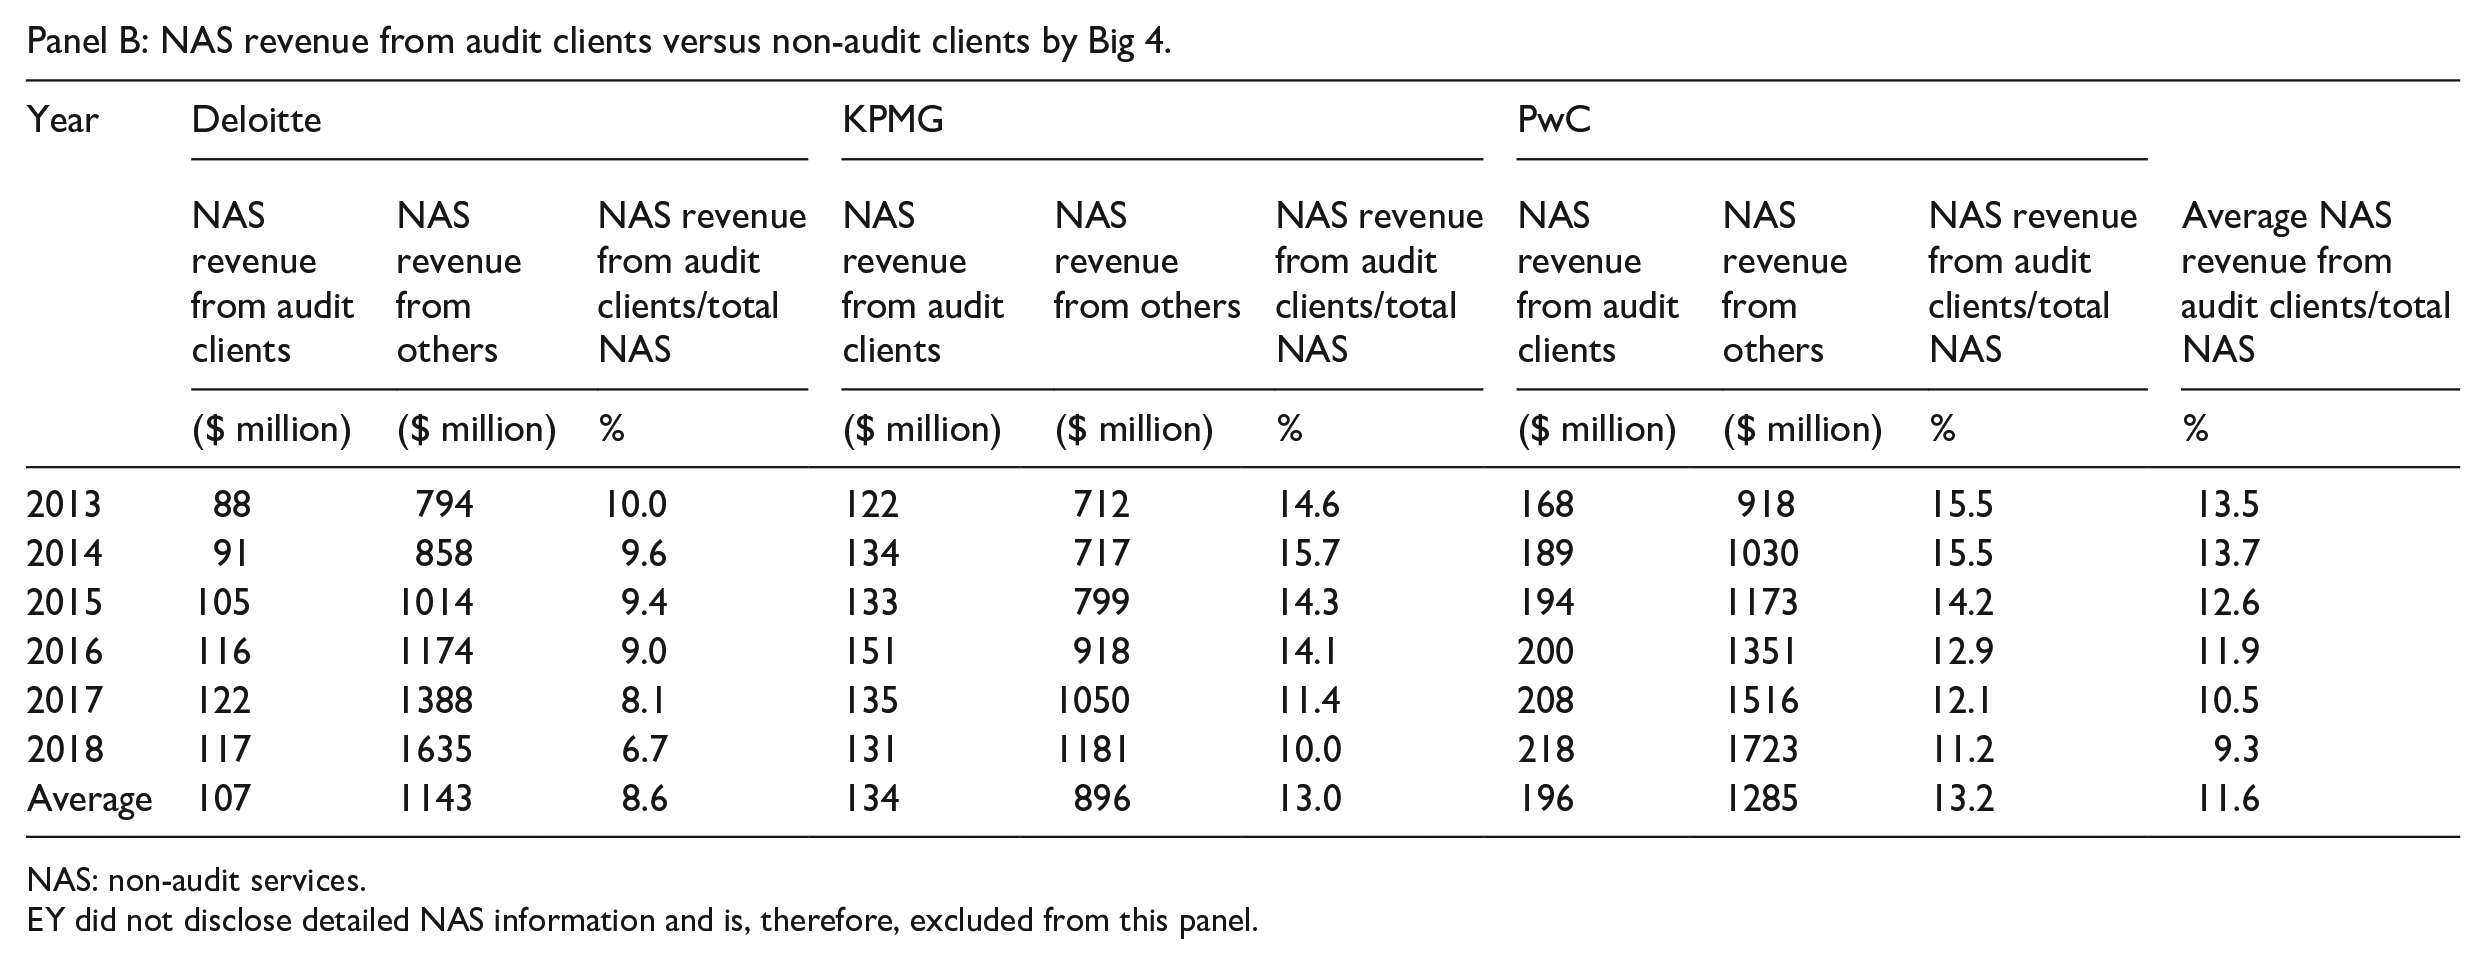
Table 7 Panel B further disaggregates NAS revenue into NAS revenue from audit clients and non-audit clients and reports the ratio of auditor-provided NAS revenue to total NAS revenue. These data are only available for three of the Big 4 firms, with EY not separately disclosing this information. In 2013, NAS revenue from audit clients was a mere 13.5% of total NAS revenue of these three Big 4 firms and this has declined to 9.3% in 2018. Hence, auditor-provided NAS are currently at a relatively low level and become less important to these firms over the sample period.
In summary, the largest clients and the Big 4 firms are the main players in the auditor provided NAS market of listed companies: on average, 64.0% of NAS fees paid by Australian listed companies are from the largest clients and around 90.6% of all NAS fees paid by all listed companies are to Big 4 firms. 23 In addition, the relative importance of NAS fees to audit fees varies across different client market segments, with the highest ratio observed for large clients, rather than the largest clients. The analyses on transparency report data for three of the Big 4 firms reveal that NAS fees represent more than three-quarters of the total firm revenue from all sources and is growing over the sample period. The high level of NAS fees is mainly contributed by non-audit clients, rather than audit clients. This indicates a growing emphasis on income streams from NAS in Big 4 firms.
4.4. Opportunities for research on non-audit services in Australia
The finding that Big 4 firms have experienced large growth in their non-audit service lines creates interesting research opportunities. First, it is important to understand the effect of the high level of non-audit to total revenue and its rapid growth in recent years, on the (perceived) quality of audits in Australia. On one hand, this can result in prioritisation of NAS when allocating resources within the accounting firm, at the detriment of professionalism (Lisic et al., 2019). On the other hand, the knowledge transfer between audit services and expertise from providing NAS can be beneficial for audit quality (Donelson et al., 2020). In addition, investors’ perceptions of audit quality might be negatively affected by the high proportion of firm revenues from NAS.
The decline in the purchase of NAS by audit clients from their auditors in combination with increased proportion of firm revenue from NAS is an interesting phenomenon warranting investigation. This has the potential to affect the Australian audit market and subsequently audit quality since NAS are typically more lucrative than audit services. Specifically, accounting firms might forgo audit services to clients and instead target them for more lucrative NAS. In addition, clients might prefer to purchase NAS from a specific accounting firm which restricts these accounting firms from providing audit services to these clients (Cowle et al., 2022). If audit services are differentiated and certain auditors can better meet the needs of certain audit clients (Gerakos and Syverson, 2015), prioritising NAS can result in a mismatch between client and accounting firm and consequently affect audit quality.
The analysis also shows that the amount of auditor-provided NAS as a percentage of audit fees is highest for the second-largest group of clients, but not for the largest clients. It is unclear why such variation between client segments exists and it would be worthwhile to explore the reasons.
Finally, the results show that NAS fees provided by Australian accounting firms are noticeably lower than those in the United Kingdom with a 5% to 15% difference in NAS fee to audit fee ratios, despite similar regulations in the two jurisdictions (CMA, 2019). A cross-country comparison that explores reasons why the Australian market for NAS fees differs from other NAS markets is warranted. Potential explanations could be the unique composition of Australian listed companies, differences in client corporate governance, varied compliance with NAS-related regulations and different partner incentives embedded in compensation structures.
5. Audit firm tenure
Some corporations engage the same audit firm for decades, which has raised regulatory concerns about audit-client familiarity and lack of independence of auditors, which can affect audit quality (Murphy, 2015; Parliamentary Joint Committee on Corporations and Financial Services, 2020b). Despite these concerns, empirical evidence on whether long audit firm tenure affects audit quality of public companies is mixed (Bell et al., 2015; Carcello and Nagy, 2004; Chen et al., 2008; Davis et al., 2009; Deis and Giroux, 1992; Johnson et al., 2002). Some jurisdictions introduced regulations to cap audit firm tenure and required audit firm rotation for certain clients (e.g. in Europe in 2014) (European Parliament, 2014). In Australia, a ‘tender or explain’ approach has been recommended by the Parliamentary Joint Committee on Corporations and Financial Services (2020a). Proponents of mandatory firm rotation argue that it reinforces auditor independence, while opponents argue that client-specific knowledge only develops over time (Myers et al., 2003). In this section, we analyse audit firm tenure and audit firm switches of listed Australian companies from 2012 to 2018.
5.1. Audit firm tenure
Table 8 Panel A outlines the audit firm tenure for listed clients. 24 Over the period 2012 to 2018, around half (46.6%) of all listed companies engage the same audit firm for less than 5 years, 26.6% engage the same audit firm for 5–8 years, 14.1% engage the same audit firm for 9–12 years, and finally, 12.7% engage the same audit firm for more than 12 years. Furthermore, 85 companies (5.0%) have the same audit firm for at least 19 years in 2018 (un-tabulated). Overall, this shows that very long audit tenure is relatively rare among Australian listed clients despite regulatory concerns.
Audit firm tenure.Panel A: Summary of audit firm tenure.
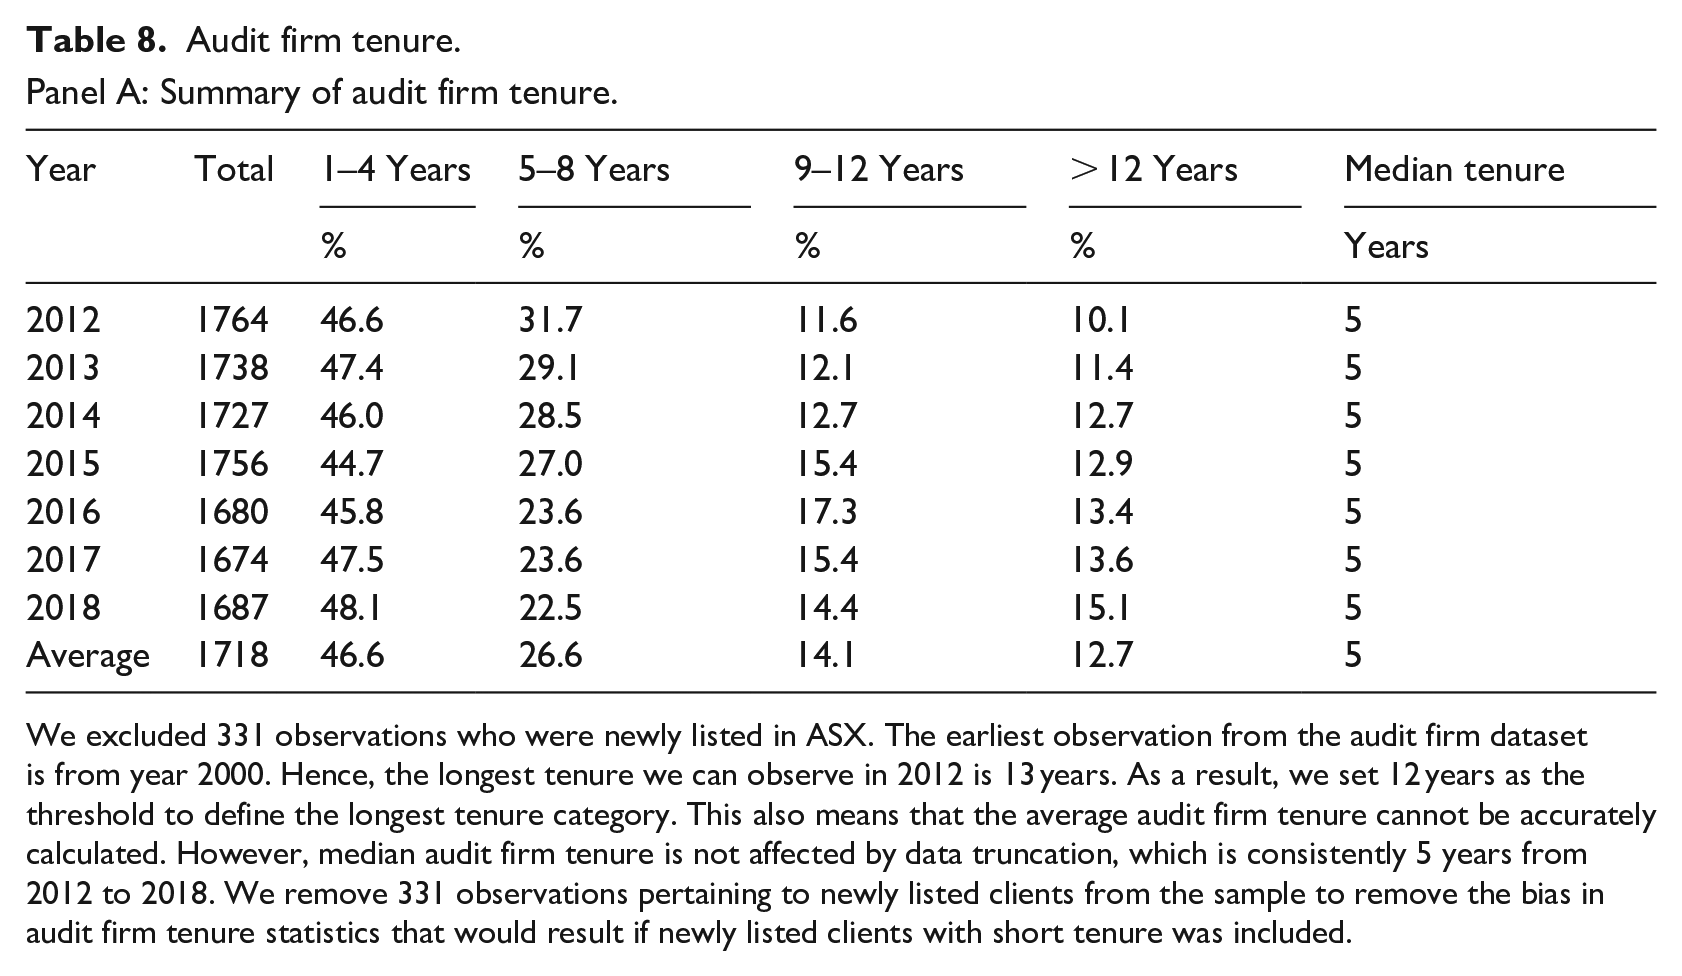
We excluded 331 observations who were newly listed in ASX. The earliest observation from the audit firm dataset is from year 2000. Hence, the longest tenure we can observe in 2012 is 13 years. As a result, we set 12 years as the threshold to define the longest tenure category. This also means that the average audit firm tenure cannot be accurately calculated. However, median audit firm tenure is not affected by data truncation, which is consistently 5 years from 2012 to 2018. We remove 331 observations pertaining to newly listed clients from the sample to remove the bias in audit firm tenure statistics that would result if newly listed clients with short tenure was included.
Panel B: Audit firm tenure by audit firm type.
Panel C: Audit firm tenure by client size.
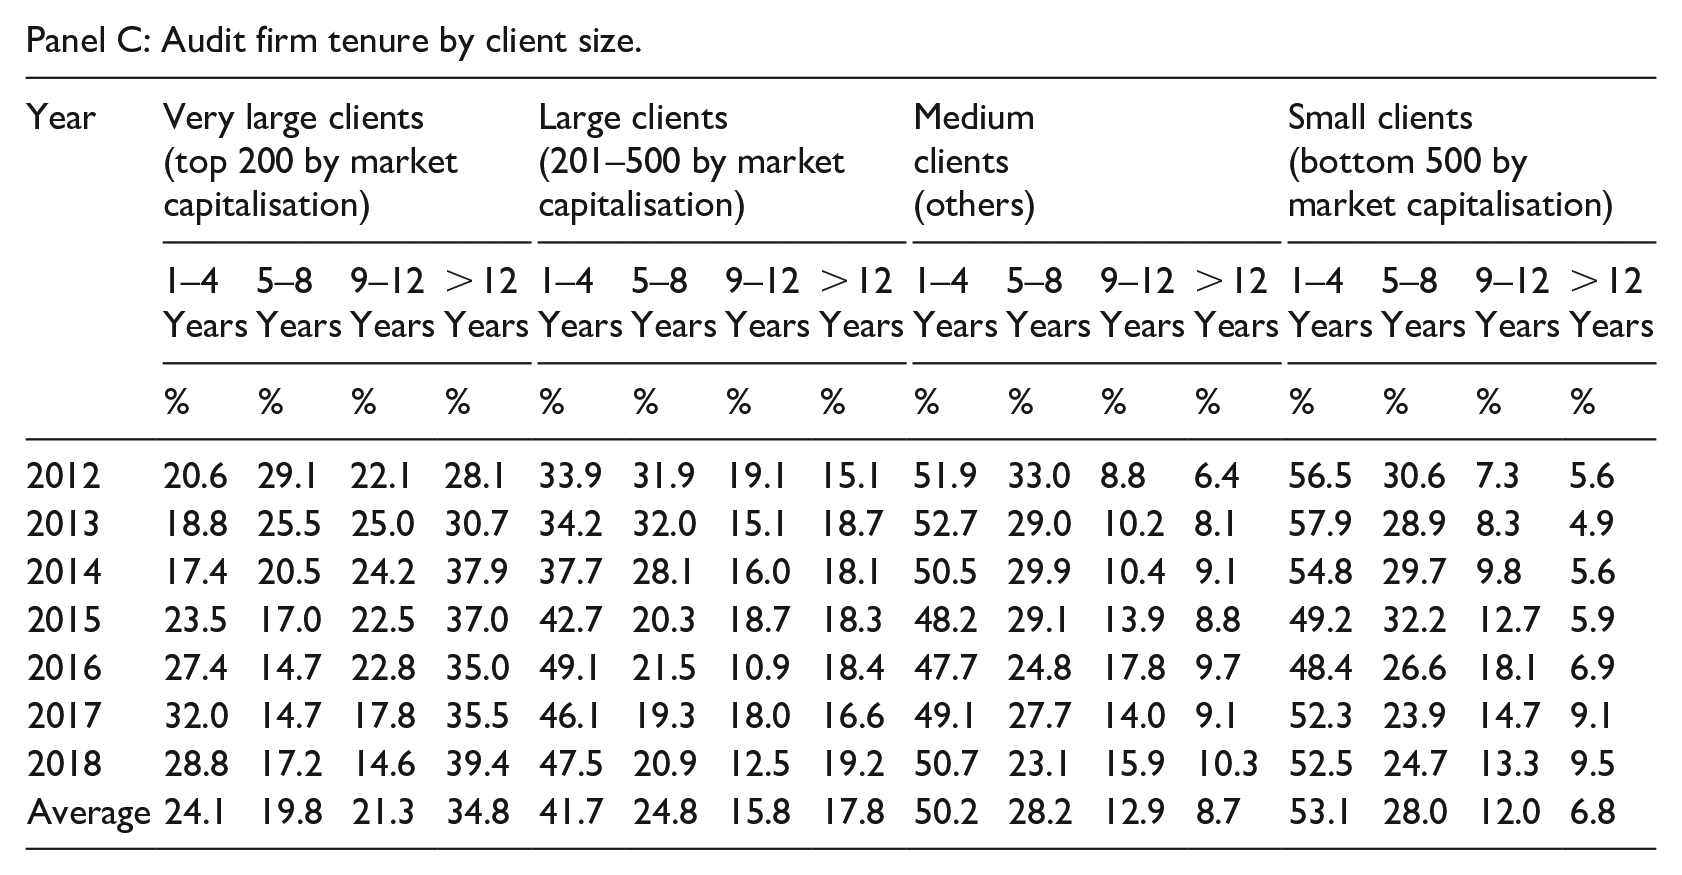
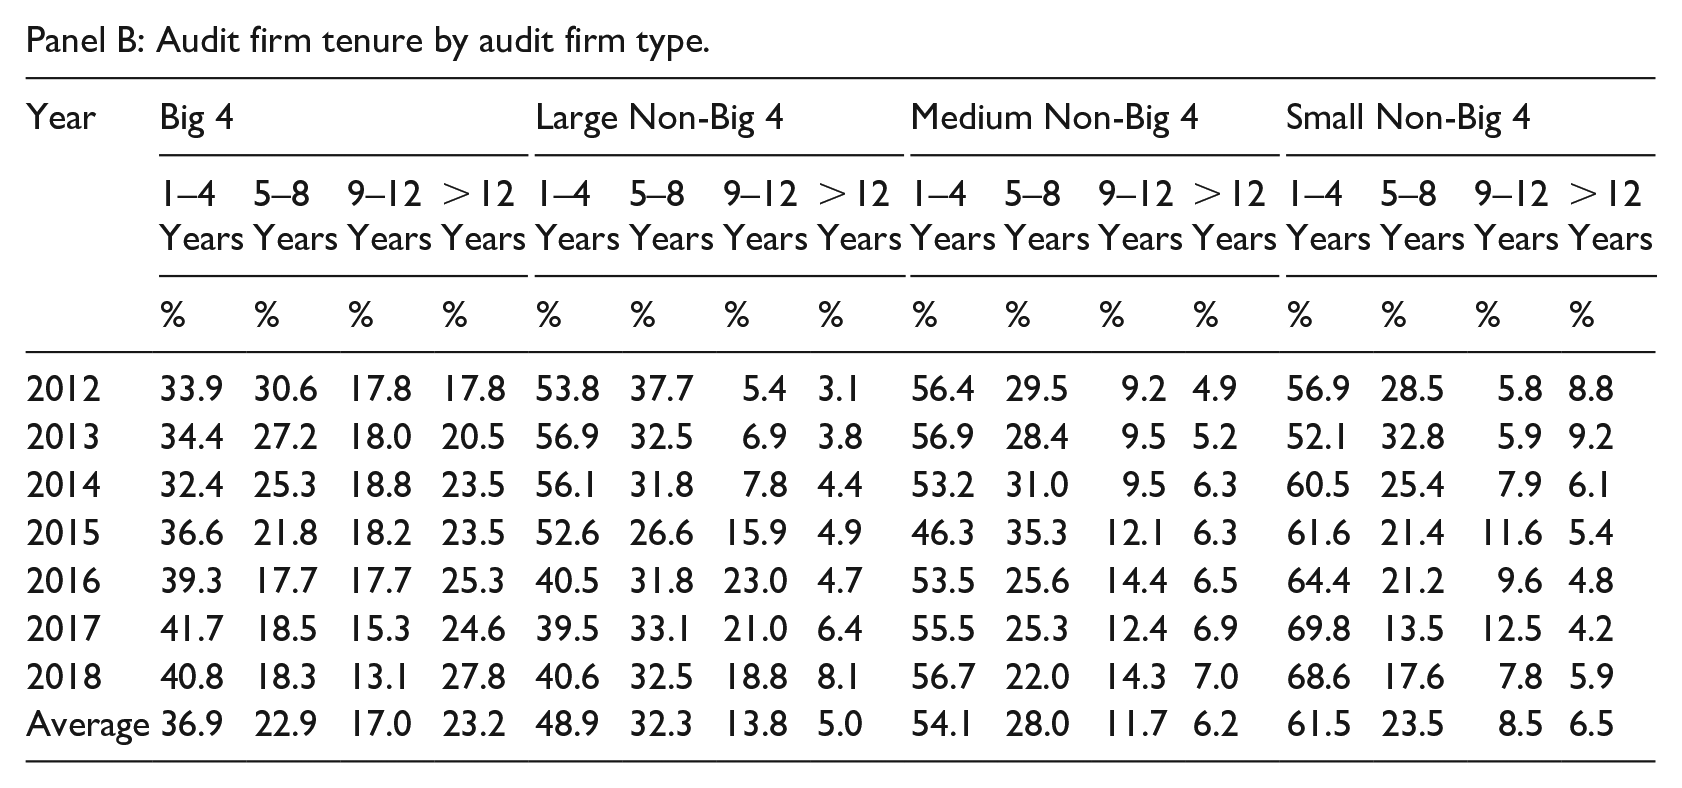
Table 8 Panel B shows that audit firm tenure varies by audit firm type. Big 4 firms retain more clients in the long-term, with 23.2% of clients engaging the same Big 4 firm for more than 12 years and another 17.0% for 9 to 12 years. In comparison, non-Big 4 firms retain only between 5.0% and 6.5% of their clients for more than 12 years, and 8.5% and 13.8% of clients for 9 to 12 years. Over the sample period, the proportion of Big 4 clients with longer audit tenure (more than 12 years) is increasing in recent years, from 17.8% to 27.8%.
Table 8 Panel C analyses the audit firm tenure data by client market segment, where important differences emerge between the various client segments. 25 In general, we observe that the proportion of clients with longer audit firm tenure is positively correlated with client size. This can reflect that (1) auditors are inclined to keep larger clients and/or (2) larger clients value the incumbent audit firm’s client-specific knowledge more than smaller clients and prefer to avoid costs related to audit-firm switching (Bell et al., 2015; Carcello and Nagy, 2004; Chen et al., 2008; Johnson et al., 2002; Murphy, 2015). It further reveals differences in tenure over the sample period among different client segments. For the largest and the second-largest clients, a higher proportion remain with the same audit firm for more than 12 years in 2018 than in 2012, indicating long audit firm tenure could be a concern for this group. Like large clients, a higher percentage of medium and small clients engage with their audit firms for more than 9 years in 2018 than in 2012, pointing to possible concerns about long tenure.
In summary, while our analysis shows long audit firm tenure is not very widespread among Australian-listed companies – from 2012 to 2018, only 12.7% of all listed companies engage the same audit firm for more than 12 years. It is evident, and might reflect regulatory concern, that cases of long audit firm tenure are over-represented among (1) clients of Big 4 firms and (2) larger clients.
5.2. Audit firm switches
We analyse audit firm switches from 2012 to 2018 to understand clients’ propensity to switch audit firms and incumbent versus new audit firm types. In Table 9 Panel A, we calculate the proportion of clients switching audit firms and then analyse the type of switches (i.e. switches between Non-Big 4 firms, between Big 4 firms, from Non-Big 4 to Big 4 and from Big 4 to Non-Big 4). On average, 9.0% of companies change their audit firms over the period but the proportion of switches decrease over time. Over 55% (5.4% of the total sample) of all audit firm switches are between Non-Big 4 firms, which might be related to audit firm mergers and rebranding activities. 26 It might also be related to the requirement to rotate audit partners every 5 years, with audit firm switches between Non-Big 4 firms peaking in 2012 and 2016. In contrast, switches between Big 4 firms represent around 10% (0.9% of the total sample) of all audit firm switches over the period, suggesting little competition between Big 4 auditors and Big 4 clients’ preference to retain their auditors. Finally, around 16% (1.4% of the total sample) of auditor switches are from Big 4 to Non-Big 4 firms, compared to around 13% (1.2% of the total sample) of switches between Non-Big 4 to Big 4 firms.
Change of auditors.Panel A: Change of auditors for the full market.
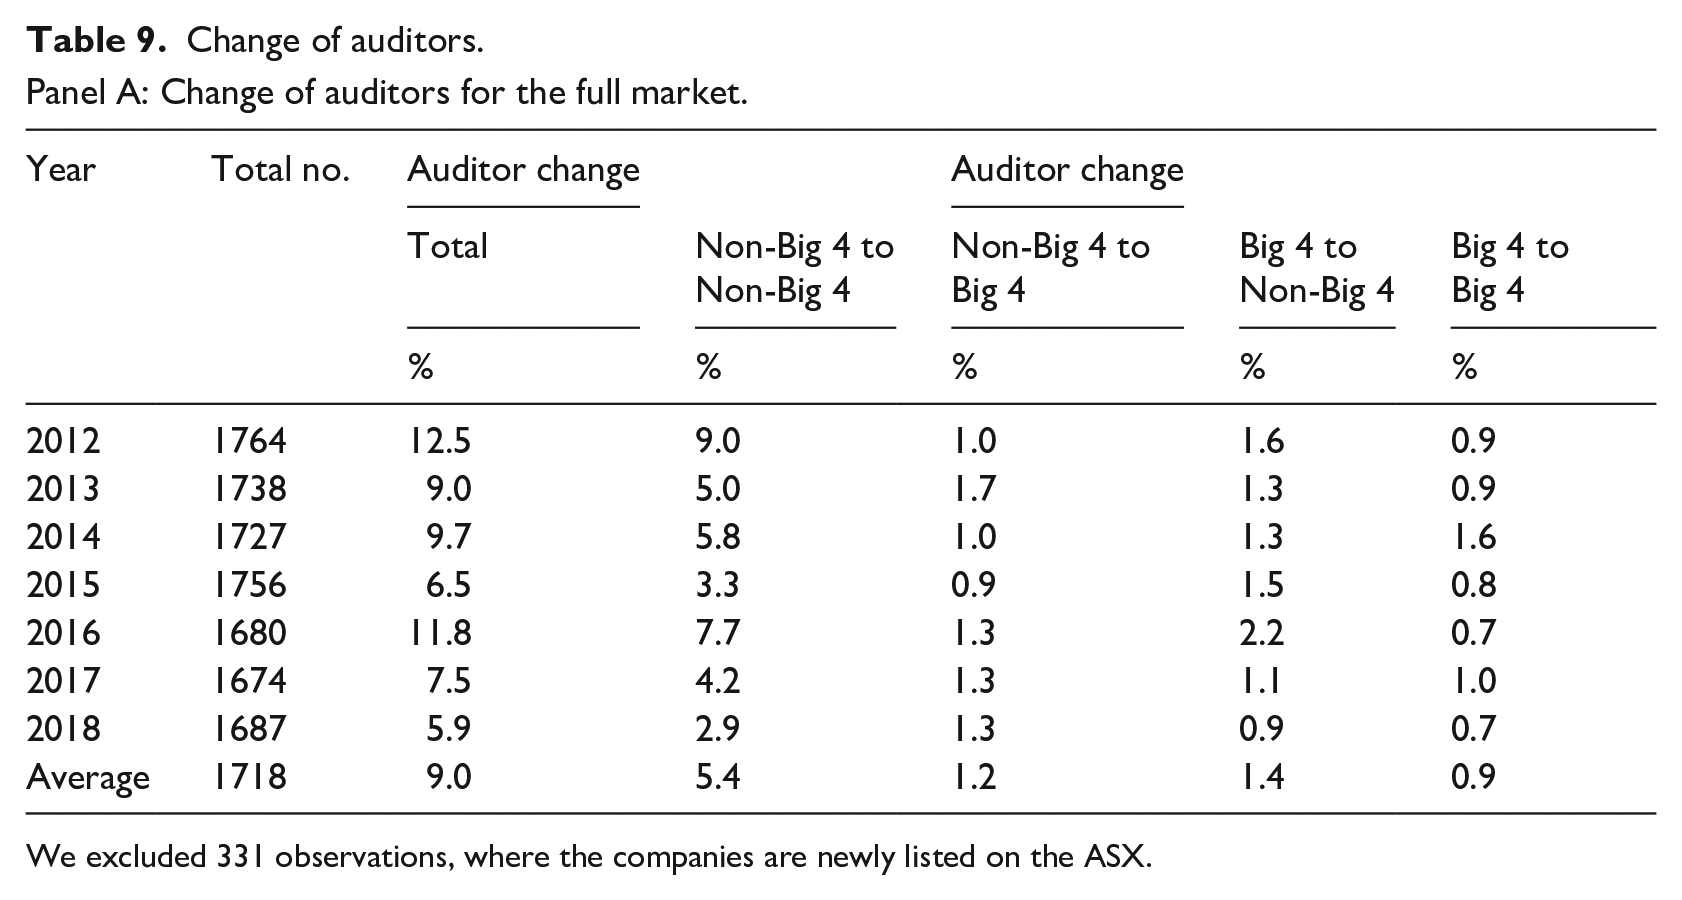
We excluded 331 observations, where the companies are newly listed on the ASX.
Panel B: Change of auditors by client size.
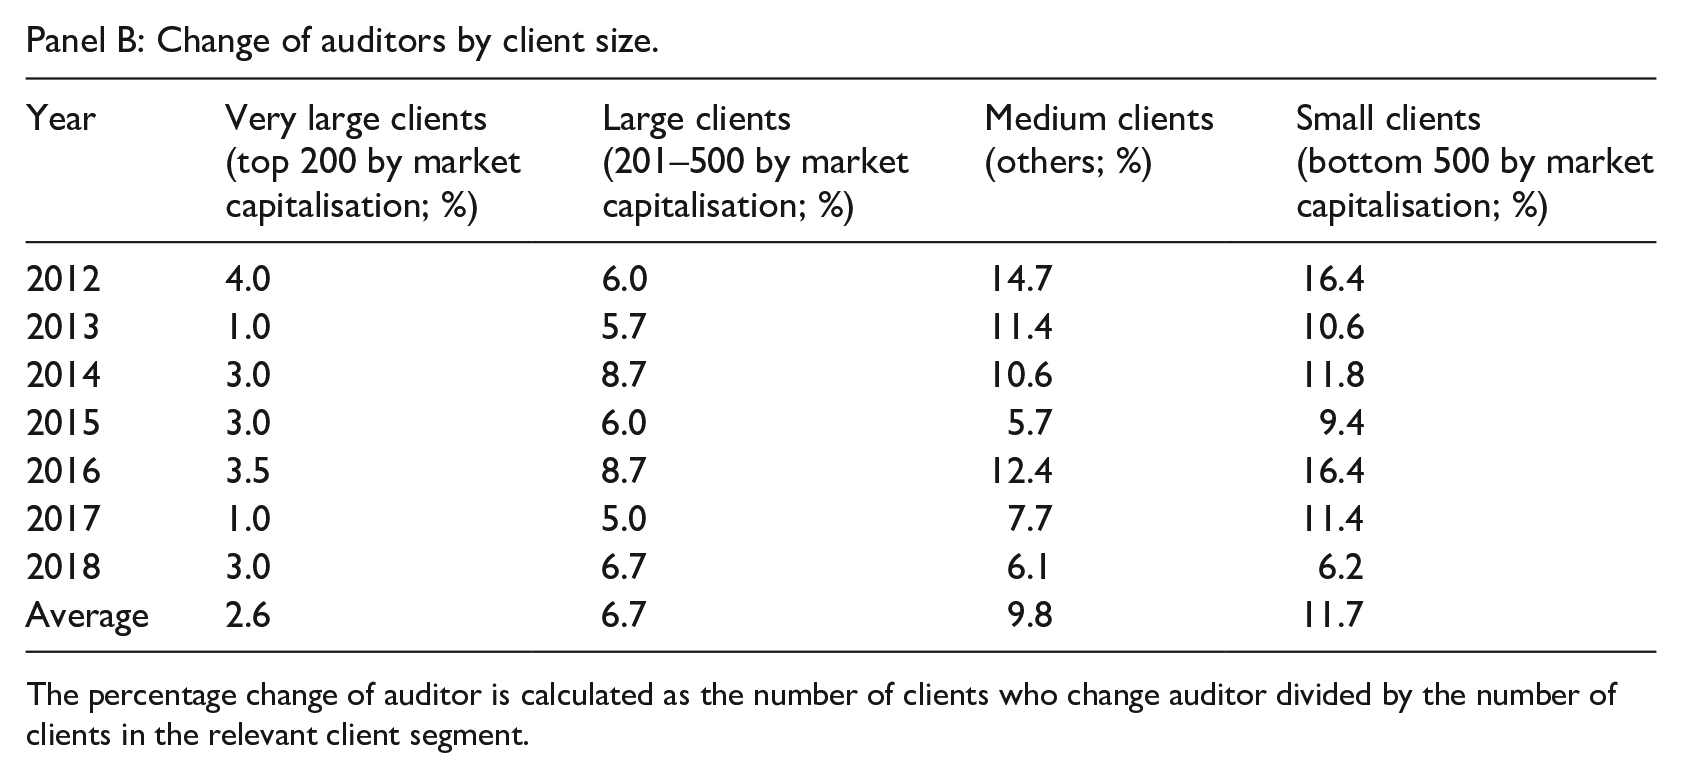
The percentage change of auditor is calculated as the number of clients who change auditor divided by the number of clients in the relevant client segment.
In Table 9 Panel B, we analyse audit firm switches by client segment. An average of 2.6% of the largest clients and 6.7% of large clients switch audit firms over the sample period. This is compared to 9.8% of the medium clients and 11.7% of the small clients switching audit firms. This shows that larger clients seem to be more likely to retain their incumbent auditors, which is consistent with our findings in Section 5.1.
To summarise, over half of all audit firm switches occur between Non-Big 4 firms over the period 2012–2018, possibly because of audit firm mergers and rebranding between Non- Big 4 firms and mandatory partner rotation requirements. Moreover, larger clients change their auditors less frequently than smaller clients, which may be due to stronger preference for and benefit from client-specific knowledge, or the preference of small clients to save costs.
5.3. Opportunities for research on audit firm tenure in Australia
Based on the above observations, we propose the following research opportunities related to audit firm tenure and audit firm switches in Australia. First, it is worthwhile to understand why certain clients switch audit firms and others retain the same audit firm longer. Academic research has pointed out the importance of an auditor–client match (Gerakos and Syverson, 2015). Changes in client firm needs and characteristics or audit firm characteristics could affect this auditor–client match. For example, an increased focus on consulting, rather than auditing, within an audit firm, or client demand for certain NAS could result in audit firm switches. This could be investigated by comparing the purchase of NAS from audit firms prior to and after the audit firm switch.
Another area for research is understanding the effect of audit firm tenure on audit quality, where results from prior research is mixed (Bell et al., 2015; Carcello and Nagy, 2004; Chen et al., 2008; Johnson et al., 2002). It remains unclear whether it is worthwhile to trade client-specific knowledge with enhanced auditor independence through mandatory audit firm rotation. The relatively even distribution of audit firm tenure in the large client segments provides an opportunity to explore the effect of tenure on audit quality (endogeneity issues notwithstanding). In addition, it is unclear why clients switch relatively frequently between Non-Big 4 firms. It is possible that this is driven by mandatory partner rotation, mergers and acquisitions between Non-Big 4 firms, or opinion shopping by clients. Future studies can investigate these possible explanations.
6. Conclusion
Regulators have voiced their concerns regarding the market dominance of the largest audit firms in the Australian audit market, and the threat to auditor independence arising from the provision of NAS by auditors to their clients and long audit firm tenure. However, there is little understanding about the recent status quo in the Australian market. Therefore, this study provides a descriptive analysis of the Australian audit market for listed firms over the period 2012 to 2018, focusing on market concentration, provision of NAS and audit firm tenure. We also identify specific areas where researchers can assist regulators to better understand the Australian audit market and suggest a range of research opportunities.
In summary, we find that the audit market is highly segmented. While the Big 4 firms audit less than 40% of all companies, they audit most of the largest clients, and collect a very high proportion of market-wide audit fees. Smaller clients are mainly serviced by a range of Non-Big 4 firms. In addition, we also observe differing levels of concentration across client size segments. The two largest segments are highly concentrated, but concentration levels have not increased over the sample period; for medium-sized clients, the market is slightly less concentrated with significant participation from Big 4 and Non-Big 4 firms; and for the smallest clients, the market concentration is low and increases at a modest level over time. All these results indicate a relatively competitive but complex audit market.
We further find that the auditor-provided NAS market is dominated by the Big 4 firms, and in absolute terms, most NAS are purchased by the largest client segment. The average NAS fee to audit fee ratio is around 30% for the total market with the highest ratio (around 50%) observed for the second-largest group of clients. Revenue data from transparency reports of Big 4 firms provide additional insights into the total NAS market serviced by large accounting firms. These data reveal that average revenue from audit services declined from 26.4% in 2012 to 17.8% in 2018 and points to increased reliance on non-audit service lines to generate revenue in Big 4 firms. This growth is concentrated in non-audit rather than audit clients.
Regarding audit firm tenure, we find that only 12.7% of companies engage the same audit firm for more than 12 years, indicating that very long audit firm tenure is relatively rare overall. However, this proportion is higher in the two largest client segments (34.8% for the very large clients and around 17.8% for the large clients). Analyses on audit firm switches show that (1) larger clients report fewer auditor switches than smaller clients, suggesting larger clients may value client specific-knowledge and smaller clients may have lower demands for NAS or seek cost savings; and (2) switches between Non-Big 4 firms are the most common, except for large clients that mostly switch between Big 4 firms.
This article is not without limitations. First, this article is purely descriptive in nature and only provides potential explanations for observed variability and trends. We do not explore associations or claim causality. Second, the analyses are confined to listed companies for which audit and NAS data are publicly available. Accordingly, our conclusions can only be generalised to the Australian listed company market. While it would be useful to extend the analysis to the private company or other markets, the cost of accessing the data is costly, due to search fees charged by ASIC to access annual filings of companies, and the cost for manual data collection and entry (ASIC, 2022). However, with search fees likely to be removed from September 2023, accessing these data will become easier (Vickovich, 2022).
Footnotes
Acknowledgements
The authors would like to acknowledge the valuable feedback received from Roger Simnett, Anne Waters members of the Australian Auditing and Assurance Standards Board (AUASB).
Final transcript accepted on 19 August 2022 by Mark Wilson (AE Accounting and Auditing).
Funding
The author(s) disclosed receipt of the following financial support for the research, authorship, and/or publication of this article: The data for this project were collected with funding from the Business School, UNSW Australia and with support from the Australian Auditing and Assurance Standards Board (AUASB) while Elizabeth Carson was an Honorary AUASB Research Scholar in 2018–2019.