
Abstract
Prescription-event monitoring (PEM) is the current gold standard for determining the risk of rare drug side-effects and comparing the risk between agents; however, spontaneous or prompted reporting schemes have low case-detection rates and exposure may be difficult to estimate. A novel method is described that allows a comparative adverse event rate between two drugs to be estimated—based on patterns of cross-reactivity—requiring only a sample of cases and no direct knowledge of drug exposure rates. Agreement was compared between the novel method and historical estimates of risk using PEM for comparative risk of rocuronium versus vecuronium anaphylaxis. The novel method was applied to a sample of patients investigated by the Western Australian Anaesthetic Drug Reaction Clinic over a 21-year period. Relative population exposure was estimated from the number of patients with either rocuronium or vecuronium anaphylaxis subsequently shown to be reactive on skin testing to both agents. This was used to correct the total number of cases of hypersensitivity triggered by each agent. Measures of spread were by bootstrap sampling. Historical estimates were gathered by literature review. Additional comparisons of agreement between estimates made by the novel method and PEM were made using cross-reactivity data and PEM rates reported in the literature. There was agreement between estimates of comparative anaphylaxis risk between the novel method and PEM. Two-hundred and twenty-eight cases of anaphylaxis were observed, 89% caused by rocuronium. Patients reactive to both agents were more likely to be female, and had a higher acute mast cell tryptase level. Patients with a history of rocuronium anaphylaxis were more likely to be reactive to one agent only (69% vs. 33%, P < 0.01). It was estimated that rocuronium was prescribed 3.9 times more frequently than vecuronium. When the observed proportion of cases was corrected for exposure rate, the risk of rocuronium anaphylaxis was 2.2 times that of vecuronium (95% confidence interval 1.7 to 2.8). The median risk from historical estimates was 4.7 times, while the previous PEM estimate in Western Australian was 3.0 times. Using a subgroup of patients susceptible to the same side-effect of two drugs, the relative exposure rate and corrected comparative risk of an adverse effect can be estimated for a population. Using this technique, which requires assessment only of cases to estimate relative exposure rates, we have estimated that the risk of anaphylaxis from rocuronium to be 2.2 times that of vecuronium in Western Australia.
Keywords
Introduction
When a particular drug allergen leads to a significant number of hypersensitivity reactions, it is important to distinguish whether this is due to a high rate of sensitisation among the population or simply because of frequent exposure to the drug. The clinical relevance is that the overall disease burden can be reduced only by substituting the troublesome drug with an alternative with a lower rate of sensitisation.
The most common cause of neuromuscular blocking agent (NMBA) anaphylaxis in Western Australia (WA) is rocuronium. 1 Whether this represents a high rate per exposure or is simply proportional to usage has been debated. Prescription-event monitoring (PEM) is the gold-standard method for estimating the rate of rare adverse events in pharmacovigilance; however, clinicians usually rely on spontaneous reporting for post-marketing surveillance particularly when adverse events are rare. Determining the number of exposures (prescriptions) and events (hypersensitivity reactions) may be challenging. Methods of estimating exposures include approximation by ampoule sales data,1 –3 audits of prescriptions over a representative period of time 4 or electronic monitoring of drug administration.5,6 These methods each have limitations which may result in over- or underestimation of exposures. In addition, underreporting or misdiagnosis of cases can cause inaccuracy when estimating the number of adverse events. Comparing the risk of rocuronium with an alternative NMBA has therefore proven to be difficult.
We present a novel method of determining the ‘comparative rate’ of events per prescription between two potentially cross-reacting drugs that requires knowledge only of the characteristics of adverse-event cases, and which requires only a sample of these cases as long as the sample is random. This method may be used when an accurate measure of exposure or ability to capture all cases in a region is limited, and has the advantage of not being limited by the same errors and limitations of PEM methods. The approach enables informed decision-making regarding the prescription of drugs that are otherwise similar, based on the rates at which the population is sensitised to them.
Aim
The novel method will be applied to a contemporary database and compared with historical estimates based on PEM.
Theoretical foundations and hypothesis
The method relies on classification of patients into subsets based on the pattern of allergen cross-reactivity after a hypersensitivity reaction to either of the two drugs of interest as determined by skin testing results. The principle is that in the subset of patients that exhibit cross-reactivity to both drugs on skin testing, the proportion of hypersensitivity reactions triggered by each drug is in proportion to the rate at which each drug is prescribed across the entire population.
The pathophysiology may be cross-reactivity (cross-sensitivity) or co-reactivity. Cross-reactivity describes the condition where the same IgE molecule binds to either allergen with common structural features, while co-reactivity describes the presence of more than one distinct IgE clone in the same patient that binds a distinct epitope of only one drug. We will use the term ‘polyreactive’ to describe patients that would react to either allergen regardless of the underlying pathophysiology.
If we consider two cross-reacting allergens, we will be able to categorise patients into two groups based on the allergen responsible for the hypersensitivity episode (drug A or drug B). On the basis of cross-reactivity testing, the two groups can be subdivided into four subsets (see Figure 1). The first subset is reactive to the first allergen (drug A; monoreactive) only, the second subset is reactive to the second allergen (drug B; monoreactive) only, the third subset is reactive to both allergens (drug A and drug B; polyreactive) and the fourth subset is hypersensitive to neither. The relative size of the first and second groups depend on both the frequency of sensitisation to each drug in the population and the rate of prescription of each drug. If one group is larger in size than the other, it is not possible to know whether that was caused by a higher rate of hypersensitisation, a higher prescription rate, or both.
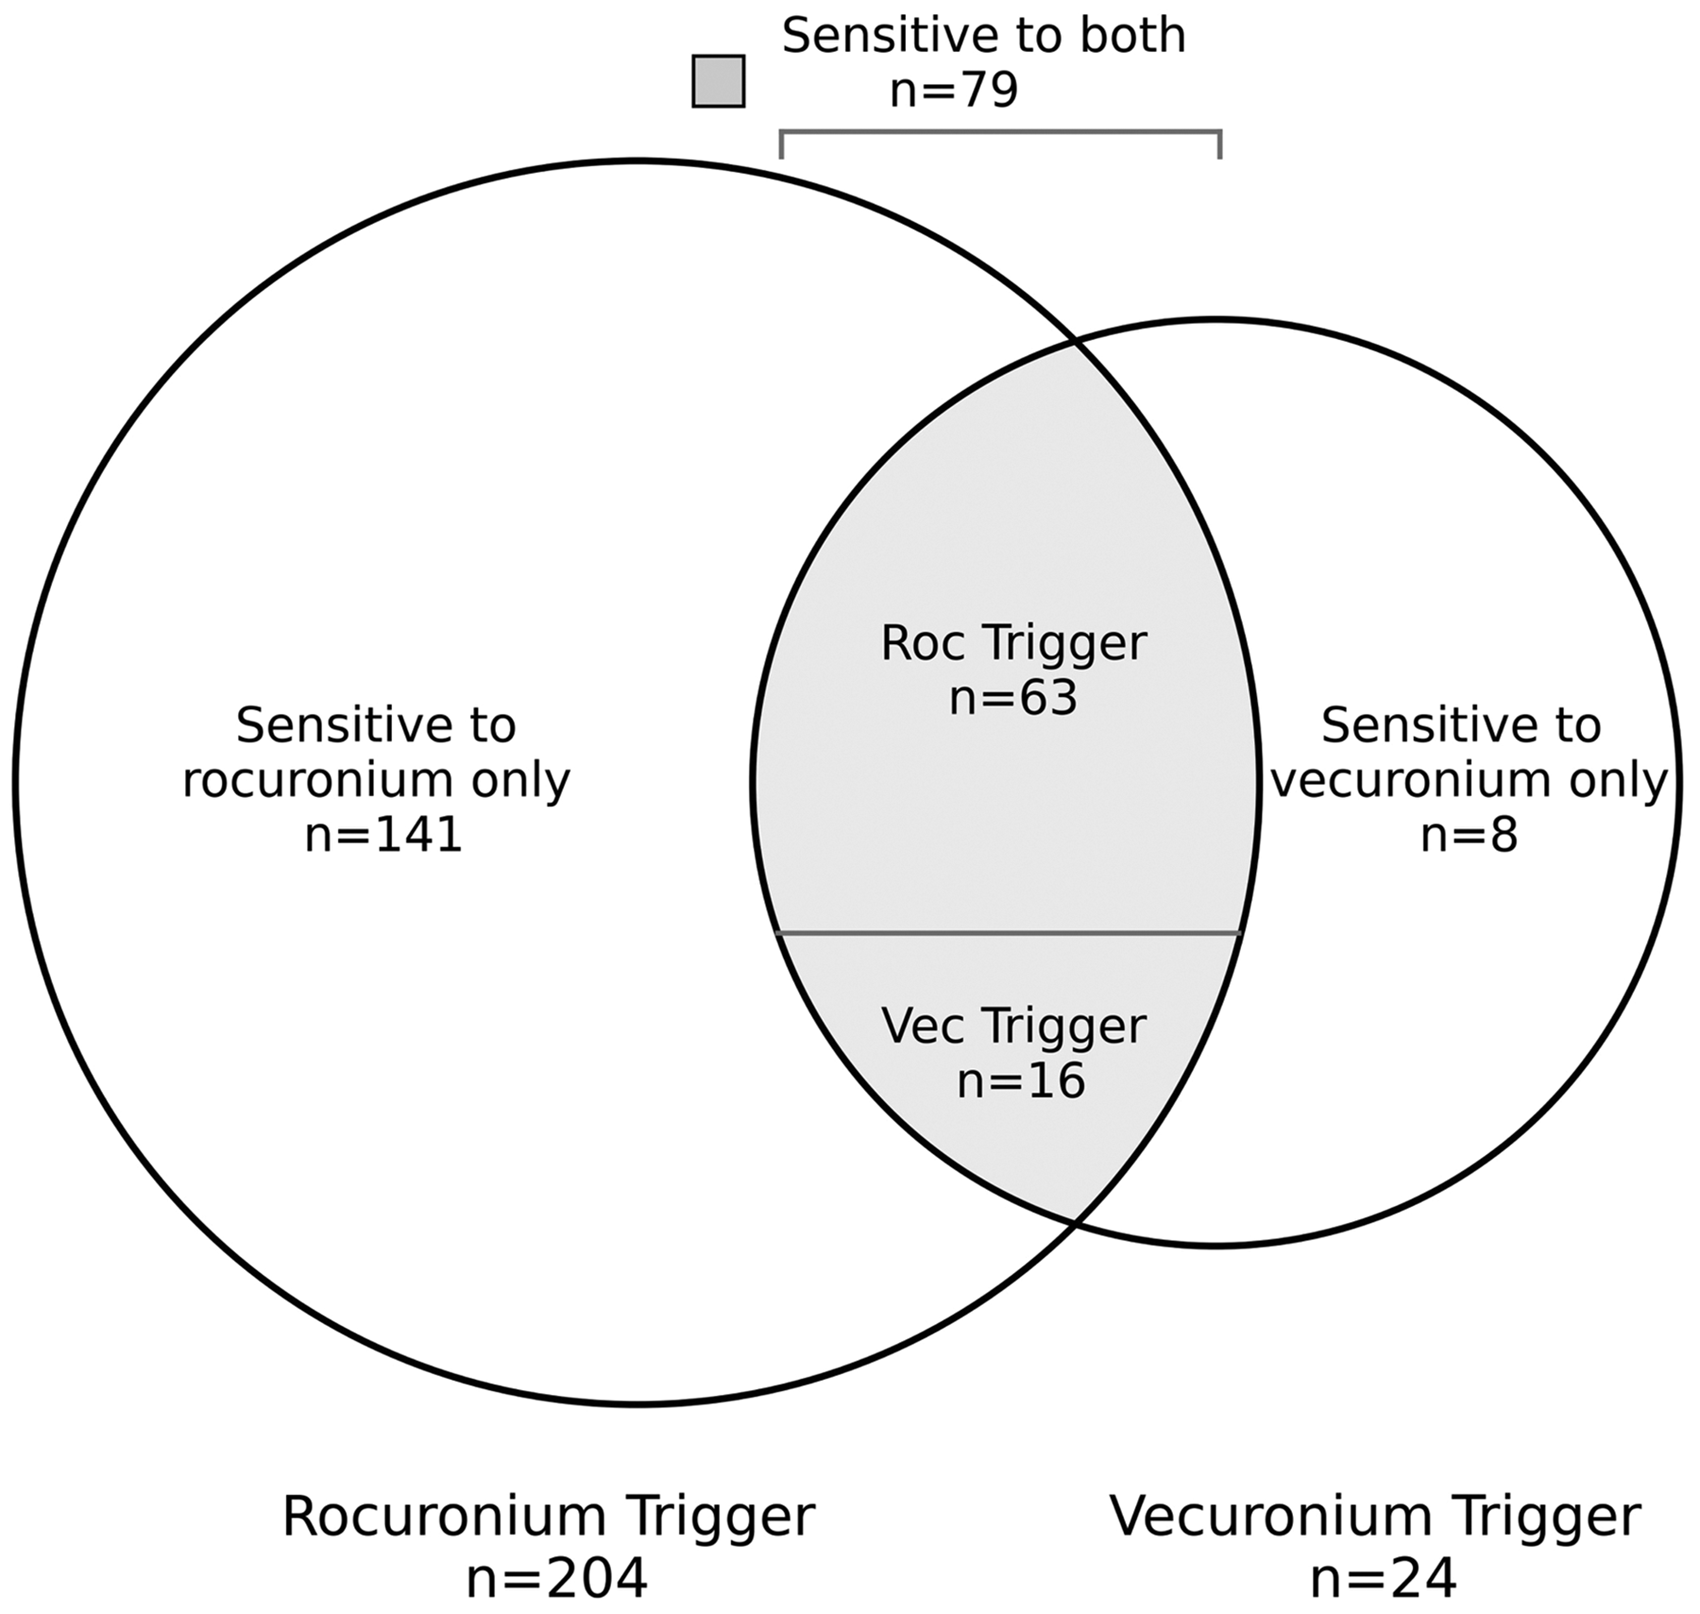
Venn diagram of the patients suffering hypersensitivity to either rocuronium (Roc) or vecuronium (Vec) classified by patterns of cross-reactivity.
The special property of the third (polyreactive) subset is that the number of these cases triggered by each drug will be in proportion to the relative prescription rate of each drug to this group. If there is no quality of this subset that would make the prescription rates different from that of the general population, then we can infer that the relative prescription rates for the two drugs for the general population are similar. For example, if drug A caused twice the number of hypersensitivity episodes in the polyreactive subset as drug B, we can assume that the rate of prescription of drug A in the population was twice that of drug B.
The implied drug prescription ratio is given by the number of patients in the polyreactive subset given drug A (PA), divided by the number of patients in the polyreactive subset who were administered the drug B (PB). This can be represented mathematically as:
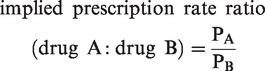
Assuming that the ratio for the polyreactive subset is representative of other subsets, or the overall population, we can then estimate a relative risk of anaphylaxis for each drug. This calculation accounts for their respective prescription rates. By making this adjustment, we can gauge the risk of each drug as if they were prescribed at equal rates.
To calculate the comparative risk of a reaction per administration of drug A compared with drug B, take the total number of patients that reacted to drug A and divide by the total number of patients that reacted to drug B. Then, divide this result by the implied prescription rate ratio. The formula can be represented as:
A is the number of patients who had a hypersensitivity reaction to drug A and did not cross-react to drug B; B is the number of patients who had a hypersensitivity reaction to drug B and did not cross-react to drug A; PA and PB are the number of patients in the polyreactive subset who had a hypersensitivity reaction to drug A or drug B, respectively.

The example method is generalisable to two or more potentially cross-reacting drugs.
There are two key assumptions:
A patient with hypersensitivity to drug A and/or drug B will experience a hypersensitivity reaction upon administration of the respective drug. Within subsets, the probability of an individual being prescribed either drug A or drug B is consistent, regardless of their subset classification.
Our first hypothesis is that the proportion of each allergen triggering hypersensitivity in polyreactive patients indicates relative drug prescriptions over the time period of observation. Our second hypothesis is that this can be used to estimate the comparative risk of anaphylaxis per administration of each drug.
Methods
Our first hypothesis was tested by using the novel method to estimate the relative prescription rate of rocuronium and vecuronium over two five-year epochs (2005 to 2009 and 2010 to 2014). These periods span known annual ampoule sales data for the periods 2007 to 2011 in WA, with the only comparable data for the period 2005 to 2013 from a cohort in South Korea.1,6 The novel method’s prescription rate for each of the five-year epochs was calculated by determining the ratio of hypersensitivity cases (rocuronium to vecuronium) within a subgroup of patients. This subgroup was identified as polyreactive (hypersensitive to both rocuronium and vecuronium), as determined through skin cross-reactivity testing. This was then compared with the relative prescription rate based on annual ampoule sales, converted to patient exposures. Ampoule sales were translated into equivalent exposure units. This was done by equating the sale of one 50 mg ampoule of rocuronium to the sale of either one 10 mg ampoule of vecuronium or two 4 mg ampoules of vecuronium.
Our second hypothesis was tested using the novel method over a 21-year epoch from January 2000 to January 2021 to estimate the comparative risk of rocuronium and vecuronium hypersensitivity in WA. This was compared with a historical PEM estimate made using cases over a 10-year period (2002 to 2011) in WA. In this historical estimate, ampoule sales from a five-year period (2007 to 2011) were extrapolated to estimate the number of ampoule sales over the entire period. 1
The contemporary database of subjects was obtained from the Western Australian Anaesthetic Drug Reaction Clinic (WAADRC) database recording cases of rocuronium or vecuronium anaphylaxis between January 2000 and January 2021. The diagnosis was based on an episode of suspected perioperative anaphylaxis within 10 minutes of the administration of the implicated NMBA. This was confirmed by a positive intradermal test (wheal of 8 mm or greater with flare). The skin test protocol was in accordance with guidelines published by the Australian and New Zealand College of Anaesthetists (rocuronium 0.01 mg/ml, vecuronium 0.04 mg/ml). An allergy specialist injected 0.02 to 0.03 ml of the solution with a 30G hypodermic needle and then read the skin test, with reference to positive and negative controls, at 15 minutes. These concentrations are based on local practice and are consistent with that recommended by European Network on Drug Allergy and Drug Allergy Interest Group of the European Academy of Allergy and Clinical Immunology (ENDA/EAACI) with the exception of rocuronium (20% of the ENDA/EACCI concentration).
An estimate of the comparative risk using the novel method was determined based on patterns of polyreactivity as outlined above in ‘Theoretical foundations and hypothesis’. Error propagation for the estimate was assessed using bootstrap analysis. The bootstrap distribution of estimates of risk using the novel method was calculated after random sampling with replacement. The first step was to calculate the risk from this resample. This resampling procedure was repeated 10,000 times, the risk calculated using the novel method for each, and the estimates used to generate a distribution plotted as a histogram. The interval containing 95% of the estimates was then determined.
Our second hypothesis was further evaluated by comparing the risk estimates of rocuronium to vecuronium hypersensitivity as determined by the novel method with those derived from PEM methods in other regions. PEM estimates from other regions were discovered through a structured literature review. Search terms were ‘NMBA anaphylaxis’, ‘Rocuronium Anaphylaxis’, ‘Vecuronium anaphylaxis’ and ‘Incidence of anaphylaxis to muscle relaxants’. Inclusion criteria required a published date after the year 2000, and a published rate of anaphylaxis to both rocuronium and vecuronium, adjusted for population exposure. The adjustment could be based on direct measures of exposure or proxies, such as ampoule sales. Only unique patient cohorts were considered to prevent resampling.
PEM estimates were summarised using the range, the median value and interquartile range to estimate the variability around the median of estimates.
The trial was approved by the Sir Charles Gairdner and Osborne Park Health Care Group Human Research Ethics Committee from a previously approved, registered database. All patients gave informed consent for entry of data into the database. The trial was registered with the Australian New Zealand Clinical Trials Registry, record 383307.
Results
Between January 2000 and January 2021, 228 patients reviewed in the WAADRC were diagnosed with perioperative hypersensitivity to either rocuronium or vecuronium. Rocuronium was the causative agent in 204 of these, and vecuronium in 24. Seventy-nine patients were hypersensitive to both agents, and 149 patients were hypersensitive to only one agent on skin testing.
Characteristics of subjects according to cause of hypersensitivity were similar except patients referred after rocuronium hypersensitivity were more likely to be older (48 vs. 39 years, P = 0.02) and less likely to be polyreactive on skin testing (31% vs. 67%, P < 0.001; see Table 1). The group of patients reactive to both agents (polyreactive) had a higher proportion that were female (85% vs. 71%, P = 0.03) and a higher average mast cell tryptase concentration (45 vs. 30 µg/l, P = 0.03), although measures of clinical severity were similar.
Demographic characteristics according to the trigger of the clinical hypersensitivity episode. Continuous data were analysed using Student’s t-test, while categorical data comparisons were by the chi-square test.
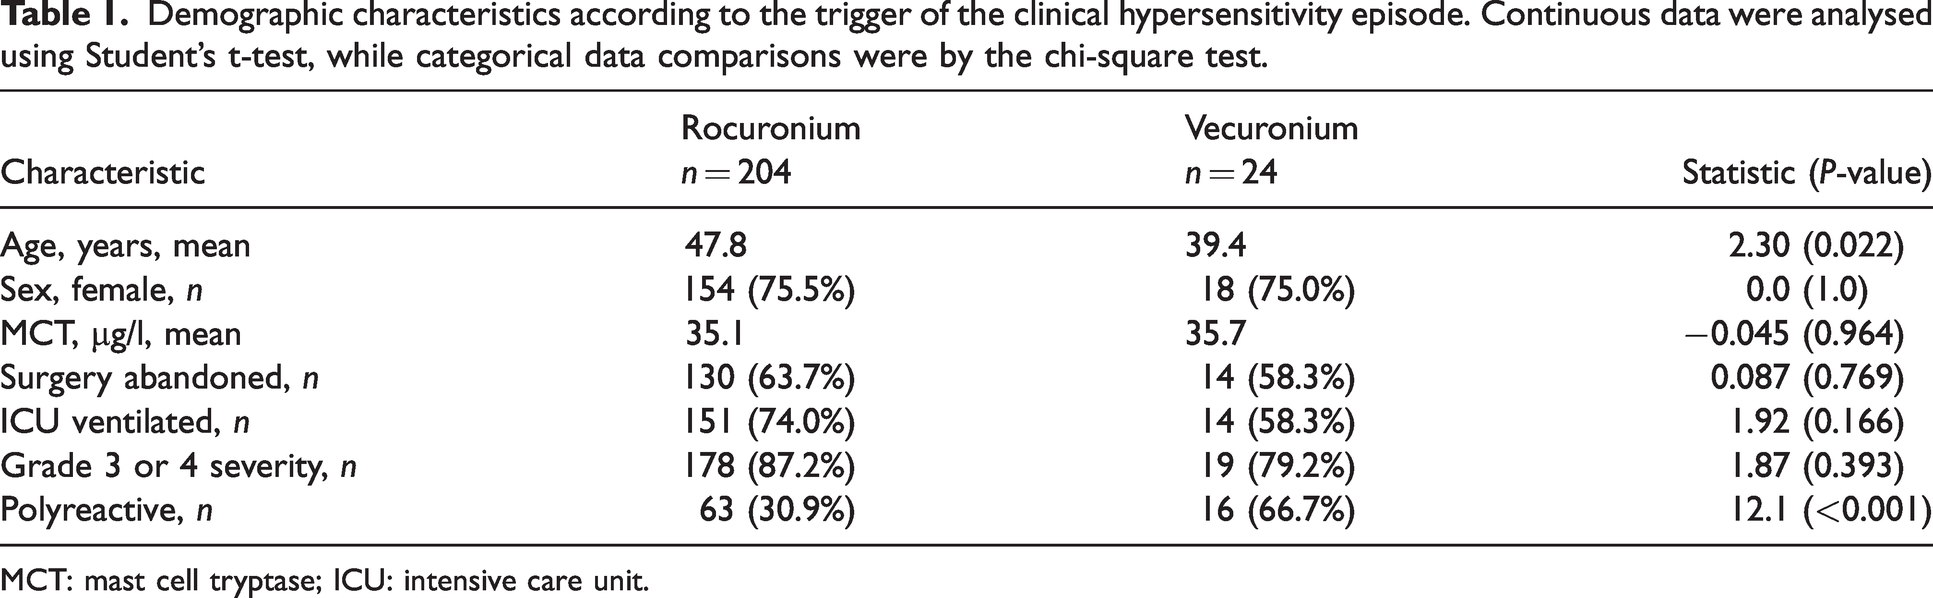
MCT: mast cell tryptase; ICU: intensive care unit.
Comparison of the novel estimate of relative exposures for 2000 to 2007 and 2007 to 2021 with annual PEM estimate from 2007 to 2011
Annual sales data for vecuronium (4 mg and 10 mg ampoules) and rocuronium (50 mg ampoules) in WA for the years 2007 through to 2011 were used to estimate relative exposures to each drug. There was an increase in rocuronium use over the five-year period (from 52,000 to 67,000 doses per year) and a reduction in vecuronium use (from 34,000 to 28,000 doses per year; see Figure 2). The total number of doses for rocuronium was 280,710 and for vecuronium was 160,205 (ratio 1.75:1). The ratio of doses of rocuronium to vecuronium from 2007 to 2011 increased 1.6-fold from 1.5:1 to 2.4:1. In South Korea, the ratio of doses of rocuronium to vecuronium from 2005 to 2013 increased 2.6-fold from 0.7:1 to 1.8:1.
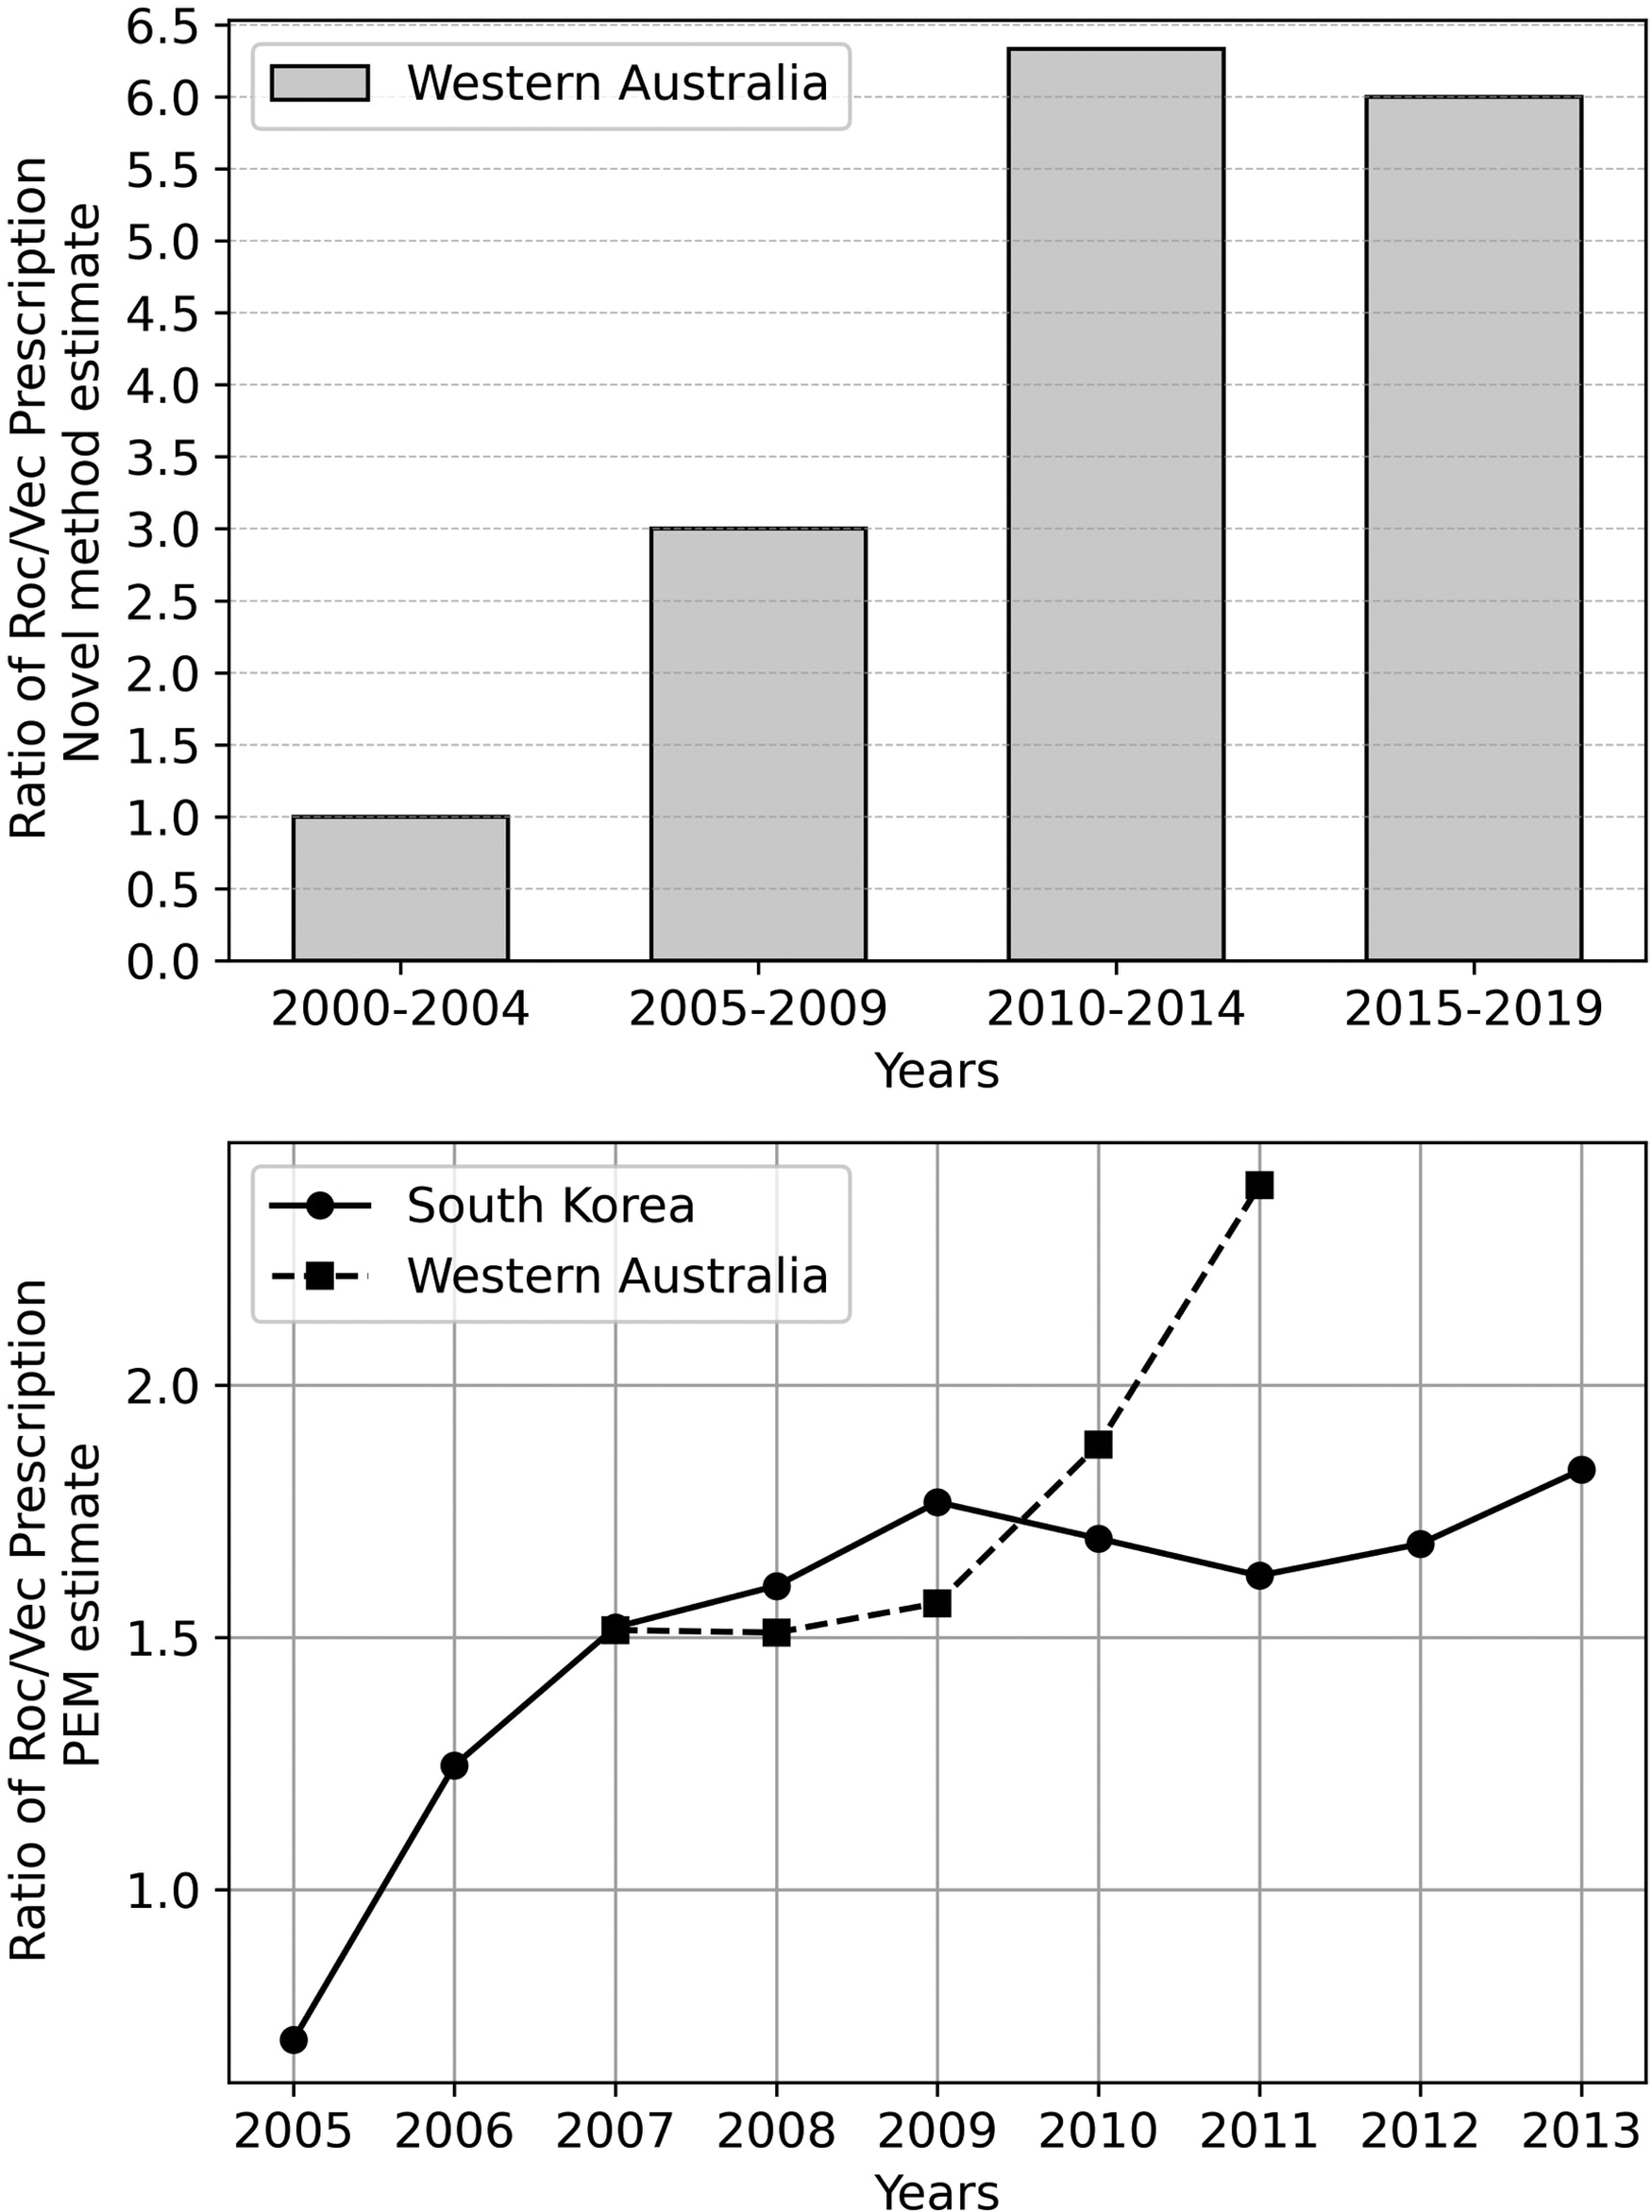
The upper graph plots the novel method estimate of relative prescription of rocuronium to vecuronium, considered over each of four five-year epochs. The lower graph plots the annual prescription ratio of rocuronium to vecuronium over nine years for which data are available in Western Australia and South Korea. Data are adapted from Sadleir et al. 1 and Cho et al. 6
The estimate of relative exposure of rocuronium to vecuronium using the ratio of hypersensitivity reactions caused by each agent in polyreactive patients over the entire 21-year period was 63/16, or 3.9:1. Over the period 2005 to 2009 it was 3:1 and over the period 201 to 2014 it was 6.3:1, representing a 2.1-fold increase from the first period to the second. Using five-year epoch bins, the relative exposure to rocuronium increased over the 21-year period (see Figure 2).
Novel estimate of comparative risk of hypersensitivity compared with PEM estimate from WA
Of the cases where rocuronium was confirmed as the primary trigger, 63 were hypersensitive to both agents on skin testing and 141 were not. Twenty-four patients suffered vecuronium hypersensitivity. Of these, 16 were also hypersensitive to rocuronium and eight patients were not.
The calculated comparative risk for rocuronium compared with vecuronium, corrected for exposure rates inferred from proportions of triggering agents for polyreacting agents, was 2.2. Bootstrapping analysis indicated that a 95% confidence interval of the estimate is 1.7 to 2.8 (see Figure 3).
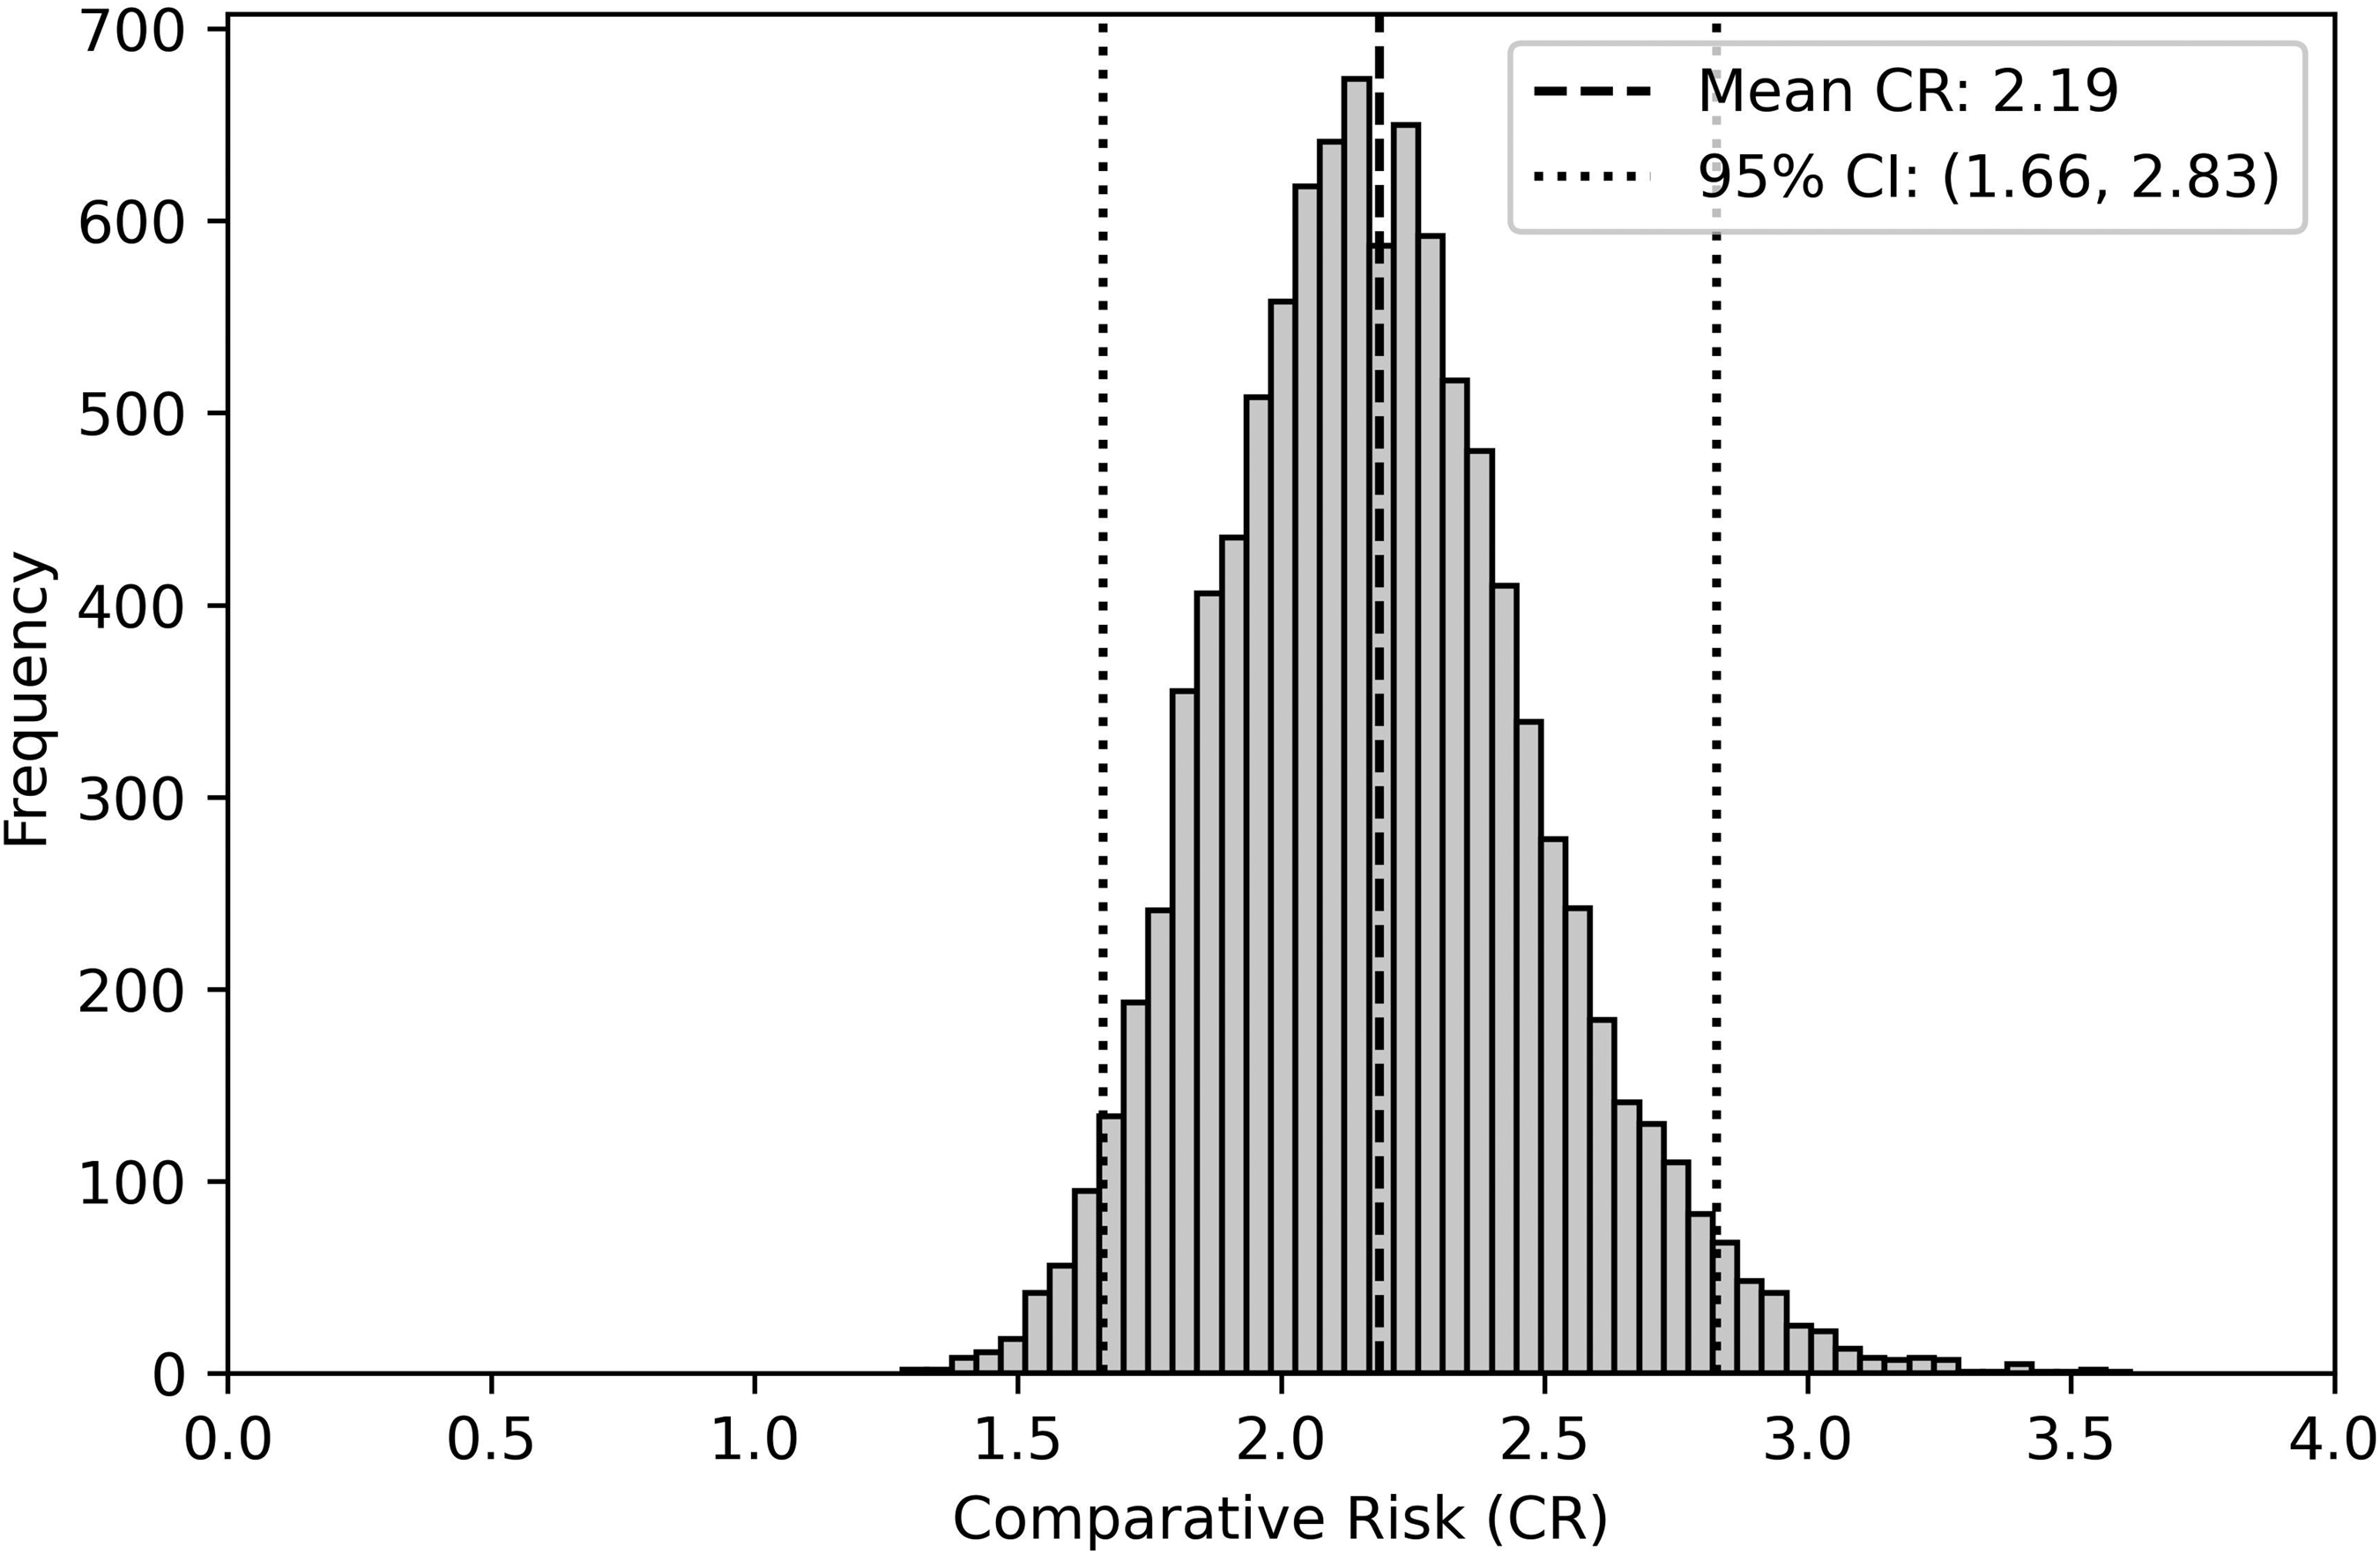
Histogram of 10,000 bootstrap estimates of relative risk of rocuronium versus vecuronium hypersensitivity. The histogram shows the distribution of the bootstrapped comparative risk (CR) estimates. The dashed and dotted lines indicate the mean CR and the bounds of the 95% confidence interval (CI). Most of the values from the histogram lie within the 95% CI, which is expected.
The estimate of comparative risk of rocuronium to vecuronium based on cases of hypersensitivity between 2007 and 2011 divided by exposure based on ampoule sales over the same period was 3.0:1. 1 There were five cases of vecuronium anaphylaxis from an estimated 160,205 doses, and 26 cases of rocuronium anaphylaxis from 280,710 doses.
Estimate based on PEM
A PubMed search identified 343 research articles, of which eight met the inclusion criteria and were included in analysis.
Laxenaire et al. compared the rates of rocuronium and vecuronium anaphylaxis in France over a 24-month period using ampoule sales corrected for average number of vials used per anaesthetic. 7 They found that although vecuronium had a larger market share from 1997 to 1998 in France, rocuronium caused more cases of anaphylaxis (98 vs. 59), and that the risk of rocuronium anaphylaxis corrected for market share was 1.91 times that of vecuronium.
Mertes et al. compared the rate of rocuronium and vecuronium anaphylaxis in France over the next 24-month period of 1999 to 2000. 8 Again, rocuronium caused a larger number of cases of anaphylaxis (132 vs. 26), and the risk of rocuronium anaphylaxis corrected for market share (8.8% vs. 11.3%) was 6.5 times that of vecuronium.
Laake and Rottingen compared the rates of rocuronium (29 cases) and vecuronium anaphylaxis (three cases) in Norway over the period of 30 months from 1997 to 2000. 9 They found that rocuronium had a rate of anaphylaxis of 19.3 per 100,000 exposures, while vecuronium had a rate of 4.6 per 100,000 exposures. The risk of rocuronium anaphylaxis was 4.2 times that of vecuronium when corrected for exposure rate.
Bhananker et al. compared the rates of Food and Drug Administration Adverse Event Reporting System reports for ‘anaphylactic reaction’ or ‘anaphylactic shock’ in the US between 1999 and 2002. 3 They found 23 US reports for rocuronium, compared with 13 for vecuronium. Ampoule sales for 1999 to 2002 indicated that rocuronium was used 1.5 times as frequently as vecuronium. The risk of rocuronium anaphylaxis was 1.2 times that of vecuronium when corrected for exposure rate.
Brereton and Russell audited 10 years of data from South Australia between 2000 and 2009 to compare the rates of rocuronium and vecuronium anaphylaxis. 2 They found 23 cases of rocuronium anaphylaxis and one case of vecuronium anaphylaxis. The relative market share was 38% and 20%, respectively, giving a risk of rocuronium anaphylaxis 14.4 times that of vecuronium anaphylaxis.
Sadleir et al. audited five years of data from WA between 2007 and 2011. 1 These cases have also been included in the current study dataset. We found that rocuronium was responsible for 26 cases of anaphylaxis, while vecuronium was responsible for five. The market share (corrected to an equivalent dose) over that period for an intermediate-acting NMBA was 49% for rocuronium and 28% for vecuronium. The risk of rocuronium anaphylaxis after correction for market share was 3.0 times that of vecuronium.
Cho et al. compared the risk of rocuronium and vecuronium anaphylaxis at two tertiary hospitals in South Korea over a nine-year period between 2005 and 2014. 6 They found 16 cases of rocuronium anaphylaxis and two cases of vecuronium anaphylaxis. The market share of rocuronium over the period was 58% and 38% for vecuronium, giving a risk corrected for exposure to rocuronium that was 5.2 times that of vecuronium.
Petitpain et al. compared the risk of rocuronium and vecuronium anaphylaxis in France between 2000 and 2012. 10 Some of these patients had previously been reported in biennial reports, and these smaller reports were excluded to avoid resampling. Petitpain et al. found 156 cases of rocuronium anaphylaxis and 34 cases of vecuronium anaphylaxis, which, when corrected for exposure rates (rocuronium 0.48 times that of vecuronium), found a risk of rocuronium anaphylaxis that was 9.5 times that of vecuronium.
The range of estimates was for the risk of rocuronium hypersensitivity to be between 1.2 times and 14.4 times more likely than vecuronium (see Figure 4). The median value is 4.7, with the novel estimate of 2.2 being within the interquartile range of comparative risk estimates from the literature review (weighted interquartile range 2.18–8.75).
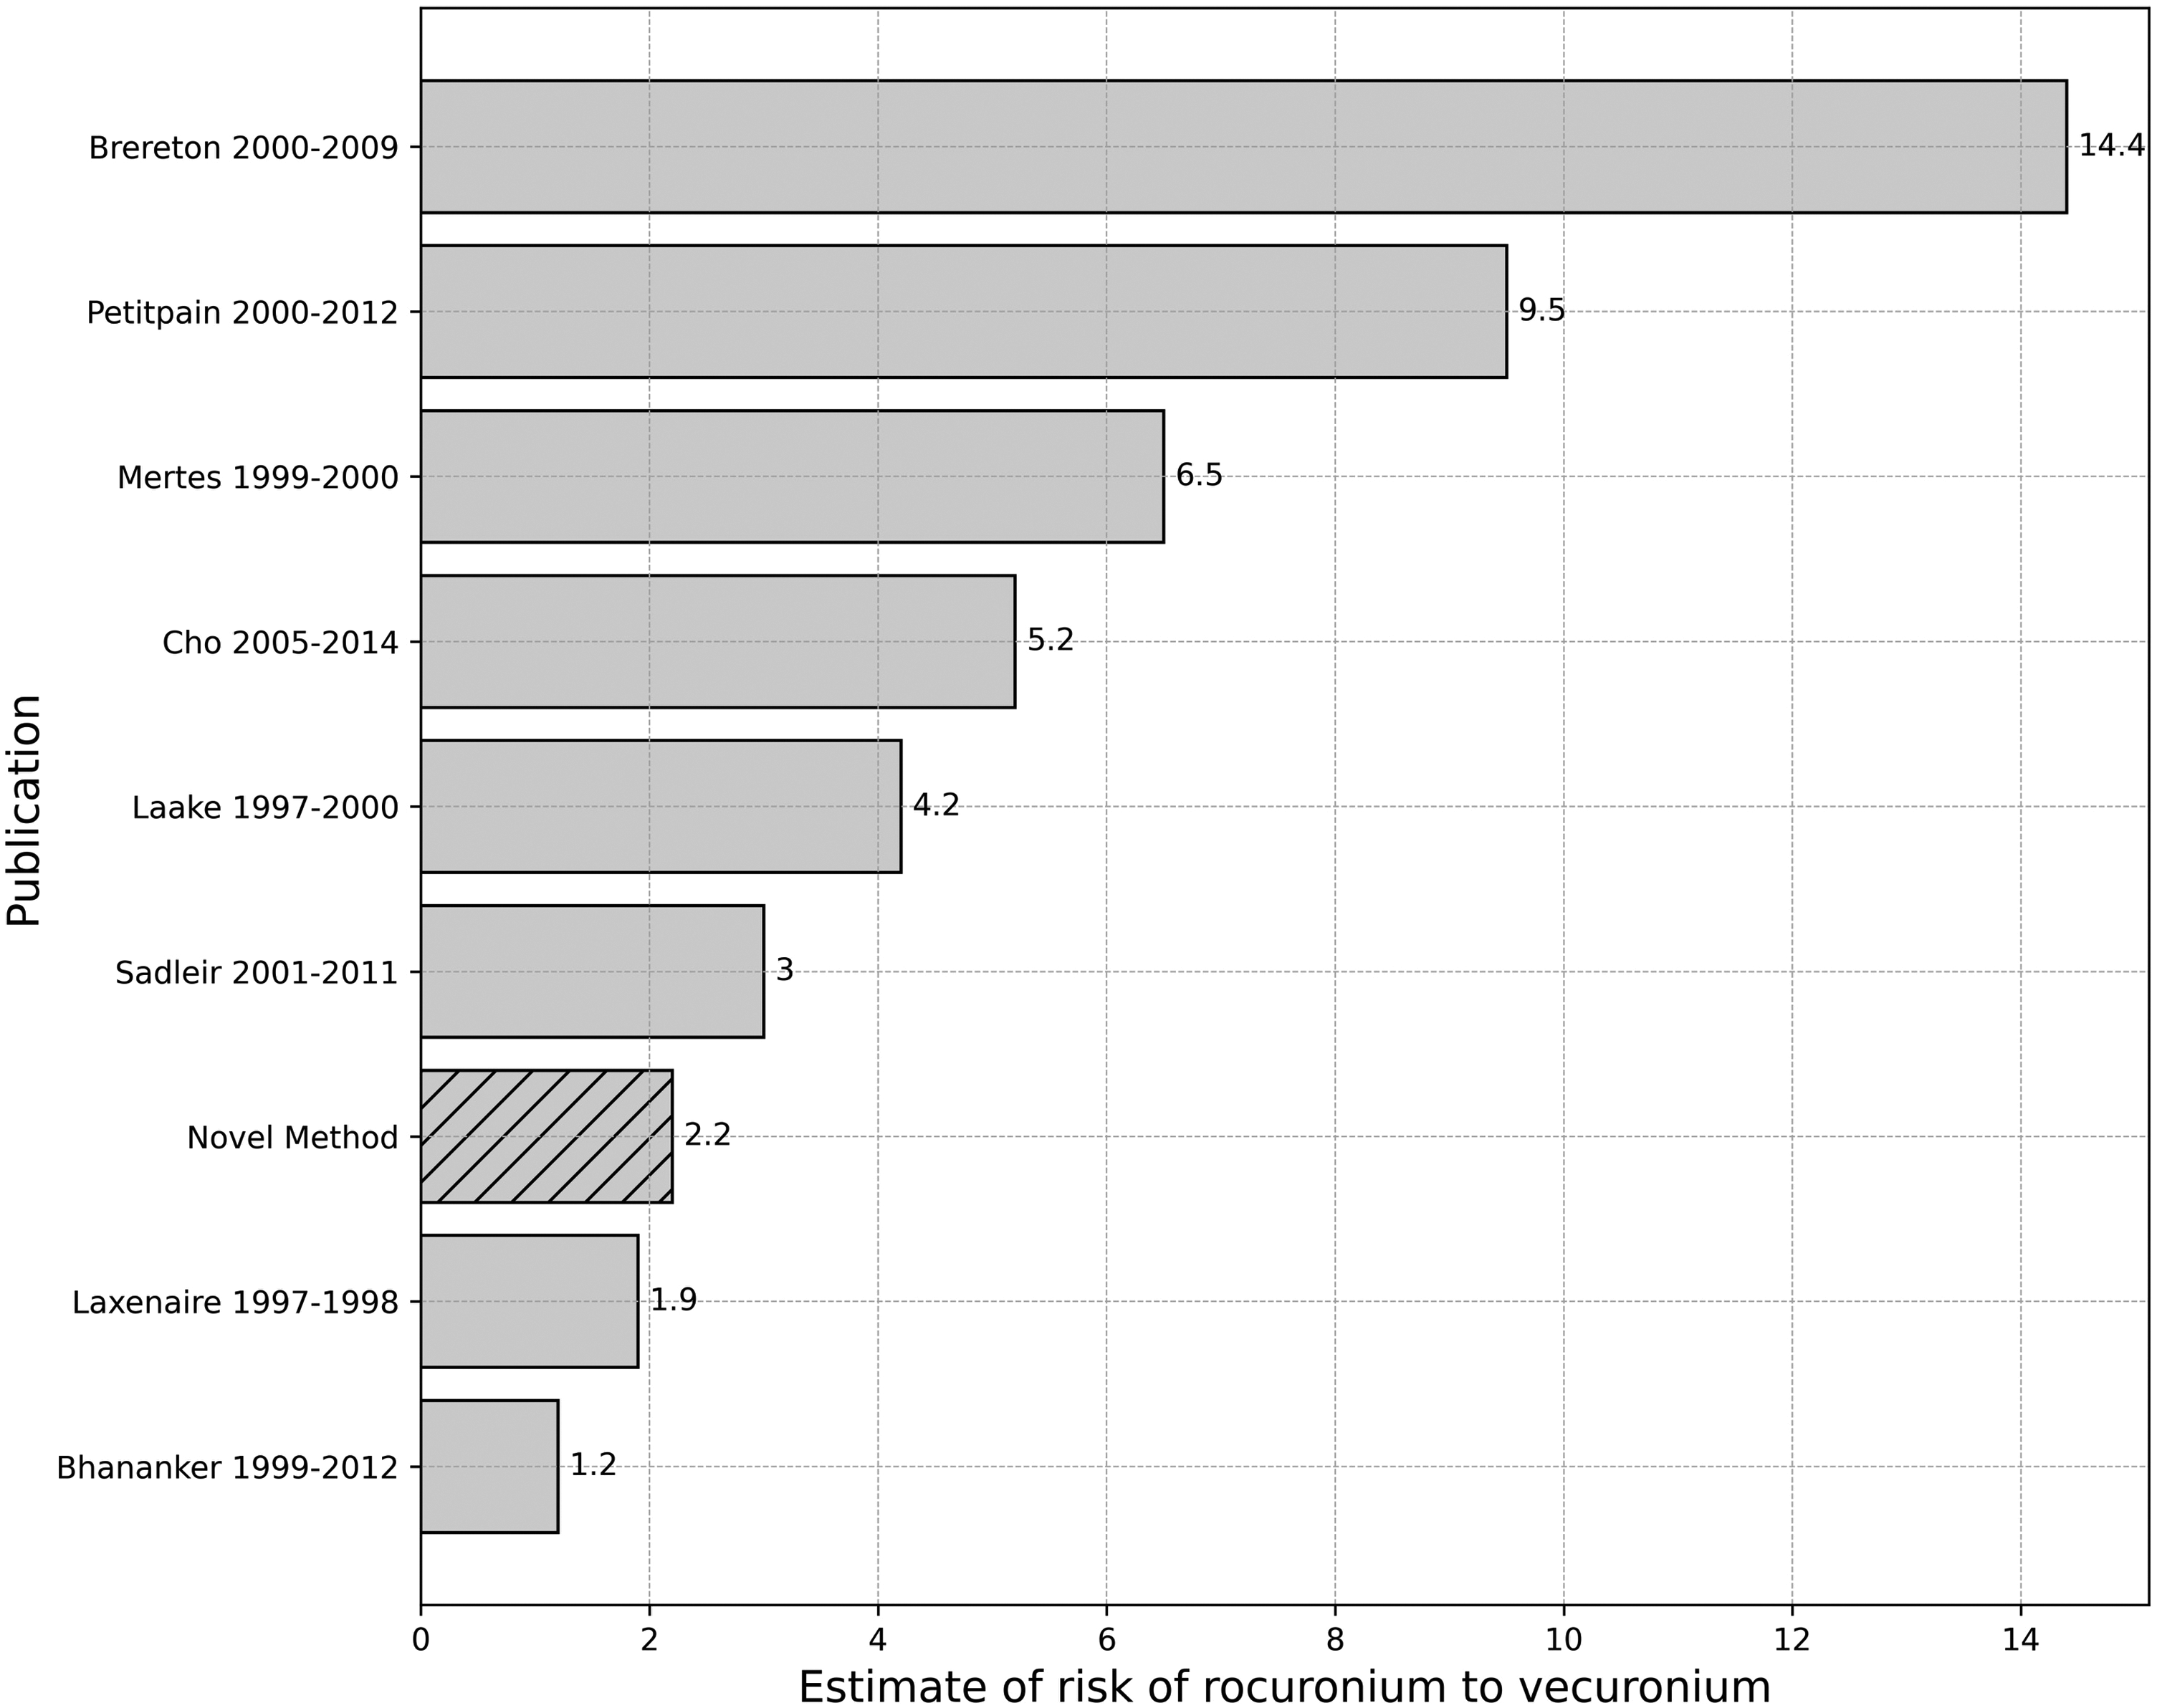
Summary of estimates for comparative risk of rocuronium hypersensitivity to vecuronium hypersensitivity for the eight research articles which met inclusion criteria, and the novel method estimate.
Discussion
We have described a new approach to calculate the relative rate at which two drugs are prescribed in a population by analysing the observed hypersensitivity reactions in patients who are found to be polyreactive to both drugs. This method allows for an estimate of the comparative risk of hypersensitivity to each drug per administration, by correcting the overall ratio of cases of hypersensitivity reactions to either drug given differences in estimated prescription rates. The approach presupposes that individuals experiencing a hypersensitivity episode and identified as polyreactive through skin testing reflect a similar drug prescription pattern to that of the broader population. This technique is applicable across a wide range of substances, including cross-reacting allergens, co-reacting allergens or non-allergic adverse effects, provided a subset of the population is susceptible to such effects upon administration of either drug and this polyreactivity can be identified.
We have also demonstrated that the method can assess the relative risk of hypersensitivity to cross-reacting drugs between different time periods or populations. The technique may also be used to investigate the relative risk between cross-reacting allergens when a third variable—for example, a sensitising agent specific to only one of the cross-reacting allergens—is varied. It may be generalisable to more than two cross-reacting drugs.
With respect to rocuronium and vecuronium, we found that estimates of prescription rates from 2005 to 2009 and 2010 to 2014 in WA based on polyreactive cases of hypersensitivity suggest a similar increase in rocuronium prescriptions compared with vecuronium prescriptions as ampoule sales estimates did from 2007 to 2011. The relative prescription rate of rocuronium and vecuronium from chart review of patients with cephazolin anaphylaxis in WA from 2012 to 2020 estimated that rocuronium was administered 4.9 times as frequently as vecuronium. This was very similar to our estimate based on polyreactive cases from 2015 to 2019 of 6.0 times. 11
The comparative risk of hypersensitivity per prescription over the 21-year period for rocuronium was 2.2 times that of vecuronium, and this estimate is similar to the 2.97 times generated from cases and ampoule sales from 2007 to 2011. The confidence interval of the novel estimate was determined using bootstrapping with 10,000 resamples. As the comparative risk calculation involves several components, each with its own error, an assessment of error propagation or statistical error associated with multiple inputs into a formula is necessary. Bootstrapping is considered an appropriate method of assessment of error propagation for non-linear formulae, and the primary benefit of bootstrapping is that it makes no strong parametric assumptions and is particularly useful when the theoretical distribution of the statistic is complex or unknown. 12 The 95% confidence interval generated includes the estimate previously made by consideration of cases and ampoule sales in WA.
Previous estimates of rates of cross-reactivity amongst muscle relaxants include claims of up to 60% of cases. 13 Harper et al. described a 33.3% cross-reactivity rate for rocuronium through both intradermal and skin prick testing. 4 In our findings, we observed a similarly low rate of cross-reactivity for rocuronium (31%). It is evident that the lower the rate of cross-reactivity, the greater the potential benefit of substitution with the cross-reacting pair. Conversely, a higher rate of cross-reactivity (as is the case when we consider vecuronium cases, which cross-reacted in 67%) indicates that the excess risk is lower. If an agent cross-reacted in 100% of cases, substitution would not change the prevalence of disease.
Female sex was more common than male in polyreactive patients despite an equal sex distribution between the two groups suffering hypersensitivity reactions to either drug. Whether this is a consequence of known sex differences in immune responses secondary to sex hormones or a consequence of a confounding sensitising agent that is associated with both sex and polyreactivity is unknown. Peak mast cell tryptase levels were higher in polyreactive patients, although measures of clinical severity were similar.
It is important to consider potential errors associated with the novel method. If there were a systematic error in skin testing that resulted in failure to identify polyreactive patients and this affected one drug only, the estimate for relative prescription rates would be underestimated for this drug. This would result in an overestimation of the relative risk attributed to this drug per administration. There is therefore an opportunity to use this method to detect a deficiency in the sensitivity of a diagnostic test by finding a difference between the prescription rate assessed by this method and that found by an alternative, such as count of prescriptions. There is no reason why other indicators of cross-reactivity (such as basophil activation tests to specific drugs) could not be used as the marker of mono- or cross-reactivity if their diagnostic sensitivity and specificity exceeded that of skin testing.
Estimates of the relative number of prescriptions of two drugs by PEM are also prone to errors. Accurate estimates require a complete record of administrations whereas an estimate of the relative prescription using the proportional hypersensitivity trigger in polyreactive patients can be made with knowledge only of a sample of polyreactive patients. It does not matter if not all polyreactive patients are captured, only that any inequality in the number of hypersensitivity reactions to each of the two drugs in polyreactive patients is a consequence of inequality in prescription rates. It is assumed that there is no difference in the prescription rate for these patients compared with the remainder of the population, and so any inequality should be able to be generalised to an inequality in prescription rates for the whole population. This is a reasonable assumption as there is no known factor that increases the risk of anaphylaxis to an individual NMBA over the alternatives. However, confounding is still a possibility. Female sex was more common in polyreacting patients, and if females were more likely to be prescribed rocuronium than males (for example, because of a higher risk of aspiration), then this could result in an overestimate of the comparative prescription rate for rocuronium. The rate in the polyreactive group would no longer be representative of the rate for the whole population (who would have received a lower rate of rocuronium prescription). The estimate for comparative risk of rocuronium (versus vecuronium) would therefore be less than the true population risk by this method. Future surveys should include a thorough analysis of the demographic characteristics of polyreactive patients, and these should then be compared with subjects of the broader population to exclude potential confounding factors.
Whether a particular NMBA is more likely to cause anaphylaxis in particular populations has been investigated for over 20 years and is an important clinical issue. Whether it is even possible to answer the question has also been called into doubt. 13 The major cause of confusion has been whether increasing anaphylaxis cases to a particular agent reflect increased risk or are proportional to increasing exposure rates. We now have a new method of determining the comparative risk of individual NMBAs, and this paper supports previous publications by our group and others suggesting that rocuronium is associated with a higher rate of anaphylaxis than vecuronium.
Soon after the introduction of rocuronium to Australia in 1996, concerns were raised that it had a higher risk of anaphylaxis than alternative intermediate-acting NMBAs. In response, Rose and Fisher compared the proportional rate of anaphylaxis for market share between rocuronium and a composite of all other NMBAs between 1997 and 1999 in New South Wales, finding no appreciable difference in risk. 13 They qualified this conclusion stating that the study was underpowered and likely required a study of over 30 million patients (greater than the population of Australia at the time).
Sadleir et al. repeated a prescription-event analysis using cases of anaphylaxis from 2002 to 2011 in WA, and an estimate of prescription using market share over the latter five years of this interval. 1 The relative risk of anaphylaxis per ‘dose’ sold of rocuronium was 3.0 times that of vecuronium. Fewer assumptions to derive prescription rates were adopted in subsequent studies in New Zealand and South Korea. Reddy et al. estimated prescription rates from electronic anaesthetic records, finding the risk of rocuronium anaphylaxis to be one in 2499, with no cases of vecuronium anaphylaxis despite 9585 exposures. 5 Cho et al. also used an electronic medical record system database of prescriptions to determine a relative rate of rocuronium anaphylaxis that was 5.4 times that of vecuronium. 6
It is clear from these diverse methods applied to populations in a variety of geographic locations that rocuronium has a substantially higher risk of perioperative anaphylaxis than vecuronium, although the absolute risk is low. The next question is whether we should stop using rocuronium. On a population scale, the allergological consequence of changing from rocuronium to vecuronium will be to see a substantial reduction (possibly a halving) of the number of cases of NMBA anaphylaxis. NMBA or antibiotic anaphylaxis account for the majority of cases of perioperative anaphylaxis, itself the leading cause of anaesthesia-related death in the surgical population. This would have to be balanced against the perceived benefit of rocuronium use, which is an onset of action that is more rapid at high doses than vecuronium. Whether this confers a significant benefit in the era of modern supraglottic airways and videolaryngoscopes is uncertain. Rescue reversal with sugammadex may not be reliable in a ‘can’t intubate, can’t oxygenate scenario’, 14 and reversal prior to emergence has only been shown to confer a clinically-relevant benefit in a subset of patients. When rocuronium is used in favour of vecuronium, it would be helpful for subsequent investigating allergologists if the treating clinician clearly documented their reason for choosing rocuronium in that particular patient. We believe there is scope for a reduction in rocuronium prescriptions without altering outcomes related to onset and offset of neuromuscular blockade. There will be a meaningful improvement in outcomes related to hypersensitivity as a result.
It is important that reduced prescription of rocuronium use does not have unintended consequences. Substitution with an alternative agent with a rapid onset, such as suxamethonium, is likely to increase the population incidence of NMBA anaphylaxis. Estimates of the risk of suxamethonium anaphylaxis by the novel method are higher in the three regions of Australia in which data have been published, and this is consistent with an estimate made by researchers in New Zealand 5 (see Table 21,2,5,15).
Comparative risk of suxamethonium and rocuronium anaphylaxis estimated by application of the novel method to previously published patient cohorts.
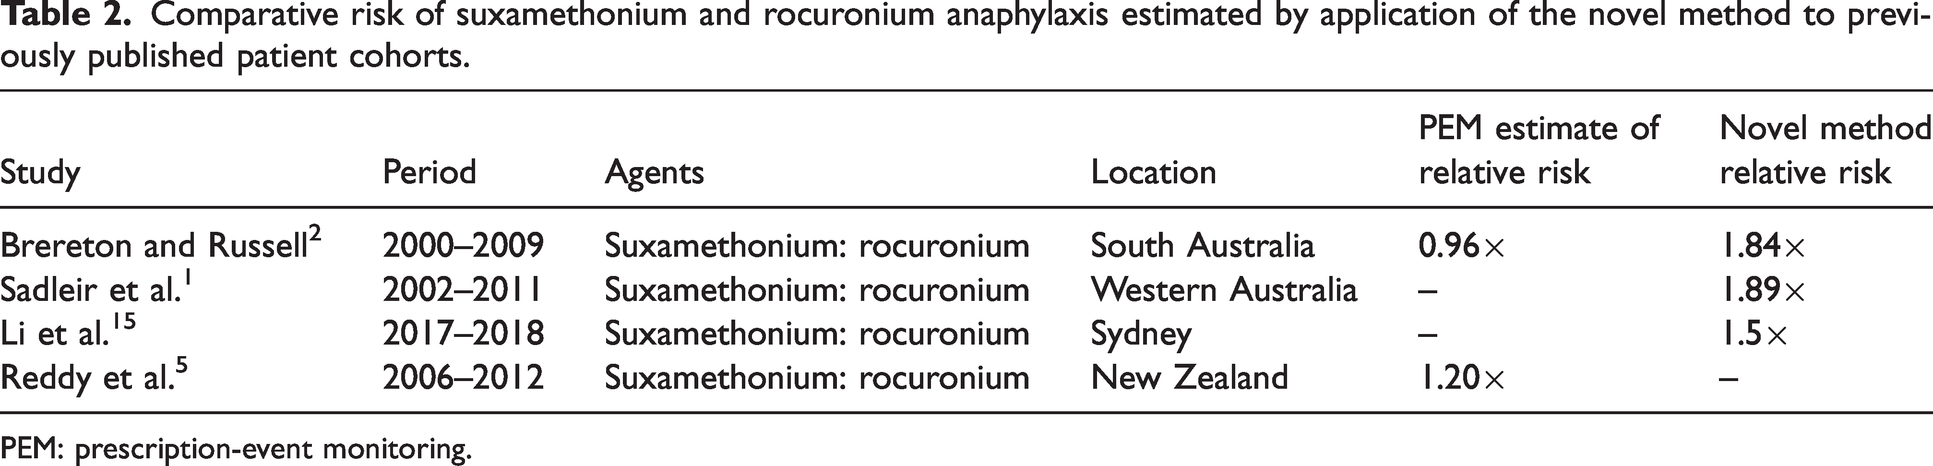
PEM: prescription-event monitoring.
The novel method may also be used for other cross-reacting allergens, such as platinum chemotherapy agents, and from readily available cross-reactivity data in research articles. Pasteur and colleagues published cross-reactivity rates for oxaliplatin and carboplatin at a hospital in France between 2002 and 2016, finding that 45% of 51 patients with hypersensitivity to oxaliplatin cross-react to carboplatin, whereas only 37% of 43 patients with carboplatin hypersensitivity cross-react to oxaliplatin. 14 The inferred market share is determined by the triggered ratio of patients reacting to both platinum chemotherapy agents. In this case, out of 39 polyreacting patients, the majority reacted to oxaliplatin, with a ratio of 23:16. Therefore, although the majority of cases of anaphylaxis seen were to oxaliplatin, we infer that it is prescribed 1.4 times as commonly as cisplatin, and so the risk of anaphylaxis is 0.83 times less.
In summary, we have demonstrated the effectiveness of a new technique for estimating the comparative risk of a side-effect in a population where some individuals are susceptible to the side-effect with either agent. It has confirmed the observation that rocuronium is associated with a higher risk of anaphylaxis than vecuronium, but has a lower risk than suxamethonium. This method has applicability beyond NMBA anaphylaxis to other allergic phenomena and non-allergic side-effects.
Footnotes
Author Contribution(s)
Declaration of conflicting interests
The author(s) declared no potential conflicts of interest with respect to the research, authorship, and/or publication of this article.
Funding
The author(s) received no financial support for the research, authorship, and/or publication of this article.