
Abstract
Obstetric surgical suites differ from most inpatient surgical suites, serving one specialty, and often small. We evaluated long-term capacity planning for these operating rooms. The retrospective cohort study included all caesarean births in three operating rooms over 28 years, 1994 through 2021, plus all other obstetric procedures over the latter 19 years. We calculated the obstetric anaesthesia activity index, 0.5 × neuraxial labour analgesia placement + 1.0 × caesarean births. Annual caesarean births from one year to the next had a Pearson linear correlation coefficient of 0.993. Therefore, linear regression can be used for long-term capacity planning. However, the difference between 0.9 and 0.1 quantiles in weekly caseloads was greater than tenfold larger than the annual rate of growth in births per week. Therefore, clinicians likely would be unable to distinguish, by experience, between growth versus being busy due to variability, suggesting value of the modelling. Over 19 years, the fraction of the obstetric workload from caesarean births was unchanging, Pearson correlation coefficient of 0.04. Therefore, use of the obstetric anaesthesia activity index to judge changes in workload was appropriate. The annual total for the index increased linearly, Pearson correlation coefficient of 0.98, supporting validity of the finding that long-term capacity can be planned with linear regression. The difference between 0.9 and 0.1 quantiles in weekly totals of the index exceeded annual rate of growth, supporting validity of the finding that variability week to week is very large relative to growth. These results help decision-makers ensure that operating rooms and staff meet referring hospitals’ needs.
Keywords
Introduction
Obstetric surgical suites differ from most inpatient surgical suites, serving a single specialty, and often small (e.g. one to three operating rooms). Unlike most single-specialty facilities (e.g. ophthalmology surgery centres), many cases are urgent. Our interest is how to do long-term capacity planning for operating rooms within obstetric surgical suites. This is especially relevant for centres serving as sites receiving obstetric patients who would otherwise receive care at small rural hospitals, including those performing few if any caesarean deliveries. 1 For example, the studied hospital is the sole anaesthesia training department and university hospital in the rural US state of Iowa. 1
Our hypothesis 1 was that like large inpatient surgical suites,2,3 annual caseloads of obstetric surgical suites can be modelled using linear regression. If the hypothesis were supported, the finding would be useful, because binning by year (i.e. analysing the annual totals) reduces variability compared to using shorter intervals (e.g. monthly totals), making forecasts interpretable and graphs convenient for communication purposes.
Our hypothesis 2 was that variability in caseload among weeks was large, at least twice the annual growth. 4,a Previously, we examined decades of growth at the hospital with the greatest rate of growth (i.e. in units of surgical cases per year) among hospitals in two US states. 5 Although there was a near perfect linear plot from one year to the next when binned by year,2,3 there was substantial variability around the annual regression line when plotted by four-week periods. 3 For inpatient surgical suites, the use of four-week periods was suitable because most cases were scheduled a few weeks in advance of the date of surgery. 3 In contrast, most caesarean births are unscheduled. 6,b Therefore, when binning by week, we expected even greater variability around the linear regression line. If this hypothesis is supported, clinicians likely would be unable to distinguish, by experience, between one-year growth versus variability in caseloads from week to week. 7
Methods
The University of Iowa Institutional Review Board determined that this project (no. 202201428) does not meet the regulatory definition of human subjects research.
All years of anaesthesia department billing data available at the time of the start of the current study, from the large teaching hospital studied, were used for this retrospective cohort study. For caesarean births, 28 years were studied (1994 through 2021), each with three obstetric operating rooms in use. (As context, in 2021, the studied hospital had 2709 births, 2806 infants. The caesarean delivery rate was 33%, with 38% of those elective. Excluding those elective caesarean births, approximately 71% of women experiencing labour utilised neuraxial labour analgesia.) During the studied period, statewide annual births were unchanged, 6 but more than 20 rural hospitals closed their obstetric units (see Discussion section). 8 Cases were identified from the billing database using the anaesthesia current procedural terminology (CPT) 01961 and 01963, and their corresponding matched healthcare common procedure coding system (HCPCS) codes. As sensitivity analyses, we also included neuraxial labour analgesia and other obstetric procedures, for the 19 years from 2003 through 2021. For neuraxial labour analgesia, we used anaesthesia CPT 01967. The other obstetric procedures (e.g. anaesthesia for external cephalic version) were those with anaesthesia CPT 01958 and 01960. We calculated Ginosar and colleagues’ obstetric anaesthesia activity index, equal to 0.5 × neuraxial labour analgesia placement + 1.0 × caesarean births.9,10
Statistical analyses were performed using Stata v17.0 (StataCorp, College Station, TX, USA). Caesarean births were analysed both by year and by week using regular least squares linear regression. Caesarean births were also analysed by week using quantile (median) regression, with standard errors calculated using 1000 bootstrap replications. These two results were used for testing for the presence of a linear rate of growth over multiple years (hypothesis 1). 2 Quantile regression is insensitive to outliers and, with bootstrapping, also insensitive to unequal variances among years (heteroscedasticity). We binned by week instead of day because caesarean births and other obstetric anaesthesia workload varies among days of the week. 11
For assessment of variability among successive weeks in caesarean births, the change over time in the difference between the 0.9 quantile and 0.1 quantile of weekly caesarean births was analysed using interquantile regression. With interquantile regression, the modelled dependent variable was the difference between quantiles. The standard errors were calculated using 1000 bootstrap replications. The standard error for the prediction of the difference in quantiles at the end of 2021 was calculated using the delta method. The width of the interval (0.9 quantile minus 0.1 quantile) and confidence intervals (CIs) addressed hypothesis 2, substantial variability week to week in caesarean births. The 0.9, 0.5, and 0.1 quantiles of weekly caesarean births, shown in the figures, were estimated using simultaneous quantile regression, again with standard errors estimated using 1000 bootstrap replications. 12,c
We used 100% of the caesarean births over the 28-year interval, not a statistical sample. Because statistical power analysis was not performed before data collection, to be conservative, we treated P < 0.01 as statistically significant and used 99% two-sided CIs. Following Cohen, we considered the Pearson correlation coefficient to be large if the lower two-sided confidence limit exceeded 0.50. 13
Results
During the 28 successive years, the annual caesarean births increased linearly (Figure 1). The large Pearson correlation coefficient of 0.993 (99% CI 0.980 to 0.997) shows that linear regression was suitable for predicting annual caseload from one year to the next (N = 14,799). Thus, hypothesis 1 was supported.
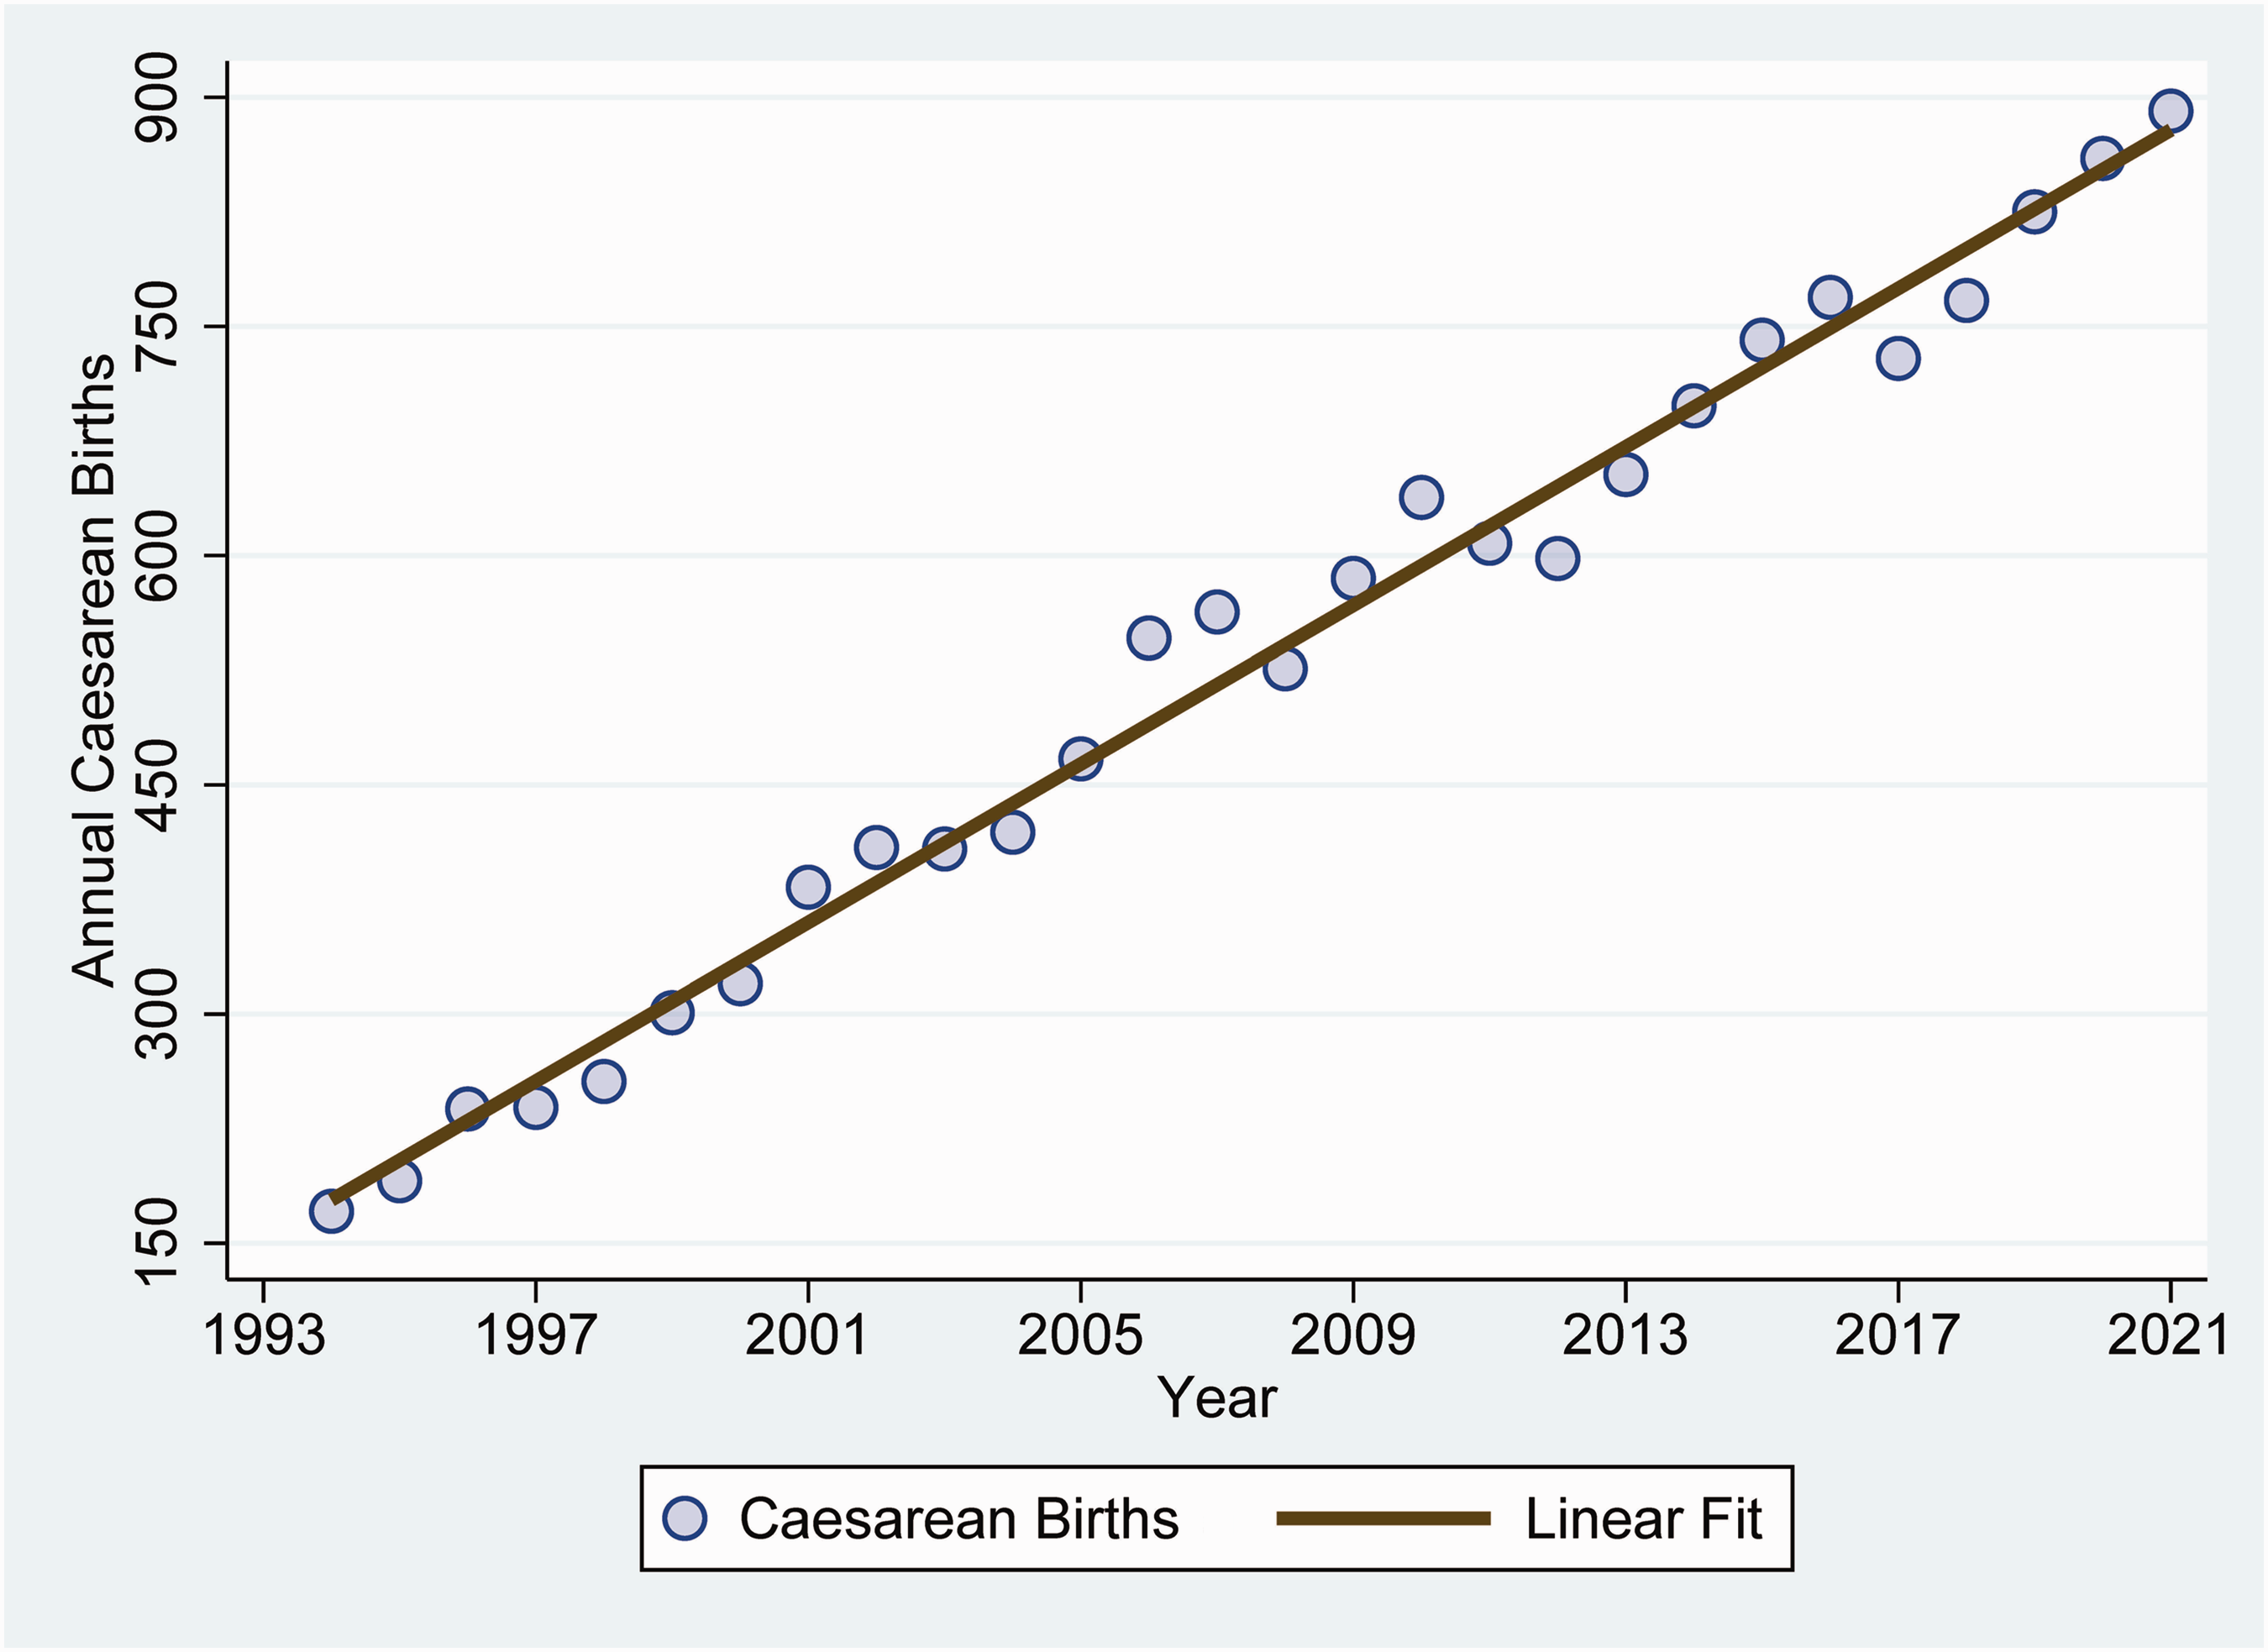
Annual increase in caesarean births at the large teaching hospital between 1994 and 2021. The estimated slope by least squares linear regression was 25.9 (standard error 0.6) extra caesarean births per year. The Pearson linear correlation is large, at r = 0.993.
Each year, there were approximately 0.50 more caesarean births per week (99% CI 0.47 to 0.53) (Figure 2). In comparison, by the end of 2021, the difference between the 0.9 and the 0.1 quantiles was much (>tenfold) larger, 11.1 births per week (99% CI 10.3 to 12.0) (Figures 3 and 4). Thus hypothesis 2 was supported. The cause was, in part, a progressive increase over years in the differences between the 0.9 and 0.1 quantiles of caesarean births per week, 0.21 larger per year (standard error 0.02, P < 0.0001) (Figure 3).
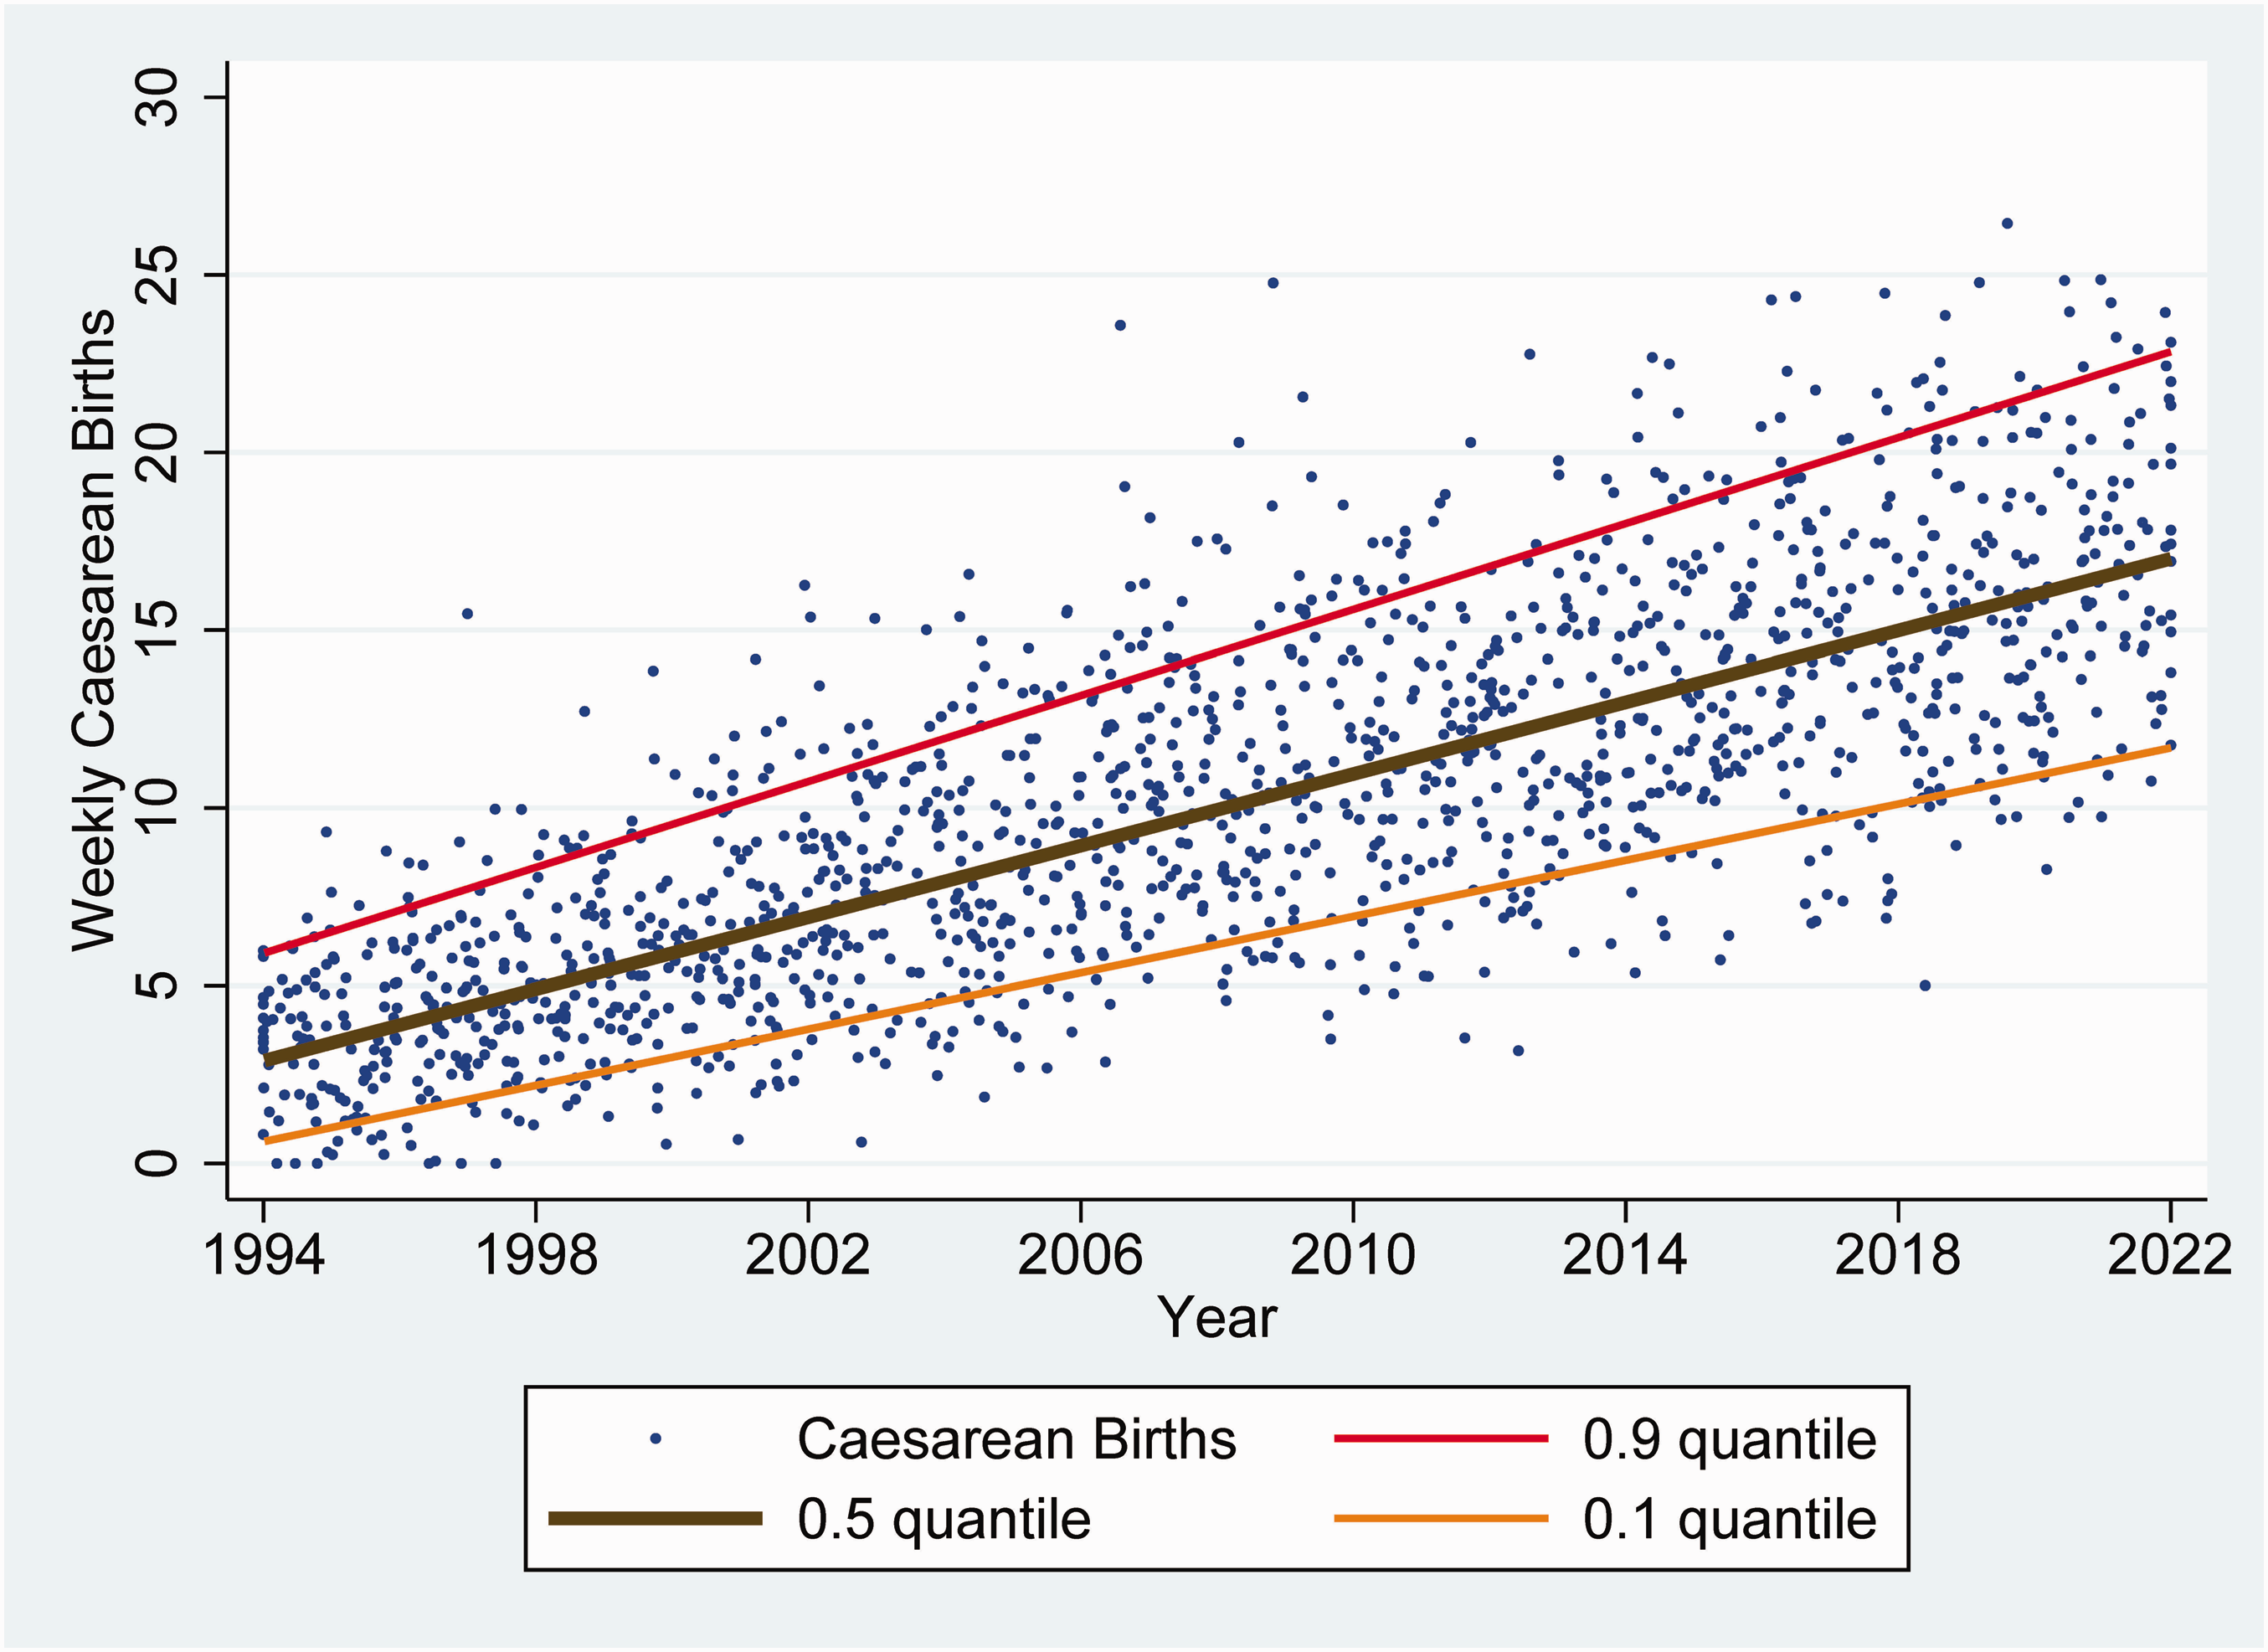
Weekly increase in caesarean births at the large teaching hospital between 1994 and 2021. Applying least squares linear regression, there was no significant serial correlation from week to week (Durbin test P = 0.26) and the cumulative sum test showed parameter stability (P > 0.10) over time. The estimated slopes (0.50 more caesarean births per week) and standard errors (0.01) were the same whether calculated using least squares linear regression or using quantile (median) regression. The plotted lines were calculated using simultaneous quantile regression. Random two-dimensional jittering was used to reduce data overlap.
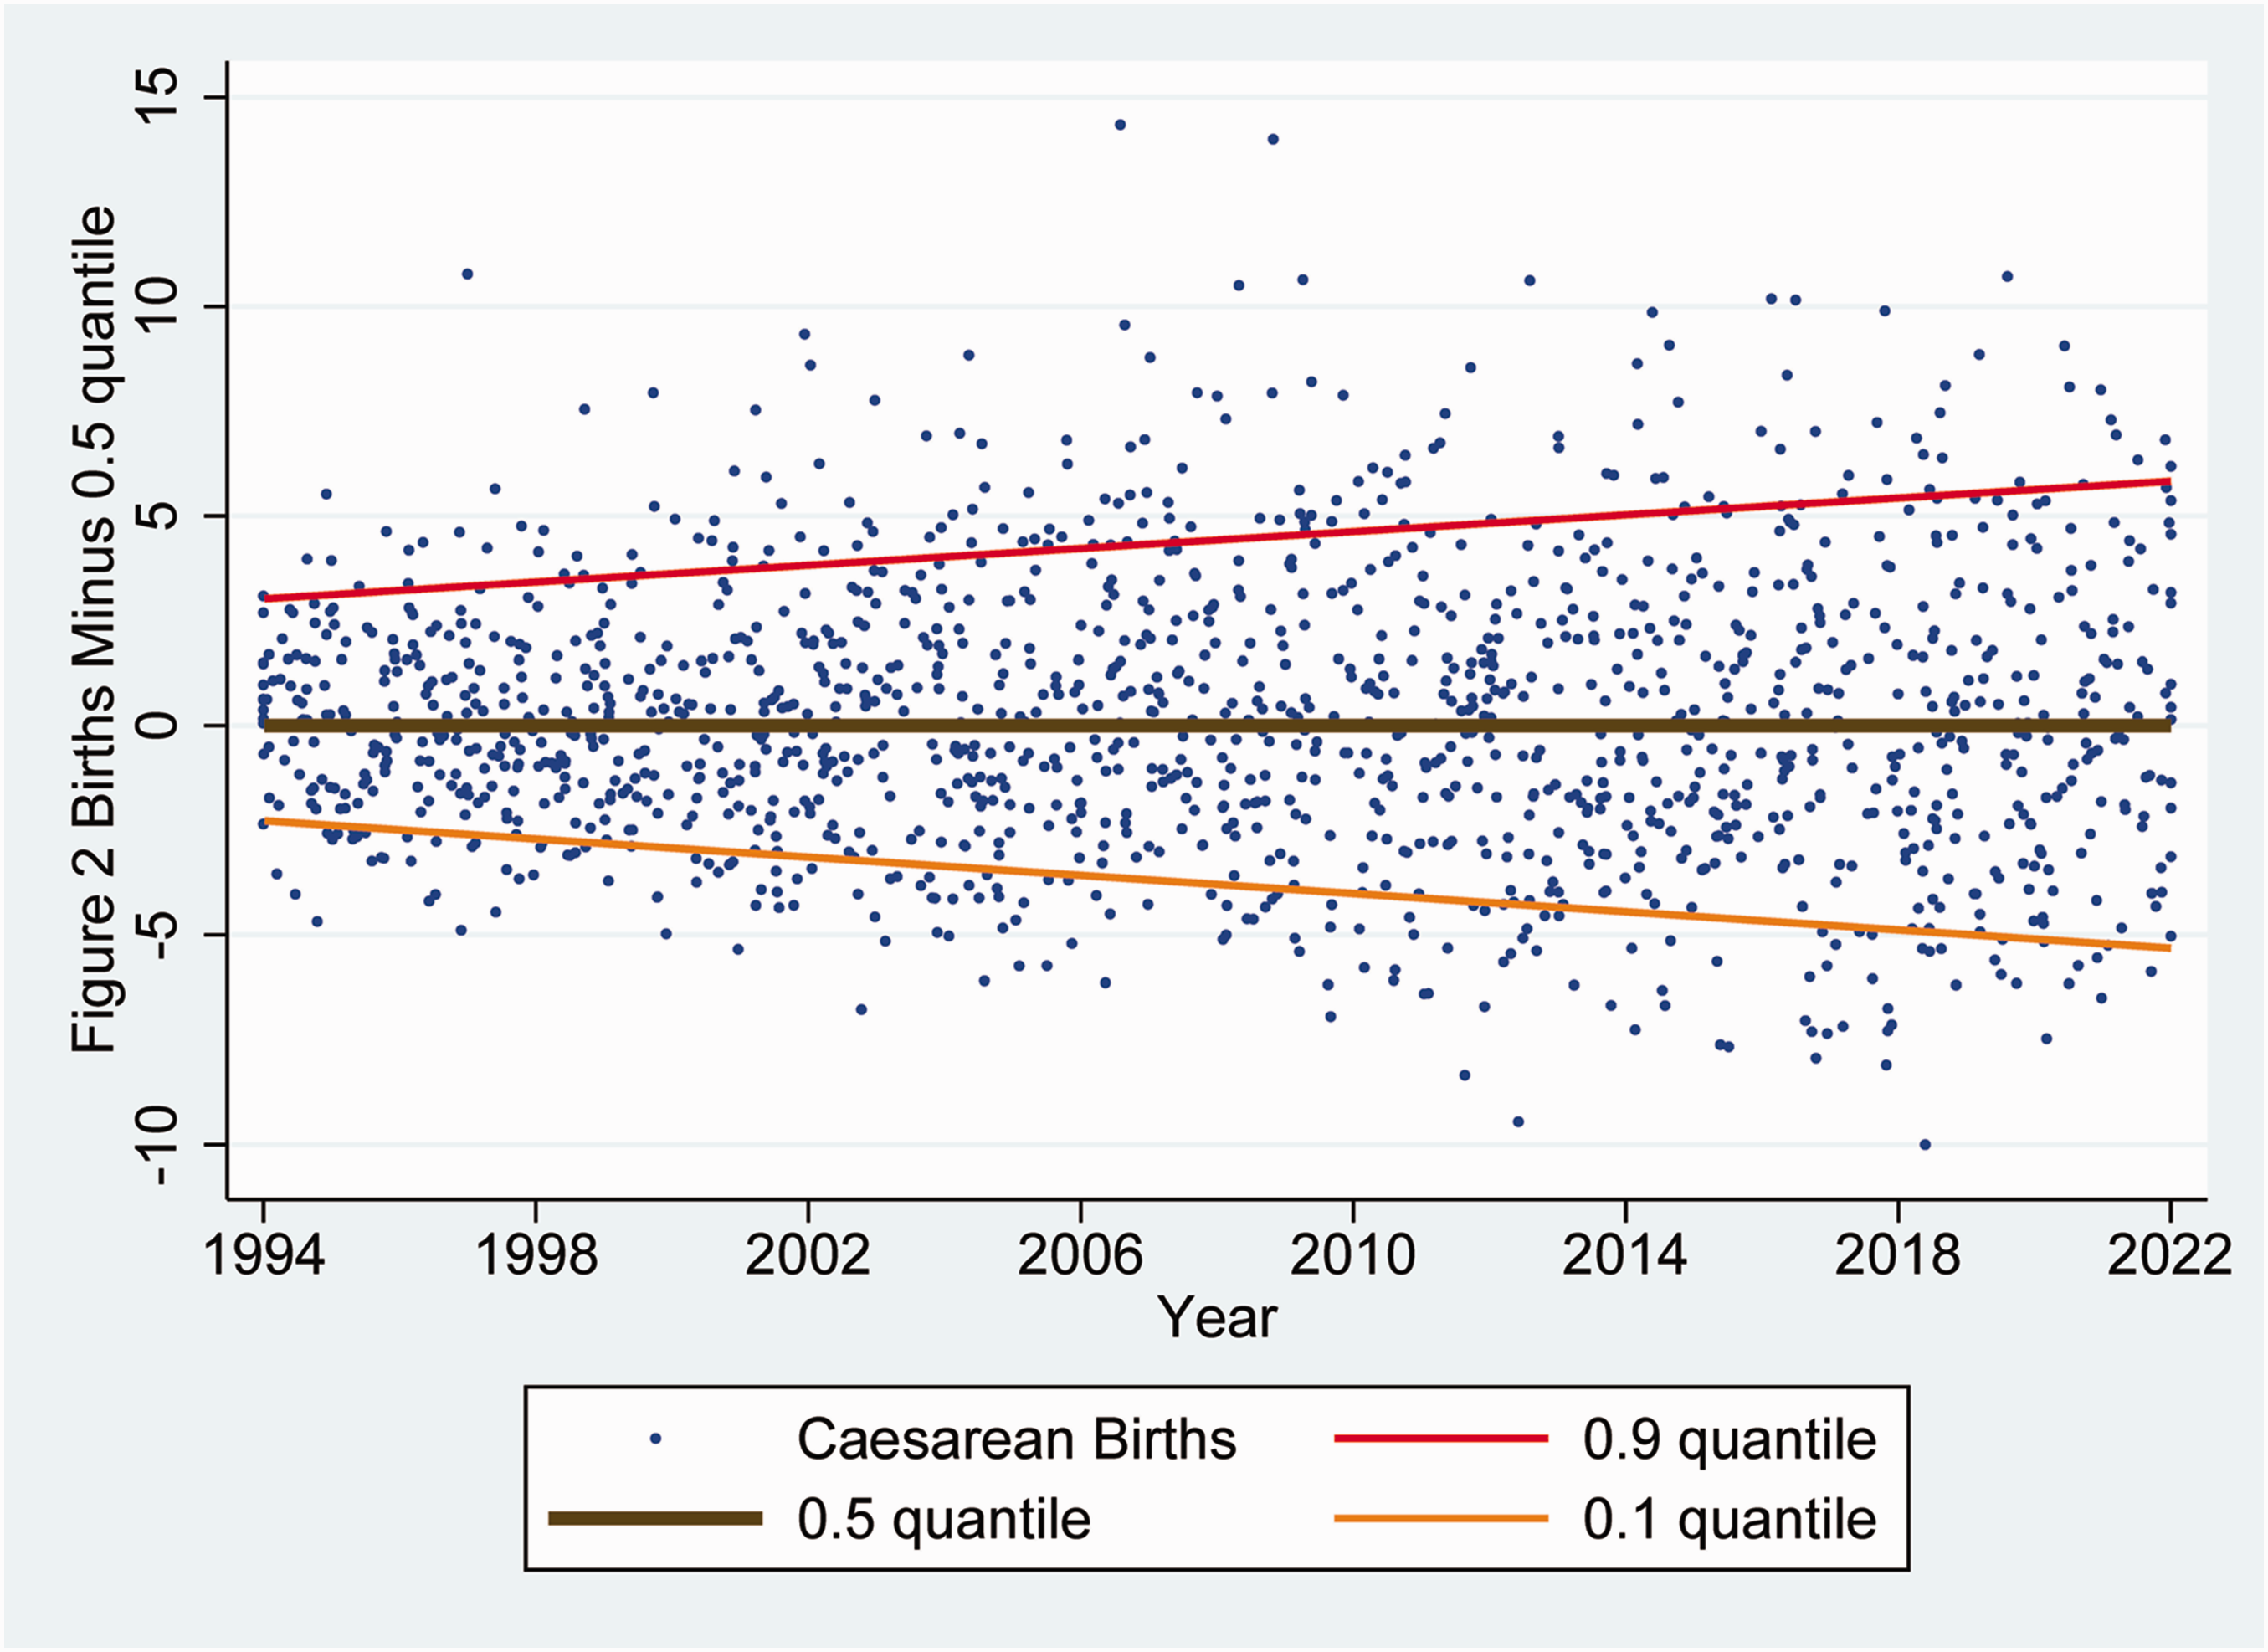
Figure 2 but plotted after subtracting the 0.5 quantile (median) regression post-estimation prediction for each week from all observations and lines. The observed weekly caesarean births and simultaneous quantile regression lines from Figure 2 are shown this way better to reveal the progressive increase in variability. Applying interquantile regression to the raw data, differences between the 0.9 quantiles and 0.5 quantiles were estimated, increasing progressively, by 0.10 (standard error 0.02) caesarean births per week over each year (P < 0.0001). Differences between the 0.5 and 0.1 quantiles also increased progressively, by 0.11 (standard error 0.01) caesarean births per week over each year (P < 0.0001). The same random two-dimensional jittering used in Figure 2 to reduce data overlap was applied to this figure.
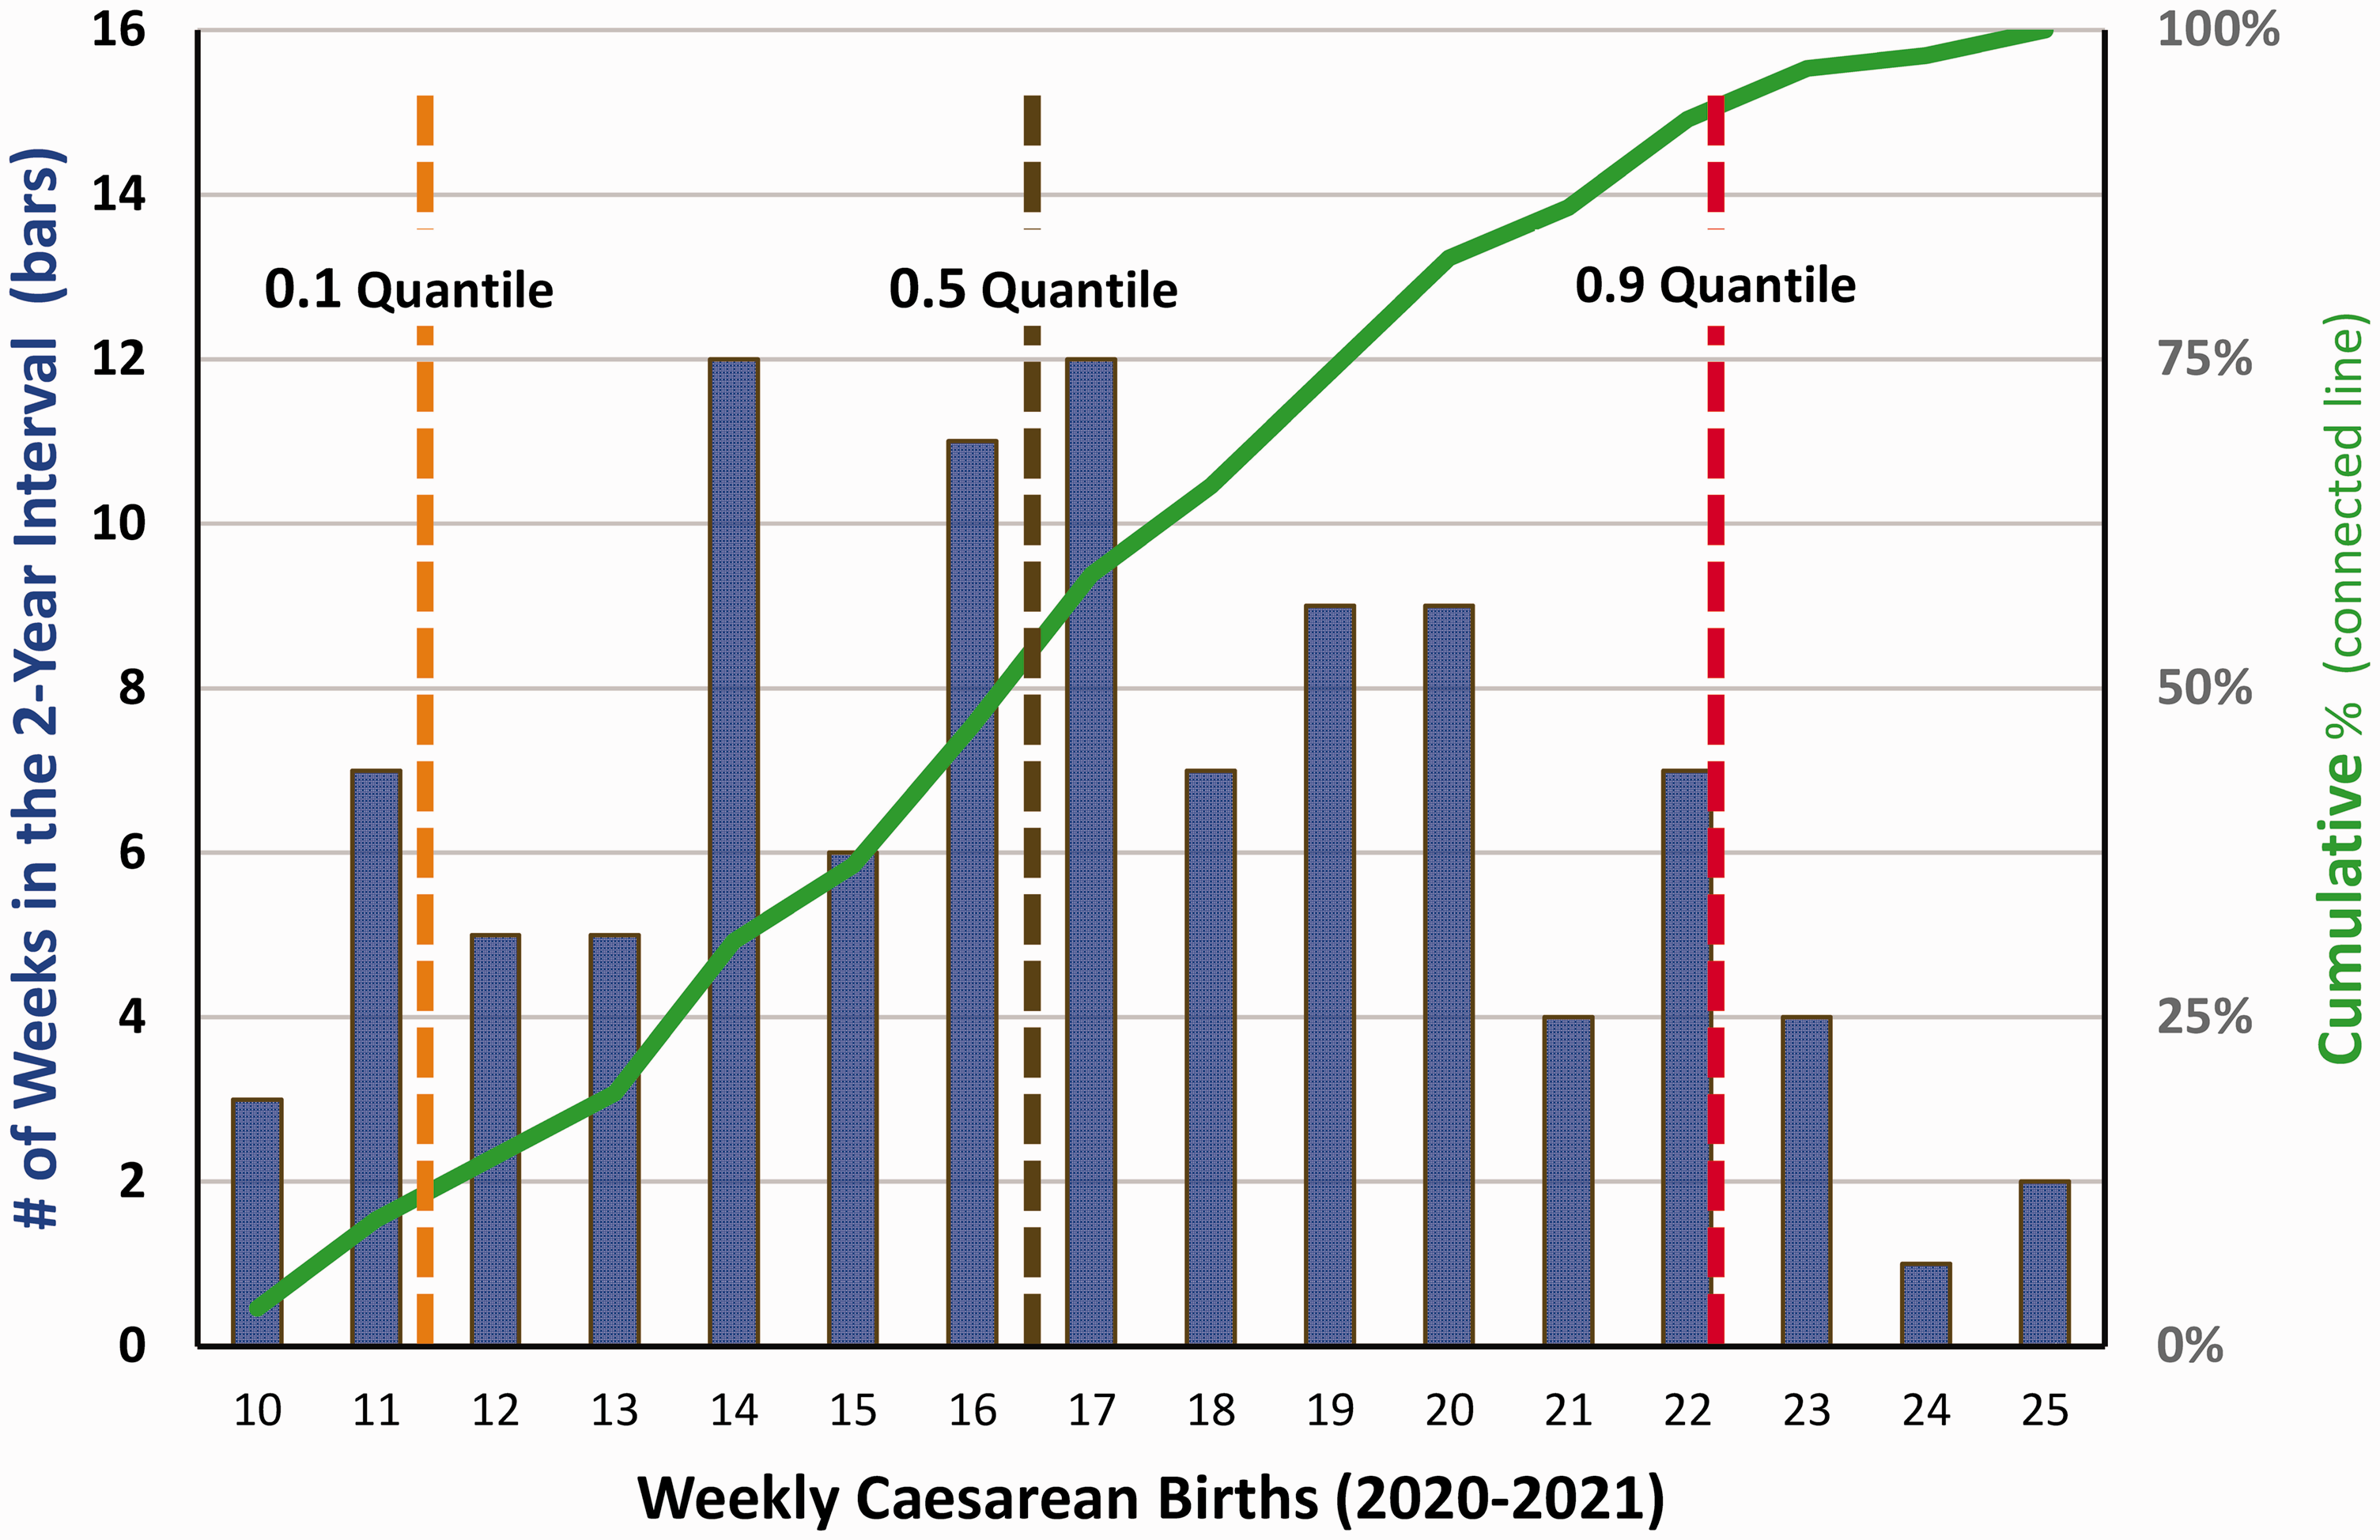
Bar chart showing probability distribution of the weekly cases of caesarean births during the last two years studied, 2020 and 2021. The data shown are identical to those of Figures 2 and 3, but plotted only for the last two years, and shown using a histogram. For example, the far-left bar of the graph shows that there were three weeks in 2020 and 2021 with ten births. The far-right bar of the graph shows that there were two weeks with 25 caesarean births. The 0.9 quantiles, 0.5 quantiles, and 0.1 quantiles are the simultaneous quantile regression lines shown in Figures 2 and 3, but with the means taken over the two years of this graph. Using interquantile regression, the predicted difference between the 0.9 and 0.5 quantiles at the end of 2021 was 5.3 caesarean births per week (standard error 0.2). The predicted difference between the 0.5 and 0.1 quantiles was 5.8 caesarean births per week (standard error 0.3). This graph is important in that it shows large variability among weeks in caesarean births (as in Figure 3), and that the variability is much larger than the annual change in births per week (as shown in Figures 1 and 2).
Sensitivity analyses included neuraxial labour analgesia and non-caesarean delivery obstetric procedures. Over the 19-year period with reliable data for all obstetric procedures, the workload included 35% caesarean births (12,700), 64.4% (23,058) neuraxial labour analgesia, and 0.2% (62) other procedures (see Discussion section). The fraction of the obstetric workload from caesarean births was unchanging, Pearson correlation coefficient of 0.04 (99% CI –0.04 to 0.12, N = 1040 weeks). Because the other procedures were a small percentage of the total workload, we, like others,9,10 used the obstetric anaesthesia activity index, a weighted combination of caesarean births and neuraxial labour procedures. Among the N = 19 years with billing data including neuraxial labour analgesia procedures, the Pearson correlation coefficient was large, at 0.98 (99% CI 0.93 to 0.99). Thus hypothesis 1 was supported. Applying quantile (median) regression, each year, the obstetric anaesthesia activity index increased by approximately 0.40 units per week (99% CI 0.35 to 0.46). In comparison, by the end of 2021, the difference between the 0.9 and the 0.1 quantiles was much (>tenfold) larger, 7.46 units per week (99% CI 6.27 to 8.64) (see Figures 2 and 3). Thus hypothesis 2 also was supported.
Discussion
Our retrospective cohort study used data from a large teaching hospital with progressive change over decades in obstetric workload. Having such growth, we could investigate: (a) how to forecast changes from one year to the next and (b) the relative size of growth as compared with variability week to week. This work was analogous to earlier studies for modelling inpatient surgical suites over more than ten years2,3 and anaesthesia resident operating room workload. 14 Forecasting long-term operating room workload is important for facility planning and staff hiring, especially for hospitals that are the sole maternal care centres in their region with obstetric anaesthesiologists, maternal care transport, and maternal–fetal medicine specialists.
Daily elective surgical caseloads of single specialties (e.g. obstetrics) tend to follow Poisson distributions, 15 as do the numbers of cases and total obstetric patients with random arrivals.16–18 Therefore, like Poisson distributions, we expected that more cases over time would be associated with greater variability, as observed (see Figure 3). We did not anticipate the extent to which variability week to week (see Figures 2, 3 and 4) markedly dwarfed the linear growth from year to year (see Figures 1 and 2). The implication of the large ratio of variability to the slope of the regression line is that we doubt that clinicians can judge accurately whether occasional busy weeks are indicative of growth warranting considerations of making changes to facilities and/or personnel.4,7 Day-to-day variability would be even larger relative to the slow increase in caseload. Hospitals without growth likely would have comparable proportional variability, making a valid method of assessing trend important to planning, shown by our results (see Figure 1).
Although our paper was performed using data from one hospital, the relative procedural numbers are broadly consistent with those of limited national data from the US Medicare Part B National Summary Data File. 19 Over the 19-year period with reliable data for all obstetric procedures, the workload included 35% caesarean births, 64.4% neuraxial labour analgesia, and 0.2% other procedures. From our included CPT codes, the anaesthesia caseloads among US Medicare patients were 49.8% caesarean births, 49.8% neuraxial labour procedures, and 0.4% other procedures. 19
The one hospital studied had the unique and necessary characteristics of long-term growth in obstetric anaesthesia. We observed a Pearson (linear) correlation coefficient of 0.99, a very large effect size. 13 Other hospitals should expect smaller correlation coefficients, in part because the maximum correlation coefficient, by definition, is 1.00. The relevant generalisable finding is not nearly perfect linear growth but, rather, the value of binning annually, graphing the data, and analysing trends of the time series. Long-term capacity planning is important not only in regions with more live births, but also in regions where many rural hospitals closed their obstetric units while the number of births remained static, like the state with the one (studied) university hospital.6,8
Our analyses were limited to long-term capacity planning. This is different from predicting daily caseloads for elective surgery of single services 20 or at large surgical suites 21 or for short-term forecasting for busy surgical suites a few days in advance as cases are being scheduled. 22 Caesarean surgical suite workloads are usually statistically independent of daily caseloads for other inpatient surgery. 23
We made no attempt to model the numbers of labour and delivery patients to forecast the caesarean surgical suite workload because earlier studies showed heterogeneity among hospitals; thus, there was little reason to expect generalisability of such findings.24,25 For example, at the studied hospital, the inpatient census often included more than a dozen patients with severe maternal disease (e.g. women with abnormal placentation (the hospital is the state referral centre)), yet most days only had two or three caesarean births.
Finally, changes over years in the weekly numbers of caesarean births do not directly guide obstetric suite requirements for the number of anaesthesiologists, anaesthesiology residents, nurse anaesthetists, surgical technologists, nurse midwives, obstetricians, or other healthcare personnel. Such staffing decisions depend on how the obstetric workload is managed, such as its distribution among weekends versus regular workdays, among other variables. 26 Our focus was limited to investigating and confirming that quantile linear regression can be used for long-term capacity planning of obstetric operating rooms.
In conclusion, we found that quantile linear regression can be suitable for planning obstetric operating room capacity requirements from year to year. This straightforward method may contribute to decision-making to ensure that anaesthesiologists and obstetricians have the operating rooms and staff needed to meet the referral needs of community hospitals. We recommend use of statistical modelling because impressions of capacity requirements may be biased by weekly variability in caseloads that can be large relative to long-term trends in growth.
Footnotes
Notes
Author Contribution(s)
Declaration of conflicting interests
The authors have no conflicts of interest to declare.
Funding
The authors disclosed receipt of the following financial support for the research, authorship, and/or publication of this article: Departmental.