
Abstract
Anaesthetists can make safer airway plans if they know which airway techniques worked previously and which ones did not. Anaesthetic charts do not always capture this information, however, and guidelines from the Australian and New Zealand College of Anaesthetists do not specify what details on airway management they should include. To assess how anaesthetic charts support airway documentation, we audited the airway management section of blank charts from 132 hospitals accredited for training by the Australian and New Zealand College of Anaesthetists. We evaluated charts for the presence of 17 clinically important data fields describing tracheal intubation, supraglottic airway use and bag-mask ventilation. Our audit revealed that data fields on anaesthetic charts focus more on tracheal intubation than bag-mask ventilation or supraglottic airway use. Nearly all charts (99%) had prompts for intubation and most had prompts for both operator technique and patient outcome. For supraglottic airway use, 95% of charts had at least one data field, but few had prompts for difficulty or outcome. For bag-mask ventilation, 58% of charts had a data field for difficulty but most of these were subjective; few (1.5%) included any outcome measures. Data fields describing bag-mask ventilation and supraglottic airway use were also inconsistent. In summary, data fields on Australian and New Zealand anaesthetic charts focus on tracheal intubation with consistent prompts for both operator method and outcome. The inclusion of fields for outcome and difficulty of bag-mask ventilation and supraglottic airway use could help clinicians make better records of airway management.
Introduction
Difficulty in airway management is a major cause of anaesthesia morbidity and mortality. 1 Clinical prediction of difficulty is unreliable, 2 with fewer than 10% of difficult tracheal intubations and difficult mask ventilation episodes being anticipated. 3 Access to records that describe previous success, difficulty or failure can help improve airway planning and thus improve patient safety. 4
There is no clear standard that sets out what information on airway management should be recorded on anaesthetic charts. The Australian and New Zealand College of Anaesthetists (ANZCA) Guideline on the Anaesthesia Record (PG06) 5 states that charts should record the ‘size and type of any artificial airway’ and describe ‘any airway problems encountered and the method of their solution’. It does not specify how charts should facilitate this. For example, PG06 does not specify that charts should include the type of laryngoscope used, the laryngoscopic grade, the outcome of supraglottic airway (SGA) use, or any details on bag-mask ventilation (BMV)—despite the clinical importance of this information.
An ANZCA publication on airway assessment also acknowledges the importance of documenting difficulties in airway management (including BMV, SGA use and tracheal intubation), but provides no specific guidance on how to do this. 6 Guidelines from the American Society of Anesthesiologists 7 and the Association of Anaesthetists of Great Britain and Ireland 8 also outline principles but do not specify what airway data prompts should be included on anaesthetic charts.
There is increasing recognition of the importance of using outcome measures to describe airway management. These are objective, measurable results of the intervention in the patient 9 (such as the laryngoscopic view or capnography waveform), distinct from equipment or interventions used by the operator (such as the type of laryngoscope for intubation, or the use of an oropharyngeal airway for BMV). While ‘difficulty’ is subjective and operator dependent,2,10–12 outcome measures are objective and observable. 9
For laryngoscopy and tracheal intubation, Cooper has proposed a documentation standard which includes a ‘complete description of technique … and outcomes for each attempt’. 13 Recent literature on mask ventilation has also shifted focus from operator difficulty to patient outcome.14–18 In 2021, ANZCA endorsed a difficult airway alert developed by Queensland Health with prompts for operator methods, difficulty, and patient outcomes for BMV and tracheal intubation, as well as difficulty with SGA use. 19
In this study, we audited the airway management section of charts from Australian and New Zealand hospitals accredited by ANZCA for anaesthesia training. Our aim was to examine how anaesthetic charts prompt for information on the three primary airway management modalities—tracheal intubation, SGA use and BMV.
Materials and methods
Between December 2018 and July 2019, we contacted colleagues from all ANZCA-accredited training hospitals in Australia and New Zealand to request a blank copy of the anaesthetic chart used in their institution. Contact methods included direct enquiry, telephone, email, and Twitter (#WhatsOnYourChart).
Both electronic and paper charts were included. For paper charts, we requested either a physical or digital copy of all sections that describe airway management. For electronic charts, we requested screenshots of the airway management section, including all relevant sub-pages and drop-down menus.
The study was approved by the Sydney Local Health District Ethics Committee (reference CH62/6/2018-216).
Data analysis
We assessed charts for the presence of data fields on tracheal intubation, SGA use and BMV. We selected data fields based on ANZCA PG06 and the ANZCA airway assessment document. As those guidelines do not specify what details charts should include, we chose 17 fields for equipment, difficulty and outcome which describe ‘airway problems and the method of their solution’:
Tracheal intubation: tracheal tube type and size, laryngoscope type and adjuncts used, direct laryngoscopy grade, videolaryngoscopy grade, difficulty, and number of attempts. SGA use: size and type, number of insertion attempts, seal or leak pressures, difficulty, and inclusion of any grading scales. BMV: use of airway adjuncts, difficulty, and inclusion of any grading scales.
Each chart was assessed independently by two investigators. Disagreements were resolved by discussion and if consensus could not be reached, a third assessor adjudicated.
Data processing and analyses were performed using Microsoft (Redmond, WA, USA) Excel for Office 365 (version 1902) and descriptive statistics were reported. For the analysis, binary prompts such as ‘easy/difficult’ or ‘difficulty yes/no’ were counted as a data prompt for difficulty, but not as a ‘scale’: we defined a scale as having at least three options (such as ‘easy/moderate/difficult’).
As some charts were used across multiple hospitals, we performed a weighted analysis based on the number of hospitals that use a particular chart. For example, if a chart was used by three different hospitals, it was counted three times.
Results
We analysed charts used by 132 hospitals (82 different charts) across Australia and New Zealand. This included over 90% of all Australian and New Zealand hospitals accredited by ANZCA for anaesthesia training.
The median number of airway data fields present was seven (range 0–15). Data fields for intubation were present in 99% (131/132), for SGA use in 95% (125/132), and for BMV in 58% (77/132) of hospital charts.
For tracheal intubation (black bars in Figure 1), laryngoscopy grade (121/132), tube size (124/132), and tube type (100/132) were the most common data fields present. A separate data field for subjective intubation difficulty was found on 52% of charts (68/132).
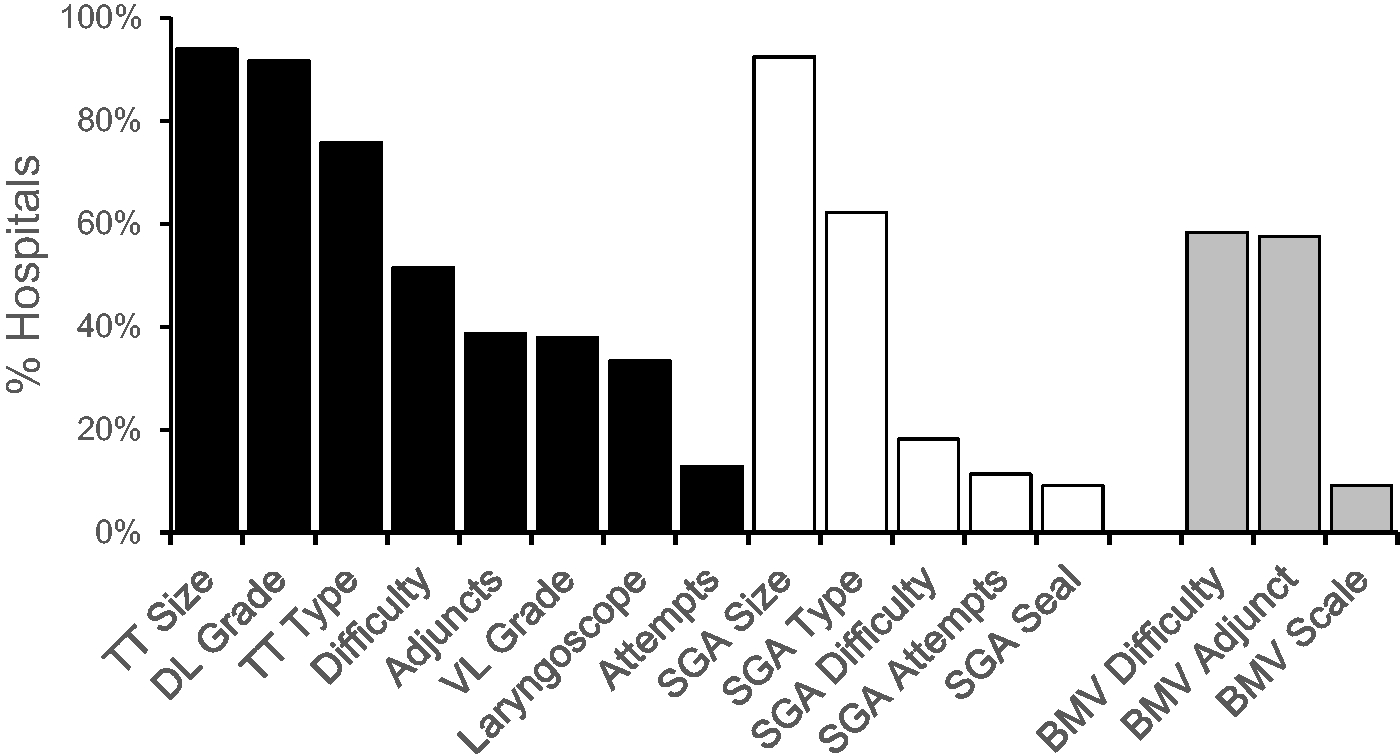
Incidence of data fields for each airway management modality. Black bars for tracheal intubation, white for supraglottic airway (SGA) use, grey for bag-mask ventilation (BMV). TT: tracheal tube; DL: direct laryngoscopy; VL: videolaryngoscopy.
A specific grade for videolaryngoscopy was present on 38% (50/132) of hospital charts. The Cormack and Lehane scale 20 was used most commonly (25/50), followed by the percentage of glottic opening (POGO) 21 and Fremantle 22 scales (17/50 and 6/50, respectively).
For SGA use (white bars in Figure 1), the most common data fields were size (92%, 122/132) and type (62%, 82/132), in line with ANZCA PG06. A data field for difficulty was found on 18% (24/132) of charts. Prompts for objective criteria of difficulty or outcome were uncommon: the number of insertion attempts23 (11%, 15/132) and seal or leak pressure24 (9%, 12/132) were the main markers used for this. No chart had a grading scale for difficulty.
For BMV (grey bars in Figure 1), a data field for difficulty was present on 58% (77/132) of hospital charts, most as a binary option such as ‘difficulty yes/no’. Data fields for the use of airway adjuncts were present on 58% (76/132) of charts. A grading scale was present on only 9% (12/132) of charts. Six different scales were used, including the Han scale, 25 Lim’s capnography scale, 26 and several subjective scales (such as ‘easy/difficult/unable’ or ‘easy/manageable/difficult/unable’).
Discussion
Our main finding is that the airway sections of anaesthetic charts used by hospitals in Australia and New Zealand focus on recording of tracheal intubation. Data fields on intubation prompted for more detailed, objective and consistent information than those on SGA use and BMV. Most charts met the ANZCA PG06 requirement to prompt for the size and type of artificial airways, but data fields for airway problems and methods of their resolution were inconsistent.
Information sought about tracheal intubation commonly included prompts for method (equipment and technique), difficulty and outcome (laryngoscopic view). Among charts with a prompt for laryngoscopy grade, the Cormack and Lehane scale 20 was used in almost all cases (99%, 120/122). We believe this wide acceptance results from the scale’s validity and utility. It is valid because it grades an objective outcome: the view of the larynx. It is useful because it is clear, simple, and reproducible. By contrast, the grading of videolaryngoscopy varied widely. The Cormack and Lehane scale was most commonly used, with the POGO 21 and Fremantle 22 scales in a minority of charts. The use of these alternative scales may reflect clinical opinion that the Cormack and Lehane scale does not convey enough information for videolaryngoscopy.6,22
SGA devices are the most commonly used airways in general anaesthesia. 1 Over 95% of hospital charts in our audit had data fields for SGA use, but 38% of charts did not include a prompt for SGA type and thus do not satisfy ANZCA PG06 criteria. Few charts prompted for known markers of difficulty or outcome such as the number of attempts 23 or the adequacy of seal. 24 This is important because SGA use can result in a range of outcomes, not just success or failure. An optimal SGA supports positive pressure ventilation with a good seal; a malpositioned SGA may leak at low pressure or require excessive pressures to ventilate; a failed SGA may result in complete airway obstruction. The clinician’s threshold to accept a particular SGA attempt may also vary. An SGA deemed ‘inadequate’ for a long case might be ‘adequate’ for a short case or even a ‘success’ for reoxygenation in a crisis. 27 Recording these outcomes may help with subsequent airway planning, but few charts in our audit had prompts for them.
BMV is not mentioned in the PG06, but it is often the initial ‘method of solution’ of airway difficulty. There was no data field to describe BMV in 42% of charts. Where prompts were present, they varied widely. Many audited charts had data fields for difficulty, most as subjective binary measures such as ‘difficulty yes/no’. BMV technique received fewer prompts. Only 9% of charts included a BMV scale. Most scales described difficulty subjectively using unvalidated terms such as ‘easy/manageable/difficult’.
In 3% of hospital charts, the Han scale was used. Published in 2004, this scale combines subjective ratings with components of operator technique. 26 Several terms in its grades were not defined—including ‘inadequate’, ‘unstable’, and even ‘ventilated’—which reduces its reliability. The grades may not correlate with patient outcome either, which reduces their utility: grade 3 (ventilated with two practitioners) may have better ventilation than grade 1 (‘ventilated’). One author of this scale stated recently that he now regards grading by objective outcomes such as the capnograph or exhaled volumes as more reliable. 14
Few hospital charts included a prompt for objective BMV outcomes. This is important because, as in SGA use, BMV outcomes are not binary (success or failure). Optimal mask ventilation achieves substantial tidal volumes and a capnograph with a plateau at lower pressures, whereas marginal ventilation may require high pressures and result in leak, low tidal volumes, or gastric insufflation.28,29 BMV failure may be associated with absent capnography and total airway obstruction. Grading ‘difficulty’ by operator interventions (such as the use of two hands) does not distinguish between these clinical outcomes.
The scale recently proposed by Lim and Nielsen 26 was used in 1.5% of hospital charts. It grades BMV by an objective outcome: the best capnograph achieved (grade A: plateau present; grade B: no plateau, end-tidal carbon dioxide (CO2) ≥10 mmHg; grade C: no plateau, end-tidal CO2 <10 mmHg; grade D: no end-tidal CO2). As in Cormack and Lehane’s laryngoscopy scale, grading is independent of the method used by the operator. ‘Difficulty’ is not graded, but poorer outcomes (grades C and D) can be used to define it objectively. It is used in the BMV section of the updated ANZCA endorsed difficult airway alert 19 (see Figure 2).
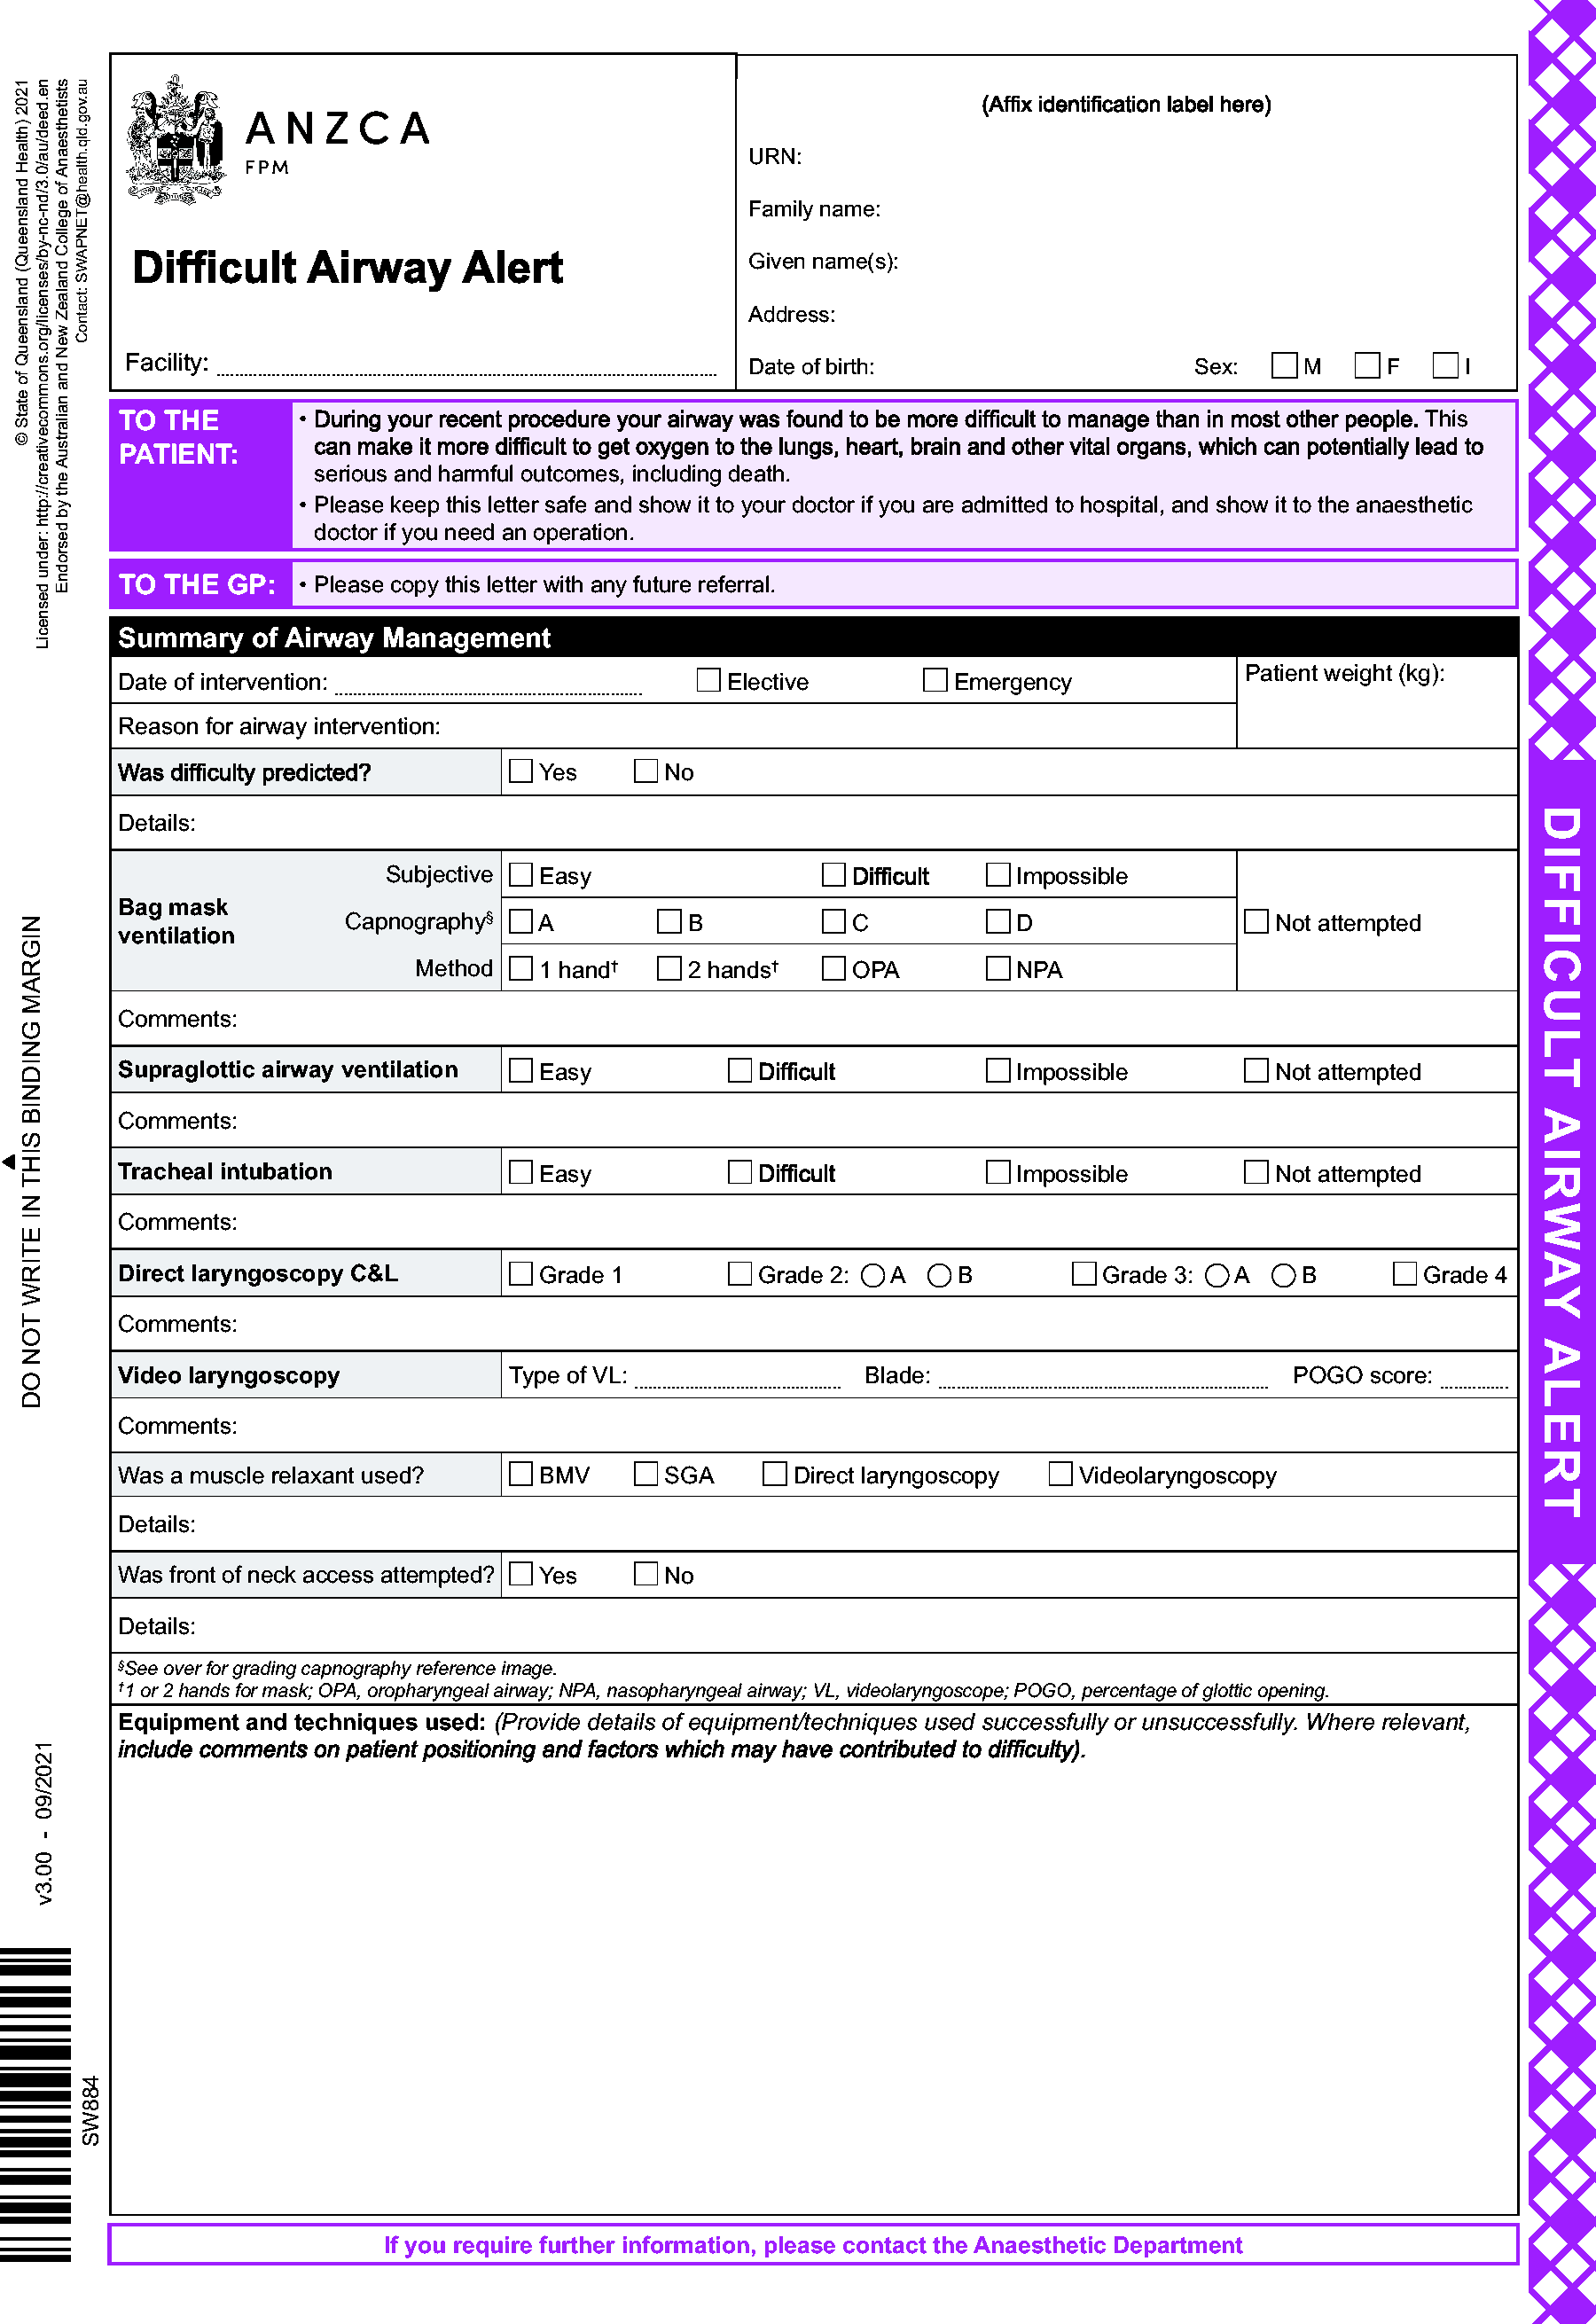
Australian and New Zealand College of Anaesthetists (ANZCA) endorsed difficult airway alert.19
How can airway documentation be improved?
The first recommendation of ANZCA PG06 is to document the ‘size and type of artificial airway’. 5 In our audit, 24% of charts lacked a prompt for tracheal tube type and 38% lacked a prompt for SGA type. These are simple areas for improvement.
The next recommendation of PG06 is to document ‘problems encountered and methods of their solution’. 5 As BMV is often part of the initial management of airway difficulty, we believe that charts should include data fields to prompt for this. The presence of a field in 58% of charts suggests that it is considered useful in a majority of Australian and New Zealand departments.
We think ANZCA PG06 can be improved by adding specific guidelines about what information to record. We propose that Cooper’s standard for documenting laryngoscopy—to describe both method and outcome for each attempt (including any failure) 13 —should be applied to all three primary airway management modalities. Most hospital charts in our audit met this standard for tracheal intubation; very few did so for SGA use or BMV.
Chart updates should increase emphasis on SGA use and BMV to include more data fields on equipment used, difficulty, and outcome measures. The ANZCA-endorsed Queensland Health Difficult Airway Alert form includes prompts across all these domains (Figure 2). 19 Although this form was not originally designed for intraoperative recording, it offers an example of an achievable, relevant and comprehensive airway document which could easily be adapted for routine use.
Finally, documentation of failure is important. Trauma from multiple airway attempts may increase airway difficulty and cause patient morbidity from sore throat and vocal cord damage to aspiration and cardiac arrest. 13 The chance of first-pass success is increased by not repeating previous failures.
Limitations of our audit
Sampling and generalisability
This audit focused on ANZCA-accredited training hospitals from Australia and New Zealand, capturing almost all of this cohort. This cohort included few regional or private hospitals, however. It is also unknown how generalisable our results are to other countries. To investigate this, we also contacted international colleagues and received and audited 67 charts used by 84 hospitals in 14 other countries. Our international data are non-random and far from exhaustive, but they revealed similar results. We offer this in the Supplementary material to assist those who wish to conduct similar audits outside Australia and New Zealand.
Prompting versus documentation
This audit examined only data fields on blank anaesthetic charts. We cannot comment on how clinicians actually use them for airway documentation. Audits of chart completion have shown that many airway data fields are left empty. A US audit found complete airway documentation in only 13.2% of charts, although subsequent measures improved this. 30 An Australian audit found that only 75% of anaesthetic charts had adequate airway documentation. 31 It is also possible that some clinicians may record more detail despite the absence of specific chart prompts.
Conclusion
This audit shows that airway data fields on anaesthetic charts in Australia and New Zealand focus on tracheal intubation, with detailed prompts for technique, equipment, and objective outcomes. Less information is sought for SGA use and least of all for BMV. Anaesthetic charts can be improved by adding data fields for technique and outcome of BMV and SGA use so that they match the existing standard for tracheal intubation.
Supplemental Material
sj-pdf-1-aic-10.1177_0310057X221099033 - Supplemental material for What airway management information do anaesthetic charts prompt for? An audit of charts from 132 hospitals across Australia and New Zealand
Supplemental material, sj-pdf-1-aic-10.1177_0310057X221099033 for What airway management information do anaesthetic charts prompt for? An audit of charts from 132 hospitals across Australia and New Zealand by Kar-Soon Lim, James R Nielsen, Florian Piekarski, Alice M Gerth, George Zhong in Anaesthesia and Intensive Care
Footnotes
Author Contribution(s)
Acknowledgements
The author(s) are grateful to Drs Nick Chrimes, Tim Cook, Orlando Hung and Stuart Marshall for their advice on this project. They also acknowledge all anaesthesia colleagues who have kindly sent copies of their anaesthetic charts for inclusion in the audit.
Declaration of conflicting interests
The author(s) have no conflicts of interest to declare.
Funding
The author(s) received no financial support for the research, authorship, and/or publication of this article.
Supplemental material
Supplemental material for this article is available online.
References
Supplementary Material
Please find the following supplemental material available below.
For Open Access articles published under a Creative Commons License, all supplemental material carries the same license as the article it is associated with.
For non-Open Access articles published, all supplemental material carries a non-exclusive license, and permission requests for re-use of supplemental material or any part of supplemental material shall be sent directly to the copyright owner as specified in the copyright notice associated with the article.