
Abstract
The prevalence of Hospital Acquired Complications (HACs) within major hospitals and intensive care units (ICUs) is often used as an indication of care quality. We performed a retrospective cohort study of acute care separations from four adult public hospitals in the state of South Australia, Australia. Data were derived from the Integrated South Australian Activity Collection (ISAAC) database, subdivided into those admitted to ICU or non-ICU (Ward) in tertiary referral or (other major) metropolitan hospitals. During the five-year study period (1 July 2013 to 30 June 2018), there were 471,934 adult separations with 65,133 HAC events reported in 43,987 (9.32%) at a mean rate of 13.8 (95% confidence interval (CI) 13.7 to 13.9) HAC events per 100 separations and 18.5 (95% CI 18.4 to 18.7) per 1000 bed days. The Ward cohort accounted for the majority (430,583 (91.2%)) of separations, in-hospital deaths (6928 (66.4%)) and HAC events (29,826 (67.8%)). The smaller ICU cohort (41,351 (8.76%)) had a higher mortality rate (8.46% versus 1.61%; P < 0.001), longer length of stay (median 10.0 (interquartile range (IQR) 6.0–18.0) days versus 4.0 (IQR 3.0–8.0) days P < 0.001), and higher HAC prevalence (62.1 (95% CI 61.3 to 62.9) versus 9.16 (95% CI 9.07 to 9.25) per 100 separations P < 0.001). Both ICU and Ward HAC prevalence rates were higher in tertiary referral than major metropolitan hospitals (P < 0.001). In conclusion, higher HAC prevalence rates in the ICU and tertiary referral cohorts may be due to high-risk patient cohorts, variable provision of care, or both, and warrants urgent clinical investigation and further research.
Keywords
Introduction
Hospitals are mandated to monitor, document and report complications during the provision of patient care, but interpretation of these data is complex and somewhat controversial. The Australian Commission on Safety and Quality in Health Care (ACSQHC) has developed the national Hospital Acquired Complications (HACs) methodology to assist identification and reporting of these adverse events.1–3 Following an Addendum to the National Health Reform Agreement in 2017, all Australian State and Territory Departments of Health support the use of HAC methodology with the express aim to improve patient outcomes. 4
A HAC is defined as ‘a complication for which clinical risk mitigation strategies may reduce but not necessarily eliminate’. HAC events are identified as originating ‘during the patient’s hospital stay and [were] not present when the patient is admitted’, derived from routinely collected hospital administrative data and categorised into 16 classes and 47 subclasses.1,2,5 Assessment of HAC events permits clinical evaluation and implementation of interventions to mitigate their occurrence.
National HAC reports (2017–2018) identified that three complications accounted for 64.7% of all HAC events: healthcare-associated infection, cardiac complications and delirium. 2 As alluded to, HAC definitions capture both hospital-related complications due to deficiency of care and patient-related complications arising despite optimal care.
For example, an elderly patient with a fractured femur following a fall has a heightened risk of developing delirium compared with a younger patient undergoing a planned intervention. Delirium may be a consequence of acute illness or comorbidities, but may also arise in the setting of suboptimal perioperative care resulting in dehydration, constipation or poorly controlled pain. Sudden onset of cardiac arrhythmias (such as atrial fibrillation) may be an unavoidable consequence of severe infection or elective cardiac surgery, or result from inadvertent omission of regular medications. Thus, complications may arise directly from patient-related factors which may be less amenable to mitigation, or hospital-related factors, such as resources and the provision of care, which may be more amenable to mitigation. The current HAC methodology identifies these events but is unable to separate patient-related from hospital-related events. Whether or not the event was preventable remains a matter of clinical judgement.
The risk of adverse events (including HAC) may be greater in those with more severe illness or pre-existing comorbidities that complicate diagnosis and treatment.3,6 The Australian and New Zealand Intensive Care Society monitors risk-adjusted mortality but does not routinely monitor morbidity events such as HACs. 7 Patients admitted to an intensive care unit (ICU) may be more liable to experience adverse events, and more likely to benefit from clinical audit of complication rates.8,9
The objective of this study was to quantify the prevalence of HAC in those who received intensive care compared with those who did not (Ward) and those admitted to a tertiary referral compared with other major metropolitan hospitals.
Materials and methods
Study design
We conducted a retrospective, cohort analysis of routinely collected administrative data from four adult public hospitals with an accredited ICU within the state of South Australia, Australia. The Integrated South Australian Activity Collection (ISAAC) database contains patient specific information about all separations and is submitted by all hospitals. 10 Approval for this research was obtained from the Southern Adelaide Local Health Network Office for Research (ID: 11.20). All patients and hospital sites were de-identified and the need for patient consent waived.
Setting and study participants
All hospital separations from 1 July 2013 to 30 June 2018 and receiving acute care were included in the analysis. Exclusion criteria were patient age ≤17 years (n = 67,774, 4.73%) and day-case procedures (defined as length of stay (LOS) ≤1 day; n = 893,644, 62.3%) and those admitted for palliative care. All 16 HAC classes (except two) and 47 subclasses were extracted from ISAAC using the published algorithm (HACs version 3.0) as per ACSQHC guidelines. 1 HAC class #5, ‘unplanned intensive care unit admission’, is yet to be defined by ACSQHC and HAC class #16 (neonatal birth trauma) was not identified in this dataset. Of note, HAC events were derived from diagnoses identified by the condition onset flag as ‘not present on admission’. Patient comorbidities were derived using the condition onset flag as those ‘not noted as arising during the episode of admitted patient care’.
Variables
The study population was subdivided into those admitted to an ICU during any part of their hospital stay (ICU subgroup) and those who were not (Ward subgroup). Two hospitals are tertiary referral sites and two are major metropolitan hospitals. HAC-related diagnoses did not include time/date stamps so we were unable to determine whether the HAC event occurred before, during or after the ICU stay.
Statistical methods
Prevalence rates are reported per 100 separations and per 1000 bed-days to compensate for hospital LOS. Ward and ICU prevalence data were adjusted per 1000 bed-days. Adjusted data were calculated using Poisson regression with risk ratios adjusted for age, ICU admission, gender, emergency admission, chronic organ dysfunction (heart, liver, lungs, kidney) and LOS. Quarterly Hospital Standardised Mortality Ratios (HSMRs) were obtained from SA Health and compared with HAC rates using linear regression. Parametric grouped data are presented as mean and 95% confidence interval (CI) or median and interquartile range (IQR) for non-parametric data. Continuous data were analysed using either the Wilcoxon rank-sum test or Kruskal–Wallis test. Categorical data were analysed using Pearson’s chi-square test or Fisher’s exact test. Statistical analysis was performed using StataMP™ V.16.1 (2019, College Station, TX, USA) software.
Results
Over the five years there were 1,433,352 separations reported from the four study hospitals. After exclusions (Figure 1), 471,934 separations remained for analysis, including 430,583 (91.2%) Ward separations and 41,351 (8.76%) ICU separations. Tertiary referral hospitals accounted for 71.9% and 63.5% of ICU and Ward separations, respectively.
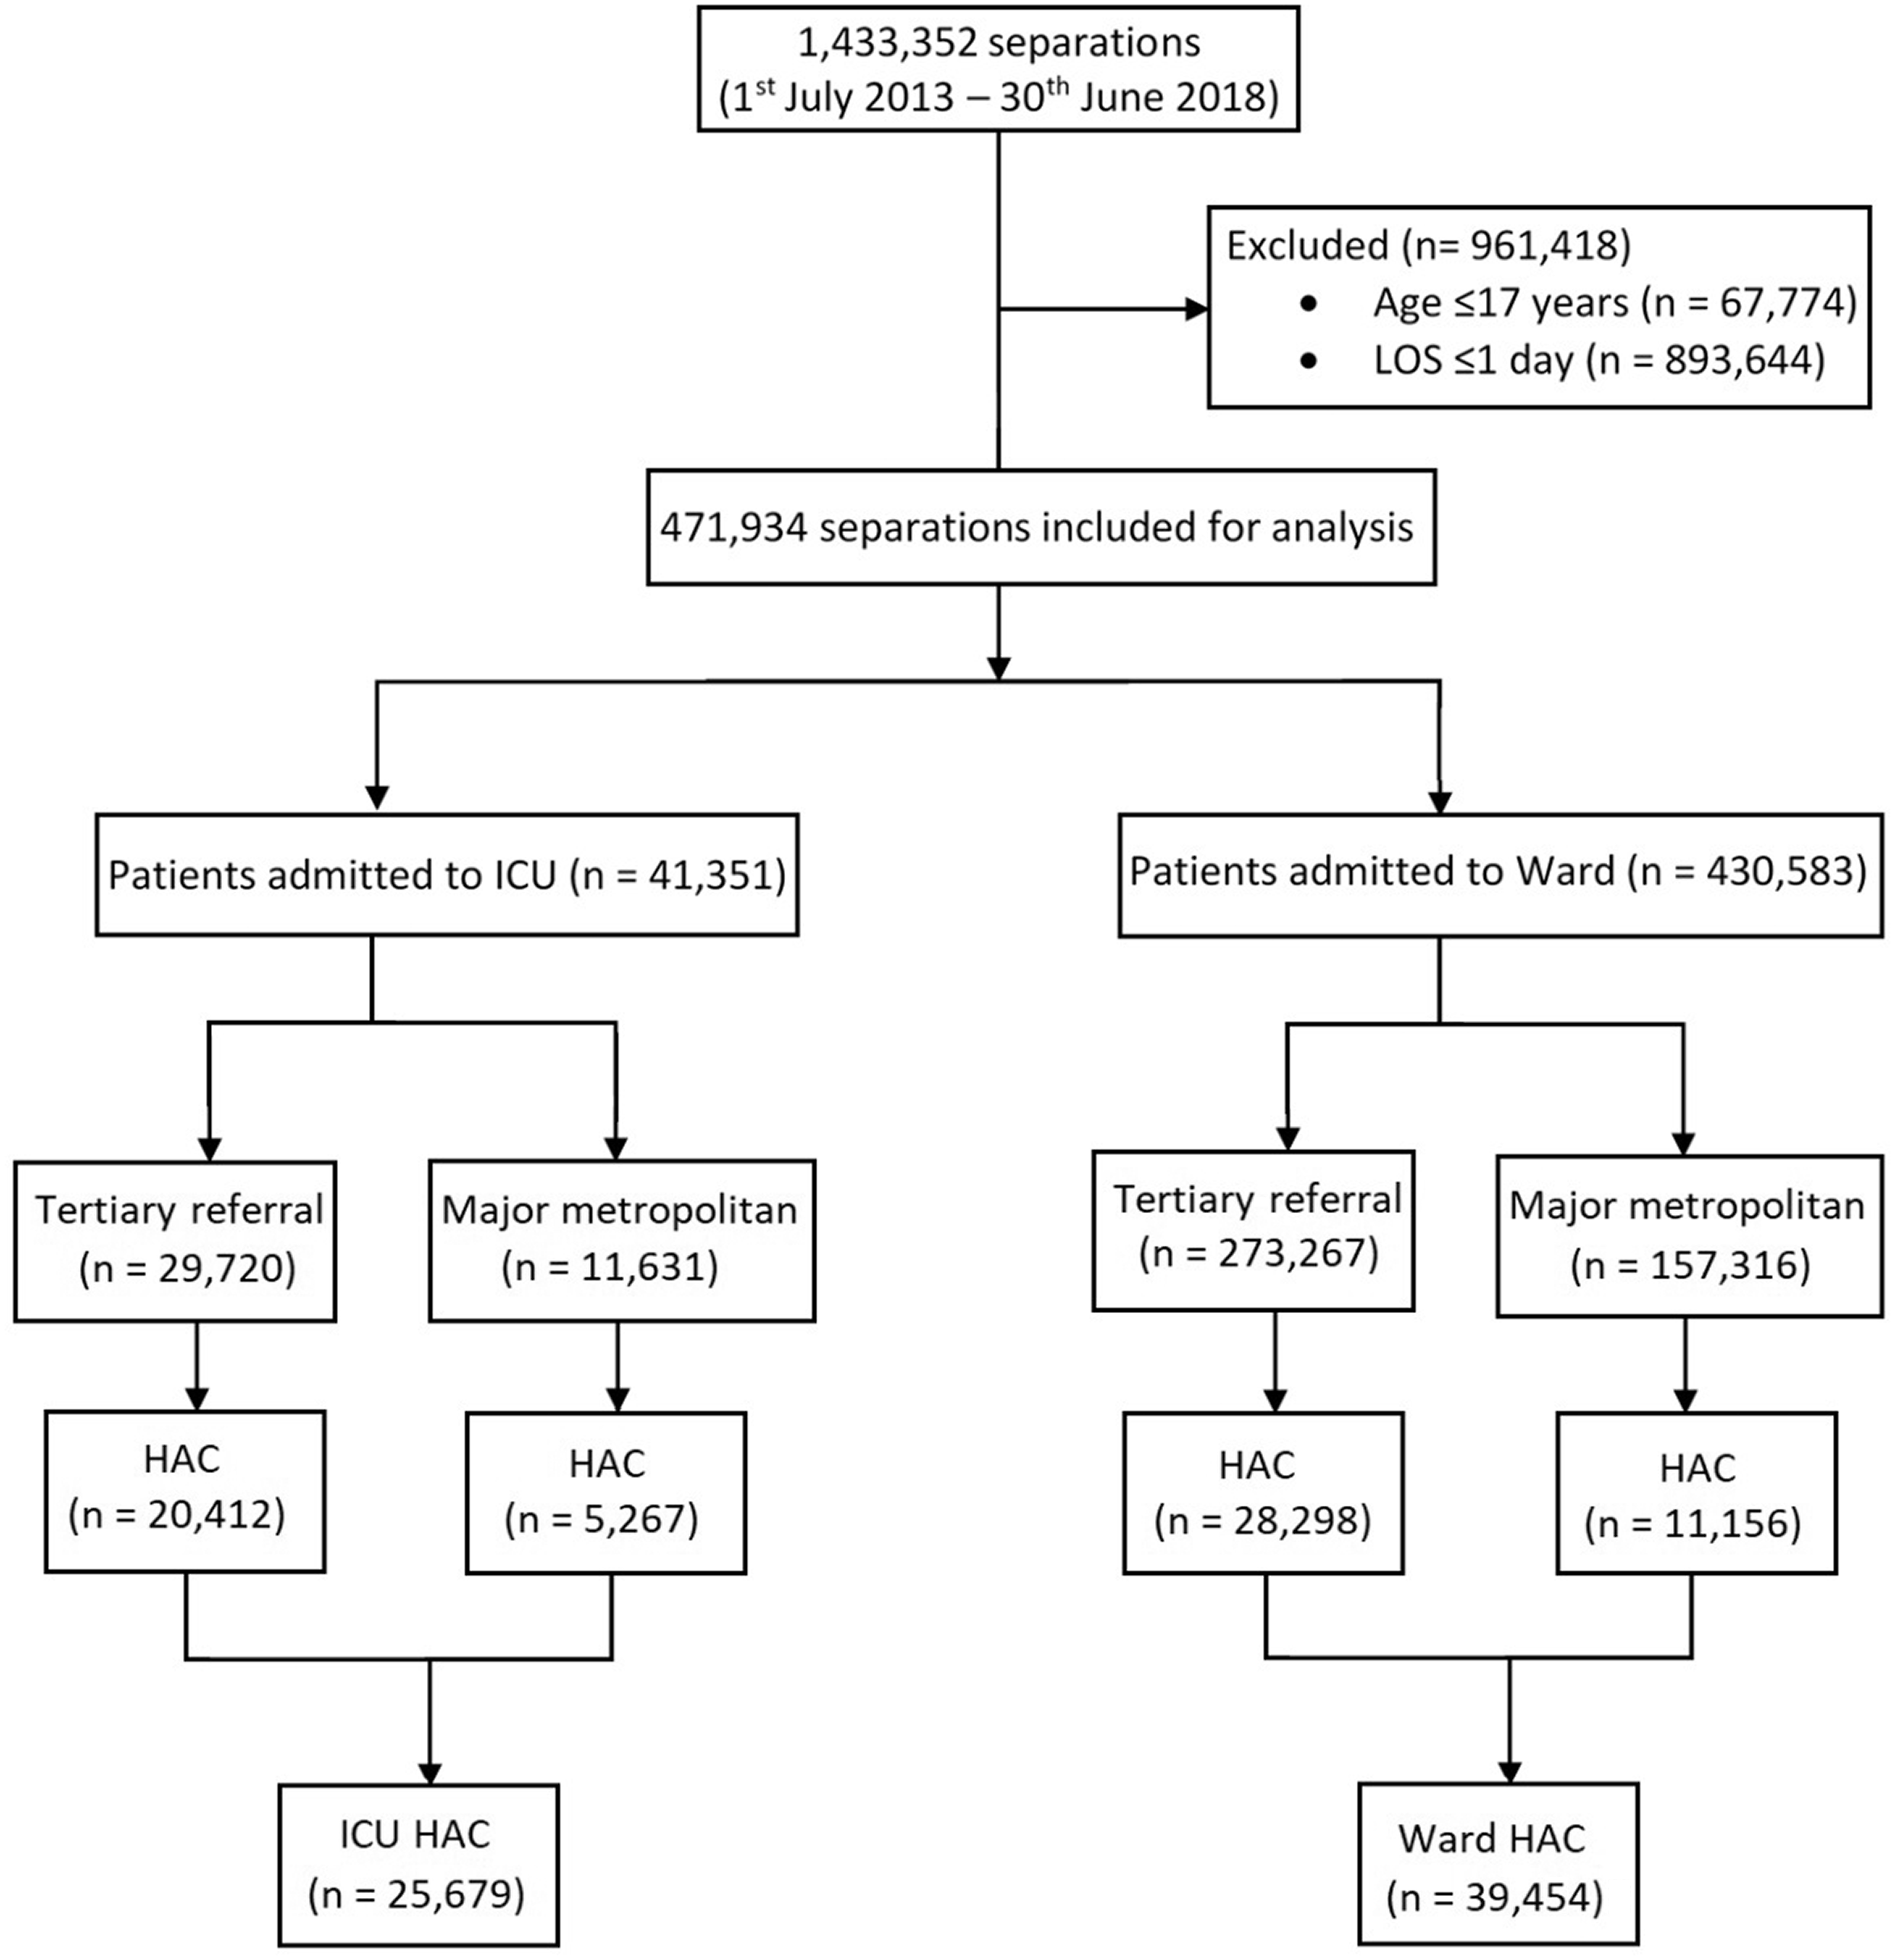
Strengthening the Reporting of Observational Studies in Epidemiology (STROBE) diagram to demonstrate exclusion criteria for study population.
Patient characteristics
Patients in all groups were of similar age (median 63.0 years; IQR 43.0–78.0). There was a preponderance of females in the Ward subgroup (n = 228,442, 53.1%) and a preponderance of males within the ICU subgroup (n = 23,928, 57.9%). Most admissions were for emergency care with only 10,845 (26.2%) elective or planned ICU admissions and 62,621 (14.5%) planned Ward admissions. The ICU cohort had a higher frequency of all comorbidities and a longer LOS than the Ward cohort (P < 0.001; Table 1). The ICU subgroup also experienced a higher in-hospital mortality rate (mean 8.46 (95% CI 8.20 to 8.74) per 100 separations) compared with the Ward subgroup (1.61 (95% CI 1.57 to 1.65) per 100 separations) and a longer median LOS than Ward (10.0 (IQR 6.0–18.0) days versus 4.0 (IQR 3.0–8.0) days, P < 0.001).
Demographic information for study subgroups.
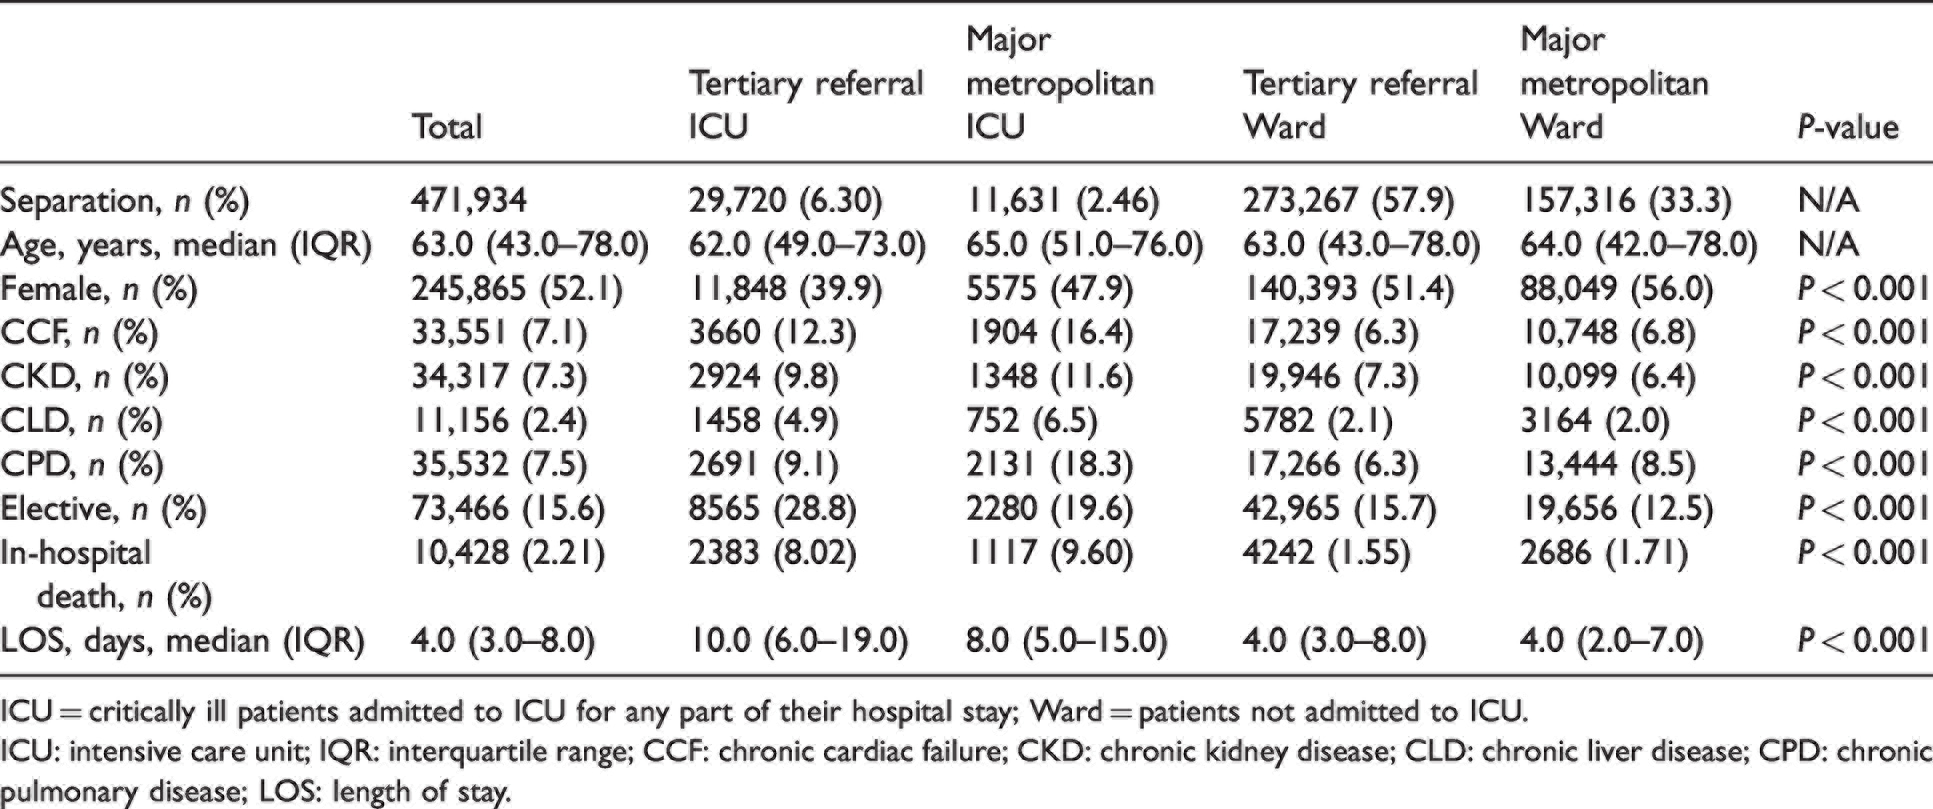
ICU = critically ill patients admitted to ICU for any part of their hospital stay; Ward = patients not admitted to ICU.
ICU: intensive care unit; IQR: interquartile range; CCF: chronic cardiac failure; CKD: chronic kidney disease; CLD: chronic liver disease; CPD: chronic pulmonary disease; LOS: length of stay.
HAC characteristics
There were 65,133 separate HAC events coded across 43,987 (9.32%) separations (Table 2 and Figure 2). HAC events were reported in 14,161 (34.2%) ICU and 29,826 (6.93%) Ward separations.
Frequency and prevalence rates for total Hospital Acquired Complications events according to subgroup.
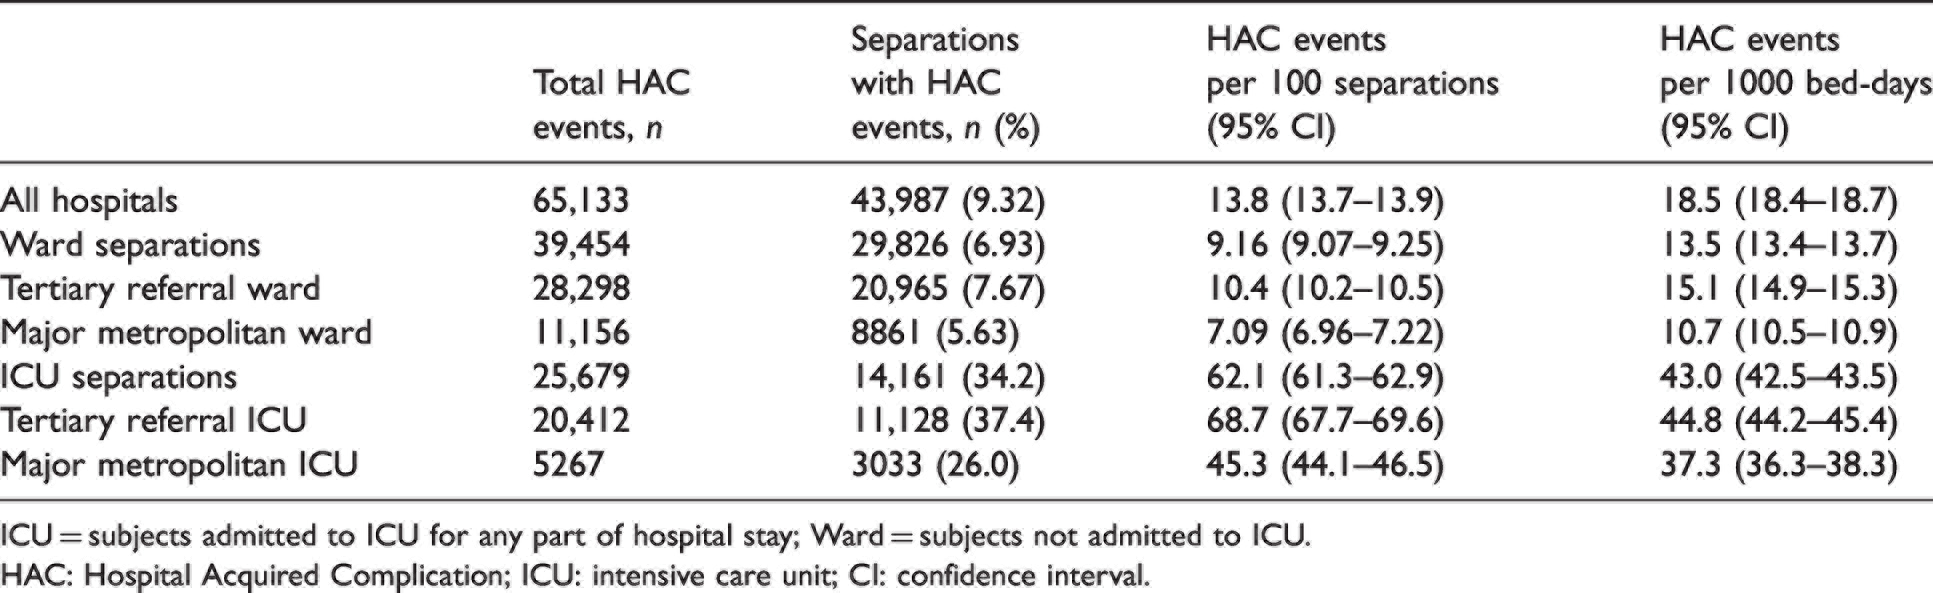
ICU = subjects admitted to ICU for any part of hospital stay; Ward = subjects not admitted to ICU.
HAC: Hospital Acquired Complication; ICU: intensive care unit; CI: confidence interval.
Adjusted HAC prevalence within Ward and ICU subgroups.
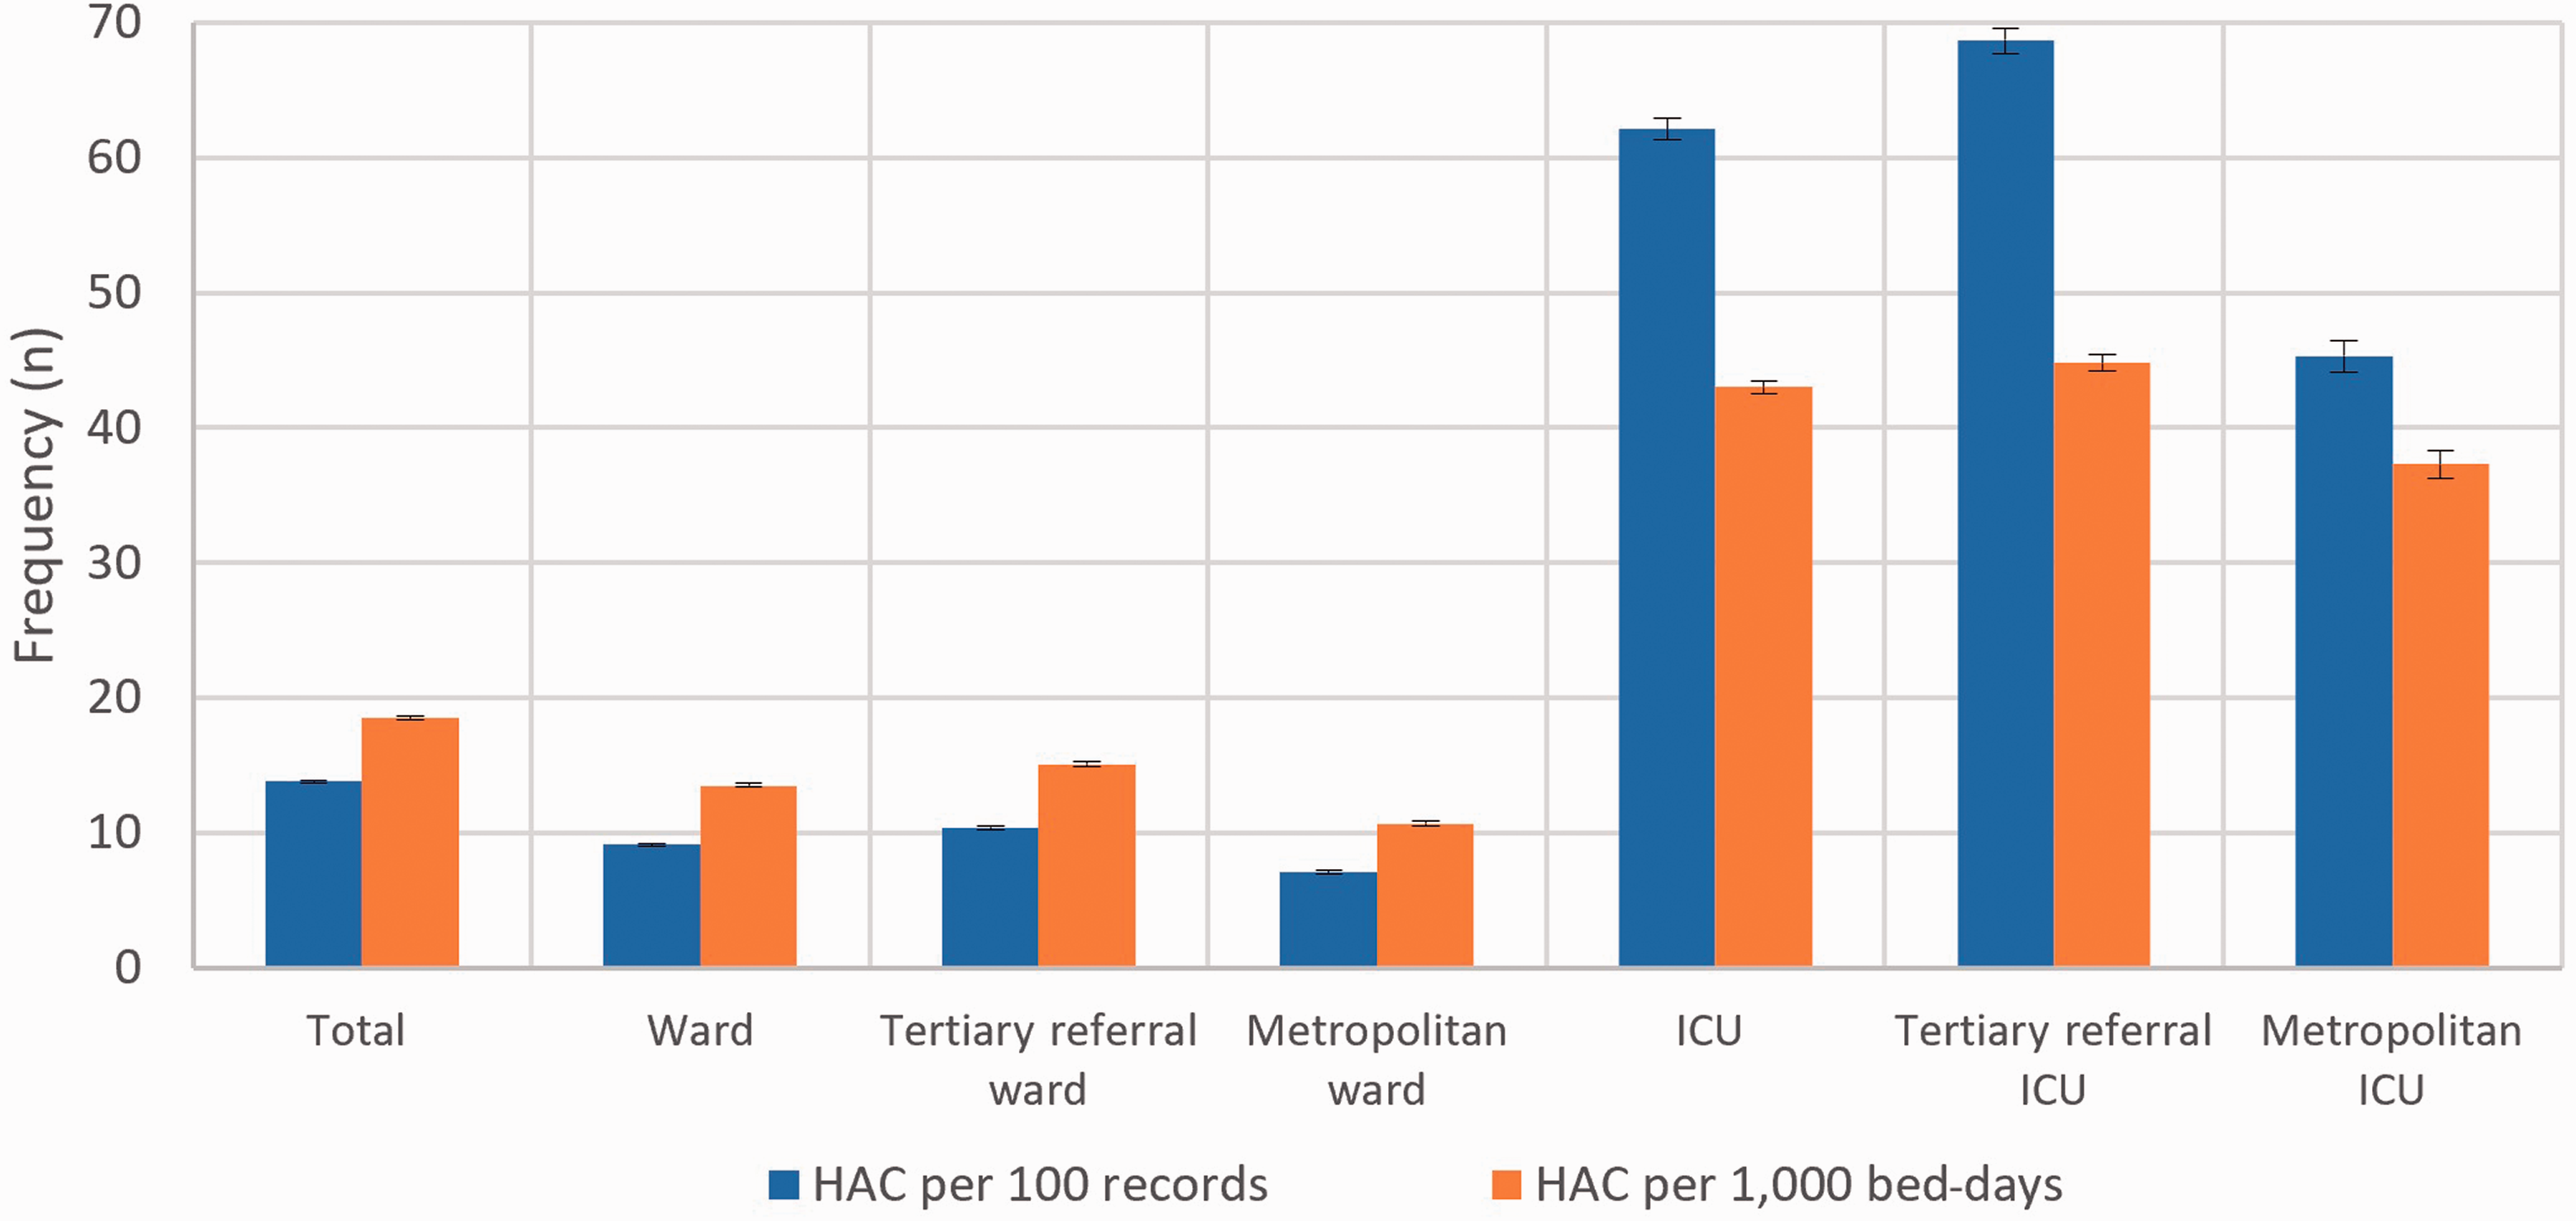
HAC events were reported by all hospitals and their prevalence rates according to Ward and ICU subgroups are presented in Table 3 and Figure 3. Hospital rates ranged from 5.95 to 13.4 per 100 separations and from 11.7 to 24.0 per 1000 bed-days. Hospital HAC rates were compared with quarterly HSMR data; however, no correlation was identified (R = 0.107, P = 0.344).
Frequency and prevalence of Hospital Acquired Complications classes in Ward and intensive care unit subgroups.
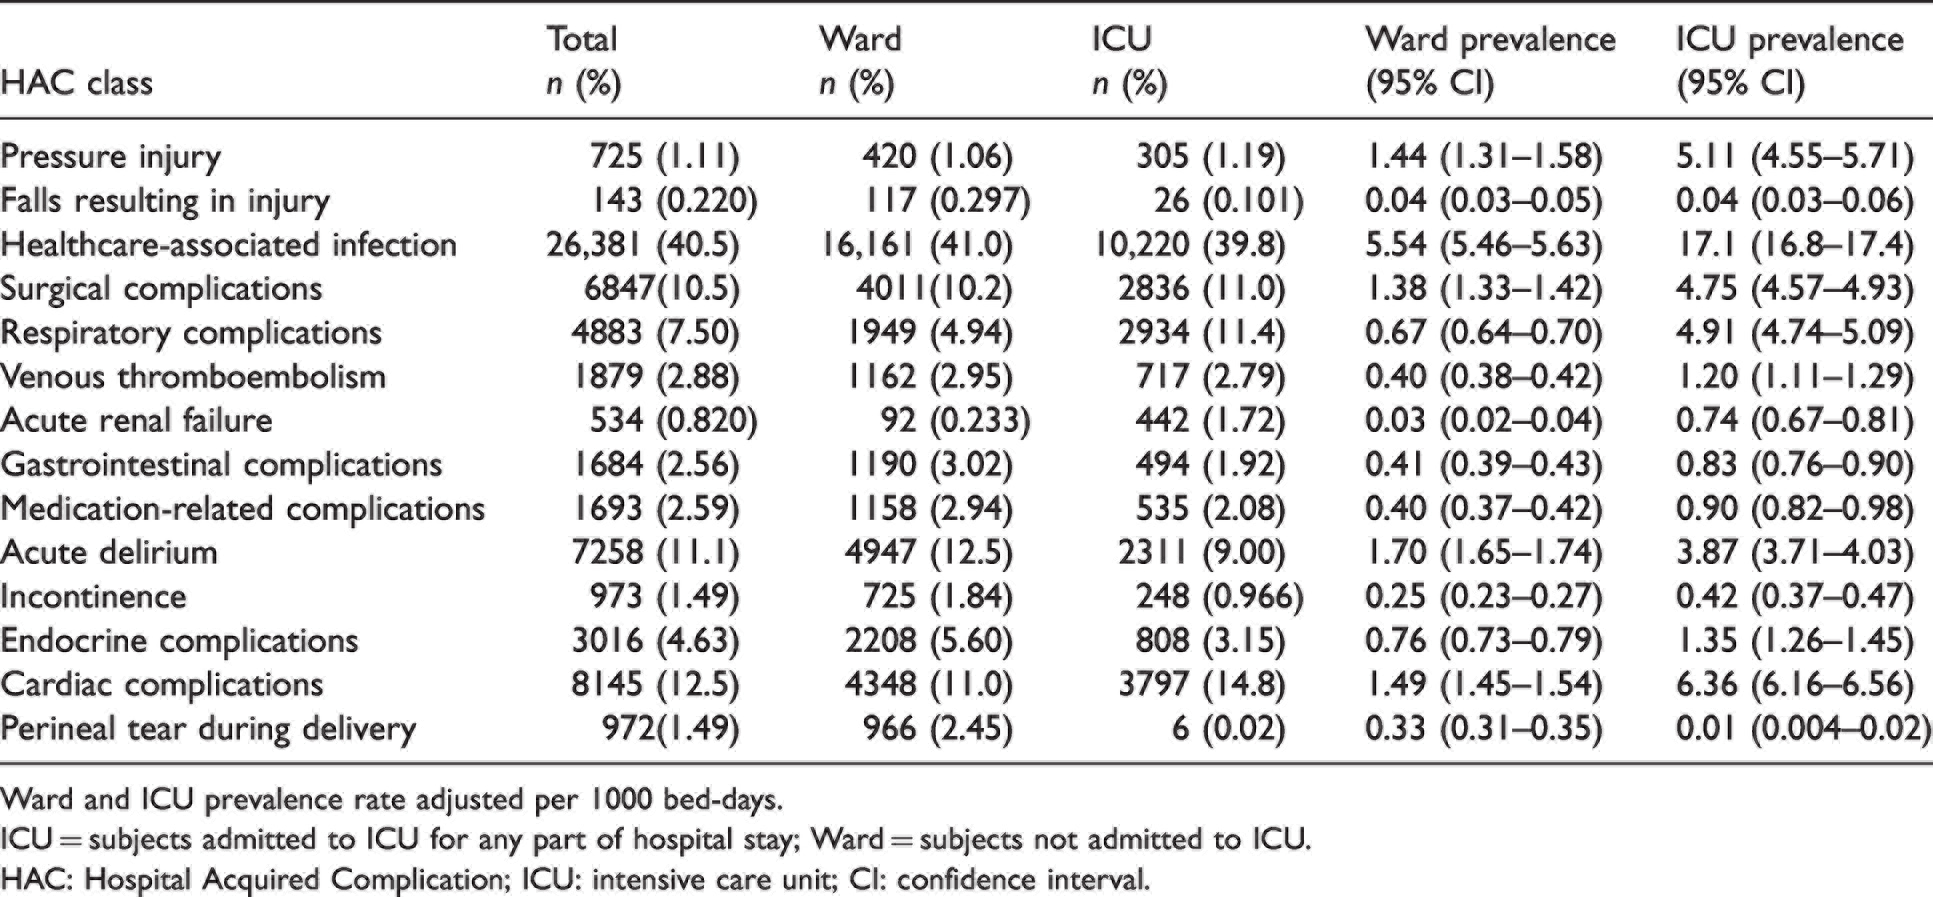
Ward and ICU prevalence rate adjusted per 1000 bed-days.
ICU = subjects admitted to ICU for any part of hospital stay; Ward = subjects not admitted to ICU.
HAC: Hospital Acquired Complication; ICU: intensive care unit; CI: confidence interval.
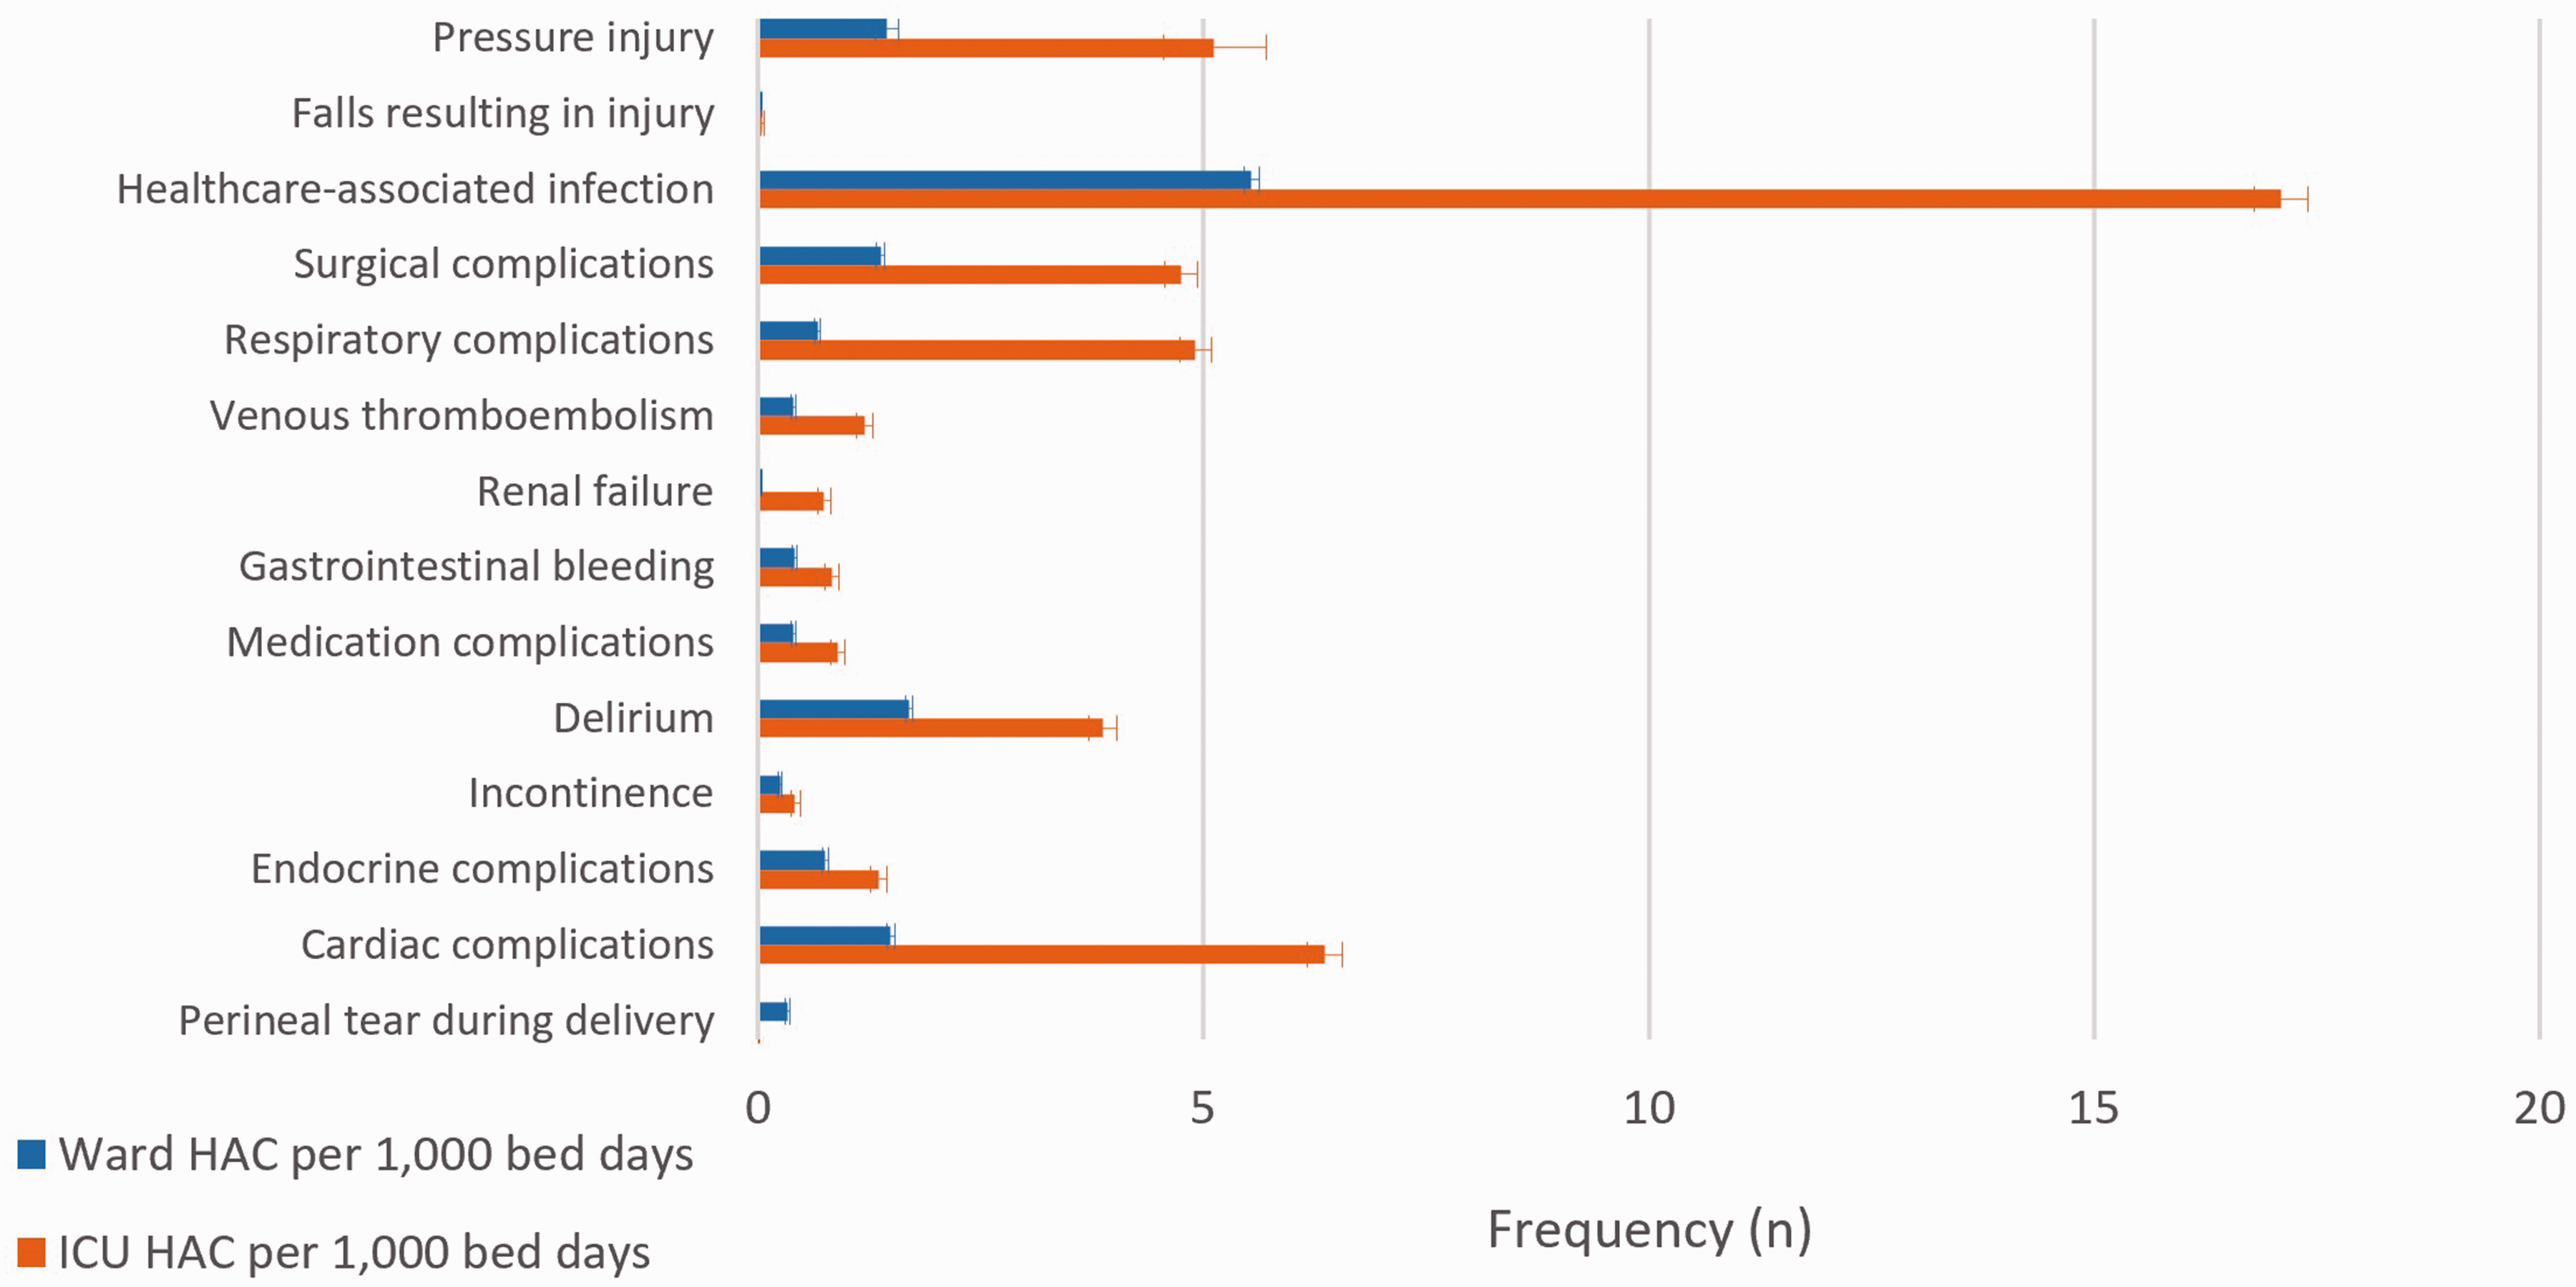
Individual HAC frequency within Ward and ICU populations.
Frequency and prevalence of HAC events were higher in tertiary referral ICUs than major metropolitan ICUs (P < 0.001). Ward separations experienced fewer HAC events compared with ICU separations (6.93% versus 34.2%), and the rate remained higher in tertiary referral compared with major metropolitan hospitals (P < 0.001).
ICU separations were more likely to experience multiple events (1.81 HAC events per separation; 95% CI 1.79 to 1.84) compared with Ward patients (1.32 per separation; 95% CI 1.31 to 1.33; P < 0.001). Despite adjustment for LOS, ICU separations had significantly higher prevalence of HAC events (Table 2). Multivariate analysis identified age, LOS, ICU admission and chronic heart, kidney and liver dysfunction with increased HAC (Table 4).
Adjusted Hospital Acquired Complication prevalence within specific populations.
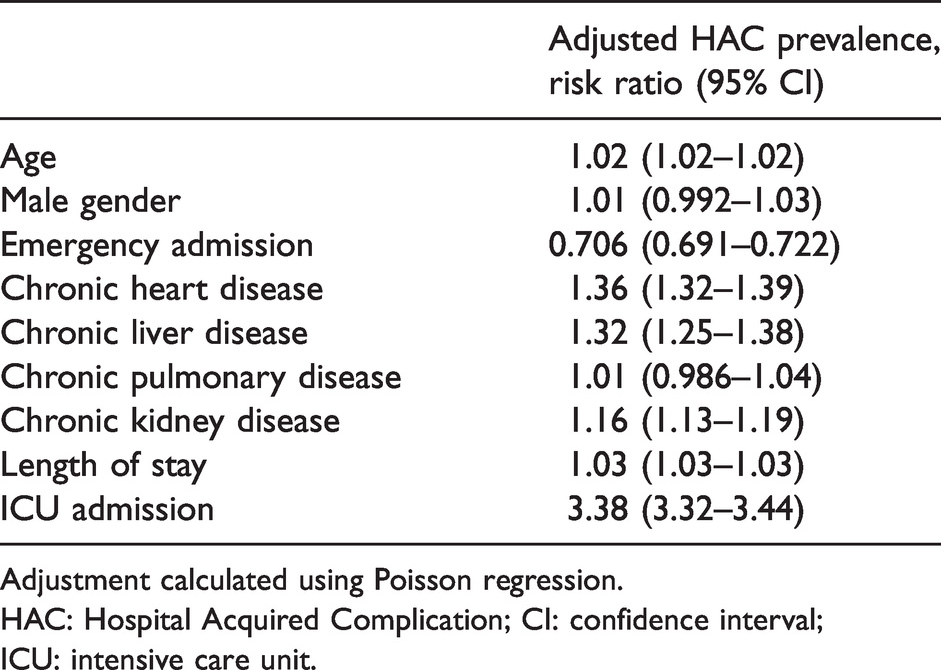
Adjustment calculated using Poisson regression.
HAC: Hospital Acquired Complication; CI: confidence interval; ICU: intensive care unit.
Healthcare-associated infections were the most frequently reported HAC events (26,381, 40.5% (95% CI 40.1 to 40.9)) in both Ward and ICU patients. The two most common sources of infection were pneumonia (39.6%, 95% CI 39.0 to 40.2) and urinary tract infection (28.9%, 95% CI 28.4 to 29.5; Table 5). Other common HAC classes included cardiac complications (8145, 12.5% (95% CI 12.3 to 12.8)), delirium (7258, 11.1% (95% CI 10.9 to 11.4)) and surgical complications requiring unplanned return to theatre (6847, 10.5% (95% CI 10.3 to 10.8)). The most frequent cardiac complications were arrhythmia and acute coronary syndromes.
Frequency and proportion of each Healthcare Acquired Complication subclass within, healthcare-associated infection (Class 3).
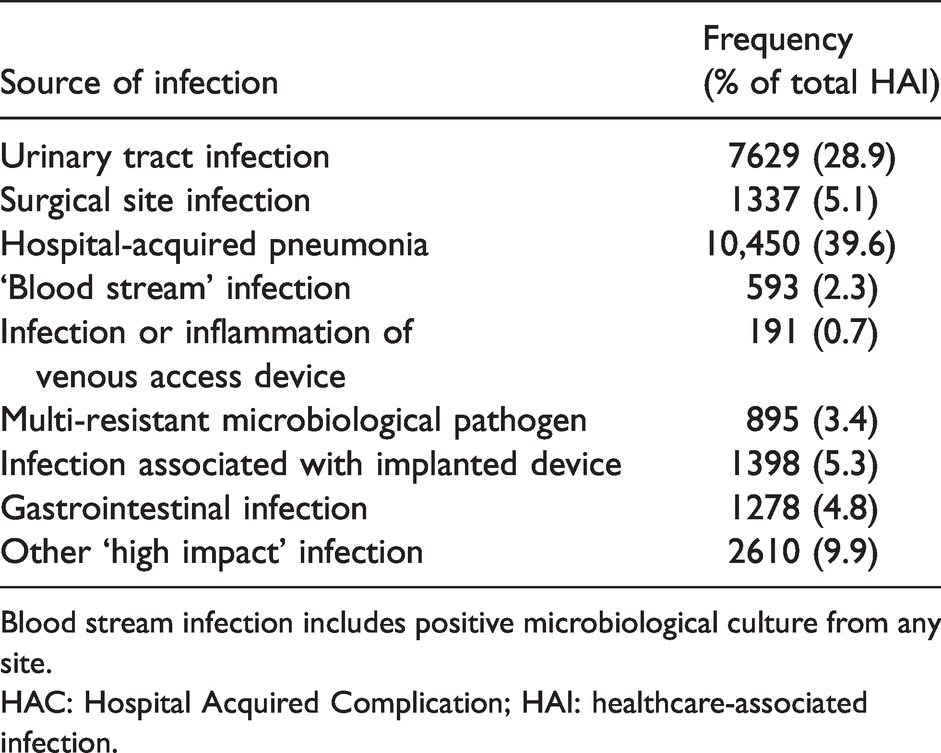
Blood stream infection includes positive microbiological culture from any site.
HAC: Hospital Acquired Complication; HAI: healthcare-associated infection.
Discussion
Key results
Our retrospective analysis identified frequent HAC events in all four major adult hospitals in South Australia affecting on average one in seven separations, at a rate of 18.5 per 1000 bed-days. The prevalence of HAC events was higher in tertiary referral (compared with other major metropolitan sites) and in ICU separations compared with those from other wards.
Although the (non-ICU) Ward accounted for over 90% of hospital separations it was associated with a much lower prevalence of HAC events (one in 15 separations) compared with those receiving ICU support where one in three separations were reported with a HAC event. Even after adjustment for LOS the ICU prevalence was three times as high as those not receiving ICU support (Table 3). Furthermore, HAC events were associated with increased LOS and mortality risk.11,12
The most common HAC events were healthcare-associated infection, cardiac complications, delirium and surgical complications. This is largely consistent with national HAC data (2017–2018). 2 The disproportionate impact of healthcare-associated infection may reflect the difficulty of accurate clinical diagnosis, in addition to poorly defined reporting criteria. 13
Limitations
Limitations of our investigation include the absence of a causal explanation of HAC events. We are unable to determine the chronological association of HAC events and ICU transfer; they may precipitate ICU admission, occur during ICU stay or arise after transfer out of the ICU. Sixty-seven percent of separations were excluded from analysis, introducing the possibility of selection bias. This is evident in the reduced emergency admission HAC rate, reflecting a significant volume of elective admissions that were excluded due to LOS ≤1 day. External validity of our results is impacted by utilising solely South Australian data, with 64.2% of separations within tertiary referral hospitals. Although a lack of correlation between HSMR and HAC underscores the point that HACs are possibly due to patient characteristics themselves, this might also be explained by Simpson’s paradox and requires further investigation with a larger dataset. Comparison of patient cohorts between major metropolitan and tertiary-referral hospitals is limited due to the absence of illness severity scores. Our dataset relies upon the unknown reliability of administrative data to capture adverse events. Coding relies on the quality of medical documentation, which may under-report adverse events or over-report events that attract greater funding. The ISAAC database does not capture all clinically-relevant information (for example, distinguishing between atrial fibrillation and ventricular tachycardia). Future prospective studies should examine this granular data.
Interpretation
There are several implications from these findings. All hospitals reported HAC events and all are serious adverse events that may respond to preventative strategies. Administrative data are unable to separate those HAC events arising from hospital-related factors (including healthcare error or resource deficiencies) from patient-related factors that are less dependent on the provision of care. 14 This distinction is important when deriving effective mitigation strategies.
There is no pre-existing literature comparing ICU and Ward separations using current HAC methodology. The higher rate of HAC events in ICU (compared with Ward) separations and in tertiary referral (compared with other major metropolitan) hospitals can be explained by three possible scenarios. Either, the standard of care is lower at these sites despite greater expertise and resources; or the case-mix carries a higher risk of patient-related adverse events that are independent of the provision of care; or a combination of both. Whilst a proportion of HAC events may be unavoidable for the ICU patient cohort, only a detailed clinical audit can identify the true explanation for each hospital. This is crucial for identifying preventable healthcare errors and deriving effective mitigation strategies for all HAC events.
HAC remains a useful tool for clinicians and hospital safety officers. Extraction of HAC data utilises existing data sources and accessible extraction methods.12,15,16 Elevated HAC rates may provide a useful screening tool or ‘signpost’ for adverse clinical events that warrant further audit to ensure deficiencies are identified and addressed. Since rates associated with ICU separations are higher than in other Wards, intensivists may be asked to comment on HAC rates and investigate their provision of care. Knowledge of HAC will benefit intensivists who may also be involved in quality and safety programmes.
In conclusion we identified a high rate of HAC events in all study hospitals and higher still in tertiary referral hospitals and separations receiving intensive care. Whether these higher rates reflect patient-related characteristics or differences between hospitals in their provision of care requires further investigation through targeted observational and interventional studies. Several patient groups have been identified as independent risk factors for HAC; we recommend that hospitals undertake targeted clinical audits and review of reported HAC events to determine relevant mitigation strategies. We caution against the HAC method as a barometer of the standard of patient care until supporting clinical evidence is available.
Footnotes
Author Contribution(s)
Acknowledgements
We thank all the hospital information managers who code medical records, and the Ministry of Health, SA, for providing access to these data.
Declaration of conflicting interests
The authors have no conflicts of interest to declare.
Funding
The authors received no financial support for the research, authorship, and/or publication of this article.