
Abstract
This cross-sectional overview of the second 4000 incidents reported to webAIRS has findings that are very similar to the previous overview of the first 4000 incidents. The distribution of patient age, body mass index and American Society of Anesthesiologists physical status was similar, as was anaesthetist gender, grade, location and time of day of incidents. About 35% of incidents occurred during non-elective procedures (vs. 33% in the first 4000 incidents). The proportion of incidents in the various main categories was also similar, with respiratory/airway being most common, followed by cardiovascular, medication-related and medical device or equipment-related incidents. Together these categories made up about 78% of all incidents in both overviews. The immediate outcome was comparable with reports of harm in about a quarter of incidents and a similar rate of deaths (4.7% vs. 4.2%). However, the proportion of patients who had received total intravenous anaesthesia was higher (17.6% vs. 7.7%) and the proportion of patients who received combined intravenous and inhalational anaesthesia was lower (52.3% vs. 58.4%), as was the proportion receiving local anaesthesia alone (1.6% vs. 6.7%). There was a small increase in the number of incidents resulting in unplanned admission to a high dependency or intensive care unit (18.1% vs. 13.5%). It is not clear whether these differences represent trends or random observations. About 48% of incidents were considered preventable by the reporters (vs. 52% in the first 4000). These findings support continued emphasis on human and system factors to promote and improve patient safety in anaesthesia care.
Keywords
Introduction
In 2017, the Australian and New Zealand Tripartite Anaesthesia Data Committee (ANZTADC) published a cross-sectional overview of the first 4000 incidents that had been reported to its voluntary, de-identified web-based anaesthesia incident reporting system, webAIRS. 1 The incidents had been reported between 2009 and July 2016. Since then there have been several subsequent publications based on these 4000 reports, including an analysis of patient and procedural factors influencing the outcome of incidents, 2 and analyses focusing on particular incident types, such as those related to awareness, 3 aspiration, 4 airway 5 and, more recently, medication. 6 Data from webAIRS reports have also been presented regularly at anaesthesia scientific meetings, with updates presented in articles in the ANZCA Bulletin, Australian Anaesthetist, and NZSA Magazine. The number of sites reporting to webAIRS has also increased from 134 in 2016 to 210 in 2020.
Since July 2016, webAIRS has continued to receive reports at an increasing rate, and by May 2020, a further 4000 reports had been received. The primary aim of this paper is to present a cross-sectional overview of these second 4000 reports. A secondary aim is to compare the data informally between the two reports in order to identify whether there are similarities that would strengthen initial assumptions about the nature and type of anaesthesia incidents in Australia and New Zealand, or differences that might be worthy of further investigation as to their likely cause.
Methods
ANZTADC was created by, and is funded by, the Australian Society of Anaesthetists, the Australian and New Zealand College of Anaesthetists and the New Zealand Society of Anaesthetists. webAIRS is a craft-specific easy to use, web-based incident reporting system developed by ANZTADC for anaesthetists. The methods for collecting and analysing webAIRS reports have previously been described. 1 Briefly, the reports are collected in a de-identified fashion, and any information that may potentially identify a patient, practitioner, institution, or event, is removed or rephrased in anonymous terms. The data entry screens are self-explanatory. The taxonomy of the database is relevant to the specialty (the data entry fields can be seen at the demonstration site). 7 Access to the system is restricted to registered members of the three founding organisations. A downloadable brochure on the system is available. 8
webAIRS data collection complies with current ethics requirements for the collection of de-identified quality assurance data in Australia, as outlined by the National Health and Medical Research Council (NHMRC, 2014). 9 In order to ensure that the data collection meets the NHMRC requirements ethics approval has been sought and obtained from two hospitals in Australia: the Royal Brisbane and Women’s Hospital Human Research Ethics Committee (HREC/11/QRBW/311) and the Nepean Blue Mountains local health district (HREC/12/NEPEAN/18). Ethics approval in New Zealand was obtained from the Health and Disability Ethics Committee, (MEC/09/17/EXP). In addition, reporters at each site must comply with local institutional approval requirements. The reports are confidential and protected by qualified privilege in both Australia and New Zealand.
Each incident report was reviewed by an ANZTADC officer who removed duplicate, test or empty records. All remaining incidents were considered valid. Summary information on the second 4000 incidents was then generated. Missing data were not imputed: percentages for each variable were calculated using 4000 as the denominator (unless otherwise specified). While every attempt was made to ensure that all summary data, including percentages, were accurate, it is possible that minor inaccuracies occurred during the process of summarising data.
Results
The 4001st valid incident reported to webAIRS occurred in July 2016, and the 8000th in May 2020. Over this period the number of sites reporting increased from 134 to 210 (168 in Australia and 42 in New Zealand). Of the 4000 incidents, 48.1% related to a female patient and 44% to a male patient (in 7.9% of incidents, no patient was involved or gender was not specified). In the first 4000 incidents, 45.3% involved female patients and 44.7% involved male patients; 10% were not specified or no patient was involved. Ethnicity was not collected for either period. Thirty-five per cent of incidents related to non-elective cases (vs. 33% in the first 4000 incident reports); 47.6% of incidents were considered by the reporters to have been preventable (vs. 52.2% in the first 4000 incident reports).
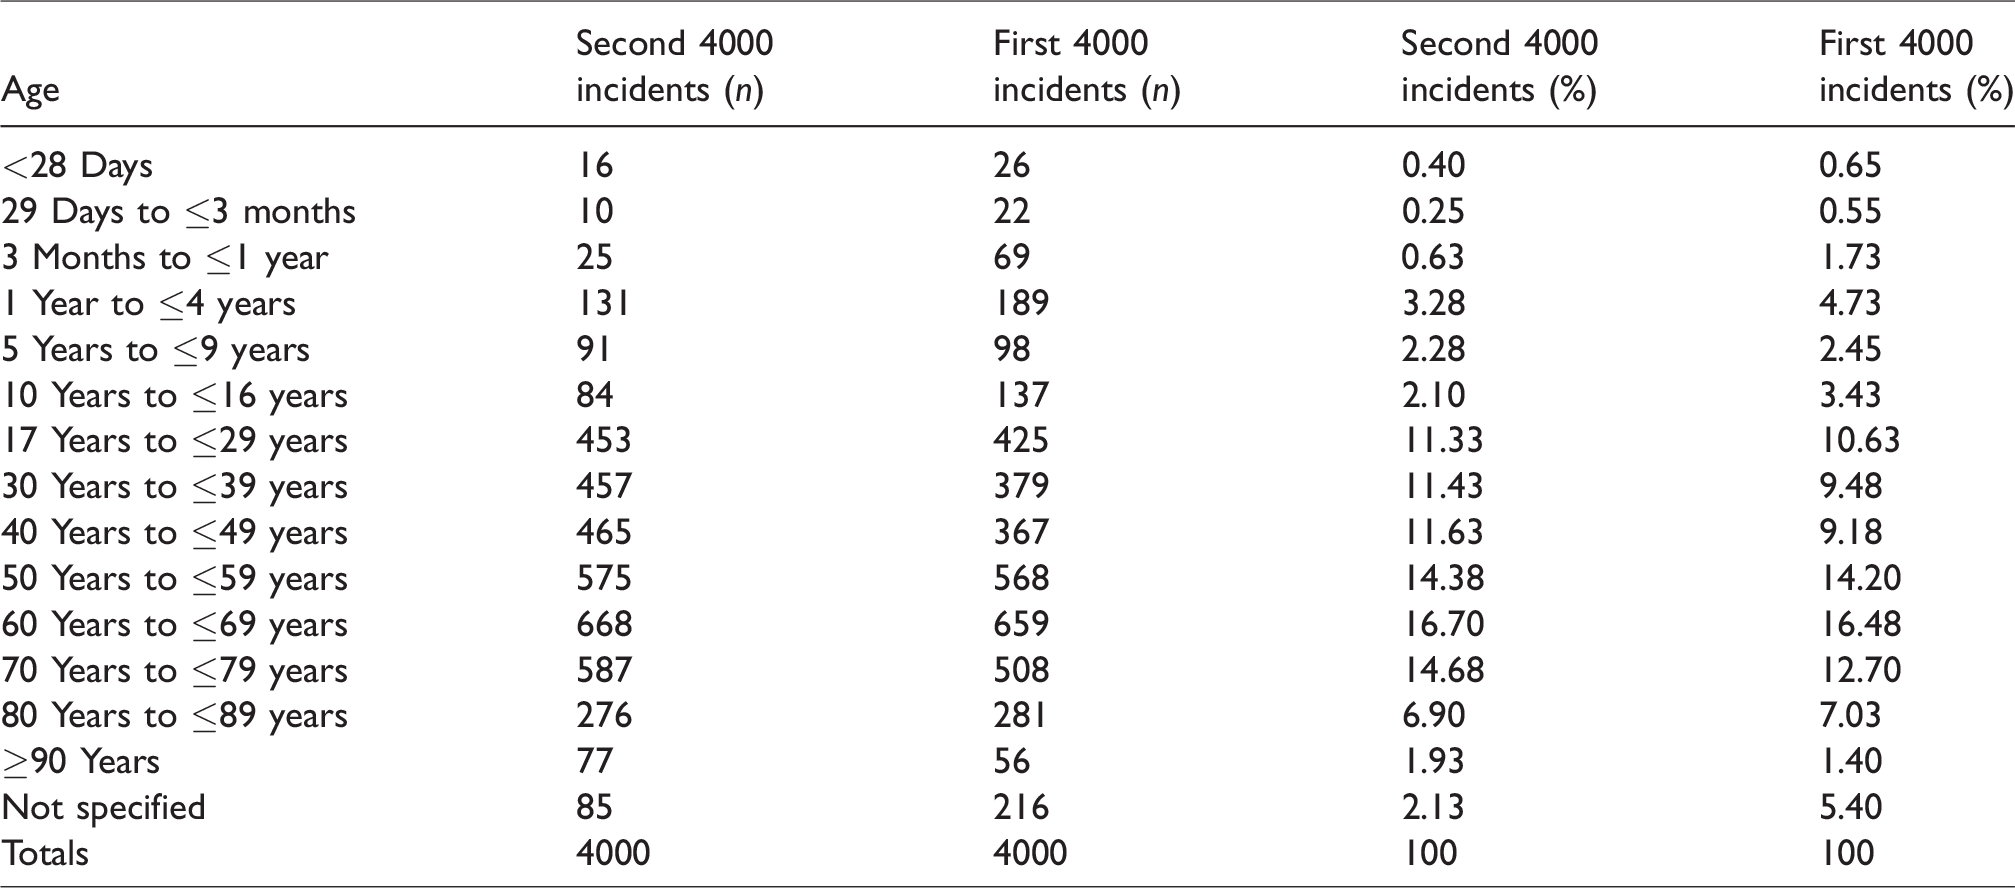
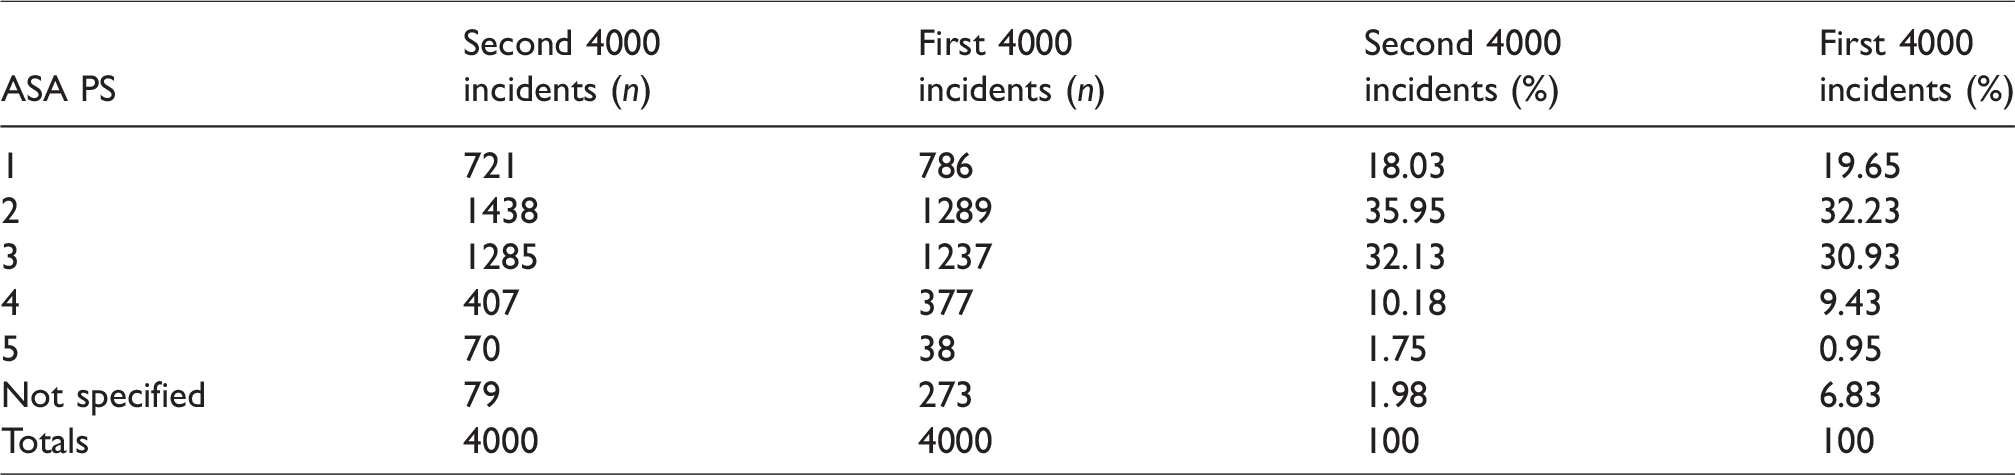
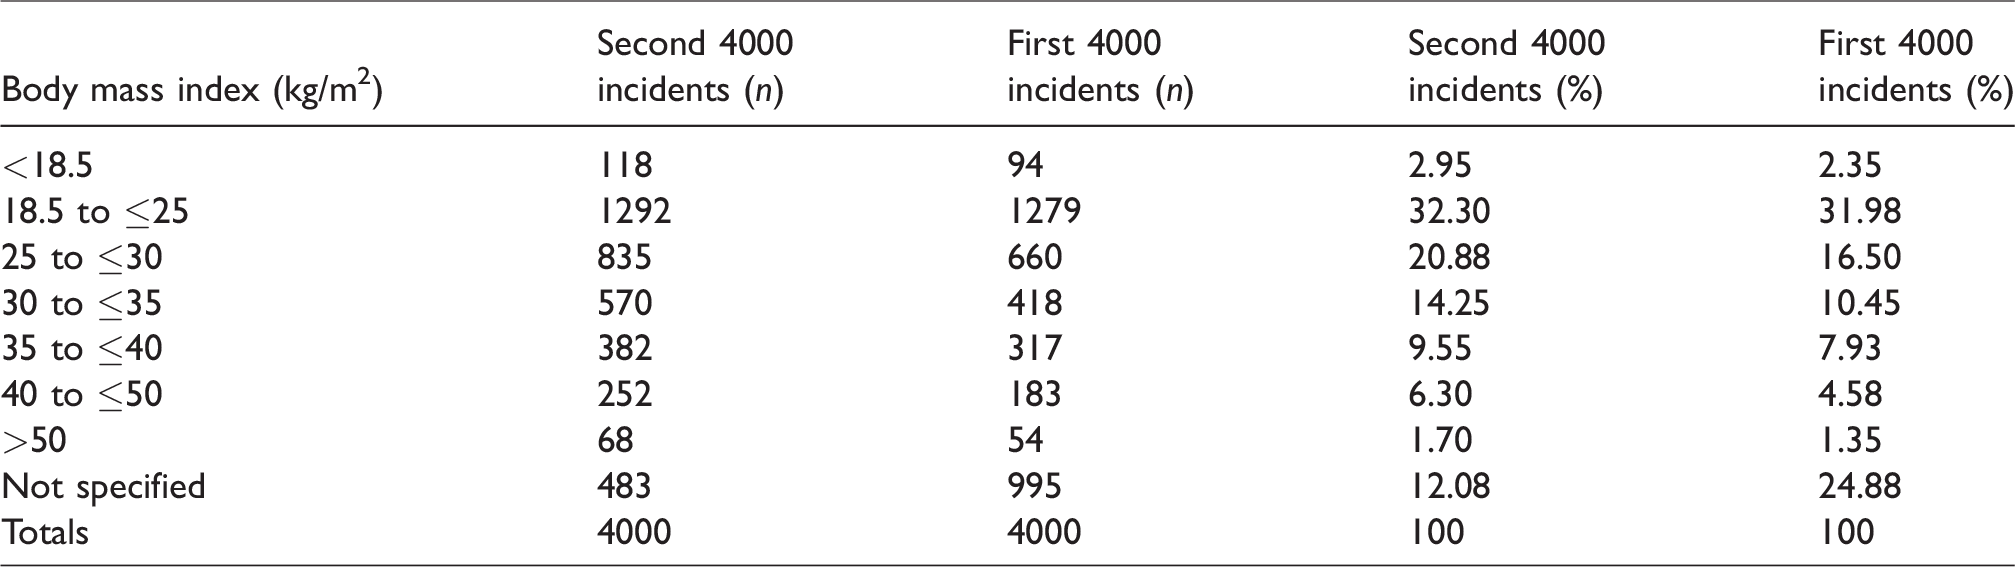
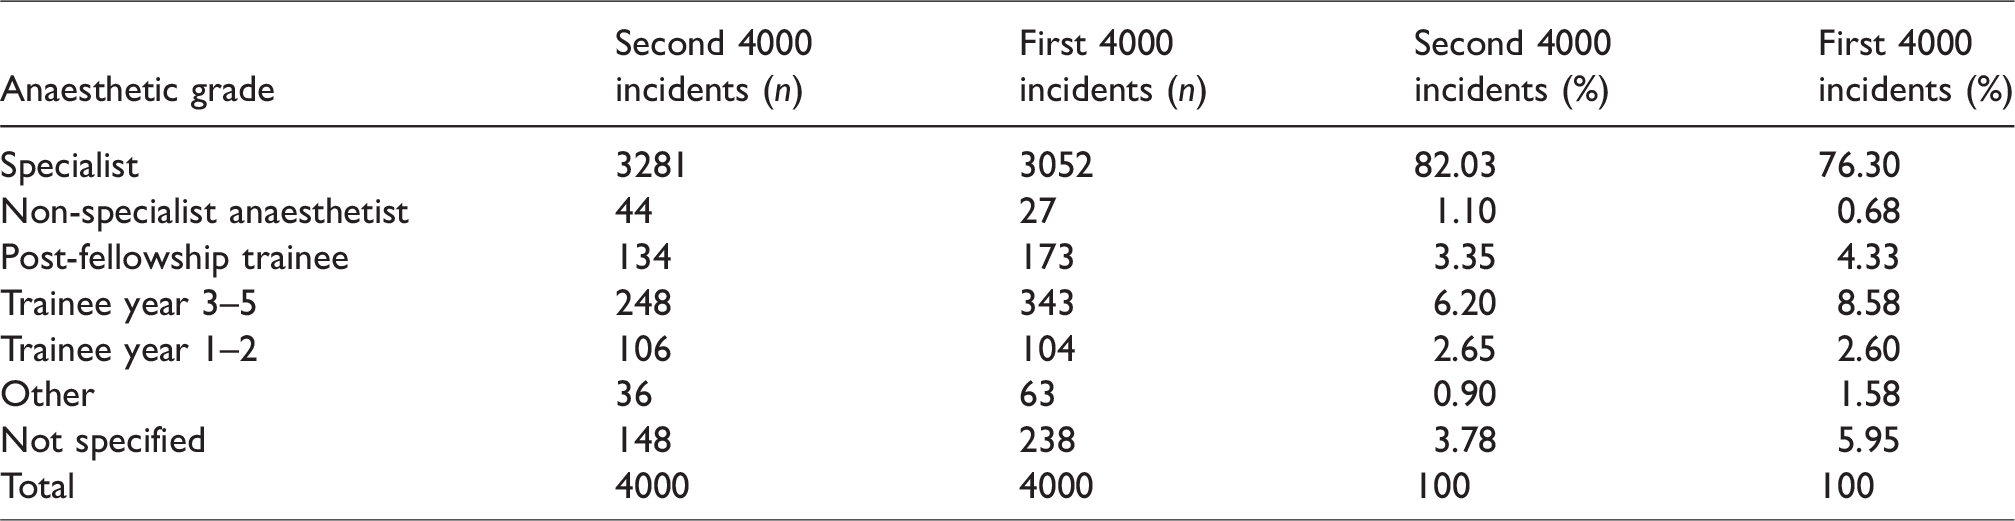
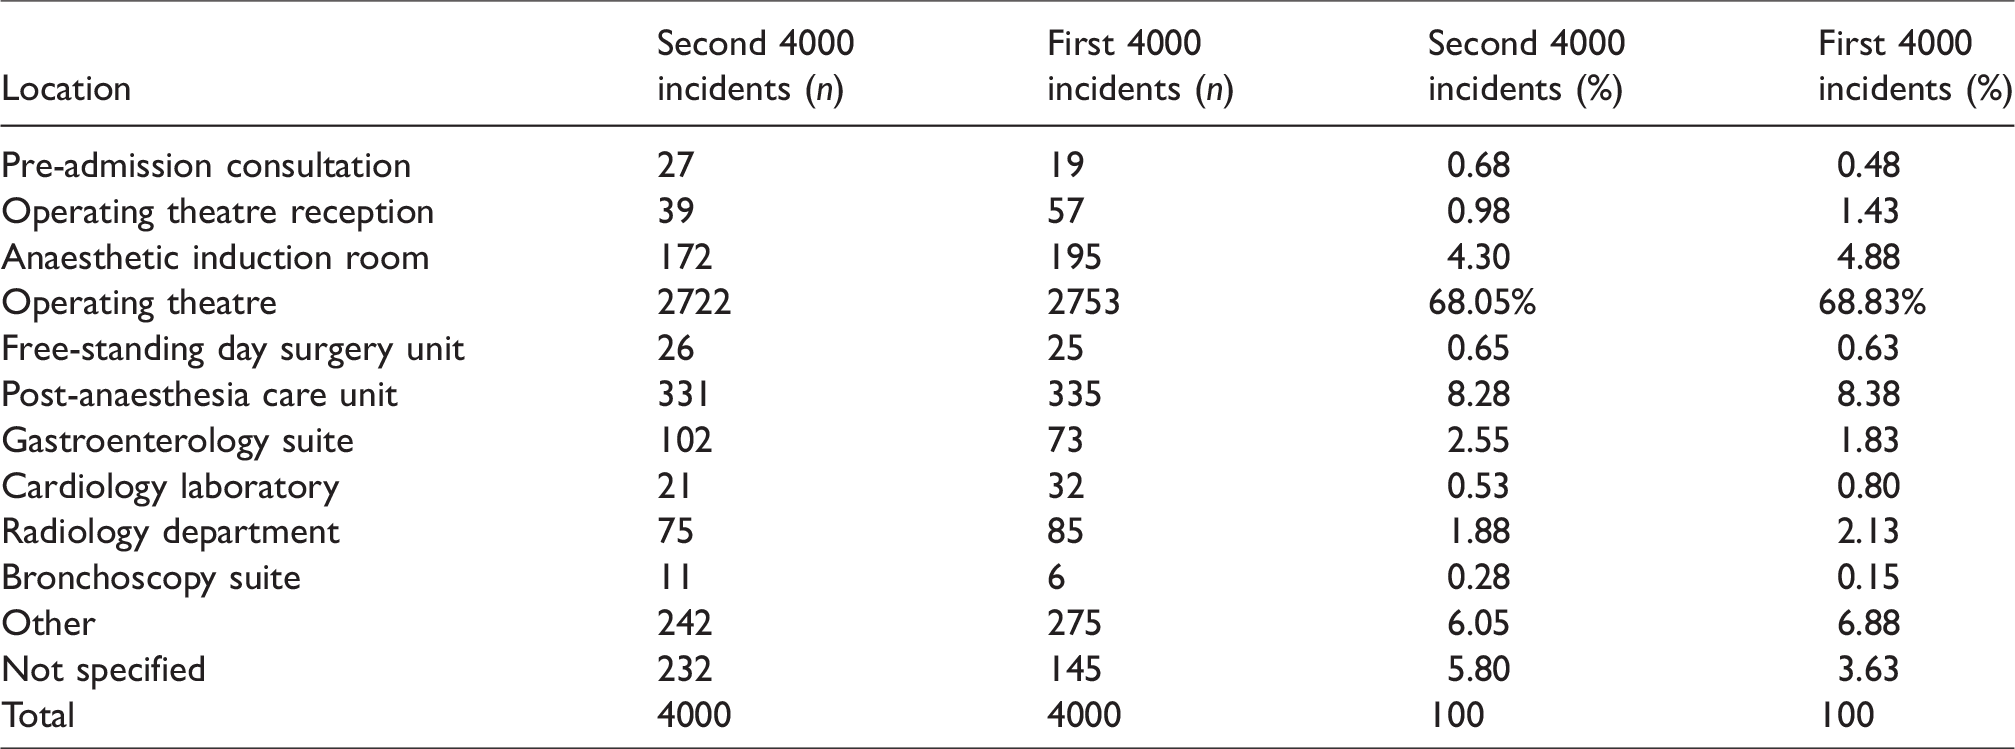
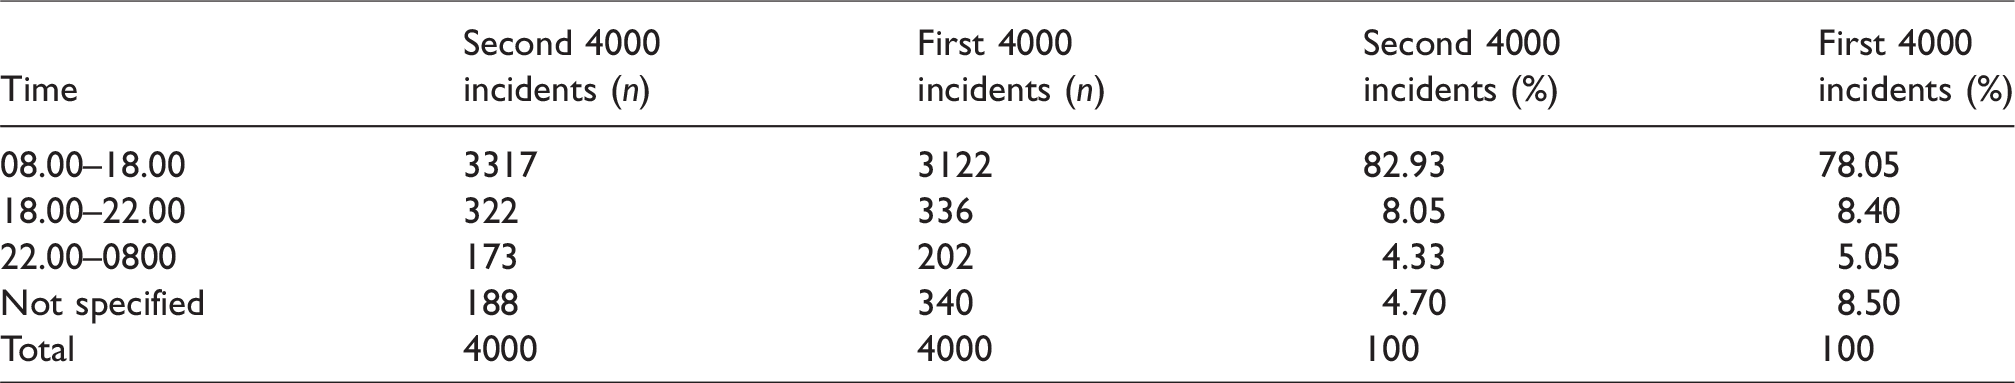
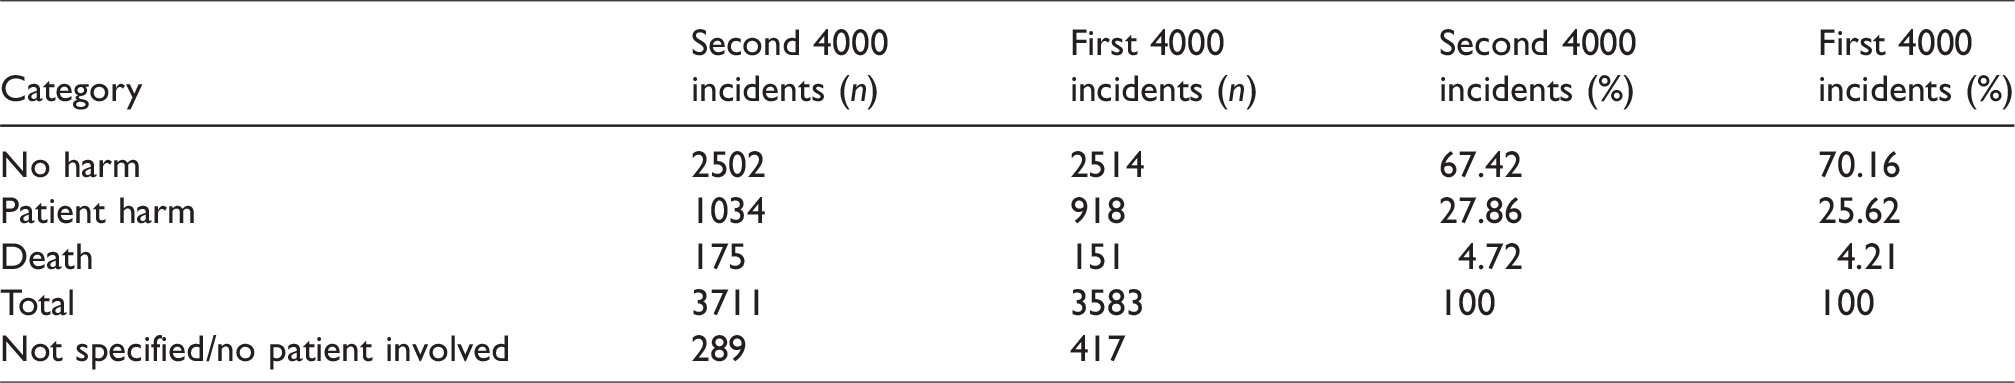
As for the first 4000 incidents, there was a wide range of patient age, American Society of Anesthesiologists physical status (ASA PS) and body mass index (BMI) for the second 4000 incidents (Tables 1–3). About 52% of incidents involved combined intravenous and inhalation anaesthesia, 18% total intravenous anaesthesia (TIVA), 12% sedation or monitored care and 21% regional or local anaesthesia (Table 4). A specialist anaesthetist was in attendance for over 80% of the incidents (Table 5). About 72% of incidents occurred in an operating theatre or anaesthesia induction room, 8% in a post-anaesthesia care unit and 11% in a procedural room remote from the operating theatres (e.g. gastroenterology, cardiology or radiology suite) (Table 6). Most incidents occurred during daytime operating hours (82.9%) (Table 7). The most common main categories of incidents were respiratory/airway, cardiovascular, medication and medical device or equipment, together making up about 78% of incidents (Table 8); 27.8% of incidents were associated with some patient harm, and 4.7% involved a patient death (Table 9). Incidents were associated with cancellation of a procedure in about 6% of cases, prolonged hospital length of stay in a further 6% and an unplanned intensive care unit (ICU) or high dependency unit (HDU) admission in 18% (Table 10).
Patient age.
American Society of Anesthesiologists physical status (ASA PS).
Body mass index.
Anaesthesia technique.
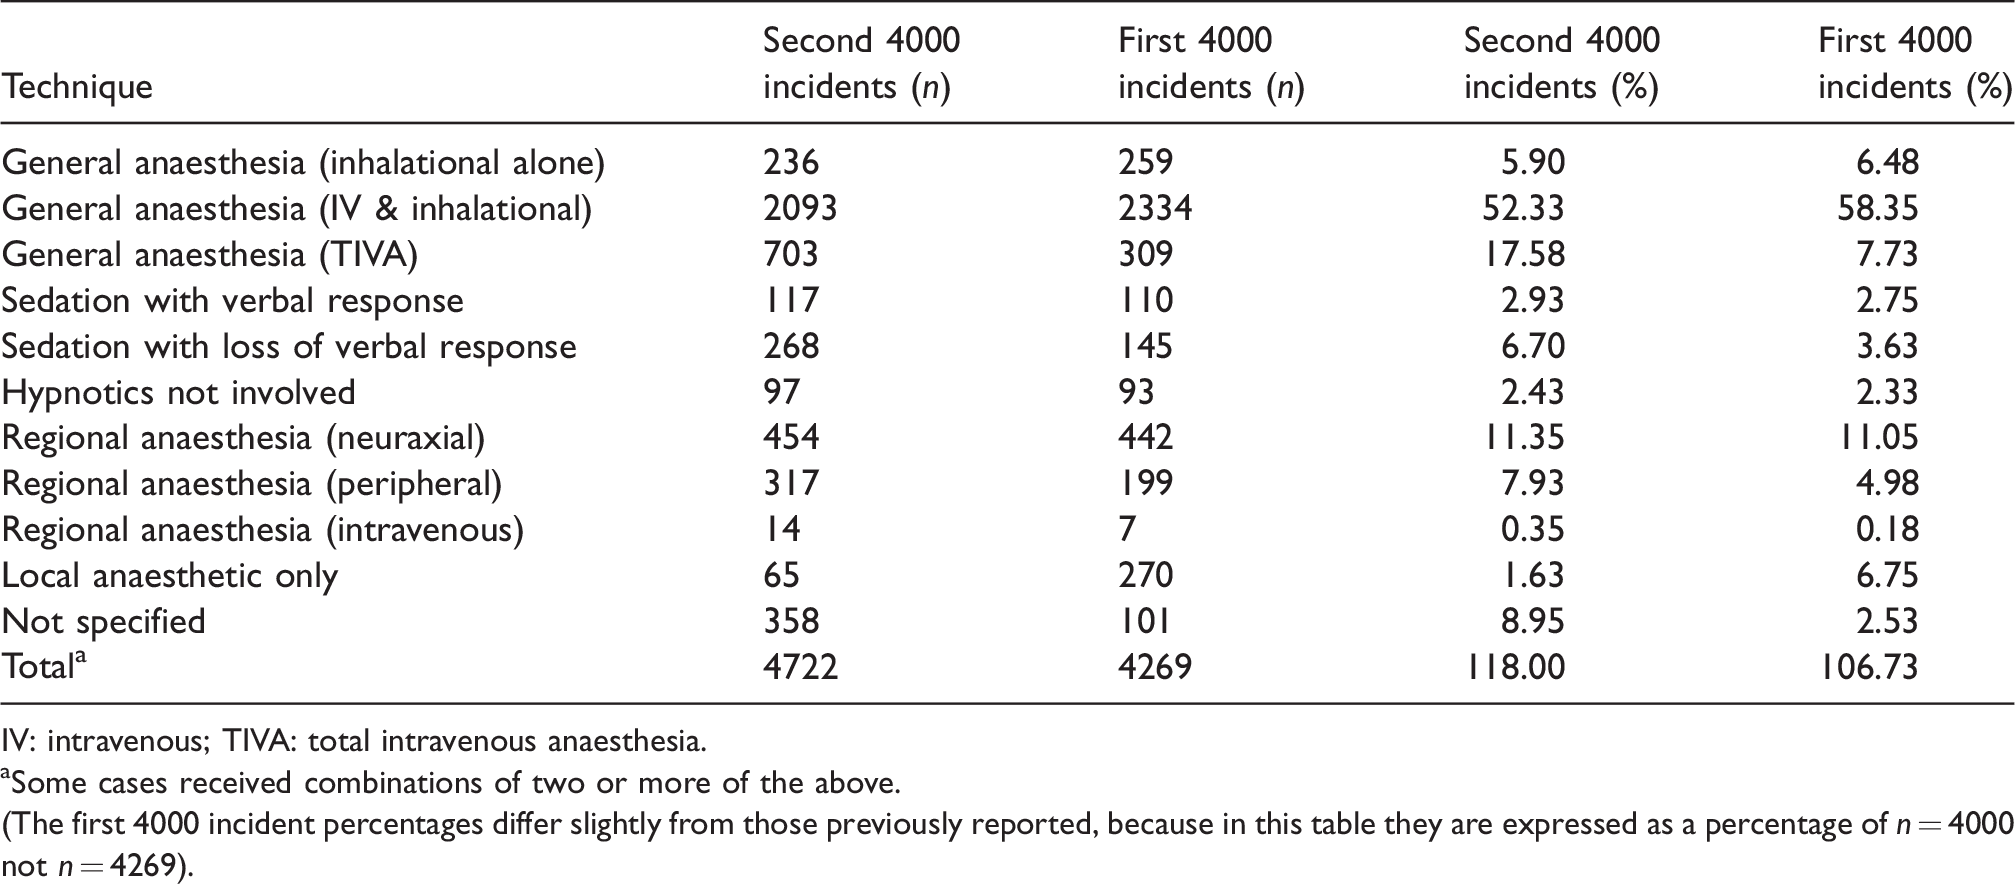
IV: intravenous; TIVA: total intravenous anaesthesia.
aSome cases received combinations of two or more of the above.
(The first 4000 incident percentages differ slightly from those previously reported, because in this table they are expressed as a percentage of n = 4000 not n = 4269).
Anaesthetist grade.
Location of incident.
Time of incident.
Main category of incident.a
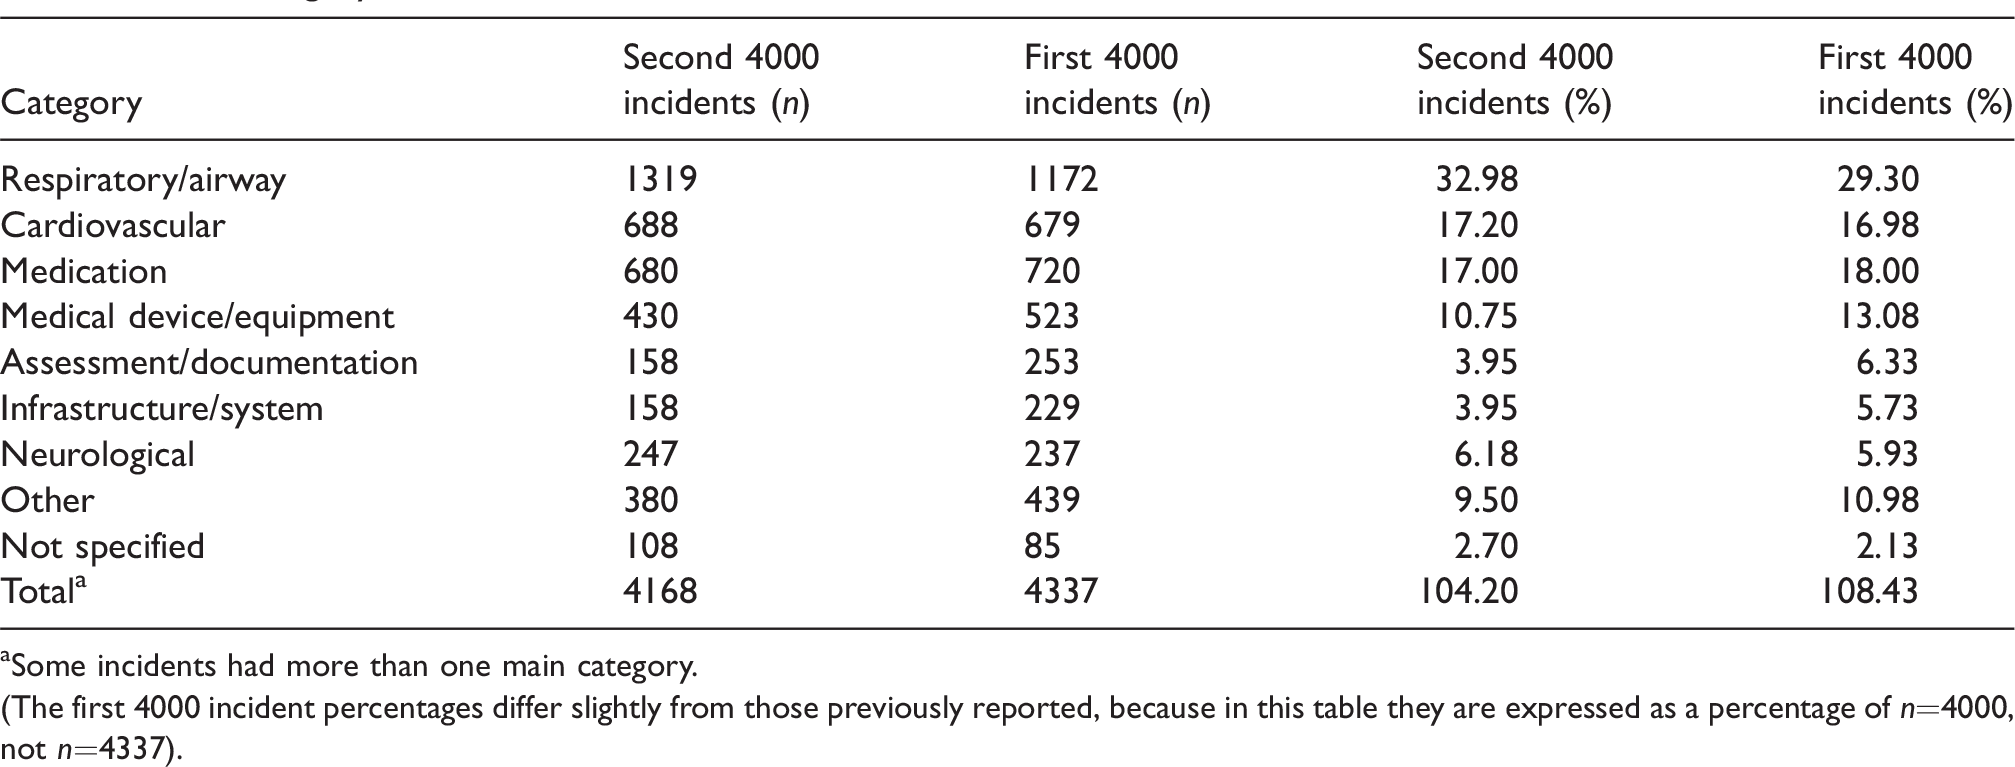
aSome incidents had more than one main category.
(The first 4000 incident percentages differ slightly from those previously reported, because in this table they are expressed as a percentage of n=4000, not n=4337).
Outcome of incident at time of reporting.
Cancellation, prolonged length of stay, and unplanned intensive care unit (ICU) or high dependency unit (HDU) admission.
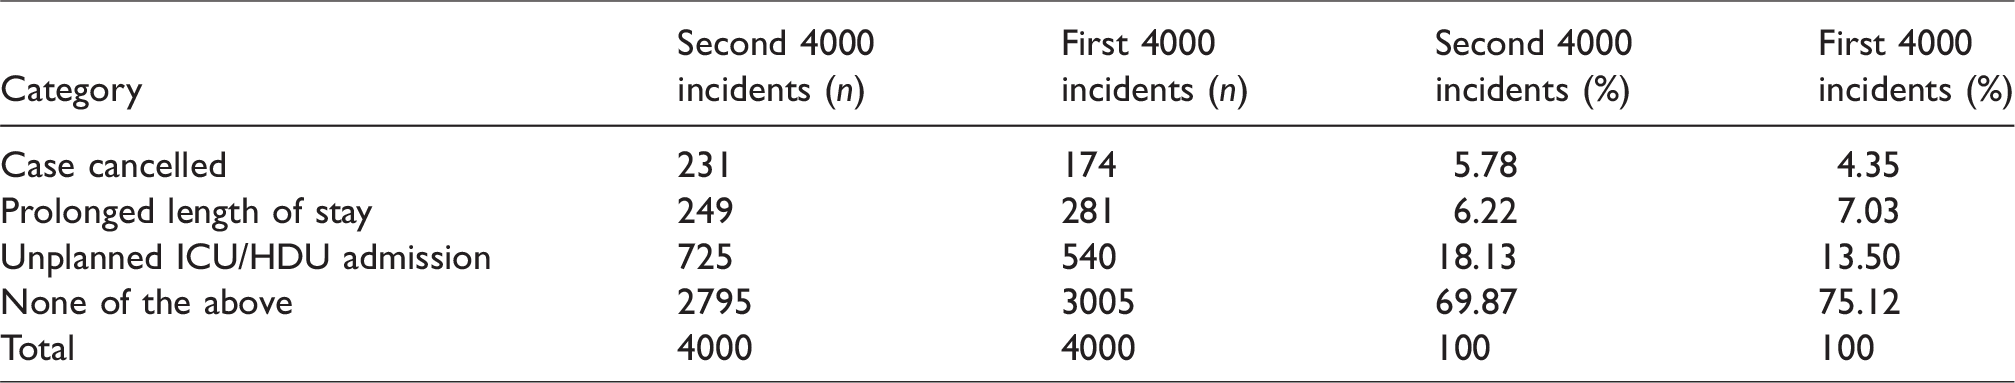
The proportion of incidents in the various categories between the first and second 4000 incidents was mostly within a few percentage points (Tables 1–10). Notable exceptions included a higher proportion of incidents involving patients receiving TIVA in the second 4000 incidents (17.6% vs. 7.7% in the first 4000 incidents), a lower proportion of patients who received combined intravenous and inhalational anaesthesia (52.3% vs. 58.4%) and a lower proportion receiving local anaesthesia alone (1.6% vs. 6.7%) (Table 4). There was also a higher proportion of incidents associated with an unplanned ICU or HDU admission (18.1% vs. 13.5%) (Table 10).
Discussion
This cross-sectional overview of the second 4000 incidents reported to webAIRS has findings that are very similar to the previous cross-sectional overview of the first 4000 incidents reported to webAIRS. The distribution of patient age, BMI and ASA PS was similar, as was anaesthetist gender, grade, incident location and time of day of incident. 1 The proportion of incidents in the various main categories was also similar, with respiratory/airway incidents being most common, followed by cardiovascular incidents, medication-related incidents and medical device or equipment-related incidents. 1 Together these four main categories made up 78% of all incidents in both overviews. The immediate outcome of the incidents was also similar, with harm occurring in 27.8% (vs. 25.6% in the first 4000 incidents) and a similar rate of deaths (4.7% vs. 4.2%).
The close similarity between the first and second 4000 reports suggests that data obtained in both overviews are not a random sample but are rather a true representation of incidents considered worth reporting by those sites in Australia and New Zealand reporting to webAIRS. The incidents were reported in different time periods (2016 to 2020 vs. 2009 to 2016), and across up to 210 independent sites across Australia and New Zealand, so it is unlikely that the similarities would occur by chance alone. It is also unlikely that the two overviews represented incidents of different severity over the two periods, given that the outcomes were also similar. The question of whether the incidents are representative of all anaesthesia incidents occurring across Australia and New Zealand is much broader, because this cannot be determined using a voluntary de-identified process. Nevertheless, both overviews are among the largest datasets of de-identified anaesthesia incidents reported from any source.
While most of the findings of this second overview were similar to the first overview there were notable differences in the proportions of particular anaesthetic techniques used. For example, the proportion patients who received TIVA was 17.6% (vs. 7.7% in the first 4000 incidents) and the proportion of patients who received combined intravenous and inhalational anaesthesia was lower (52.3% vs. 58.4% (Table 4). There were more minor differences in the proportion receiving local anaesthesia alone (1.6% vs. 6.7%), sedation with loss of verbal response (6.7% vs. 3.6%) and peripheral nerve blocks (7.9% vs. 4.9%). It is not clear whether these differences represent true differences related to changes in practice, true changes in the number, severity or type of incidents reported, or related to these techniques or random observations. This may become clearer in subsequent analyses of the incident narratives. In relation to immediate outcomes there was a higher proportion of incidents associated with an unplanned admission to an ICU or HDU (18.1% vs. 13.5% in the first 4000 incidents).
Unfortunately, we cannot comment on the ethnicity of patients in either the first or second 4000 incidents, because reporters were not prompted to provide this information. This was to avoid the risk of inadvertent surrogate identification of patients in smaller ethnic groups. Now that there are over 8000 incident reports, plans are underway to commence data collection for ethnicity.
It is tempting when reading summary reports of incidents to try to estimate the rate of incidents. Obtaining a true rate is an attractive goal, because only then can trends in anaesthesia incidents be monitored, and the success or otherwise of interventions be assessed. However, unless reporting is mandatory or automatically generated from electronic records, it is not possible to obtain a true rate for the number of incidents occurring (i.e. an accurate numerator), let alone the total number of anaesthetics performed by the sites reporting incidents (an accurate denominator). To our knowledge, no such system is in place for such mandatory or automatic data collection at national levels, although voluntary reporting systems exist in many countries. 10
Although numerators and denominators for anaesthesia incidents may be difficult to obtain at a state or national level, it may be possible to estimate rates by extrapolation from smaller cohorts (e.g. data collected from individual hospitals or groups of hospitals). For example, nine of the New Zealand hospitals reporting to webAIRS use the SaferSleep Operating Room automatic record keeping system (SaferSleep, Auckland, NZ), thus providing a denominator of anaesthetics performed in these hospitals. Using this denominator the rate of incidents reported to webAIRS from these hospitals during the reporting period of the second 4000 incidents was about 0.15% (one in 666 anaesthetics) (M. Culwick, unpublished observations). A recent study by Endlich et al. of airway incidents across 12 hospitals in Australia and New Zealand found an airway incident rate of about 0.08%. 11 Given that about 30% of incidents reported to webAIRS are airway related, 1 this would suggest an anaesthesia incident rate of about 0.25%, or one in 400 anaesthetics in these hospitals. In contrast, the National Audit Project 4 (NAP4) study in the UK reported a rate of severe airway incidents of about only one in 21,000 anaesthetics, 12 an order of magnitude lower than the rate reported by Endlich et al. 11 This may relate to the inclusion of only ‘severe’ airway incidents. At the other end of the scale, Munting et al. reported a critical incident rate of 3.5% over 110,310 procedures in their hospital in The Netherlands over a 5-year period (one in 31 anaesthetics). 13 This was similar to the findings of the APRICOT study of severe perioperative critical incidents in paediatric patients in 261 hospitals across Europe, which reported a rate of 5.2% (one in 19). 14 Clearly, reported anaesthesia incident rates depend on the severity of incidents reported and the completeness of capture of all incidents, which has been estimated to be as low as one in 20 in previous reports. 15 There may also be differences between sites related to the case mix of patients. For all these reasons, extrapolation of the rate of anaesthesia incidents in Australia and New Zealand from the webAIRS data should be undertaken with caution. Nevertheless, it seems likely that reports to webAIRS represent only a subset of incidents occurring, potentially related to more serious incidents.
In the second 4000 incidents, as in the first, the proportion of incidents associated with harm was about 25% (27.8% and 25.6%, respectively), and those with death between 4% and 5%. This is not to say that the incidents definitely caused the harm or the death. It is possible that in many instances the harm or death may have been inevitable or unrelated. In other words, an incident may have occurred that resulted in suboptimal management or conditions, but that these suboptimal aspects did not contribute to the harm or the death. They are nevertheless still worth reporting because these incidents, if repeated, could potentially contribute to harm or death in other patients. This is the essence and purpose of incident reporting. 16 While it is possible that many, all, or none of the adverse outcomes were directly related to the anaesthesia incident reported, the lessons learned are similar, irrespective of the outcome.
About 48% of the incidents were considered preventable by the reporters. This was similar to the first 4000 incidents in which about 52% of incidents were considered preventable. This is sobering information for all anaesthetists. There are extensive systems, guidelines and recommendations in place at local hospital levels, health service levels and national or international professional organisation levels to try to prevent anaesthesia incidents wherever possible. Many of these have been summarised in bow-tie diagrams of anaesthesia incidents. 17 , 18 It would have been hoped that with the educational and other resources committed to patient safety in anaesthesia in Australia and New Zealand, the proportion of preventable incidents would have fallen. While we cannot make definitive conclusions about preventability when considering voluntary de-identified incident reports, it appears a continued focus on both human and system factors in the prevention of anaesthesia incidents is warranted and requires re-emphasis.
Summary reports of this kind do not provide information that anaesthetists can use in an attempt to prevent individual anaesthesia incidents. Neither do they provide information on how best to manage anaesthesia incidents: such information is more likely to be obtained from a breakdown of the narratives reported, as has occurred in several previous analyses from the first 4000 reports.2–6 Instead, they provide information on where best to assign educational or other resources into the prevention or management of incidents. They are also a reminder to all anaesthetists about the ever present risk of anaesthesia incidents in anaesthesia practice, and that while many incidents result in no harm, a proportion are associated with temporary or permanent harm, or even death, as well as increased use of hospital resources related to the need for higher acuity care or prolonged hospital length of stay. The findings of this second overview support a continued emphasis on the promotion of human and system factors to improve patient safety in the provision of anaesthesia care in Australia and New Zealand.
Footnotes
Author Contribution(s)
Acknowledgments
The author(s) would again like to acknowledge the contribution of all members of ANZTADC, past and present, the administrative assistance provided by ANZCA staff, and the data analysis undertaken by Dr Heather Reynolds, ANZTADC data analyst. The author(s) would also like to thank again the large number of anaesthetists reporting incidents to webAIRS in the interests of greater patient safety.
Declaration of conflicting interests
The author(s) would like to declare the following potential conflicts of interest with respect to the research, authorship, and/or publication of this article: Martin Culwick is the current medical director of ANZTADC, and Yasmin Endlich is the current coordinator of its publications group. Alan Merry and Neville Gibbs are previous chairs of ANZTADC. Neville Gibbs is an editor of Anaesthesia and Intensive Care.
Funding
The author(s) received no financial support for the research, authorship, and/or publication of this article.