
Abstract
Blood gas analysers are point-of-care testing devices used in the management of critically ill patients. Controversy remains over the agreement between the results obtained from blood gas analysers and laboratory auto-analysers for haematological and biochemistry parameters. We conducted a prospective analytical observational study in five intensive care units in Western Australia, in patients who had a full blood count (FBC), urea, electrolytes and creatinine (UEC), and a blood gas performed within 1 h of each other during the first 24 h of their intensive care unit admission. The main outcome measure was to determine the agreement in haemoglobin, sodium, and potassium results between laboratory haematology and biochemistry auto-analysers and blood gas analysers. A total of 219 paired tests were available for haemoglobin and sodium, and 215 for potassium. There was no statistically significant difference between the results of the blood gas and laboratory auto-analysers for haemoglobin (mean difference –0.35 g/L, 95% confidence interval (CI) –1.20 to 0.51, P = 0.425). Although the mean differences between the two methods were statistically significant for sodium (mean difference 1.49 mmol/L, 95% CI 1.23–1.76, P < 0.0001) and potassium (mean difference 0.19 mmol/L, 95% CI 0.15–0.24, P < 0.0001), the mean biases on the Bland–Altman plots were small and independent of the magnitude of the measurements. The two methods of measurement for haemoglobin, sodium and potassium agreed with each other under most clinical situations when their values were within or close to normal range suggesting that routine concurrent blood gas and formal laboratory testing for haemoglobin, sodium and potassium concentrations in the intensive care unit is unwarranted.
Introduction
Blood gas analysers, as point-of-care testing devices, provide rapid test results for acid–base, blood gas, electrolyte and metabolite parameters. However, controversy remains over the agreement between the results obtained from blood gas analysers and laboratory auto-analysers for haematological and biochemical parameters.1–7
There are many differences between blood gas and laboratory auto-analysers, particularly in terms of measurement of individual parameters and measurement error. Blood gas analysers use direct ion-selective electrodes, whereas most laboratory biochemistry auto-analysers use indirect ion-selective electrodes. 1 The sodium measured by the blood gas analyser is not affected by protein or triglyceride levels, unlike with indirect ion-selective electrodes. 2 For potassium analysis, both the laboratory and blood gas analysers can be affected by haemolysis, whereas delayed centrifugation and EDTA contamination tend not to be an issue for blood gas analysers as the specimens are usually collected directly into prepared tubes and processed soon after collection. 2 Haematology auto-analysers and blood gas analysers also measure haemoglobin concentration by different methods. Blood gas analysers use CO-oximetry, and haematology auto-analysers can use a range of methods, including a cyanide-free reagent with a photometric method. 8
Materials and methods
Study design and setting
This prospective analytical observational study was conducted across five intensive care units (ICUs) in Western Australia, including two tertiary referral centres and three peripheral hospitals. Each ICU had at least one blood gas analyser located in their unit, and each hospital had onsite laboratory services that could process full blood count (FBC), and urea, electrolytes and creatinine (UEC) specimens. The brand and/or models of the blood gas, haematology and biochemistry analysers varied across sites (Table 1). Institutional approval was obtained for each study site (Ethics Approval No. 1713; QI No. 14115,14565,16070).
Brand and models of analysers at study sites.
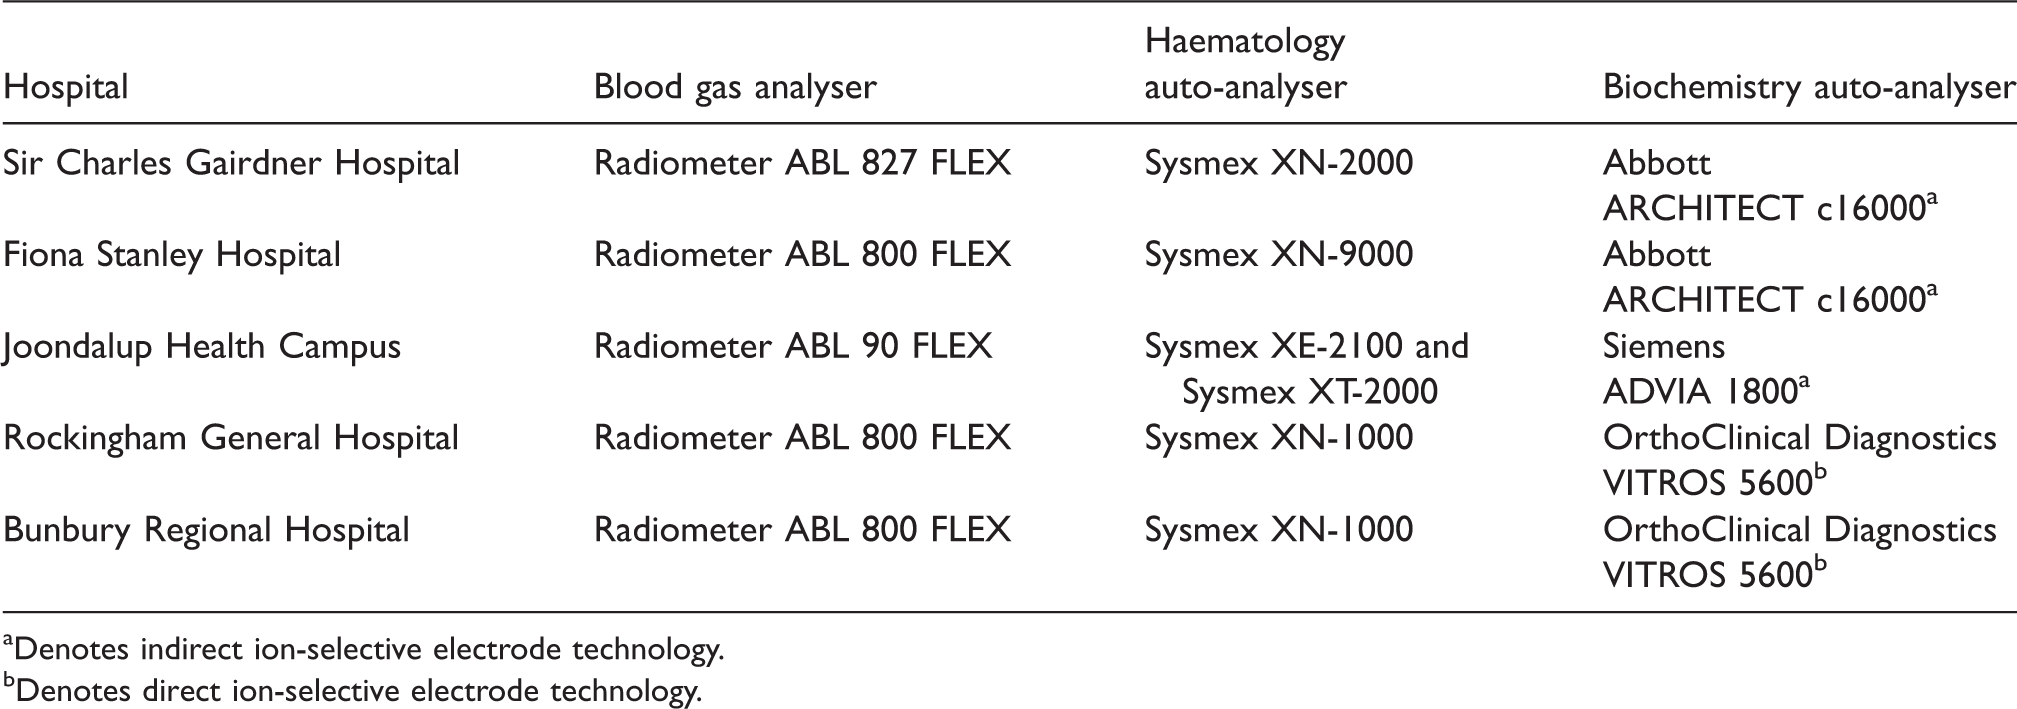
aDenotes indirect ion-selective electrode technology.
bDenotes direct ion-selective electrode technology.
Eligibility
Patients were eligible for inclusion if they had an FBC, UEC and blood gas, arterial or venous, performed within 1 h of each other during the first 24 h of their ICU admission. Patients who were pregnant and/or aged less than 18 years were excluded. There was no minimum admission length required.
Data collection
Patients admitted to the ICU at each site were screened for eligibility between April and November 2017. A standardized data extraction form was used to collect information from the laboratory information system database and medical charts. Tertiary hospitals were requested to collect data for 60 patients and peripheral hospitals to collect for 20 to 40 patients. Sites were able to collect data at the convenience of the site data collector.
In addition to one set of bloods (FBC, UEC and blood gas performed within 1 h of each other), baseline data were obtained regarding gender, age, and Acute Physiology and Chronic Health Evaluation (APACHE) II score. The total number of blood gases, FBC and UEC tests performed over the first three days of admission were collected, as well as factors that may have been associated with an increased number of blood tests being requested: mechanical ventilation (including non-invasive ventilation); significant oxygen requirement (defined as fraction of inspired oxygen ≥0.6 for ≥12 h in a 24 h period); continuous renal replacement therapy with or without citrate anticoagulation; vasopressor and/or inotropic support; the presence of diabetic ketoacidosis (DKA) or hyperosmolar hyperglycaemic state (HHS); and significant bleeding (defined as bleeding requiring blood transfusion and/or intervention).
Outcomes–primary and secondary
The primary outcome was to determine the agreement in haemoglobin, sodium, and potassium results between blood gas analysers and laboratory haematology and biochemistry auto-analysers.
The secondary outcomes were to 1) determine how many blood gas, FBC, and UEC tests a patient had performed in the first three days of their ICU admission, 2) examine associations in blood gases and laboratory FBC and UECs ordering in the ICU, and 3) to estimate potential cost savings from the reduction in concurrent blood gas and laboratory FBC and UEC test ordering.
Statistical analysis
A total of 172 patients were required to achieve 95% power to detect a difference in all three study parameters, assuming an alpha error <0.05 was acceptable. This was based on clinically meaningful differences (Table 2) that were determined by utilising the United States Clinical Laboratory Improvement Amendment (USCLIA) proficiency testing criteria.
The USCLIA acceptable limits of performance compared with our clinically meaningful differences.
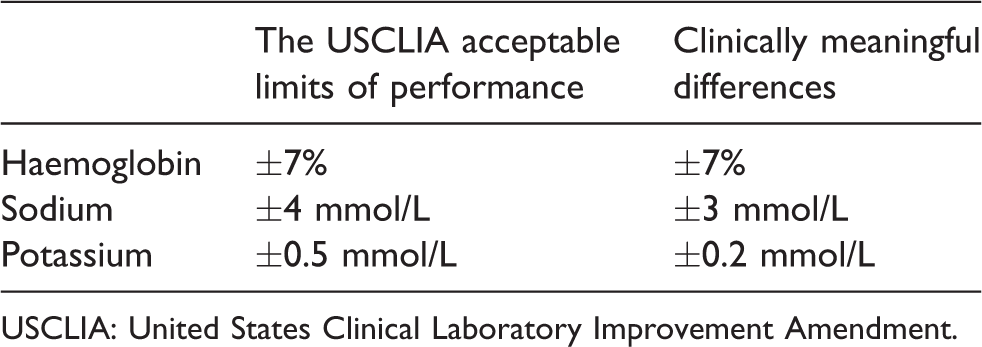
USCLIA: United States Clinical Laboratory Improvement Amendment.
Descriptive statistics were stated as total number with percentage or as median with interquartile range. The difference in proportion of categorical variables between tertiary and peripheral hospitals was tested with Fisher’s exact test. A Mann–Whitney U test was used to evaluate the difference in median values for continuous variables. Scatter graphs were used to investigate whether the differences between laboratory and blood gas results were related to time gap between the two measurements. Bland–Altman plots were used to assess the bias and 95% limits of agreement (LOA) between the two methods of measurement. Paired t-test was used to quantify the mean difference between the two methods of measurement and the associated 95% confidence interval (CI). The relationship between number of tests per person per day and variables of interest were assessed using univariable negative binomial regression models. These associations were reported as incident rate ratios (IRR) with 95% CI. Statistical significance was defined by P < 0.05.
Cost analysis
If acceptable agreement was found between analysers, an economic analysis was planned to determine potential cost savings. The cost analysis was modelled on the assumption that for a patient on a particular day, the patient could undergo multiple blood gases, or multiple laboratory tests (i.e. both FBC and UECs), but not both. If they did receive multiples of both, then either the excess blood gases, or excess laboratory tests, whichever was fewer, were reduced to one per day. Under this assumption the number of tests that would be averted in the study population was calculated and then extrapolated to the Australian ICU yearly population. Cost savings were then calculated using the Australian Medical Benefits Schedule pricing.
Results
Data were collected for a total of 219 patients. Baseline characteristics of the included patients are shown in Table 3, and they were not significantly different between the tertiary and peripheral hospitals.
Baseline Characteristics.
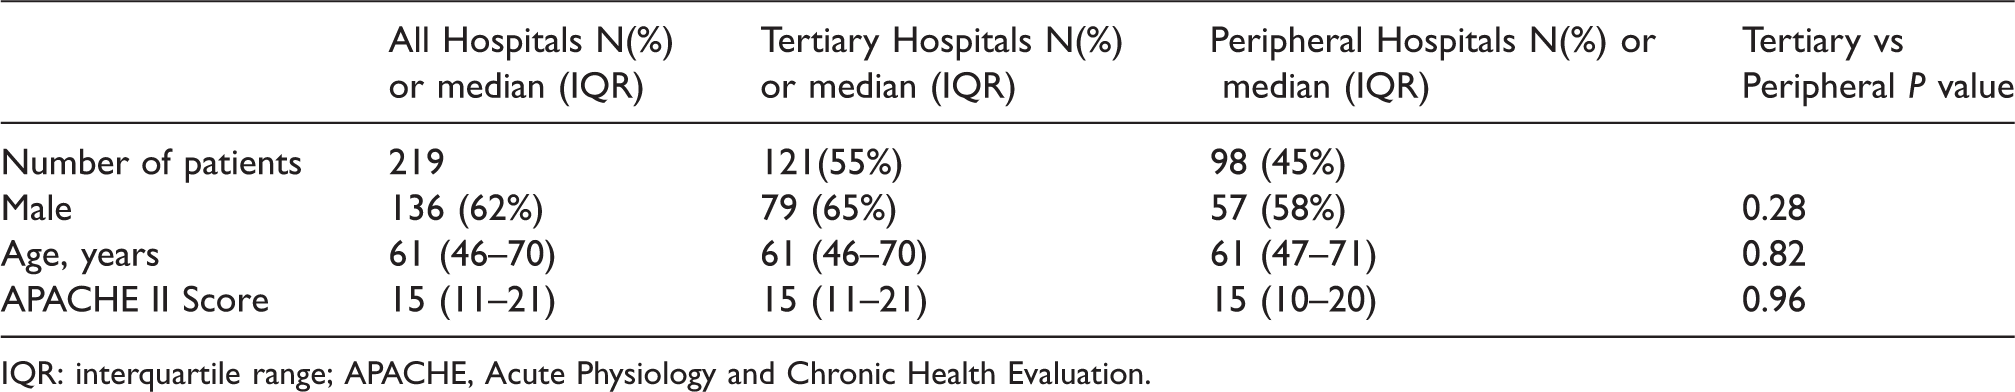
IQR: interquartile range; APACHE, Acute Physiology and Chronic Health Evaluation.
A total of 219 paired tests were available for haemoglobin and sodium. For potassium, 215 paired results were available for analysis, with four potassium results excluded due to an ‘error’ or ‘haemolysis’ recording, three in relation to UEC specimens and one from a blood gas specimen.
There was no statistically significant difference between the results of the laboratory and blood gas analysers for haemoglobin (Table 4). The results were statistically significant for sodium and potassium, with the laboratory results on average being higher than the blood gas analyser results.
Relationship between laboratory auto-analyser and blood gas analyser results.
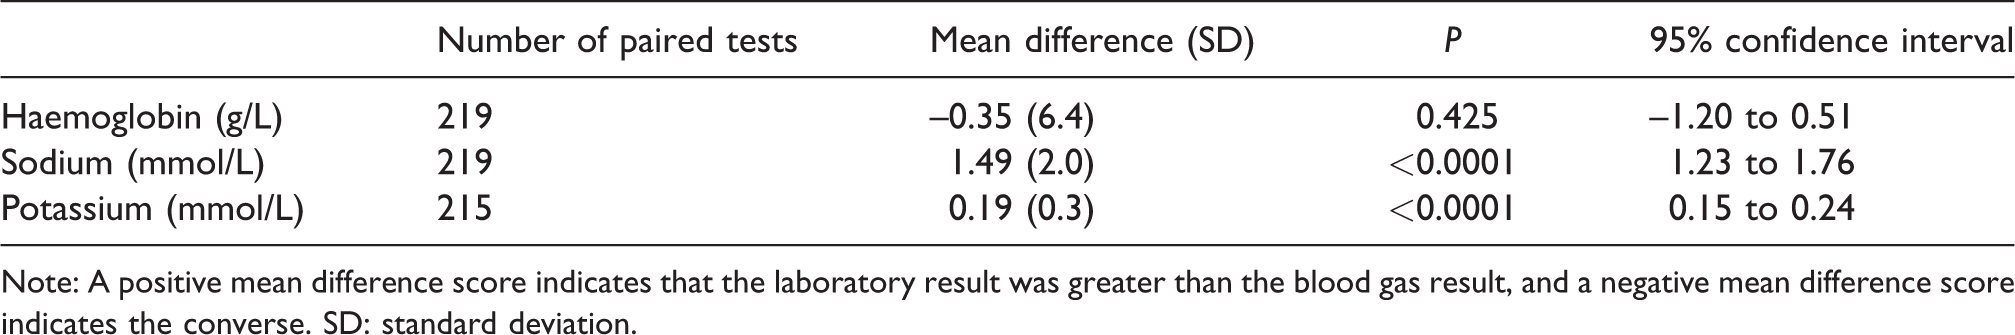
Note: A positive mean difference score indicates that the laboratory result was greater than the blood gas result, and a negative mean difference score indicates the converse. SD: standard deviation.
The differences in results between the laboratory and blood gas analysers for haemoglobin, sodium, or potassium were not significantly related to the time gap (in minutes) between the two measurements; the slopes of their respective regression lines were all not statistically different from zero (Figure 1).
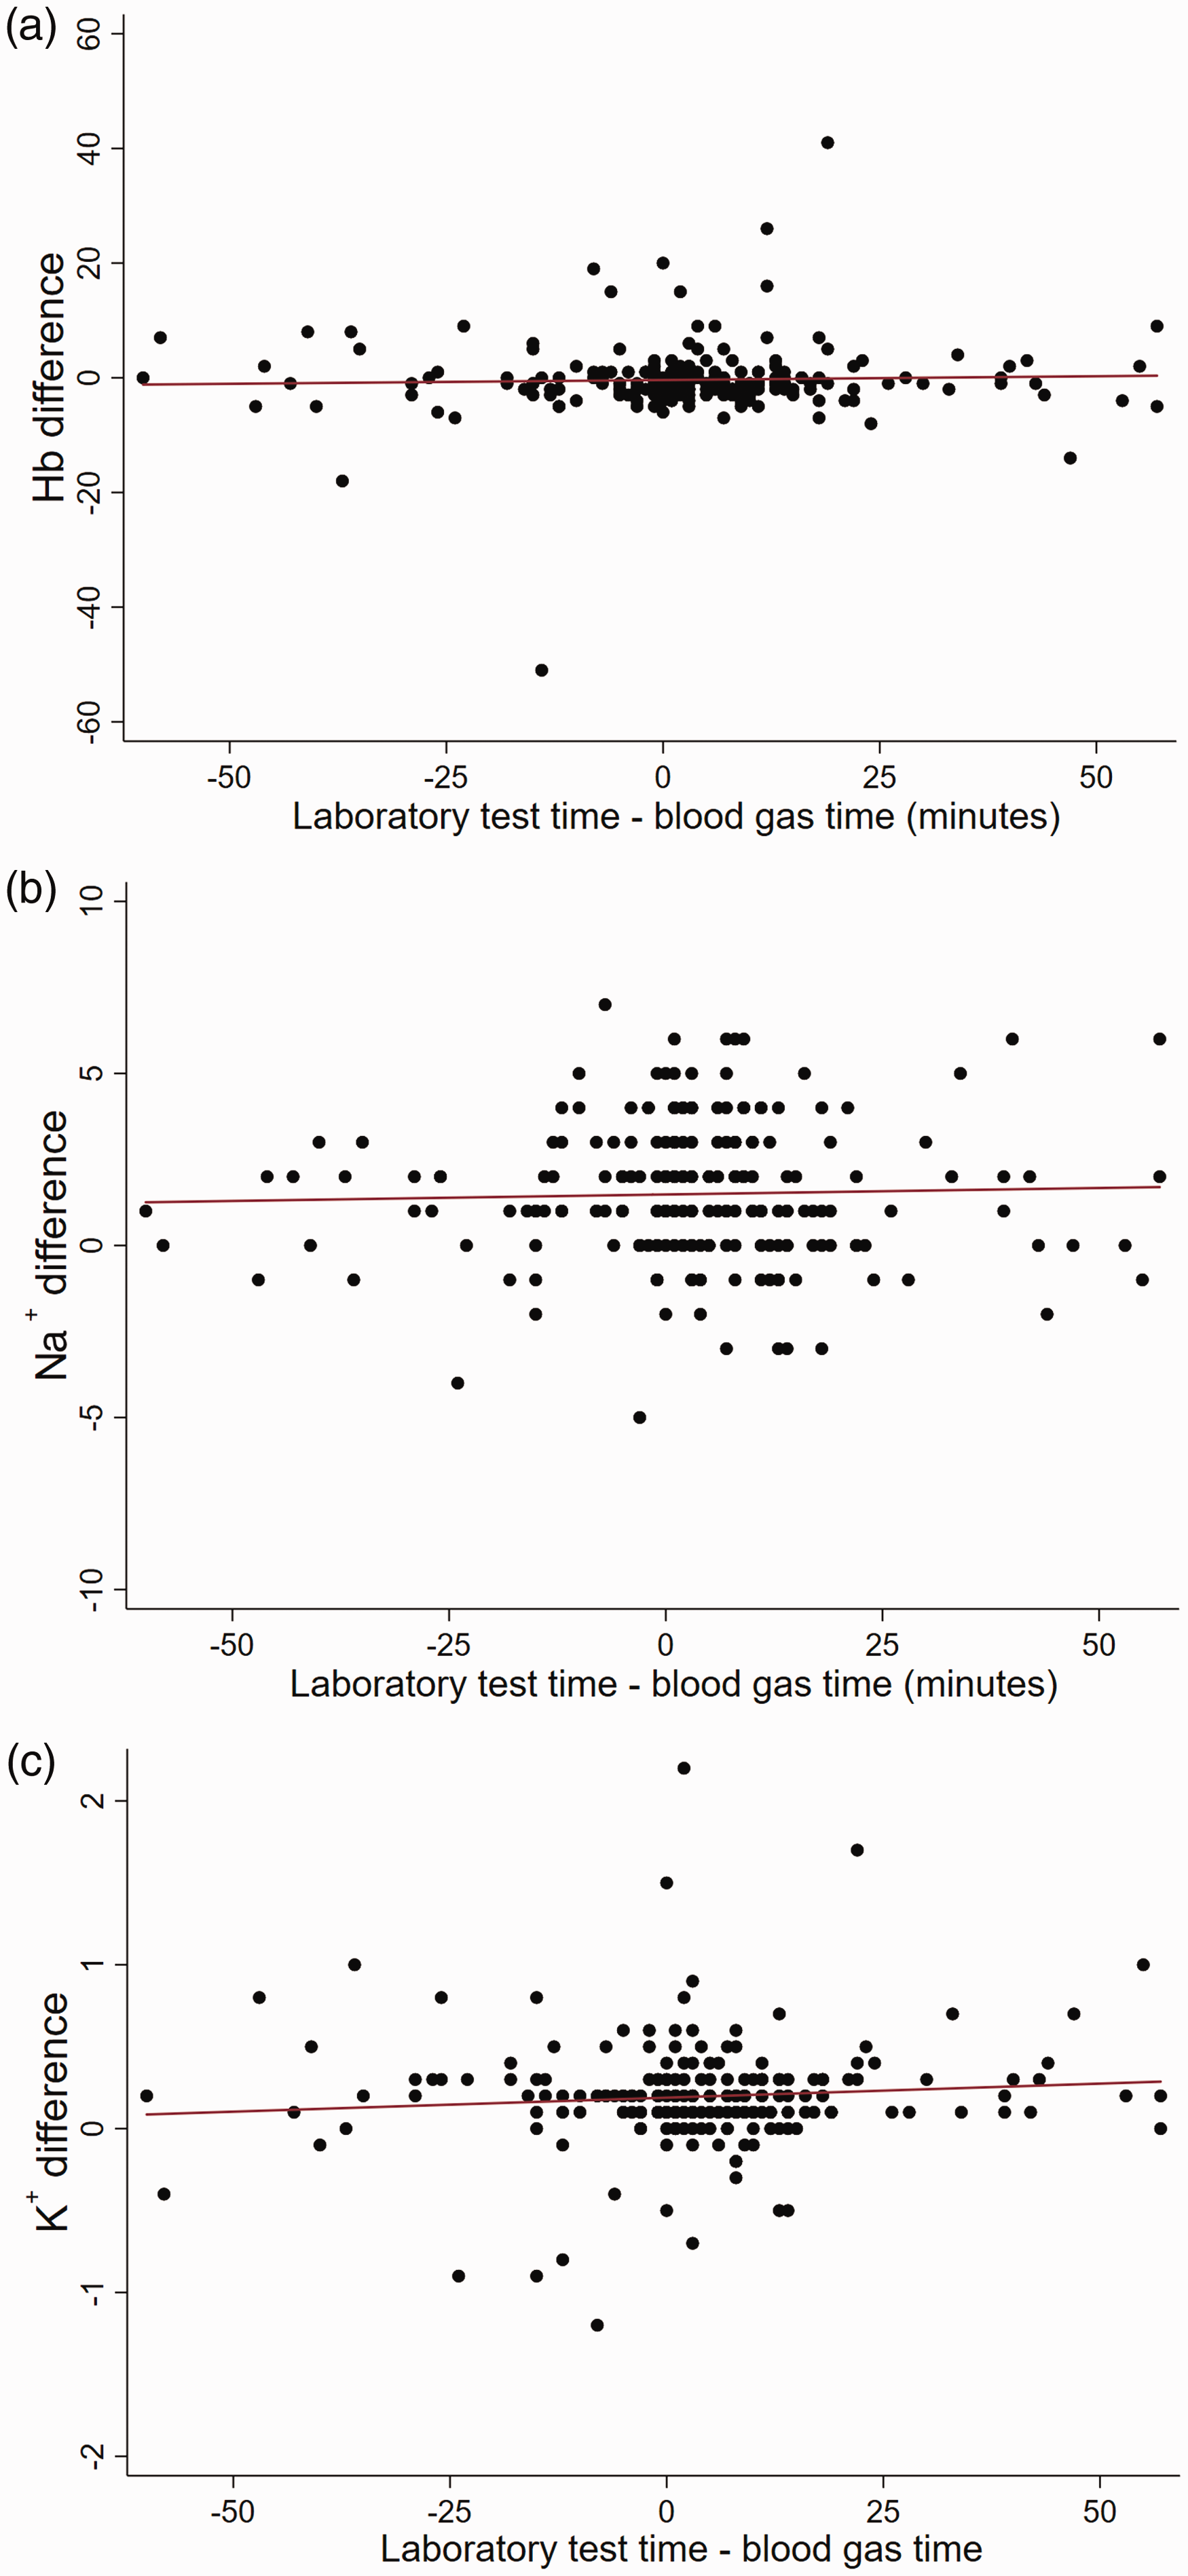
Scatter graphs for the difference between laboratory auto-analyser and blood gas analyser results as a function of time in minutes for (a) Haemoglobin (Hb), (b) Sodium (Na+), and (c) Potassium (K+) including line of best fit (red line). Note: Regression line slopes. Haemoglobin (slope = 0.13, 95% CI –0.03 to 0.061), sodium (slope = 0.004, 95% CI –0.011 to 0.019), and potassium (slope = 0.002, 95% CI –0.001 to 0.004). CI: confidence intervals.
Bland–Altman plots (Figure 2) show the bias and 95% LOA between the laboratory and blood gas analysers results. The mean bias between the two measurement methods for haemoglobin, sodium, and potassium were all small. In addition, this bias also did not change with the magnitude of the measurement (Figure 2) with the slope of the linear regression lines being close to zero. Nonetheless, the 95% LOA were clinically relevant with occasional extreme differences in results between the two methods of measurement, particularly for sodium and potassium.
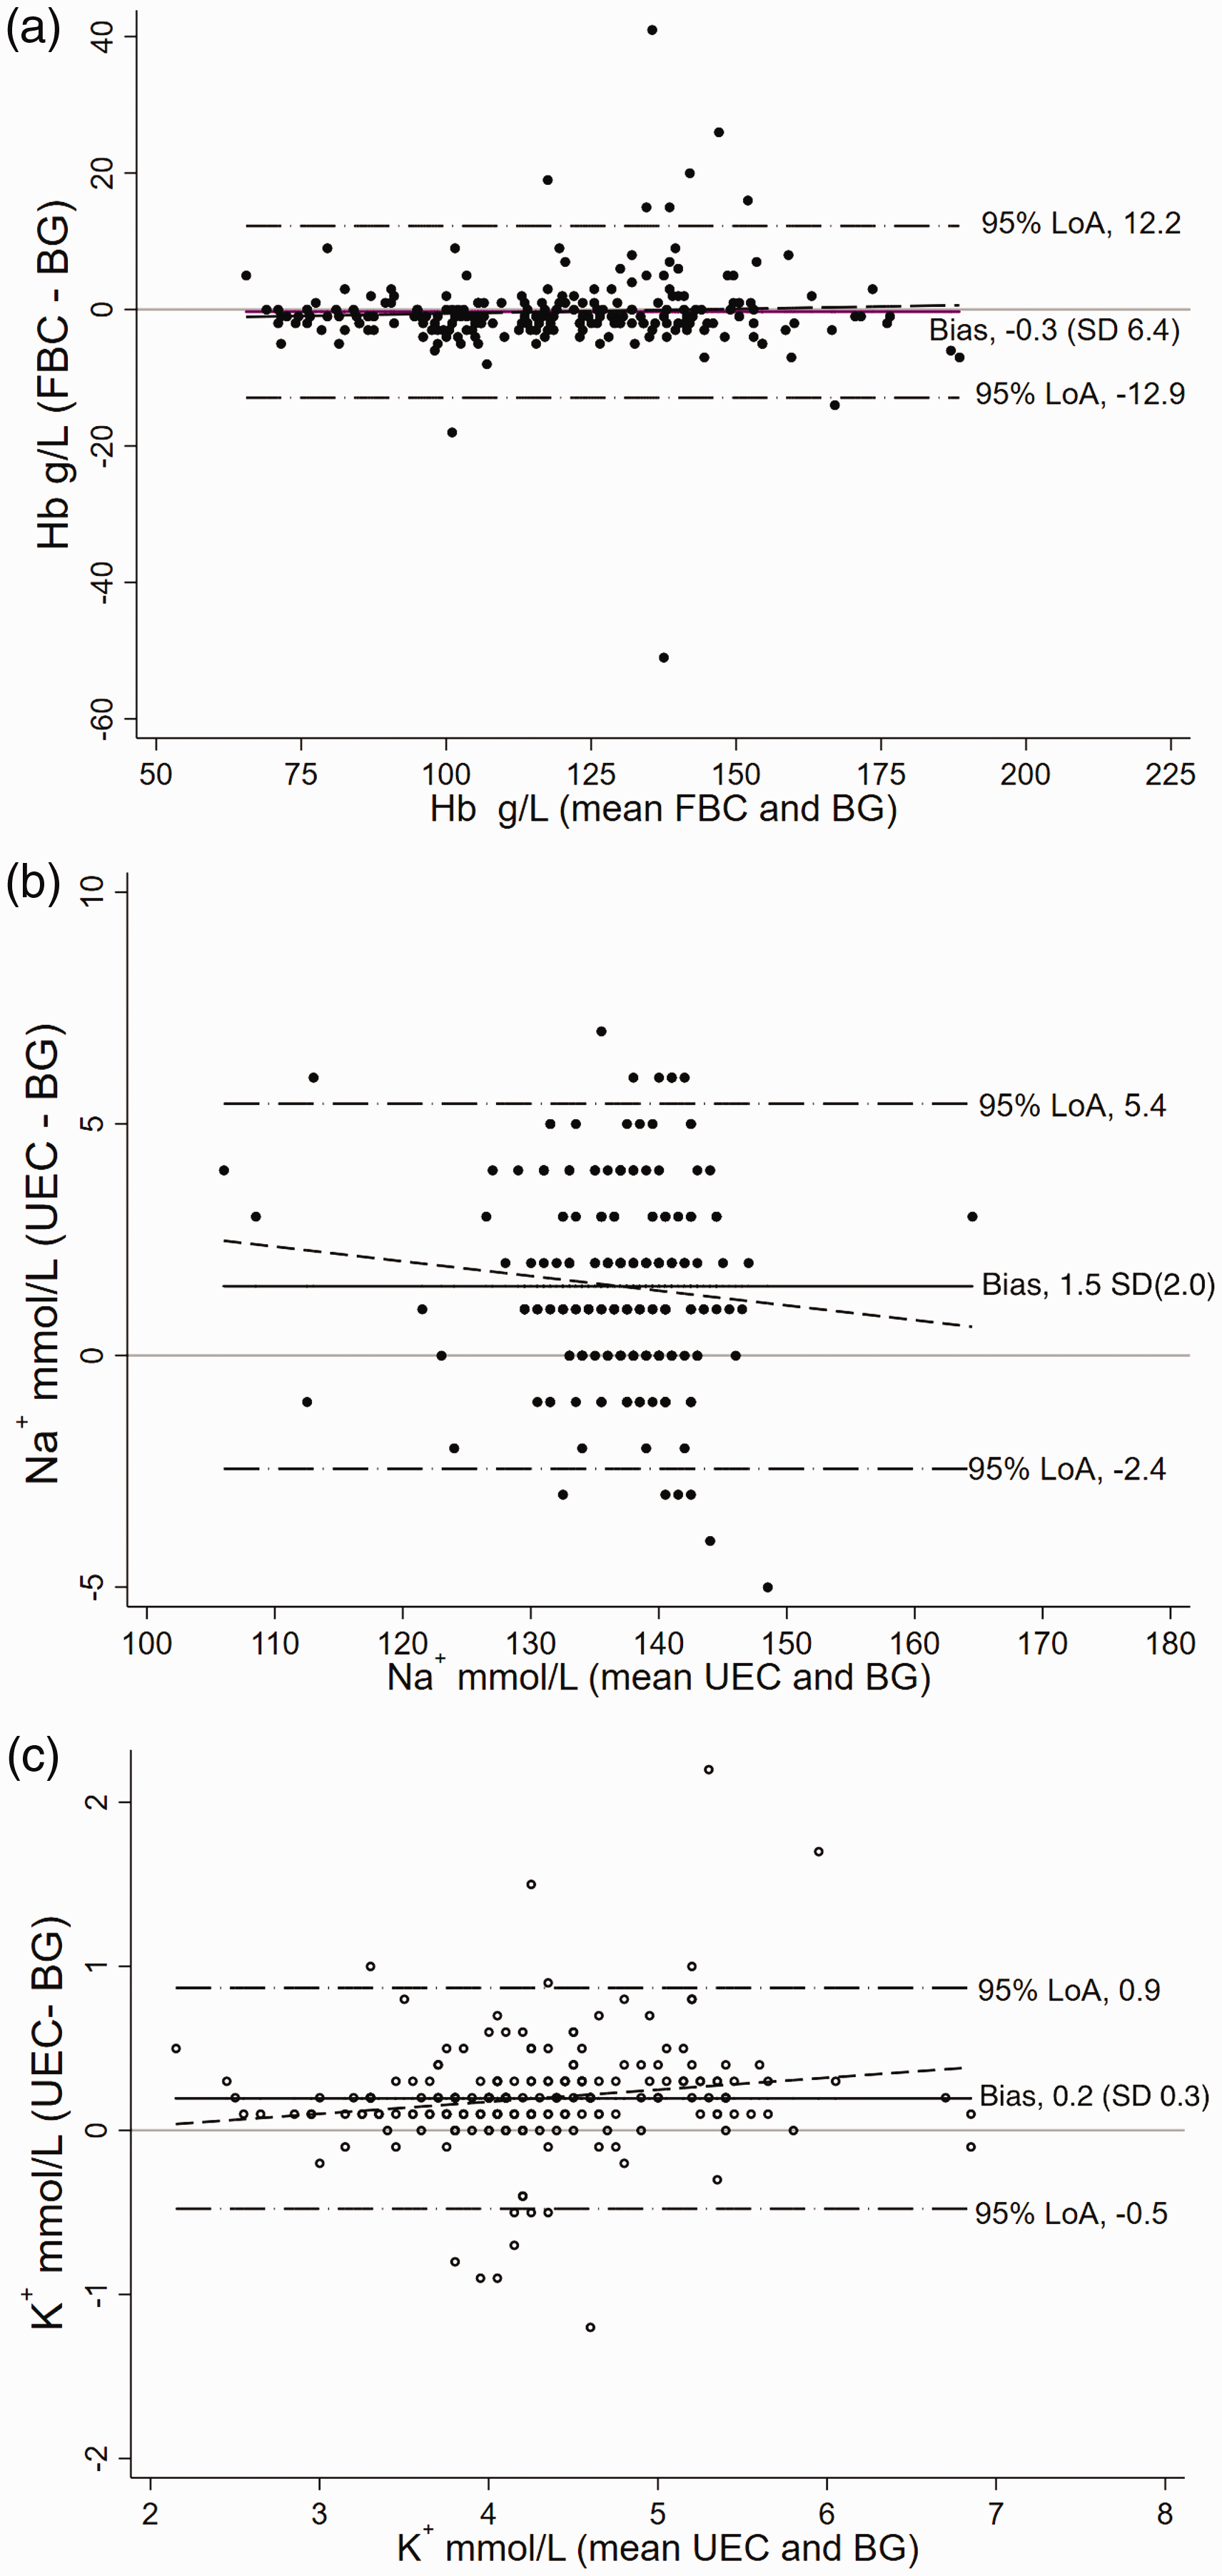
Bland–Altman Plots for (a) Haemoglobin (Hb), (b) Sodium (Na+), and (c) Potassium (K+). Note: The mean difference scores from Table 3 correspond to the mean bias of the Bland–Altman plots, which is the middle horizontal line in each plot. The slopes for the regression lines are: haemoglobin 1.01, sodium 0.970 and potassium 1.07. FBC: full blood count; UEC: urea, electrolytes and creatinine; BG: blood gas; LoA: limits of agreement.
The number of tests performed each day for blood gases and laboratory FBC and UECs is outlined in Table 5. Of the 219 patients that had data collected, six patients were admitted for one day, 37 patients were admitted for two days, with the remainder of the patients having an admission of three or more days. There was no significant difference between the tertiary or peripheral hospitals in terms of number of blood tests performed per person per day.
Number of tests performed per person, per day for the first three days of patients’ intensive care unit admission.
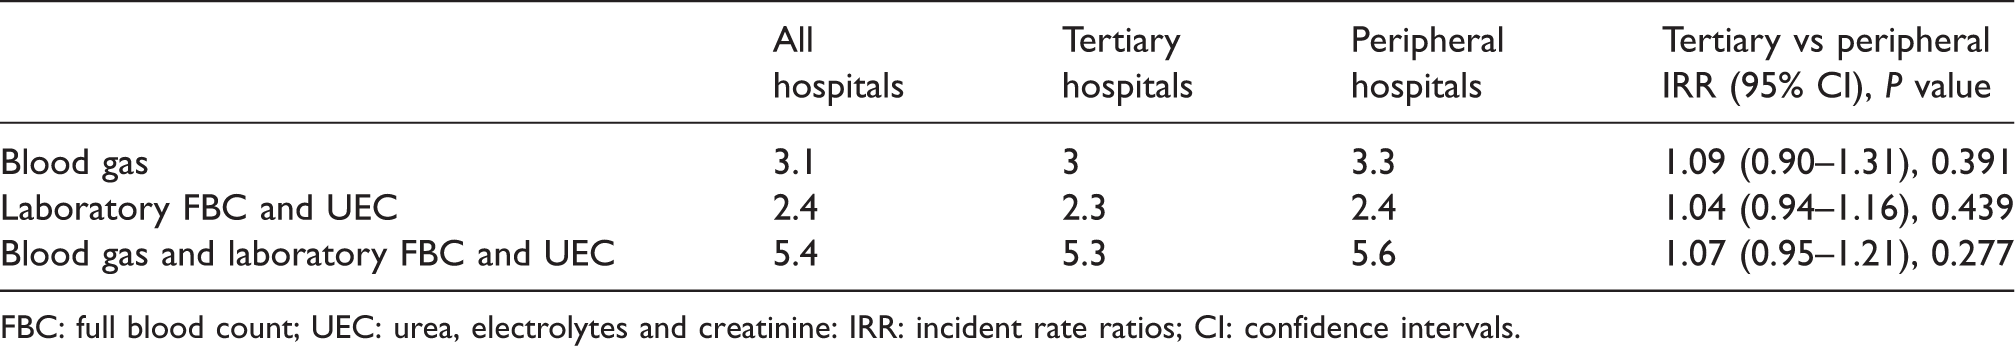
FBC: full blood count; UEC: urea, electrolytes and creatinine: IRR: incident rate ratios; CI: confidence intervals.
The incident rate ratios for predetermined variables for total number of laboratory and blood gas tests per day, total laboratory tests per day and total blood gas tests per day are displayed in Table 6 and considered in further detail in the discussion.
Incident rate ratios with 95% confidence intervals for total number of laboratory and blood gas tests per day, total laboratory tests per day and total blood gas tests per day for predetermined variables on and during admission.
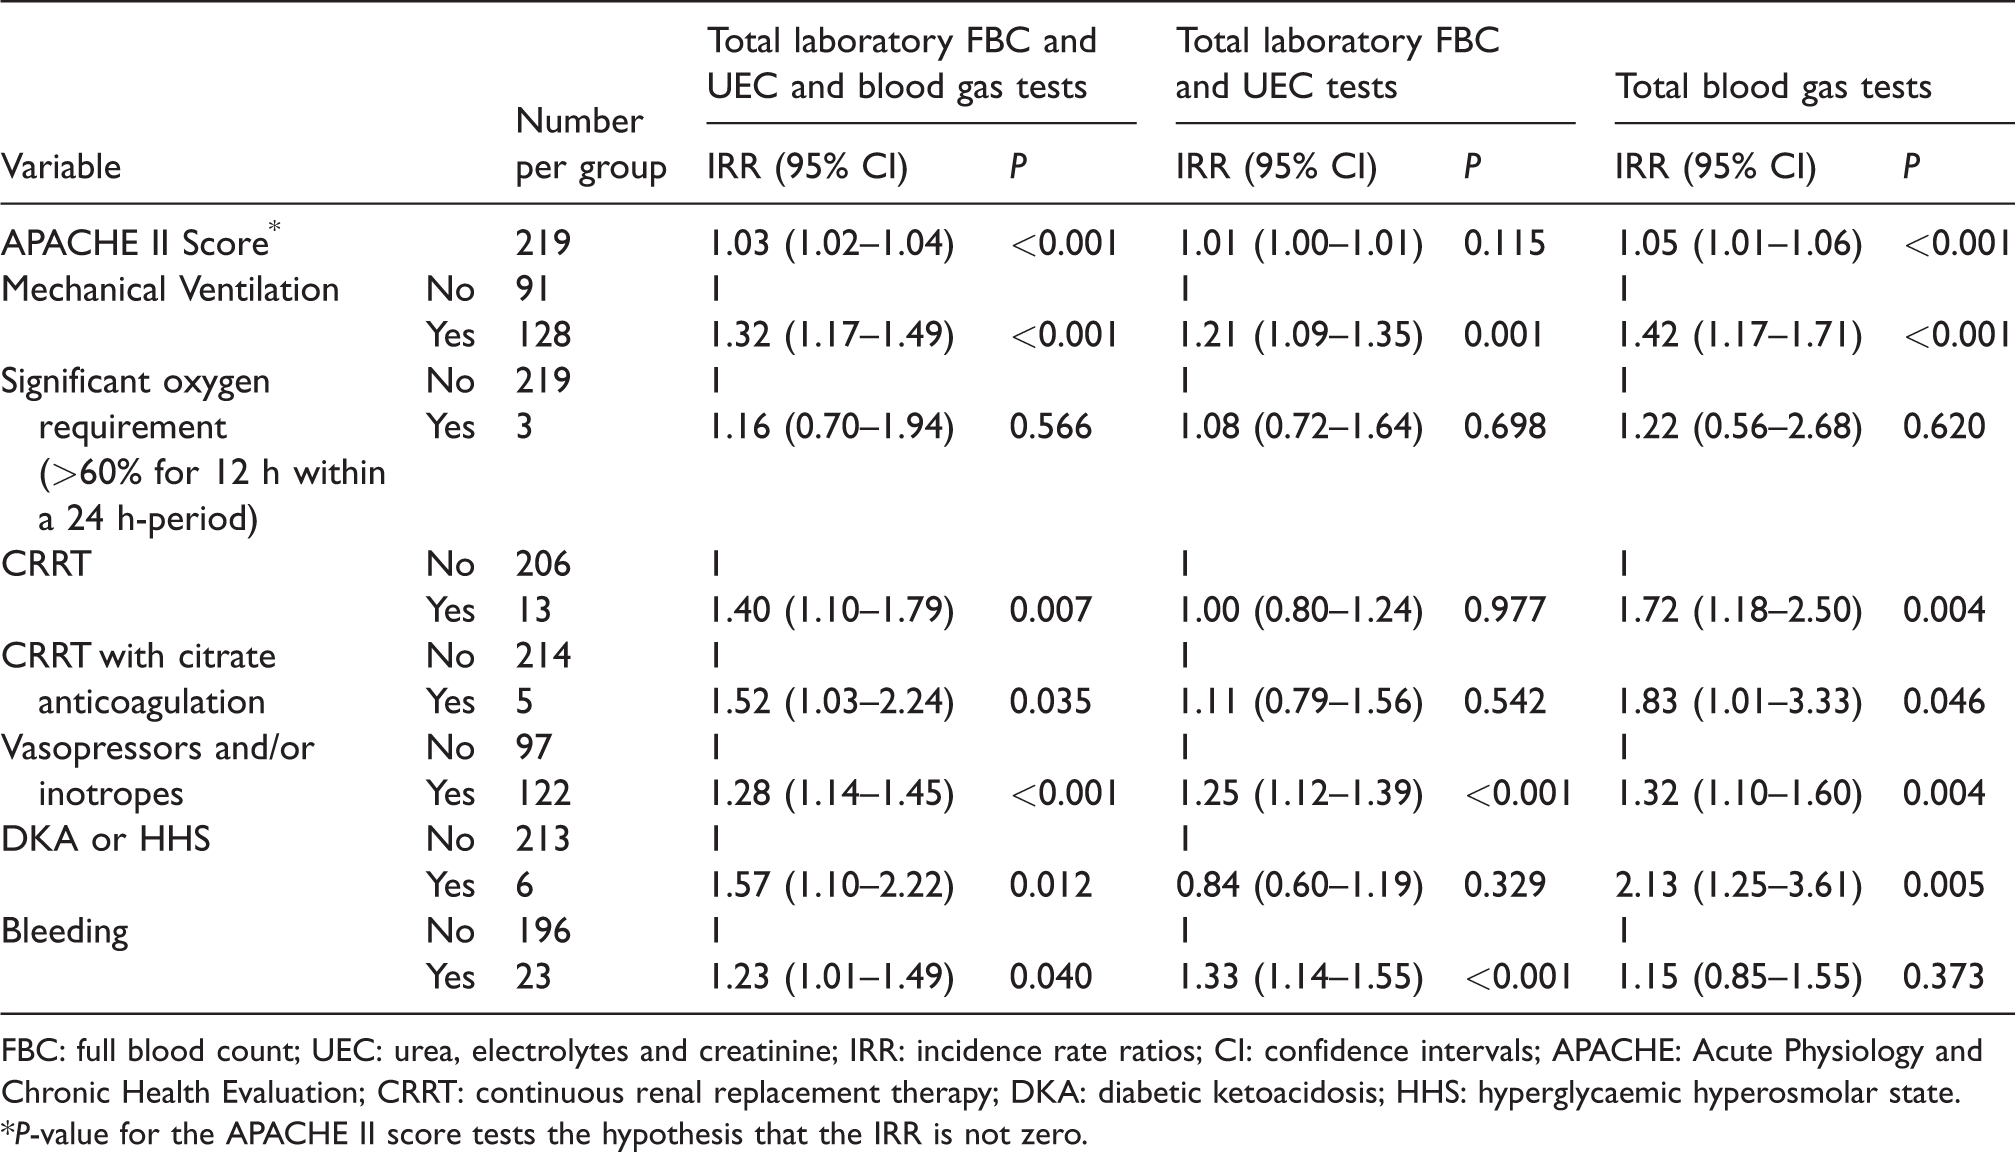
FBC: full blood count; UEC: urea, electrolytes and creatinine; IRR: incidence rate ratios; CI: confidence intervals; APACHE: Acute Physiology and Chronic Health Evaluation; CRRT: continuous renal replacement therapy; DKA: diabetic ketoacidosis; HHS: hyperglycaemic hyperosmolar state.
*P-value for the APACHE II score tests the hypothesis that the IRR is not zero.
A conservative cost analysis was performed to determine the potential saving per year across Australia if simultaneous blood gas and laboratory FBC and UEC ordering was reduced in the ICU for the first three days of patients’ admission. Based on the process described in the methods section, an estimated saving of at least AUD$2m per year across Australia was calculated.
Discussion
This prospective multicentre study found that the biases between the blood gas analyser and laboratory auto-analysers were, on average, small and independent of the magnitude of the measurements. Nonetheless, the 95% LOA between the two methods of measurement was clinically relevant. Our results showed that the total number of blood tests performed per patient per day increased substantially for patients with a higher acuity of illness, bleeding, organ failure, or an active metabolic disorder. These results have some clinical significance and require further discussion.
First, our results are comparable to the findings of other similar studies. In a single-centre study that included between 171 and 191 paired samples, Bloom et al. compared the measurements of sodium, potassium, haemoglobin and creatinine between an emergency department–based point-of-care machine and the hospital laboratory analysers. 10 They found that haemoglobin and creatinine agreed well. There was a negative bias on the blood gas compared with the laboratory result for sodium and potassium, although the mean differences were still within the USCLIA acceptable limits. A single-centre study by Zhang et al., involving 200 pairs of blood samples, found similar results to our study for potassium, sodium and haemoglobin. 4 That is, there were statistically significant differences for sodium and potassium between the arterial blood gas analyser and the laboratory analyser but these biases were within USCLIA acceptable limits, and there was no statistical difference, nor biases beyond USCLIA limits, for haemoglobin. 4 Nonetheless, most studies assessing the agreement between blood gas analysers and laboratory auto-analysers in critical care areas involve a single centre and one particular type or model of analyser for each of the blood gas, haematology and biochemistry measurement. In a retrospective study involving three hospitals, Mirzazadeh et al. found good agreement between the analysers in >15,000 paired blood samples for sodium and potassium, again consistent with our results. 2
Second, although the bias between the two methods of measurement was small for all three parameters assessed in this study, one needs to keep in mind that the 95% LOA was clinically relevant and could potentially change the management of a patient, particularly when extreme values were observed. For example, when haemoglobin is close to 70g/L and potassium is above 6.0 mmol/L, an erroneous difference within the reported 95% LOA can potentially trigger inappropriate transfusion and anti-hyperkalaemic therapy, respectively. Thus, crosschecking by an alternative method of measurement when unexpected and/or extreme results are observed would be prudent. This also applies to the converse situation where ‘normal’ results that do not correlate with the clinical context should be crosschecked, as erroneous ‘normal’ results may also have the potential to cause significant harm. Additionally, for the purpose of monitoring for serial changes in blood test results after interventions, it is best to compare the results reported from the same type of analyser to reduce misinterpreting inter-method variability as a change in a patient’s condition. Furthermore, for sodium, there is evidence to support that direct ion-sensing electrode analysis should be used over indirect methods, in order to prevent misdiagnosis of dysnatraemias. 11
Third, blood gases were performed more frequently than laboratory FBC and UEC tests across all sites in this study. Within the first three days of a patient’s ICU admission, on average each patient had 5.4 blood gases, FBC or UEC tests performed per day, which did not vary significantly between study hospitals. This result is consistent with a recently published Australian study. 12 Patients with a higher APACHE II score, continuous renal replacement therapy, or a diagnosis of DKA or hyperglycaemic hyperosmolar state (HHS) were more likely to have blood gases performed. Mechanically ventilated patients and those who received vasopressors and/or inotropes were more likely to have both blood gases and laboratory tests done. Interestingly, significant bleeding was associated with having laboratory tests done but not blood gases, suggesting that clinicians value the results of the laboratory haemoglobin over the blood gas analyser result or that the platelet count was considered essential.
Lastly, given that acceptable agreement was found between the analysers, a conservative cost analysis was performed. A cost saving of at least AUD$2m per year across Australia was estimated by reducing the number of potentially unnecessary duplicate blood gases or laboratory tests (i.e. both FBC and UECs) within the first three days of a patient’s ICU stay. In addition to reducing costs, reducing unnecessary blood tests may also reduce the risks of iatrogenic anaemia and allogeneic blood transfusion. 13
Study strengths and limitations
This prospective multicentre study was conducted involving five ICUs—both tertiary and non-tertiary—and assessed a number of different brands and models of analysers, making our results likely generalizable. However, the patterns of practice in ordering blood tests and specimen collection, as well as calibration requirements of analysers were different between sites. Furthermore, the methods by which the biochemistry auto-analysers measured ions was not consistent across sites, thus these results may not accurately represent biochemistry auto-analysers that do use direct ion-selective electrodes. Because the severity of disease in the study patients was low, extremely abnormal blood test results were uncommon, limiting our ability to conclude that the two methods of measurement are generalizable to patients with extreme physiological derangements. Lastly, the maximum 1-h time limit allowed between paired samples in this study means that some patients might have received interventions between the two measurements, and this could affect their comparability. That said, our time gap analysis did not suggest this was an important factor in explaining the 95% LOA (Figure 1).
Conclusion
We observed only small biases, which were not dependent on the magnitude of the measurements, between point-of-care blood gas analysers and laboratory analysers in measuring haemoglobin, sodium and potassium concentrations. The two methods of measurement agreed with each other under most clinical situations when their values were within or close to normal range suggesting that routine concurrent blood gas and formal laboratory testing in the ICU is unwarranted. Reducing unnecessary routine blood tests has the potential to reduce healthcare costs and risk of iatrogenic anaemia in the critically ill. Because haemoglobin, sodium and potassium concentrations are measured using different methodologies (and reagents) in a point-of-care blood gas analyser and a laboratory analyser, crosschecking results may still be needed on a case by case basis but is best reserved for situations when unexpected and/or extreme results are obtained from one method of measurement.
Footnotes
Acknowledgements
We would like to thank Drs Eanna O’Sullivan (Resident, Fiona Stanley Hospital) and Vincent Chan (Intensivist, Bunbury Hospital) for their assistance.
Declaration of conflicting interests
The author(s) declared no potential conflicts of interest with respect to the research, authorship, and/or publication of this article.
Funding
The author(s) received no financial support for the research, authorship, and/or publication of this article.