
Abstract
The three-and-a-half decades of productivity growth in manufacturing in the United States came to an end with the recession of 2008–2010. This signaled the exhaustion of the lean production methods and related technology that has driven growth since its introduction in manufacturing in the 1980s and its subsequent spread to services. In the framework of Marx’s conception of turnover time, this article will examine the causes of lost productivity, impact on work and inventory, and the means capital has employed to redress lost productivity and profits, the latter found largely in the example of Amazon. Capital has attempted to supplement or replace lean methods with a new generation of digital technology to track and intensify labor in the workplace, on the one hand, and shifted from single-sourced supplies and just-in-time delivery to a reorganization of the movement of goods and value within and between points of production and circulation to reduce turnover time, on the other hand. This involves the transformation of the warehouse from a place of storage to one of movement, multiple sourcing of inputs, the increase in ‘nodes’ and vehicles in the transportation system, the regionalization of movement, and digital technology to coordinate this motion within and between facilities. Businesses have increasingly replaced just-in-time and other lean methods with maximized inventory velocity in emulation of Amazon’s system of rapidly moving inventory. Despite the application of algorithms to maximize inventory velocity throughout the system, human labor continues to punctuate the entire movement of goods and value and possesses positional power to disrupt this motion and impact turnover time. There is renewed potential for worker organization in the ‘positional power’ offered by the emerging changes in production and circulation.
Keywords
Introduction
For three-and-a-half decades, lean production along with new forms of technology drove much of US manufacturing productivity. Lean production is a system designed to further intensify, subordinate, and reduce labor to benefit capital. It is characterized by a ‘management-by-stress’ production system with Kaisen or ‘constant improvement’ in efficiency and worker effort, and process ‘reengineering’. Integral to this is an ideology that promotes the alleged mutual interests of labor and capital along with dubious forms of worker participation and training meant to obscure the antagonistic social relations of production. Trade unions are weakened by drawing them into partnership schemes on capital’s terms, often on the bogus claim to save jobs. This was combined with ‘just-in-time’ delivery to eliminate ‘buffers’ in the workplace and along the supply chain of extended outsourcing that provided additional pressure on the workforce (Babson 1995; Moody 2017; Parker and Slaughter 1994; Stewart et al. 2009). These innovations in mass production produced increases in manufacturing productivity of about 4% a year from 1990 to 2007 until the Great Recession of 2008–2010 as they initially reduced the workforce. Since then, productivity in manufacturing has collapsed to an annual average of less than 1% (BLS 2022a, 2023a, 2023b, 2023c, 2025; Cobet & Wilson 2002: 54, 59).
To assess the response of capital to this crisis and the long-term problems of profitability, I will focus primarily on the organizational and material changes introduced and use Marx’s theory of turnover time as an analytical framework. Time and motion have always been essential in the circulation of capital and the expansion of profits. In the Grundrisse Marx (1973) asserted ‘Velocity of circulation substitutes for the volume of capital’ (pp. 216, 219). The measure of capital’s reproduction is its turnover time. Summarizing the turnover time of a capital from its initial investment, Marx (1978) wrote in Capital, Volume II, ‘The duration of this turnover is given by the sum of its production time and circulation time’ (p. 235).
Circulation, which Marx often uses in different ways, here refers to the movement of value in its money form and material goods between phases of production and to the final product’s sale. Thus, capital can attempt to increase the mass of profits in a given period by shortening the turnover time of its initial investment through the reduction of production time or that of the movement of value and goods or both. As Engels put it in his addition to Capital Volume III, ‘the main means whereby production time is reduced is an increase in the productivity of labour’, while that of ‘cutting circulation time has been improved communications’, through the introduction of the railroad, steamships, and the telegraph in his day (Marx 1991: 163–164).
Despite efforts to reduce turnover time in the past decade, US capital has been unable to reproduce the profitability of earlier decades for some time. The decline in profit rates that began in the late 1960s produced the stagflation crisis of the 1970s. The introduction and spread of lean production methods in the 1980s and 1990s revived productivity and profit rates. As Michael Roberts has shown, with the ‘share of financial surplus’ removed from the mass of profits, the rate of profit did trend upward until the late 1990s. Since then, however, with ups and downs to be sure, the trend has been downward (BEA 2023a; Roberts 2022). While international competition undoubtedly played a role in restraining profit growth, an often-overlooked major domestic trend undermined turnover time and hence, profitability.
The exhaustion of lean methods and the workforce
This was the exhaustion of lean production methods and much of the work-intensifying technology associated with them. The evidence for this is the collapse of manufacturing productivity following the Great Recession of 2008–2010. Whereas labor productivity in US manufacturing had increased at an average at or above 4% a year from 1990 through 2007, after a brief post-recession high in 2010 it ran at an annual average of 0.7% from 2011 through 2019. Pulling out of the 2020 pandemic crash it briefly hit 1.8% in 2021, then fell to −1.3% in 2022, −0.5% in 2023, and rose to a mere 0.3% in 2024 (BLS 2022a, 2023d, 2023e, 2024, 2025; Cobet & Wilson 2002: 54–59). Productivity in transportation and warehousing, which also employed lean methods, was similarly low for the last decade (BLS 2023g).
A common explanation for this slump in productivity is the relatively low level of investment in manufacturing equipment and technology. Measured by the net stock of private equipment in manufacturing average annual growth fell from 4.3% from 1984 to 1988 to 3.7% from 1992 to 2007 and 3.4% from 2010 to 2022, a deceleration, but not a cessation in investment (BEA 2023b). The installation of industrial robots per year in the United States, however, rose only gradually until 2018 when it hit 40,000. Since then it has actually fallen only reaching the 2018 level in 2022, and according to the International Federation of Robotics (IFR 2023) new orders have been ‘decelerating’ despite a significant drop in costs. As a 2020 ILO study of automation in auto plants in the United States, Germany, and China found, the various attempts to boost productivity in manufacturing over the years by introducing new levels of automation, robotics, and so on, especially in final assembly have ‘not been very successful’ and were often abandoned (Pardi et al. 2020). In other words, it is not just the level of investment, but the effectiveness of the technology. Capital will not invest heavily in machinery or technology at the same or higher pace that is not anticipated to pay off, especially when profit rates are already volatile.
This suggests that the impact of the dominant mix of workplace technology (mainly automation and robotics until recently), various lean methods of work intensification, and even their ideological underpinning have reached the limits to which they can push human beings to increase their output within the workday and, hence, reduce turnover time – at least under the current organization of production in most industries. Evidence for this limit on human effort is found not only in slumping productivity, but in the high and growing levels of work-related stress. One study finds that ‘83% of US workers suffer from work-related stress’, while 62% reported ‘high levels of stress/with extreme fatigue/feeling out of control’. Another states that ‘overall employee stress levels have risen nearly 20% in three decades’ (American Psychological Association 2021; Lipman 2019; The American Institute of Stress 2023). Nor has technology or the continued use of lean methods eliminated enough workers to increase productivity, as one would expect from lean production. The manufacturing production workforce actually grew by about a million between October 2010 and October 2023, while output remained essentially flat (BLS 2023f; FRED 2023). This is the opposite of what happened during the introduction and early spread of lean methods.
Not surprisingly, problems in the circulation phase of turnover time and movement of goods within the phases of production as well as from production to market often run on a JIT basis have also been unfolding for years. The ‘PMI Suppliers’ Delivery Time Index’ that is part of the Procurement Managers Index (PMI) developed by the Institute for Supply Management (ISM 2023), provides clear evidence of pre-existing troubles in supply chain transportation. This is a measure of the ability of firms to deliver in a timely manner. As the IHS Markit July 2022 ‘Focus on . . . Suppliers’ delivery time’ clearly says, US ‘Supplier Delivery Times began rising in 2016’ and rose thereafter with a brief decline in 2019 before soaring during the pandemic in 2020 and 2021. Similarly, the January 2022 report on the global supply chain crisis shows companies around the world registering a ‘huge shortage of inputs’. It also reveals that the first upsurge in such shortages since 2010 occurred in 2017, well before the pandemic (IHS Markit 2022a, 2022b: 4, 120. As GlobalTranz notes in its 2022 logistics report, ‘Given the potential for delays, lean strategies have proven too rigid’. Clearly, neither lean methods nor technology have saved US or global capital from a significant decline in the speed at which goods could be moved and the value they represented realized.
The roots of this logistical failure lay mainly in the well-documented fact of long-standing and increasing labor ‘shortages’ and workforce turnover in trucking, warehousing, and even on the major freight rail carriers. ‘Shortages’ here refer not to the number of actual workers available for employment, but to those willing to take one of these jobs at current pay and conditions. This is another reflection of increased work-related stress. Lacking a sufficient workforce, the firms providing the key elements of the nation’s logistics system could not keep up with the demand for transportation. Furthermore, productivity for both trucking and warehousing, where lean methods also had prevailed, was extremely poor from 2011 through 2022 (BLS 2023g). These labor shortages, however, began well before the pandemic, the invasion of Ukraine, rocketing oil prices, or the tight labor market of the ‘Great Resignation’ of 2021–2022.
A 2019 report by the American Trucking Associations (ATA) revealed that labor shortages in trucking grew after the Great Recession. The first leap occurred in 2014 when the driver shortage more than doubled from 19,000 in 2013 to 41,000 in 2014. After that ‘the shortage skyrocketed to roughly 50,700 in 2017’ and then 60,000 in 2018 just as delivery times rose and well before the pandemic drove it further to over 80,000 in 2021 (ATA 2019: 4; Ngo & Swanson 2021; Statista 2022). It was little different in warehousing. Writing in 2018 under the headline ‘Labor Shortage Hurts Logistics Industry’, the journal Material Handling & Logistics projected that the huge demand for ‘warehouse and distribution workers in 2018-19’ . . . ‘could turn out to be unsustainable in the already labour-strapped industry’ (Sparkman 2018). Indeed, it was the ‘constant pressure to deliver goods at ever-cheaper prices (that) has resulted in working conditions so poor and pay rates so low that they amounted to “indentured servitude”’ that created high levels of workforce turnover and kept workers away from these jobs (Lipman 2019; McCormick 2021; Premack 2023).
The seven major Class I rail freight carriers actually created their own labor shortages by constantly reducing the workforce to meet the demands of Precision Scheduled Railroading (PSR), the industry’s version of lean production first implemented around 2000 by CSX (Ansell 2021; Morrison 2020). The appalling conditions faced by railroad workers were highlighted when the unions’ demands for 15 paid sick days to relieve the pressure on employees was rejected in the government imposed ‘Tentative Agreement’ in November 2022.
Thus, the ‘Supply Chain Crisis of 2021-22’ associated with climate change and the Covid pandemic was but an escalation of deep problems facing capital in manufacturing and transportation/logistics – the two phases of turnover time. The debates about ‘resilience’ (to reduce the impact of disruption) versus ‘lean’ or ‘just-in-time’ have gone on for some time due to the failure of capital’s previous organizational, technological, and logistical ‘fixes’. Not surprisingly, however, the 2021–2022 supply chain crisis, exacerbated by the climate crisis, the pandemic, increased conflict with China, and the Russian invasion of Ukraine have finally led to a serious reconsideration of just-in-time delivery and the structure of both global and domestic logistics itself and, hence, efforts to find a new ‘fix’ for capital.
As the 2023 Citi GPS report put it, ‘One common change is an increase in inventory as corporates switch from a just-in-time to a just-in-case approach’ (Citi GPS: Global Perspectives & Solutions 2023: 20). A 2023 survey of over 1,200 companies around the world found that 42% had already moved from JIT to multiple sourcing and another 72% planned to do so in 3 years (Tuma et al. 2023: 7). There is, however, a widespread misunderstanding that just-in-time delivery equals greater speed of movement through the supply chain. On the contrary, it does not reduce circulation time or cost because it requires more frequent, smaller, on average more costly deliveries. As a result, there are no economies of scale (Rodrigue 2020: 111). The Biden administration’s Department of Transportation’s 2022 Supply Chain Assessment warns, ‘The pressures associated with shorter delivery windows and just-in-time inventory management . . . can incentivize the use of more costly or less-efficient freight transportation services’ (U.S. Department of Transportation 2022: 17).
What JIT does do is reduce costly inventories, the major ‘buffer’ in lean jargon, for those on the receiving end along the lean supply chain. From a Marxist point of view, inventories are important not only because they are a drag on turnover time and an obvious additional cost, but because the labor of storage does not create value, while that of transportation and movement of goods is considered part of production and does (Marx 1978: 222–227). So, while larger inventories may allow companies to withstand the initial impact of a strike or other disruption, they will also become a greater burden in the course of a conflict or break in production.
During the classic ‘just-in-case’ post-WWII ‘golden era’ of US capital the nonfarm inventory-to-sales ratio rose significantly from 2.85 in 1962 to 3.49 in 1981 as manufacturers stored large amounts of intermediate goods for production and retailers stockpiled products for sale. With the introduction of lean methods and JIT, this ratio then fell dramatically to levels around 2.24 in the 1980s and to 2.19 by 2019, rose to 2.43 in 2022 and then fell to 2.27 in the first three quarters of 2023 (BEA 2023c). Indeed, the growth rate of inventories accelerated from an annual average rate of 4.3% from 2010 to 2019 to 7.1% from 2019 through 2022, while the cost of holding inventory (carrying cost) soared from 2.4% during the first period to 16% a year during the latter period after an initial fall during the COVID lockdowns of 2020 (BEA 2023c; Council of Supply Chain Management Professionals 2023: 58; Zeiger 2022). With inventories rising for over a decade along with falling productivity, production and circulation can hardly be called ‘lean’ anymore despite continuities and even as some of its methods, practices, and ideology linger on.
While just-in-case (JIC) implies higher inventories and multiple suppliers, it does not tell us anything about the speed or cost of transportation or even the levels or attempts to regulate inventories. Inventories, for example, slowed down and supply deliveries picked up somewhat in 2023, possibly as changes in logistics began to take hold (Institute for Supply Management 2023). So how will the changes taking shape affect the speed of the movement of goods through time and space and, hence, turnover time, and the ability of workers to halt the production and movement of goods and services?
‘Amazonification’: neither ‘just-in-time’, nor ‘just-in-case’
My argument is that the changes taking place in the organization of supply chains, inventories, and, hence, production taken together can best be understood as the ‘Amazonification’ of the turnover time of capital. Here it applies to manufacturing in its various phases as well as transportation, wholesale and retail firms, and most services. By using the term ‘Amazonification’ I mean that while Amazon initially designed its fulfillment centers along Toyota lean methods, it further deepened the subordination of labor and embedded the direction and pace of tasks in the algorithmic-driven and directed movement of products and labor to further increase velocity and control inventories. As its early operations manager Jeff Wilke put it concerning the problems of the new fulfillment centers, ‘The factory physics were a lot closer to manufacturing and assembly than they were to retail’ (Stone 2013: 207–209). At the same time, Amazon became a logistics firm engaged in moving products in which sales are only one small step. Industry journal Transport Topics agreed that Amazon should be ‘considered one of the largest logistics companies in North America’ (Bearth 2019). Indeed, Transport Topics named Amazon number one on its 2023 Top 50 Freight Companies list (Clevenger 2023). ‘Sales and Marketing’ and ‘General and Administrative’ account for only 10.8% of Amazon’s total operating costs in 2022. The rest covers what and how it moves into, around, and out of its facilities.
Amazon’s strategy for growth (accumulation) is driven by the ‘optimized’ movement of goods and value through the location and configuration of its facilities, the means of transportation between them and to the final buyer, the deployment of communications technology to keep everything in motion inside and between facilities, and the intense exploitation of labor at every turn. While its objectives of increased productivity, labor subordination, and minimal level of inventory are the same as those of lean production, this is neither ‘just-in-time’ nor ‘just-in-case’. It is more a matter of a continuous process of ‘high inventory velocity’, as Amazon describes it in its 2021 Securities and Exchange Commission (SEC 2021) 10-K report (p. 18). If inventory can no longer be reduced by JIT delivery in and between facilities, it has to be minimized by the continuous movement of goods through the entire production and circulation system.
In its 2022 SEC 10-K annual report, Amazon states ‘We seek to turn inventory quickly and collect from consumers before our payments to vendors and sellers become due’ (SEC 2022: 19). Here, a little explanation is required. On average, Amazon receives payment, mostly from credit cards, 18 days before it, in turn, pays its suppliers. This is a reversal of common business-to-business practice of receiving payment after delivery to the buyer. Thus, Amazon reduces its turnover time by receiving early payment and moving goods rapidly. This up-front money Amazon calls its ‘free cash flow’ rather than profits, although it clearly represents realized surplus value (Molla 2019).
This ‘free cash flow’ pays for Amazon’s expansion and the increased density of its facilities which are at the heart of its business model. In 2022, it amounted to $11.6 billion compared to ‘operating income’ (profits) of a little over $12 billion (SEC 2022: 24, 28). This can only be sustained or increased by being ‘able to turn our inventory quickly’. As the 2022 10-K report suggests, ‘for every 1% of additional inventory valuation allowance as of December 31, 2022, we would have recorded an additional cost of sales of approximately $390 million’. For 2022, that would have been an additional ‘cost of sales’ of $390 million for every $345 million of inventory valuation – more than one-for-one (SEC 2022: 21). Thus, any reduction in the movement of products through the entire ‘fulfillment’ and delivery system that increases stationary inventory becomes expensive. So, the rapid movement from fulfillment center to sortation center to delivery station, and ‘last mile’ or next-day delivery provided by its workers, along with the development of its fleet of trucks and vans are now central to its business model and a key reason why Amazon resists unionization so adamantly.
Not many companies and certainly few manufacturers can achieve the rapidity of cash flow managed by Amazon. On average, companies in the United States have to wait 32 days before receiving payment for goods delivered to a buyer, compared to Amazon’s 18 days in advance (Jefferies 2023: 275). This along with increases in stocks of inventory obviously represents a lengthening of turnover time. But these long-suffering firms can aspire to ‘optimize’ or ‘turn inventory quickly’ in order to minimize costs and maximize cash flow and actual profits. This is not the same as JIT because it is not limited to a specific, pre-determined time, point of delivery or type of product. Nor is it JIC. When describing its risks Amazon’s 10-K talks of ‘the failure to optimize inventory’ as a source of increased costs, not a means to ‘resilience’ (SEC 2022: 10). Thus, for Amazon, inventory, which cannot be avoided altogether by a company moving millions of products a day, is to be ‘optimized’, regulated, and kept in motion within and between facilities. In other words, when Amazon in its report speaks of optimizing inventory what they are actually describing is the maximized inventory velocity (MIV) of goods and, hence value, into, through, and out of their facilities as quickly as possible.
The proliferation of Amazon’s facilities has evolved over time to move its growing volume of inventory more rapidly between functional locations, such as fulfillment, sortation, and delivery centers, and bring products closer to the customer. Prime Hubs and sortation centers were introduced in 2014 and delivery stations in 2016 to speed things up (Purdy 2016). Movement was further accelerated even as business grew by the increase in fulfillment centers from 139 in 2018 to 349 in 2022 and sortation centers from 47 to 140, but even more so through the nearly exponential growth of delivery stations closest to the ultimate consumers from 87 to 656 over this period (MWPVL International 2023c). Beginning in 2018, Amazon started building its own fleet of trucks and vans of some 30,000 vans and 20,000 tractor-trailer trucks by late 2019 in order to tie these multiple facilities together more tightly under its control. By 2022 it had a fleet of 70,000 vehicles and as of 2023 was planning to purchase 100,000 electric vans (Korosec 2022). Most of these trucks and vans are driven by contingent drivers under its Flex program or those working for contractors as part of its Delivery Service Providers (DSP) (Levy 2019; PYMNTS 2019).
Furthermore, as the MWPVL International (2023a) Maps show, Amazon facilities are disproportionately concentrated in major metropolitan areas as part of the country’s largest logistics clusters in proximity to lucrative markets. Like the economy’s logistics network as a whole, it is dependent on the Interstate Highway system for much of its movement and velocity from suppliers, between facilities, and to customers. As of 2021, Amazon also had 42 regional airports for longer distance rapid delivery. This more regionalized dense network approach, which Amazon recently moved to, differs from and reveals the trend away from the national (and international) hub and spoke system used by FedEx and UPS (Garland 2023; Palmer & Rattner 2021; Smyth 2020).
What the highly orchestrated movement of goods within and between Amazon’s facilities means is that while inventories may be represented by a static average annual sum such as $34.4 billion in 2022, the goods entering and leaving Amazon’s multiple facilities are, in fact, in almost constant motion, moved from place to place by the value-creating hands of human labor sometimes aided and/or driven by technology and sometimes doing the driving, and hence potentially able to slow or stop this movement at key points.
As Table 1 shows, while its sales grew by 120% and its inventories doubled between 2018 and 2022, the number of facilities increase by two-and-a-half times, while its fleets of trucks, vans, and airplanes also grew rapidly from almost zero enabling the motion of goods and producing a decline in inventories as a percentage of sales – a strong indicator of the success of Amazon’s US model of maximized inventory velocity. This is not to say that Amazon is immune to larger economic trends. Its operating income slumped in 2022 as US consumer spending shifted back somewhat from online goods to in-person services. By 2022 it had overbuilt aspects of its network on the basis of the 2020 surge in online demand apparent in the leap from 477 facilities in March 2020 to 1,104 by December 2021. Hence, it was forced to close or delay the construction of some 90 facilities around the world (Kim 2023; MWPVL International 2023c). Furthermore, its proportion of inventory-to-sales fell significantly since 2015 as sales outran an ‘optimized’ inventory in motion.
Amazon facilities, investments, sales, and inventories 2015–2022.
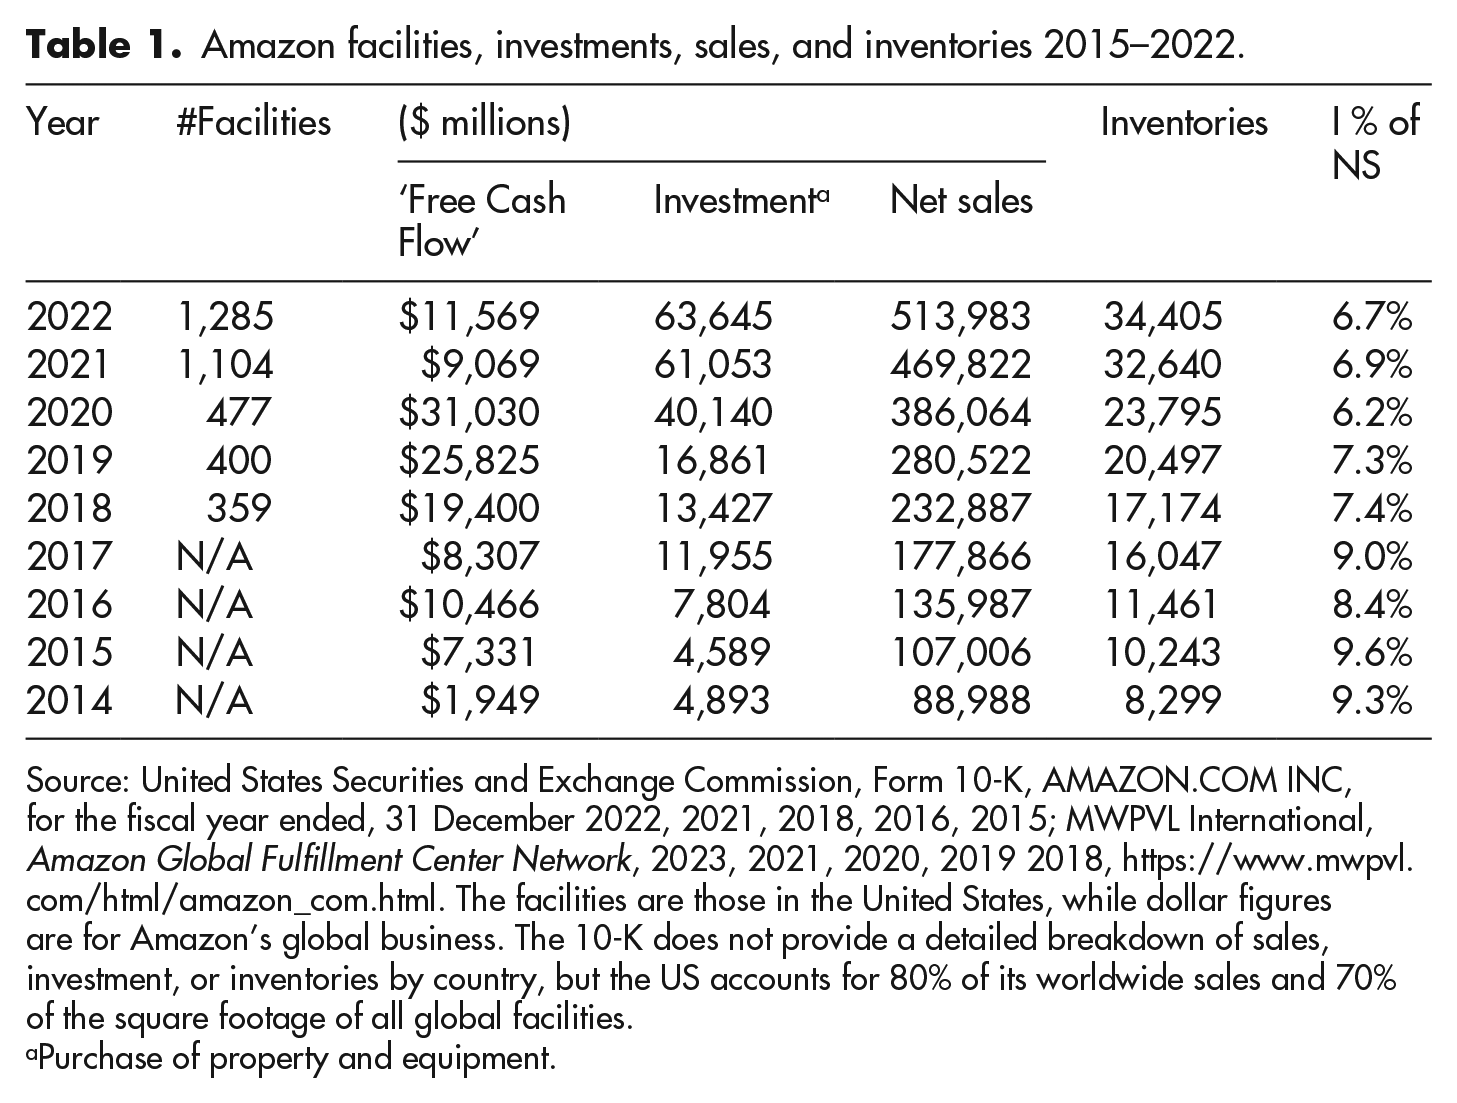
Source: United States Securities and Exchange Commission, Form 10-K, AMAZON.COM INC, for the fiscal year ended, 31 December 2022, 2021, 2018, 2016, 2015; MWPVL International, Amazon Global Fulfillment Center Network, 2023, 2021, 2020, 2019 2018, https://www.mwpvl.com/html/amazon_com.html. The facilities are those in the United States, while dollar figures are for Amazon’s global business. The 10-K does not provide a detailed breakdown of sales, investment, or inventories by country, but the US accounts for 80% of its worldwide sales and 70% of the square footage of all global facilities.
Purchase of property and equipment.
Despite the setback of 2022, in the face of growing competition in rapid delivery in 2023 Amazon did gain 49 new US facilities by the Third Quarter 2023 (MWPVL International 2023b). In addition, it planned to build as many as 150 ‘ultrafast delivery hubs’ in the next few years. These are smaller hubs closer to its final markets in the move to regionalization. Walmart, Target, and Shopify are all imitating this regionalized expansion (Daleo 2023). In other words, Amazon’s ability to ‘turn our inventory quickly’ which brings in its ‘free cash flow’ is worthy of emulation. And it is this model, whether by imitation or simply trial and error, that is emerging as the shape of logistics for the US economy as a whole.
What’s ahead for US logistics: density, velocity and vulnerability
While the US economy’s chaotic market system could hardly imitate Amazon by design, competition, pressures on profitability, the exhaustion of lean production methods, and the strains of the system’s multiple crises are driving capital in that direction just as growing international competition and crisis four decades ago encouraged the spread of lean production in the 1980s and 1990s. To get an idea of whether the trends in the movement of goods have followed the Amazon model as firms move away from just-in-time delivery, we will examine the growth in facilities in truck transportation and warehousing, the increase in truck sales as a proxy for intensified physical connectivity, and the levels and growth in investment in those areas. These developments in the movement of goods are not just for retail but apply to manufacturing and many services as well.
BLS Graphs I and II show the accelerating growth of ‘establishments’; that is, individual places of work not necessarily separate firms, in truck transportation and warehousing from 2006 through the first quarter of 2023. In both cases acceleration began after the 2008–2010 recession well before the pandemic, although there is also a sharp upswing in 2020 as people turned from purchasing services to more goods online during the lockdowns. Note also, that the proliferation of warehouses followed the transformation of warehouses over the previous two decades or so to sites of movement rather than storage (Moody 2022: 57–60). The original model for this was actually Walmart’s distribution centers, where, as Jesse LeCavalier (2016) observed, ‘At each location inventory typically cycles through several times a day’ (pp. 13–14).
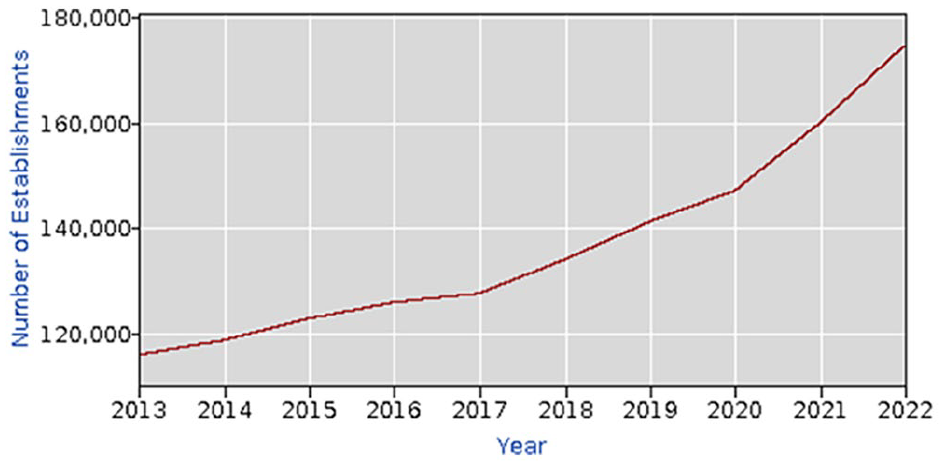
Truck transportation 2006–2022.
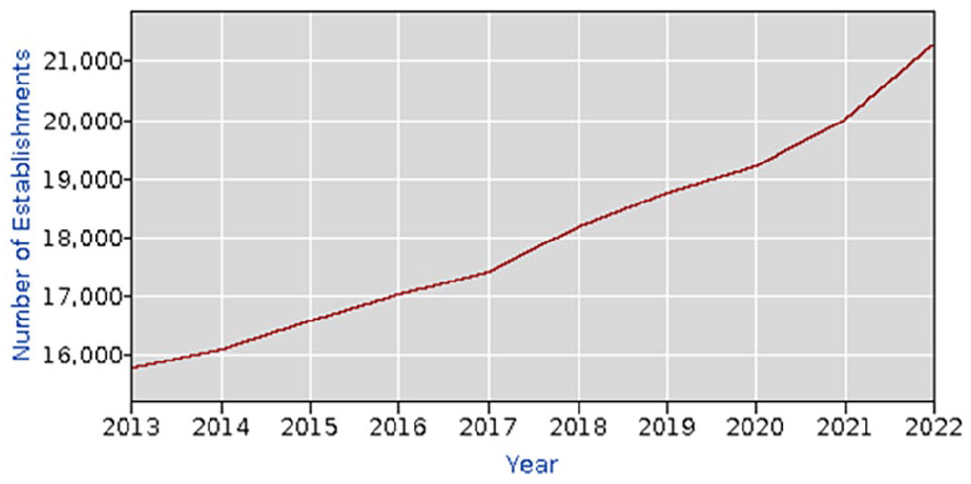
Warehousing, 2006–2022.
This move toward an emphasis on circulation; that is, movement à la Amazon, is further underlined by the fact that the annual average growth rates in ‘establishments’ or facilities from 2010 through 2022 was 4.5% in trucking and 3.1% in warehousing compared to an increase of just 2.0 for that of annual truck tonnage according to the American Trucking Associations (ATA) (2023; BLS 2023h, 2023i; Yardeni 2023). Thus, trucking facilities grew at more than twice the rate of tonnage moved, while the number of warehouses increased 50% faster. The outsized increase in trucking establishments by 65,000 since 2010 also reflects the increased trend of retailers in general to imitate Amazon by supplementing the hub and spoke systems of UPS and FedEx with thousands of ‘local and regional operators to their list of last-mile providers to ensure capacity and serve consumers preference for speedy delivery times’ (Haber 2021). This also applies to manufacturers and their suppliers.
A McKinsey survey of global supply-chain leaders in a cross-section of industries conducted in May-June of 2021 found that ‘Almost 90 percent of respondents told us that they expected to pursue some degree of regionalization during the next three years’, and that 25% had already done so in the last year (Alicke et al. 2021: 3). A 2023 survey of global executives by Accenture also found that ‘regional sourcing is also bouncing back’ and growing ‘with 38% of respondents today mostly sourcing regionally to 65% in the next three years’ (Tuma et al. 2023: 7).
The increasing role of warehouses in the movement of goods is exemplified by the growth of fixed investment in warehouse structures by a phenomenal 11.5 times from 2010 through 2022 compared to 1.8 times for all nonresidential structures and faster than any other type of structure (BEA 2023d). This rapid increase in warehouses mainly concentrated in metropolitan logistics clusters forms a dense network of the nodes in supply chains through which goods are sorted and eventually brought closer to their final destination in a manner similar to Amazon. While this does not mean a density at the level of Amazon in any given metro logistics cluster, it does point to movement in that direction.
The country’s truck fleet has grown in sync with the proliferation of facilities. New truck sales rose from an average of 6.4 million a year in the 1990s to over 9 million from 2000 to 2007 and, after a slump during and after the Great Recession, to around 12 million from 2017 through 2021 (Bureau of Transportation Statistics 2023). Investment in Transportation Equipment grew at an annual of 6.4% from 2010 through 2022, compared to 5.3% for all Equipment and 3.8% for Information Processing Equipment, and three times the growth rate of truck tonnage (BEA 2023e). This follows the Amazon pattern on a macro scale of expanding the truck fleet necessary to connect proliferating facilities.
Capital, it seems, is in a hurry to reconfigure these key elements in the movement of goods in order to increase the velocity of turnover time as more companies move toward somewhat higher levels of inventories. Biden’s infrastructure act with its subsidies and tax breaks will probably help grease the rails to this transition. Infrastructure, after all, is the underlying basis of the physical movement of goods and value whether as roads, rails, fiber optic cables, data centers, and so on, and hence, a determinant of speed, timing, and direction that allows ‘the annihilation of space by time’ (Marx 1973: 524, 536). And that requires the smoothing of infrastructure and its visibility.
The Citi GPS January 2023 report notes that companies will attempt to track this growing complexity of movement more closely: First, supply chains are likely to go through some process of reconfiguration. Producers will look to diversify suppliers of key inputs to avoid shortages and excess dependence on single sources of supply. In tandem, firms are likely to aim for ways to increase visibility by monitoring all elements of the production cycle. (Citi GPS: Global Perspectives & Solutions 2023: 12)
The U.S. Department of Transportation’s 2022 assessment of US supply chains also includes ‘increasing the visibility of supply chains and freight movements’ in its recommendations for increased resilience (U.S. Department of Transportation 2022: 6).
While we tend to think of e-commerce as part of retail, it has increasingly become the highly visible means by which businesses buy and keep track of their inputs. Business-to-Business (B2B) e-commerce sales now outstrip those to consumers (B2C). From 2017 to 2021 US B2C e-sales grew from $279.7 billion to $407.1 billion, but B2B sales went from $889 billion to $1.2 trillion over that period. Almost three times that for consumers (Waredock.com 2023). As yet, most companies do not have this advantage. Thus, as a result of disruptions over the years and the supply chain crisis of 2021–2022, ‘large firms are making it clear that they intend to look more deeply into the structure of their supply chains’ beyond their first-tier suppliers (Citi GPS: Global Perspectives & Solutions 2022: 18).
At the same time, however, as the Uptime Institute points out, ‘Rapid interconnectivity growth will add complexity and risk’. According to its 2023 survey 64% of data outages result from configuration and change management issues (Lawrence and Simon 2023: 6, 17, 18) The need for more effective navigation of connections in what industry journal Transport Topics calls the Ever-Changing Logistics Landscape has also led to the further growth of Third Party Logistics (3PL) outfits such as XPO and DHL that help design and sometimes provide the means to improve supply chains (Clevenger 2022). This connectivity is itself both a source of maximized inventory velocity and of vulnerability run and maintained by human labor.
Clearly, despite all the talk about just-in-case increases in inventory and the turn away from single sources of inputs and toward multiple suppliers, the velocity of the movement of goods through the circulation phase of capital’s turnover time is a central goal and practice of the emerging supply chain and logistics configuration. That is why concern with shorter, more visible, and dependable supply chains including high turnover warehouses are so popular with businesses. To understand the limits or potential for worker action in this changing situation we need to look in more detail at how Amazon’s structure and movement of goods might impact worker actions to see where the points of vulnerability lie in the unfolding reconfiguration of production and logistics in general.
Workplace power/positional power
The apparent domination of algorithmic technology in the tightening and accelerating of every phase of capital circulation no doubt gives the impression that today’s giants of circulation such as Walmart, Amazon, Target and so on are immune to the actions of workers, who are themselves driven by and trapped in this technological panopticon. It is, therefore, not surprising that even so experienced a researcher in this field as Nantina Vgontzas should conclude concerning that arch practitioner of data-driven logistics that: Amazon engineers optimize how orders are picked and packed by workers from offices hundreds or even thousands of miles away. As I found in my research, this process is so optimized that no individual worker, or even warehouse, can significantly disrupt the fulfilment and delivery of orders. A few strategically placed workers can no longer shut down an entire warehouse or distribution channel, as they could in the golden days of manufacturing. (Vgontzas 2021)
This analysis actually misses the role of human labor in the flow of goods within and between the facilities and means of transportation employed by Amazon and other firms in what is still ‘time-based competition’ and the turn toward maximized inventory velocity.
The first point is that neither remote engineers nor their algorithms can actually move anything into, around, and out of a fulfillment center, factory, or along the last mile of delivery. This requires a combination of mechanical devices such as robots, conveyer belts, and trucks and human labor to actually move a part, box, package, or product between these automated segments, and drive vehicles between facility sites. One reason for the need for human labor is that the mechanical devises are limited at handling multiple things of different sizes as well as, for the foreseeable future, driving trucks or vans. Robotics engineer Hans Moravec’s Paradox tells us, ‘It is comparatively easy to make computers exhibit adult-level performance on intellectual tests or playing games, and difficult or impossible to give them the skills of a one-year-old when it comes to perception and mobility’ (Brynjolfsson & McAfee 2014: 28–29).
They are limited as pickers and packers, and can’t load or unload scores of packages of different sizes in to and out of the correct truck (Wohlsen 2013). There is no sustained movement in today’s very material circulation of capital without human intervention. Indeed, the technology that is designed to drive the maximized inventory velocity exists to maximize the productivity of labor that creates relative surplus value and makes this movement possible. This is what Marx (1976) called the ‘real subsumption of labour under capital’ . . . ‘as something not merely alien, but hostile and antagonistic’ (pp. 1023–1025).
This is not just about logistics along a supply chain. Between the various mechanical or automated moving processes inside a facility it is still human beings who handle things going from one place or process to another – say from a shelf of products held by a Kiva (or newer Cardinal/Proteus) robot by hand to a tote and then to a packer and then, possibly via an automatic conveyer belt, to those who load trucks. These human workers may well follow the ‘alien’ and ‘hostile’ instructions and commands the remote engineers programmed into their hand-held or belted devises, on-board commuters, pick-to-light instructions, and so on. Or they may defy those commands disrupting the data-directed flow. Amazon acknowledged as much in risks of disruption to their ‘ability to receive inbound inventory efficiently and ship completed orders to customers’ just before terrorism and acts of God (SEC 2018: 8, 2021: 10). Even aside from concerted action, the speed of the digitally driven tasks is such that many workers cannot ‘make rate’ (Struna & Reese 2020: 90–93). Furthermore, the size and rapid growth of Amazon’s workforce from 56,200 in 2012 to 1,541,000 in 20 23, a figure that does not include its countless contractors, itself attests to its dependence on human labor (Coppola 2024). The highly optimized choreography of the algorithms that Vgontzas found and the speed of movement and the level of labor productivity they demand can make the impact of the actions or inactions of most workers more immediate, more disruptive, and more difficult to undo because time (hence value) lost cannot be regained when things are already moving at maximum speed.
The experts engaged in the debates over just-in-time versus ‘resilience’ recognize this problem. MIT’s Yossi Sheffi, the leading US advocate of ‘resilience’, writes of its necessary components, ‘Optional assets such as spare inventory, spare capacity, and alternative suppliers provide materials and assets that can be utilized to minimize impacts and accelerate recovery time’ (Sheffi 2015: 49). In terms of spare capacity, however, British logistics risk expert Donald Waters (2011) points out, ‘It is clear that a process working at full capacity cannot suddenly change and start moving work around’ (p. 205). In its 2020 SEC 10-K report, Amazon particularly mentions ‘Risk Related to System Interruption and Lack of Redundancy’ (SEC 2020: 10–11). Amazon fulfillment centers do have spare physical capacity to accommodate the increased business in the holiday season from November through December. But to activate this in normal times Amazon must hire and train thousands of additional workers, meaning that there is a period of vulnerability in any center and its related transport system most of the year. So, effective coordinated actions can have an immediate effect on a facility and others in the region. During the holiday season, Amazon will hire as many as 250,000 additional workers and operate near total capacity so that it is highly vulnerable across the system to worker action (Fong 2024).
To understand the nature of workers’ power in a moving process I borrow Vgontzas’s use of the term ‘positional power’ to capture the fact that the points of worker’s power being discussed are mainly those points between the various phases of the motion of goods or, for that matter, the provision of services, such as immobile fixed capital (conveyer belt, robot, packing station, truck, road, rail, warehouse, port) or almost any point in a process where humans intervene.
As John Womack, Jr. points out in his discussion of positional power, there are more opportunities for disruption today because ‘any product that moves now, anybody who moves, goes through many more connections in chains and networks than a generation ago’ (Olney & Perusek 2023: 46) This is certainly true in the Amazon model that is taking shape across the US economy. The work at these ‘connections’, bottlenecks, and choke points varies in content, skills, effort, and how they impact the overall movement of things. Despite management’s decades-old effort to quantify and standardize labor, however, workers often know their own tacit skills on which the job depends and the hidden or implicit weaknesses in the job they perform.
The point, however, is not about the power of individuals, but about consciously asserted collective power in a process of time and motion. The productivity of labor, after all, is produced collectively, not individually. The workers, in a sense, can stand Frederick Taylor on his head through the conscious use of time and motion for their own ends. This is the basis not only of a strike, but of an effective work-to-rule or more ambitiously ‘running the plant backward’. as UAW reform leader and strategist Jerry Tucker called his more complex and collective ‘inside strategy’ (La Botz 1991: 117–126). No matter what the technology, such positional power exists in every system of the production of value from factories, warehouses, and transportation to hotels, hospitals, and supermarkets.
What’s ahead for labor: power under maximized inventory velocity
Like that of lean production in the neoliberal era, the implementation of the paradigm of maximized inventory velocity will be uneven and imperfect across sectors of the global economy. Old habits and invested capital die hard. Although we can discern clear trends, outside of Amazon and its immediate imitators it is in its infant stages and the impact of worker self-activity on the movement of goods and value will have to be tested in practice before we can be sure of the best tactics and strategies to deploy against capital. Still, it is worth looking at the impact of disruptions on capital in the United States in the now fading just-in-time era to see what remains and what is different.
A study of 397 US companies in various industries done between 2005 and 2014 showed that the average impact in the quarter immediately following a disruptive event, sales fell by −4.82%; operating income −26.5%; return on sales −12.7%, and return on assets −16.1%. Thus, a relatively small impact on sales had a substantially larger impact on various profit measures. These were measures of impact still in the lean/JIT era. Increased inventories might soften the initial impact of a strike or any other disruption for a time. But the study also notes that firms’ cost of inventories grew by 7% with overall costs rising by over 8% during the first quarter after the disruption (Baghersad & Zobel 2021: 6; BLS 2023c). The post-lean increase of total inventory and inventory carrying costs we saw above even if their growth moderates some over time means that the impact of a strike or other disruption remains powerful despite the decline of JIT.
Continued efforts to increase the velocity of inventories and turnover time in any of its forms, will make strikes and other disruptions effective precisely in rhythm with the accelerated movement of goods and value. The loss of the rapid impact of direct action on just-in-time delivery can thus be compensated to a considerable extent by capital’s own attempts to maximize inventory velocity. In addition to all-out strikes, the trick will be to locate the most significant points of vulnerability in the movement of inventory and assert positional power to ‘run the plant backward’. For example, a summer 2023 walkout by a minority of workers at Amazon’s Kentucky air hub that included those in the Amazon Robotics Department reduced the number of packages moved that day by tens of thousands (Feliz Leon 2025).
Of course, organizing unions and building a working-class movement is about a lot more than the technical points of workers’ power. This is a job that requires mass democratic involvement inside and beyond the workplace. Unions in the United Kingdom, Germany, France, Spain, and Italy, operating in a more union-friendly regulatory environment, have used escalating strike action to make gains and establish strong footholds in many Amazon facilities (Azeez 2021; UNI Global Union 2023). Even in the United States’ more hostile atmosphere, however, the possibility of an organizing effort has been increased by the rise in worker activity expressed in strikes, pre-strike mobilizations, rank and file pressure and organization since the teacher uprising of 2018–2019. 2023 saw a leap in the number of strikers since the COVID lockdown of 2020 to over half-a-million. Those taking part in the ‘major’ strikes of 1,000 or more workers measured by the BLS at about 472,000 by late November 2023 came close to the 485,000 in 2018 which was the largest number since 1986 (Moody 2023). To a significant extent, the major contracts won in 2023 and 2024 reversed the decades of concessions to employers and established significant gains in wages and even areas of technology and investment usually considered management prerogatives. What characterized many recent struggles was the active participation of rank-and-file workers both before and during strike action and even where a strike was averted as at UPS. This was in part due to the success of rank-and-file organizations in the Teamsters and United Auto Workers in the previous few years which have been followed by similar movements in the United Food and Commercial Workers and the International Alliance of Theatrical Stage Employees.
At the same time, poll after poll has revealed a dramatic change in attitudes toward class struggle. The annual Gallup poll on public approval of unions saw a jump from 61% in 2017 to 67% in 2023. Perhaps even more significant, several other polls revealed support for strikes by auto workers and Hollywood writers and actors and that people supported the strikers over the bosses. In no poll that asked the question ‘which side do you support?’, did the employers receive support of more than 25% of respondents (Ipsos 2023; Navigator 2023; Saad 2023).
Alongside this change in consciousness has come a workforce that is younger, more diverse, and less socialized in the years of union retreat and job loss, on the one hand, and more potentially connected to the social movements of the day. Trucking and warehousing employment at the center of changing production and logistics combined doubled from 2010 to 2023 to a total of over 3 million. Even more significant was the racial and gender transformation of this workforce. From 2002 to 2022 the proportion of black and Latinx workers in trucking grew from 25.5% to 41.5%, while in warehousing they increased from 40.8% to 59.9% over those years. Women in warehousing jumped from 26.5% to 35.4% of that workforce, which was also 6 years younger on average than the total US employed labor force (BLS 2010, 2022b, 2023h, 2023i, 2023j).
The best way to test the resilience of capital to worker actions under the emerging conditions of maximized inventory velocity would be to launch the organization of Amazon on a massive scale. National Labour Relations Board (NLRB) elections have not been a promising path to unionization at Amazon. Furthermore, the idea of organizing this giant one NLRB election at a time seems an unimaginable stretch that would fail to build the power needed to tame the beast. Organizing must come primarily from the inside where activity is already taking shape and be built on direct action that increases power rather than just voting that wins only formal recognition. It will take real power and solidarity from below inside and outside to bring Amazon to heel. A growing number of strikes and direct actions at Amazon facilities, however, show that such actions do have an impact (Feliz Leon 2025). The deployment of such strategic actions at not only Amazon, but across the emerging shape of US production and circulation can open the door to a new phase of unionization.