
Abstract
Unions can increase the power of workers through both collective bargaining and political avenues, potentially creating less income inequality and poverty. However, this potential may not be realized. Drawing on power resource theory, this study uses panel data to investigate the connection between unionization and two measures of after-tax inequality – the income share of the top 1% and the Gini coefficient – and three measures of poverty – the percentage of the population below the low-income cut-off, the average income of the bottom decile, and the percent of the population below the low-income measure – between Canadian provinces from 2000 to 2020. We find that unionization is negatively associated with income inequality in Canada. This relationship is statistically significant. However, we do not find evidence of any statistical association between unionization and poverty in Canada.
Introduction
Income inequality has increased in Canada since the 1970s. In the late 1970s, the Gini coefficient for market income was about 0.37. For after-tax income, it stood at around 0.29. By the late 2010s, the Gini for market income had increased to around 0.43. The after-tax Gini increased by a smaller amount but was slightly over 0.3. Most of this increase occurred in the 1980s and 1990s, with income inequality remaining fairly constant since the late 1990s (Burkinshaw et al. 2022). During the same time period that inequality was increasing in Canada, the strength of its unions was decreasing. In 1981, 37.6% of Canadian employees were union members. By 2019, it had fallen to 28.7% (Morissette 2022). The rise in inequality is not unique to Canada. Other nations, like the United States, have experienced greater increases, and higher levels, of inequality than Canada. Yet, the growth and extent of inequality are not inevitable. There is wide variation in inequality not just over time, but across nations, and even at the subnational level (Piketty 2014; Piketty & Saez 2003; Sommeiller & Price 2018). This would seem to suggest that inequality and poverty are influenced by the economic and political context in different regions. This article investigates whether one of those influences in Canadian provinces is the strength of the union movement.
There is also growing evidence that higher levels of inequality – distinct from the higher levels of poverty that often accompany it – are harmful across a range of social and economic indicators. Wilkinson and Pickett (2011) showed that more unequal nations are more violent and less educated. Even in affluent societies, the greater the inequality, the greater the health gradient, even for people considered to have adequate incomes (Marmot 2004). Unequal societies, even affluent ones, have higher rates of stress, anxiety, depression, and addiction, which are caused by people’s reduced sense of control over their own lives and an overall decreased level of social coherence and security, compared to those in more egalitarian nations (Wilkinson & Pickett 2019). Studies by the International Monetary Fund (IMF) and Organisation for Economic Co-operation and Development (OECD) have found that countries with higher levels of inequality have lower rates of economic growth. According to a 2014 OECD working paper, ‘income inequality has a negative and statistically significant impact’ on economic growth (Arjona et al. 2001; Berg et al. 2018; Cingano 2014). High inequality also creates an unequal playing field for children from rich and poor families, making it increasingly unlikely that low-income children will be able to move up the income ladder (Osberg 2019). Studies have repeatedly shown that lower levels of inequality are associated with higher levels of social mobility (Chetty et al. 2014; Corak 2013). While increasing equality may take some justification, hopefully, the case for reducing poverty is self-evident. A society in which a smaller percentage of its population finds itself without basic needs (socially determined as those needs are) is a preferred state of affairs.
Under the assertions that (a) reducing poverty and inequality are desirable and (b) poverty and inequality are influenced by the political and economic structures of any region, this study investigates whether one specific structure – unions – has an impact on poverty and inequality. Specifically, it will conduct a quantitative analysis of the relationship between Canadian provincial unionization rates, income inequality, and poverty between 1990 and 2020.
Unions, inequality, and poverty
While the empirical focus of much inequality research tends to be on wealth and income, inequality describes variation along a potentially infinite number of axes or dimensions of life. Therborn (2013) distinguishes between three major categories of inequality: vital, existential, and resource. Vital inequality speaks to our varying abilities to be healthy and long-lived organisms; existential inequality reflects our different degrees of autonomy, dignity, recognition, and respect. Resource inequality refers to our access to those things necessary to effectively act. Money and assets are certainly key among these, but the extent to which other necessaries for action (enfranchisement, access to policymaking, access to politicians, education, legal facility, legal rights to exclude) are closely tied to money is of crucial importance, and is the product of past and present struggle. In societies where almost everything is obtained in its commodity form, through markets, dimensions of inequality are likely to be significantly related to inequality in income and wealth, and likely to stack.
Understanding the labor movement’s relationship with inequality within capitalism requires us to look, as we do in this article, at the distributions of economic resources resulting in part from workers’ struggles over relative factor shares of income. While much research has looked at the results of this struggle from the 1970s on, we can see marked changes in the distribution of wealth and income in Western industrialized countries over the course of the last half of the 19th century and through the 20th. Piketty’s (2022) ‘Brief History of Equality’ is excellent on this longer historical sweep. Broadly, we see a remarkable reduction in inequality from the turn of the 19th century through about 1980, though the specific pattern varies across the advanced capitalist world (Figure 1).
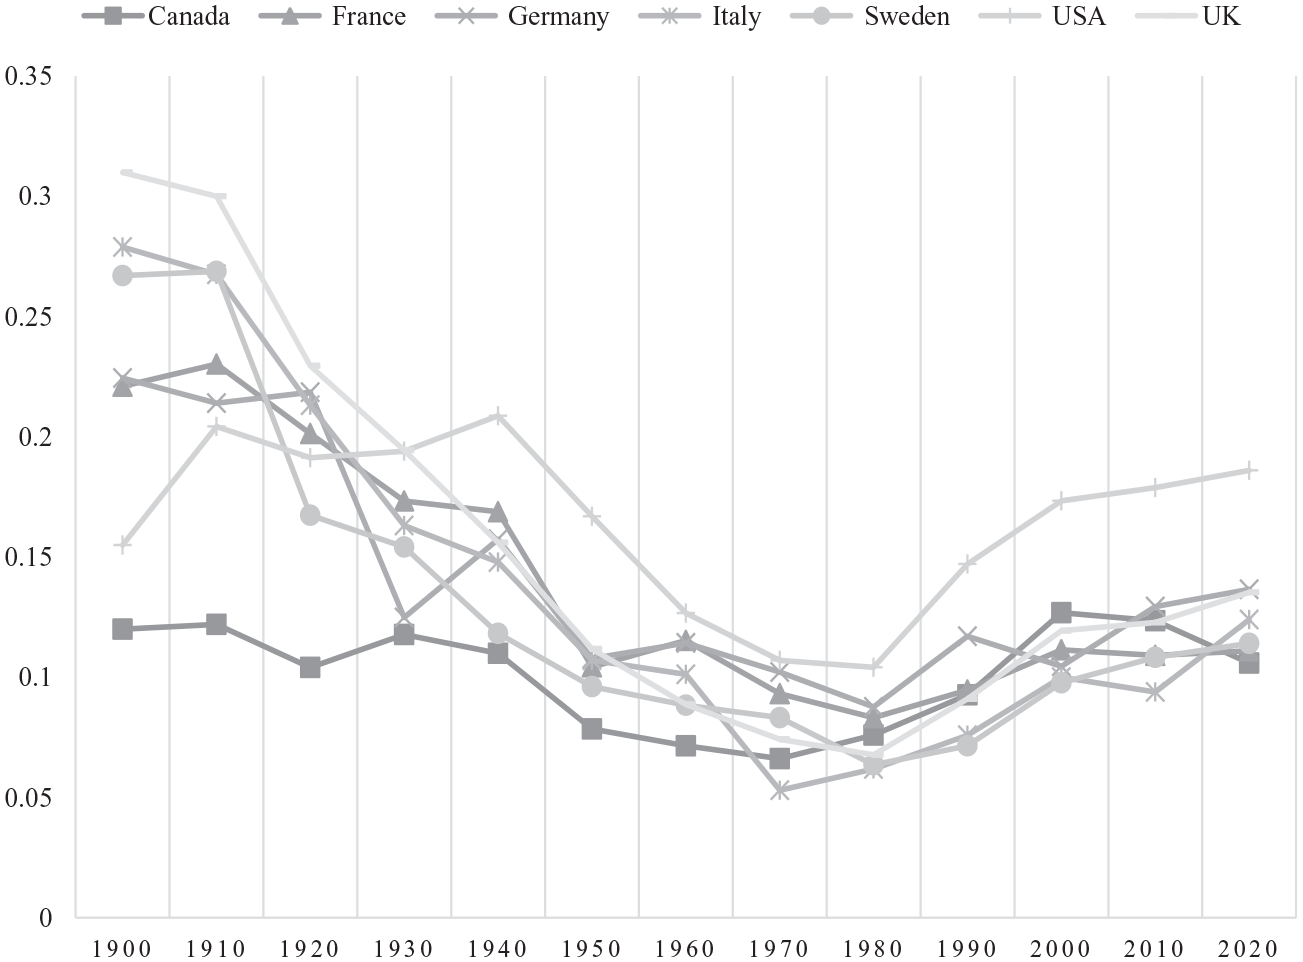
Top 1% share of national pre-tax income, selected countries, 1900–2020.
The OECD’s trade union database provides comparative, cross-national data on union density, but only back to 1960. The trends there, shown in Figure 2, suggest that declines in union density for most of the countries began in the early 1980s. The exceptions are the United States, which shows a steady decline through most of the period covered, accelerating from the late 1970s to the mid-1980s, and Sweden, whose consistent decline began in the mid-1990s.
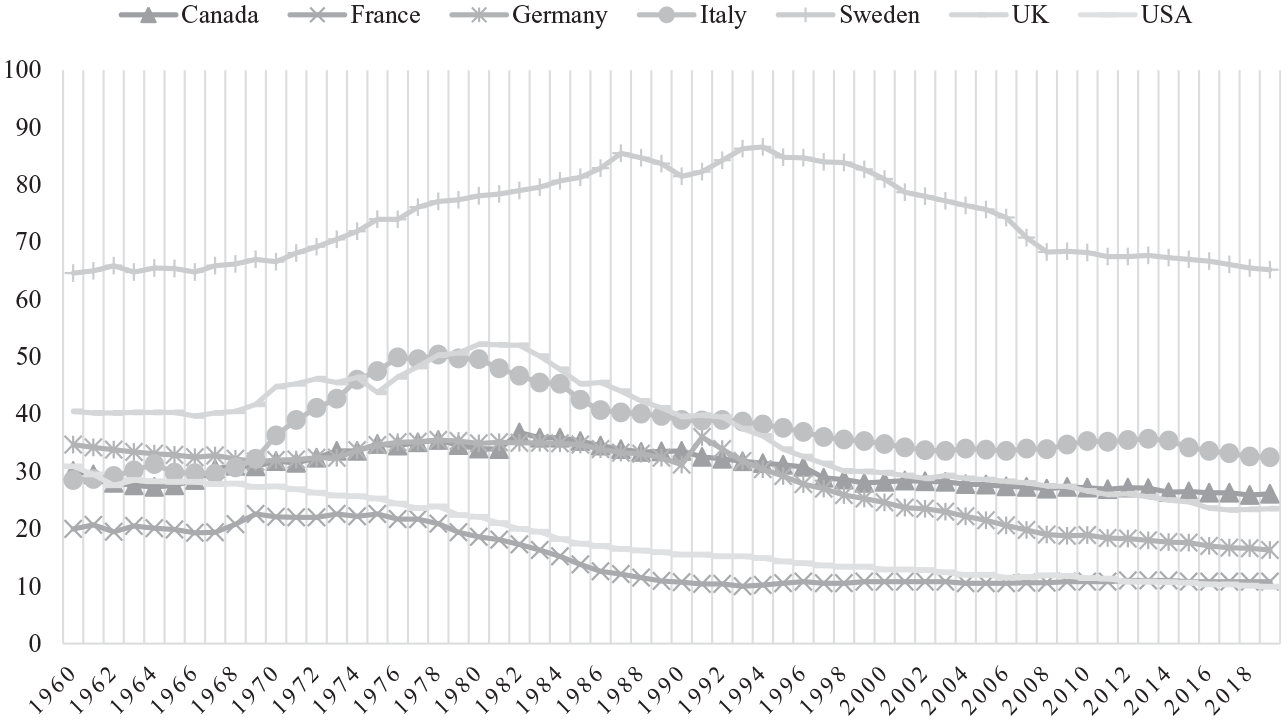
Union density, selected countries, 1960–2019.
In Canada, the most precipitous period for union density, during which it dropped from about 37% to about 31%, was the decade between 1984 and 1994 (Gomez and Gomez 2016: 24). For inequality, the steepest upward trend in the Gini coefficient lagged by 4 years, occurring between 1988 and 1998 (Gomez and Gomez 2016: 24). So, by the time we arrive at the time period for our own study (2000–2020), much of the damage to unionization and inequality had been done, and Corak (2016) shows evidence that in fact during the period from 1995 to 2015, inequality was largely unchanged, and poverty across the country fell. It will thus be interesting to see whether, in the interprovincial Canadian context, the variation in unionization across provinces during this more ‘stable’ period still has an effect on inequality and poverty.
There is some reason to believe that it will. The labor movement has had considerable effects on the quantitative distribution of wealth and income, and the qualitative variation in the power that wealth confers on its owners. The contributions of the labor movement in the transition toward more inclusive democracies were central. Therborn reports in his sweeping review of democratic transitions in the advanced capitalist nations of the 1970s that ‘the working-class movement was nowhere capable of achieving democracy by its own unaided resources’. But he also shows that it has been the development of the basic contradiction between capital and labour that has carried democracy beyond the boundaries of the ruling class and its props. Thus, the second stage1 in the struggle for democracy was largely shaped by the emergence of the working-class and the labour movement. (Therborn 1977: 34)
While decades of research within the Power Elite tradition (e.g. Domhoff 2013; Mills 2000) has revealed how wealth and power still translate into vastly disproportionate political power for the rich, the struggle to overthrow the legitimacy of rule by the wealthy handful was a major step toward disaligning economic and political inequalities. It also coincides with enormous drops in income and wealth inequality. What Piketty describes as the ‘Great Redistribution’ occurred between 1914 and 1980, a period of fluctuating, but overall, upwardly trending power of the labor movement across the West.
Therborn (1984) shows that the 1970s saw an especially strong acceleration of egalitarian limits on the power of private property, pushed by the union movement in advanced capitalist countries. In particular, workplace safety and health legislation, limits on managerial power to hire and fire, co-management, and other means of restricting unfettered capitalist control over the labor process all had an equalizing effect (Therborn 1984: 15–18). The redistributive effect of all of this can be clearly seen through the first three quarters of the 20th century. In Europe, the top 10%’s share of all private property fell from almost 90% in 1900 to just over 50% in 1985. In the United States, the drop was less dramatic, but still from just over 80% in 1900 to just over 60% in 1985. The beneficiaries of this were not the poorest, whose share remained below 10% throughout this period, but the middle 40% of the population (Piketty 2022: 153).
Power Resource Theory (Korpi 1983; O’Connor & Olsen 1998) presents a useful way of thinking through the relationship between the labor movement and inequality, taking into account both the qualitative and quantitative dimensions as they can be understood as products of class conflict over the distribution of social surplus. The role of unions is most easily grasped in a workplace-by-workplace framework, or, in instances of more corporatist arrangements, on a sector-by-sector framework. Here, a clear struggle over the distribution of an expected, fixed (even if unrealized) surplus is clear to see. Unions can win better wages and working conditions for their members, so areas with higher union representation may also be areas with higher wages and better working conditions.
However, as we have discussed, on a national or subnational level, the presence of unions may have effects over and above the aggregate of wage, hours, and benefit victories won for union members at the bargaining table. Some of this has been quantified by looking at the terms of unionized employment as a new bar for non-union workers, accounting for a spill-over of union power for non-union workers. On the other hand, mobility is a resource for capital, and it may also be possible that private investment could flee a high wage, unionized environment for more low-cost options. This would result in increased unemployment, decreased productivity, and reduced economic growth, which would put downward pressure on incomes (Holcombe & Gwartney 2010; Pantuosco et al. 2001).
There may also, however, be further effects, inasmuch as unions, political activity alters (a) the conferral of power based on property ownership, (b) political responsiveness to working-class political demands, and (c) the balance between commodification and decommodification – provision of public goods versus provision via private markets. Hacker and Pierson (2010), for example, argue that the decline of unions has been a significant part of aligning ownership of wealth (especially in the means of production) with political power. As the flip side of the same coin, Flavin (2018) shows that in the United States, states with higher levels of union membership treat citizens’ political demands more equally across income groups than in those with lower union membership. Similarly, Becher and Stegmueller (2021) find that a bigger union presence has a significant dampening effect on political prioritization of high-income preferences in the House of Representatives. The authors of a recent study on the role of unions in a broader democracy articulately sum up their role in struggles outside of the workplace: ‘in between elections, unions also help develop political interest and skills among workers who might not otherwise devote much time to thinking about politics. And, on a deeper level, unions shape how working-class Americans perceive their political and economic interests’ (Feigenbaum et al. 2018a). Research in the United States has shown that differences in subnational unionization rates can result in different voting patterns in different states. In states in which it is more difficult to form unions (‘right to work states’), voter turnout is about two points lower than others and Democrat candidates fared two to five points worse. Even more tellingly, prior to the implementation of right to work laws the states had almost identical voting patterns (Feigenbaum et al. 2018b). In a political system, like the Canadian provincial systems that are being investigated in this article, in which policies are packaged into bundles under the broad banner of political parties, it is even possible for unions’ political efforts to have an indirect effect. For example, if unions support a ‘left’ leaning political party because they will be more likely to implement pro-labor policies, that same party may also be more likely to engage in income redistribution, and the non-market provision of public goods and services. In summary, unions intervene in the struggle over the alignment of income and wealth inequality, on one hand, and all other forms of inequality (access to education, health care, clean air, credit, political voice, spaces, and infrastructure, etc.) on the other. These interventions may not all immediately improve resource inequality (though some of them do), but they do have effects on both vital and existential inequalities.
Previous literature has reported on the relationship between income inequality and unionization rates in one nation over time, using cross-national comparisons, and at the subnational level. At the national level, Kotz (2015) argues that the 1940 to 1980 period, in which unionization rates were at their historical peak, featured rising wages and protective legislation for workers such as increasing real minimum wages, unemployment insurance, and union recognition that all contributed to declining income inequality and poverty (for empirical support for this proposition in local United States labor markets, see Callaway & Collins 2018; Collins & Niemesh 2019 for evidence on unions’ role decreasing the gap between workers and management, see R. Freeman 1980) By contrast, the post-1980 United States economy, with lower rates of unionization, led to greater levels of inequality (DiNardo et al. 1996). Card (2001) found that declining unionization in the private sector between 1973 and 1993 accounted for between 15% and 20% of the growth of male wage inequality, but had little impact on female inequality. Farber et al. (2021) estimated that the increase in union coverage before 1968 accounted for over one-quarter of the decrease in the Gini coefficient. Conversely, they find that the decrease in unionization after 1968 accounted for more than one-tenth of the increase in the Gini during that period. Furthermore, they found that union advantages were more important for the less educated and non-White population, reducing income inequality between those groups and the rest of the population (see also Mishel 2012). Western and Rosenfeld (2011) argue that high unionization rates create norms of wage equity across society and that the erosion of these norms as union strength declined was responsible for somewhere between 20% and 33% of wage inequality in the United States between 1973 and 2007 (see also Brennan 2016; Volscho & Kelly 2012). Examining industry-level data in the United States from 1983 to 2005, Young and Zuleta (2018) found that unions increase labor’s share of income.
Studies on Canada have also associated lower unionization rates with higher levels of income inequality. Card et al. (2004) attribute about 15% of the growth of income inequality in Canada to the decline in unionization (see also Fortin et al. 2012; Mackenzie & Shillington 2015). Studies on the connection between inequality and unionization in Canada have also found that unions do not increase equality among women (Card et al. 2004), but do increase income equality between men and women (Doiron & Riddell 1994; Shamsuddin 1996).
There is also cross-national evidence that suggests that countries with higher unionization rates have greater equality. In cross-national comparisons, which include the United States and Canada, nations with higher union density also have greater income equality (Aidt & Tzannatos 2002; Card et al. 2004). A study of 25 OECD countries between 1990 and 2013 found that declining unionization (along with greater labor market flexibility and increasing financialization) was significantly related to a higher Gini coefficient (Tridico 2018). Countering the conclusions above, a study on 16 affluent nations between 1978 and 2002 found that although unionization rates had an impact on inequality of household disposable income, this only operated indirectly, through its political role, expanding the welfare state, not through its role in collective bargaining (Baccaro 2011: 269). In a more globalized world, the author argues, ‘Union attempts at equalizing incomes by compressing market earnings seem ineffective and impractical’ (Baccaro 2011: 214).
Previous studies have also examined the impact of subnational, state levels of unionization on inequality and poverty in the United States. Between 1964 and 2012, higher rates of unionization were associated with lower levels of inequality, whether measured through the Gini coefficient or the income shares going to the top earners (Meszaros 2018; see also Herzer 2016). Unionization has also been found to reduce the number of working poor residents in states (Brady et al. 2013).
There have been a few studies that, as we propose to do, analyze the connection between Canadian interprovincial variation in unionization rates and income inequality. Using inequality of total (market plus government transfers) income as the dependent variable, Breau found that between 1981 and 1999, unionization decreased income inequality as measured by the ratio of top to bottom quintiles, but had no significant impact on the Gini (Breau 2007). Haddow (2014) examined the political role of unions, investigating the connection between unionization rates and provincial income redistribution between 1993 and 2010. He found that there is considerable variation in the extent to which provincial income redistribution decreases income inequality and poverty (measured by the difference between market and after-tax and transfer income distribution and poverty measures). He also found that these differences can be, in part, attributed to union density and, to a lesser extent, governing party ideology interprovincially. Furthermore, it appears that union density has a larger impact on the Gini coefficient than on poverty. Finally, Scrimger (2020) studied the relationship between various measures of union strength and market income inequality (such as the Gini, and the share going to the top 1%) between 1984 and 2012. He found that union density is related to a more equal Gini coefficient but had no impact on other measures of inequality. To the limited extent that union density had an impact on income distribution, it only impacted the middle of the income distribution, and had no significant impact on the lower end, suggesting that unions do not impact the market income of the poorest members of society. He speculates that this may be due to the low levels of union representation among low-income jobs. Furthermore, unlike Haddow, he finds that a left/center provincial government has no impact.
We seek to advance the existing subnational literature by investigating whether differences in unionization can have a measurable impact on inequality and poverty. This is particularly important when provinces have considerable discretion over the legislation that can facilitate or hinder union formation, which has led to very different environments and unionization rates in different provinces (Das et al. 2020). As Haddow (2014) demonstrates, there is sufficient interprovincial variation to make a subnational study every bit as relevant as a comparison between nations. This study offers a more comprehensive view of union impacts on inequality and poverty than both Haddow, which does not account for unions’ impact on the market distribution of income, and Scrimger, which only focusses on market inequality, by using after-tax income as the measure of inequality and poverty. This allows for unions to have a role in influencing both the market income and redistribution through the welfare state.
Unionization and inequality in Canadian provinces
During the period of our study, unionization rates in Canada have generally declined marginally, falling nationally by 3% (1 percentage point), from 30.1% in 2000 to 29.1% in 2020. However, this masks the extent of the decline because the 2020 number is artificially high since COVID-19 job losses were concentrated in the nonunionized sectors of the economy (Statistics Canada 2022a). In 2019, the last pre-COVID-19 year, the unionization rate was 27.9%. However, this hides considerable differences in both level and trend across the Canadian provinces (Figure 3). In 2000, the difference between the high union density provinces, Quebec (36.3%) and Newfoundland (38.0%) for example, and the lowest density province, Alberta (21.4%), was around 15 percentage points. Alberta had a consistently lower rate than the other provinces but increased slightly between 2000 and 2020. Unionization rates increased in five provinces during the period of our study and fell in the other five – most dramatically in BC, where they fell by 4.7 percentage points from 34.3 to 29.6.
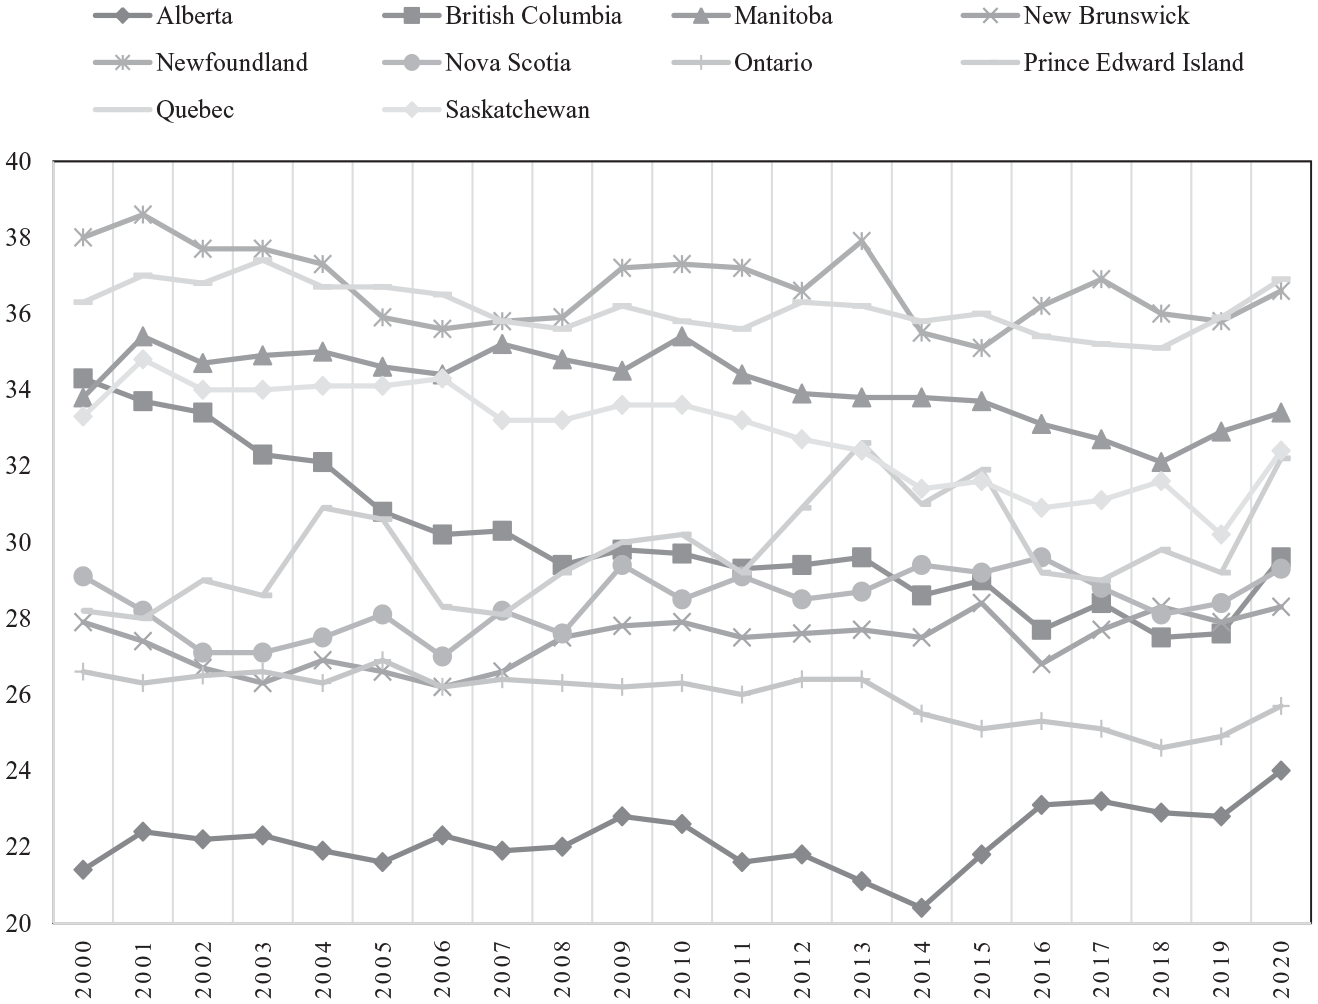
Unionization rates, Canadian provinces: 2000–2020.
In Canada, the policy environment that influences the strength of unions is determined at the national and provincial levels. At the national level, the Rand Formula ensures that, in a workplace with union certification, individual workers must pay union dues but have the right to opt out of the union. This judgment, which has stood up to several court challenges, eliminates the free rider problem of workers receiving the benefits of union collective bargaining but not paying dues. It also means that provinces do not have the option of following the lead of some states in the United States by passing ‘right to work’ legislation that allows workers to opt out of paying union dues. Also enshrined nationally is the right of union certification – that when the majority of workers in a workplace vote for a union, the employer must engage in collective bargaining.
However, provinces do have considerable discretion over many of the other rules that surround unionization. Approximately 90% of Canadian workers are covered by provincial (or territorial) law (Warner 2013). A complete accounting of all the provincial differences in this area is beyond the scope of this article, but we will try to demonstrate that provinces are largely responsible for the context in which unions operate. Provincial governments can institute back to work laws or enforce essential services agreements that take away or weaken unions’ ability to strike. Provinces have discretion over whether employers can hire replacement workers during a strike (Duffy & Johnson 2009). They can, and have, legislated wage freezes for unionized public-sector workers that effectively remove their right to collectively bargain. Provinces can also alter the rules that govern union certification (or decertification) votes. One example of this is ‘card check’, in which unions can be certified by essentially collecting signatures or union cards from a certain percent of the workforce, versus a ‘secret ballot’ as a voting mechanism. Research has found that the former is much more conducive to union formation than the latter largely because the delay in union certification necessitated by the secret ballot permits employers time to organize a counter offensive (Campolieti et al. 2007; Riddell 2004; Slinn 2005; Warner 2013). Provinces also have discretion over the extent of employer anti-union actions. For example, in 2002, British Columbia expanded employers’ ‘right to communicate’ with their workers during a unionization drive (Das et al. 2020). Finally, provincial governments fund and administer some form of a Labour Board, which facilitates collective bargaining, arbitrates workplace disputes, and enforces the rules in unionized workplaces. The manner in which this is staffed, and the extent to which it is funded, has an impact on unions’ ability to seek recourse when employers violate provincial labor law. The decentralized regulatory environment in Canada and the resulting differences in rules and unionization rates make an interprovincial study useful.
Figure 4 shows the trends in inequality, as measured by the Gini coefficient on after-tax income, for Canadian provinces between 2000 and 2020. The trends during this period appear to be more egalitarian, but much of this is concentrated in 2020, when the federal government provided large income supports through the Canada Emergency Response Benefit (CERB) program to offset job losses due to COVID-19 crisis (Statistics Canada 2022b). There also appears to be considerable churning in the provincial inequality rankings, with the exception of New Brunswick, which had the most egalitarian after-tax Gini for most of this time period.
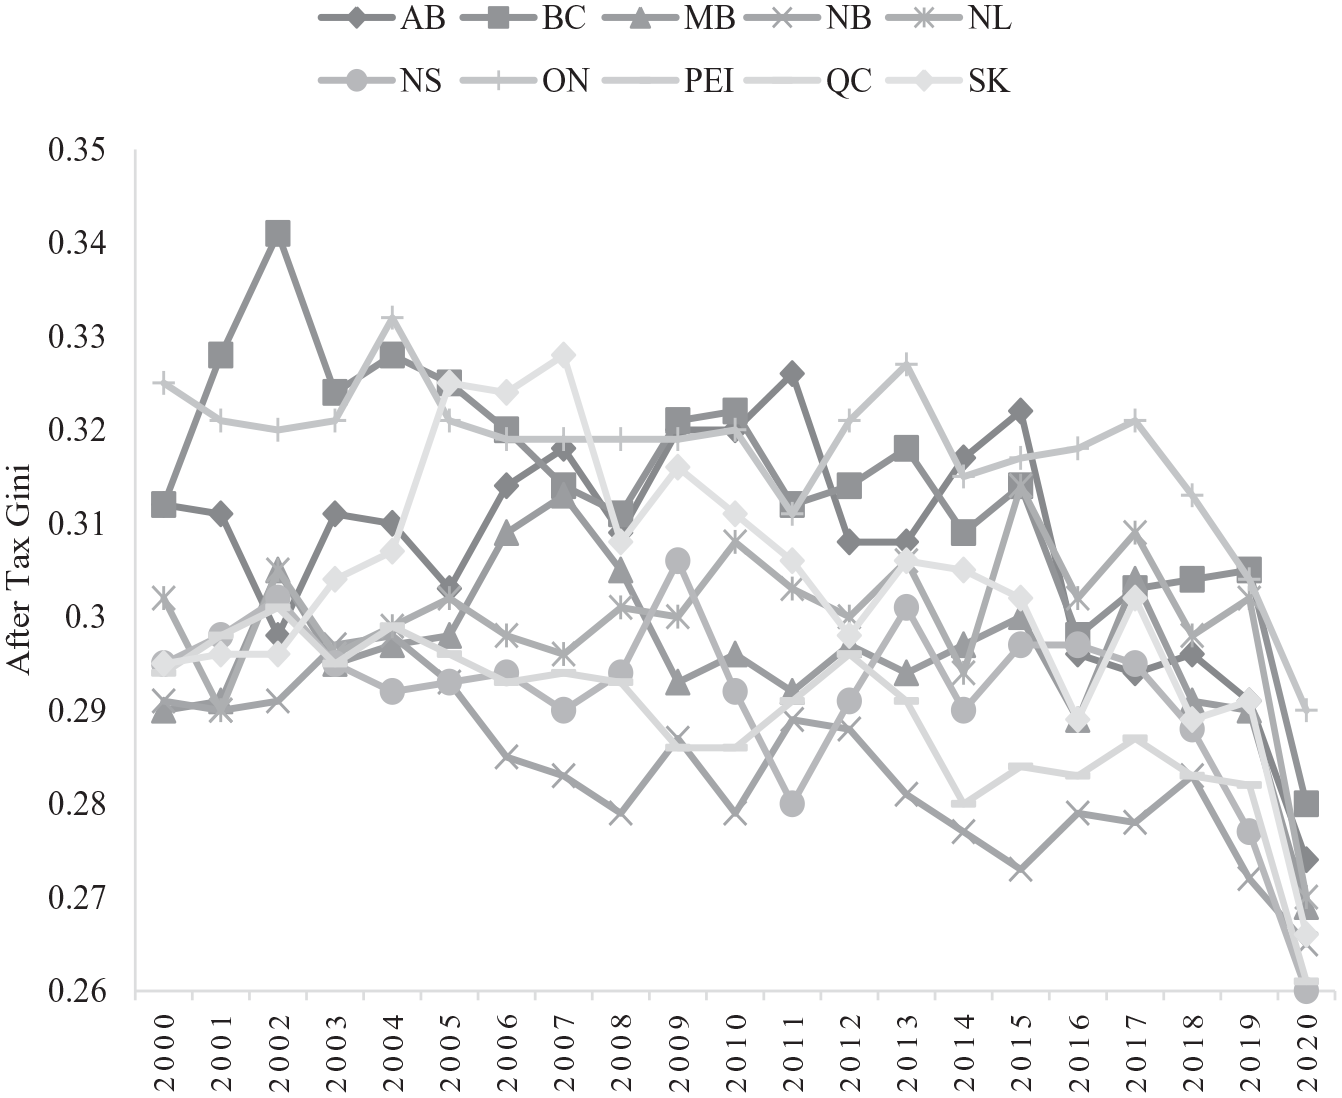
Gini coefficient, Canadian provinces: 2000–2020.
Figure 5 provides some preliminary, suggestive evidence on the connection between unionization and inequality. It is a cross section of provincial after-tax Gini coefficients and unionization rates with a simple trend line for the beginning and end years of our time period. In both years, provinces with higher unionization rates have more equal after-tax income distributions.
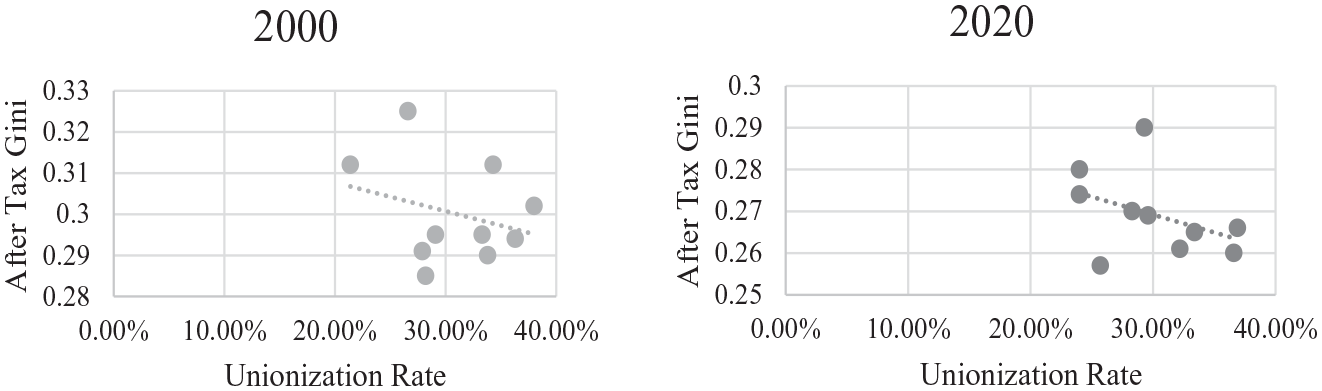
Gini coefficients and unionization rates in Canadian provinces: 2000 and 2020.
Figure 6 repeats the cross-sectional exercise for poverty and unionization rates. The poverty measure used is the low-income cut-off (LICO), which was the most commonly used measure of poverty during this period (the definition of the LICO and a comparison with the low-income measure can be found in the “Data and methodologies” section). The suggestive evidence on the connection between provincial unionization rates and poverty is much less obvious than was the case for inequality. In 2000, provinces with higher unionization rates also had higher poverty rates, while in 2020 there appears to be very little connection between the two measures. The following sections will investigate whether these visual trends pass a more rigorous econometric test.
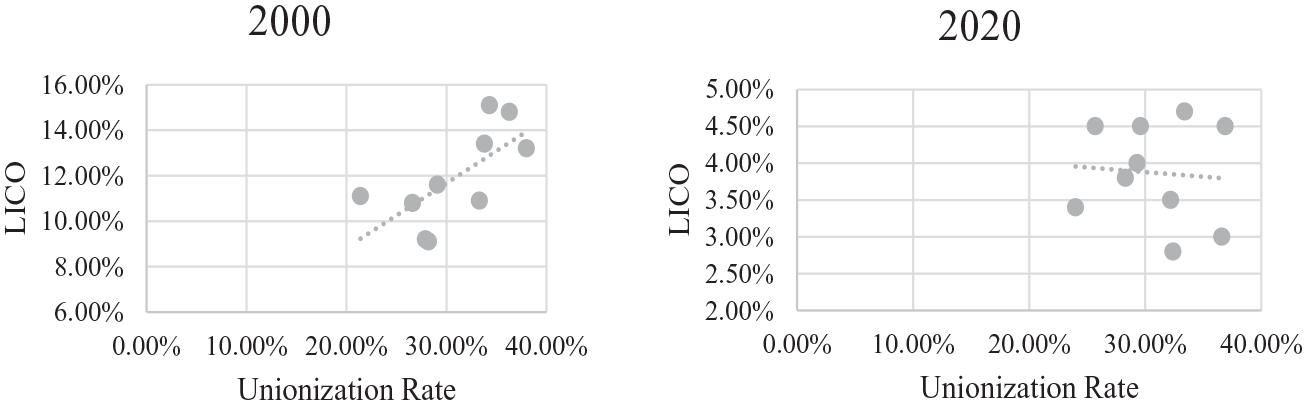
Poverty rates and unionization rates in Canadian provinces: 2000 and 2020.
Data and methodologies
The provincial data set used for our analysis includes data from 10 provinces and covers the period from 2000 to 2020. The 10 provinces are Alberta, British Columbia, Manitoba, New Brunswick, Newfoundland and Labrador, Nova Scotia, Ontario, Prince Edward Island, Québec, and Saskatchewan. Our data set includes 210 observations. Depending on the chosen lags, the models include anywhere between 190 and 200 observations. We use two different measures of inequality: the share of income of the top 1% (INEQ-TOP) and the Gini coefficient (GINI). These variables are widely used in the existing empirical literature to measure income inequality (see, for example, Ali 2022; Brown & Das 2023; Sehrawat & Giri 2015). To measure poverty, we use three different variables: the percent of the population below the LICO, the average income of the bottom decile (POV-BOTTOM) in 2020 constant dollars, and the percent of the population below the low-income measure (LIM). Historically, LICO has been the most commonly used definition of poverty in Canada. In Canadian literature, among others, Sen et al. (2011) and Wang and Dayanandan (2006) used LICO to measure poverty. However, the LICO is not a particularly intuitive measure. It estimates ‘an income threshold at which families are expected to spend 20 percentage points more than the average family on food, shelter and clothing’ (Statistics Canada 2016). LIM is easier to understand – it is when a family income is below 50% of the median – and is more commonly used internationally. All the three variables are estimated using after-tax income. Unfortunately, Statistics Canada does not release provincial-level market income poverty statistics (for either the LICO or the LIM). As a result, we are limited to an analysis of the impact of unionization on after-tax income. The strength of unions (UNION) is measured as the ratio between employees who are in unions and total employees. In a recent article, Das et al. (2023) used this variable to represent unionization. Another commonly employed estimate of unionization is collective bargaining coverage (see Brown & Das 2023; Das 2023) – the ratio of the labor force covered by a collective agreement to the total labor force. In the context of Canada, the difference between two metrics is small because almost all unionized workers are covered by collective agreements. In some European countries, like France, collective agreements cover nonunionized workers and, therefore, collective agreement coverage can be much higher than the unionization rate. In these cases, the distinction between the two measures is much more important.
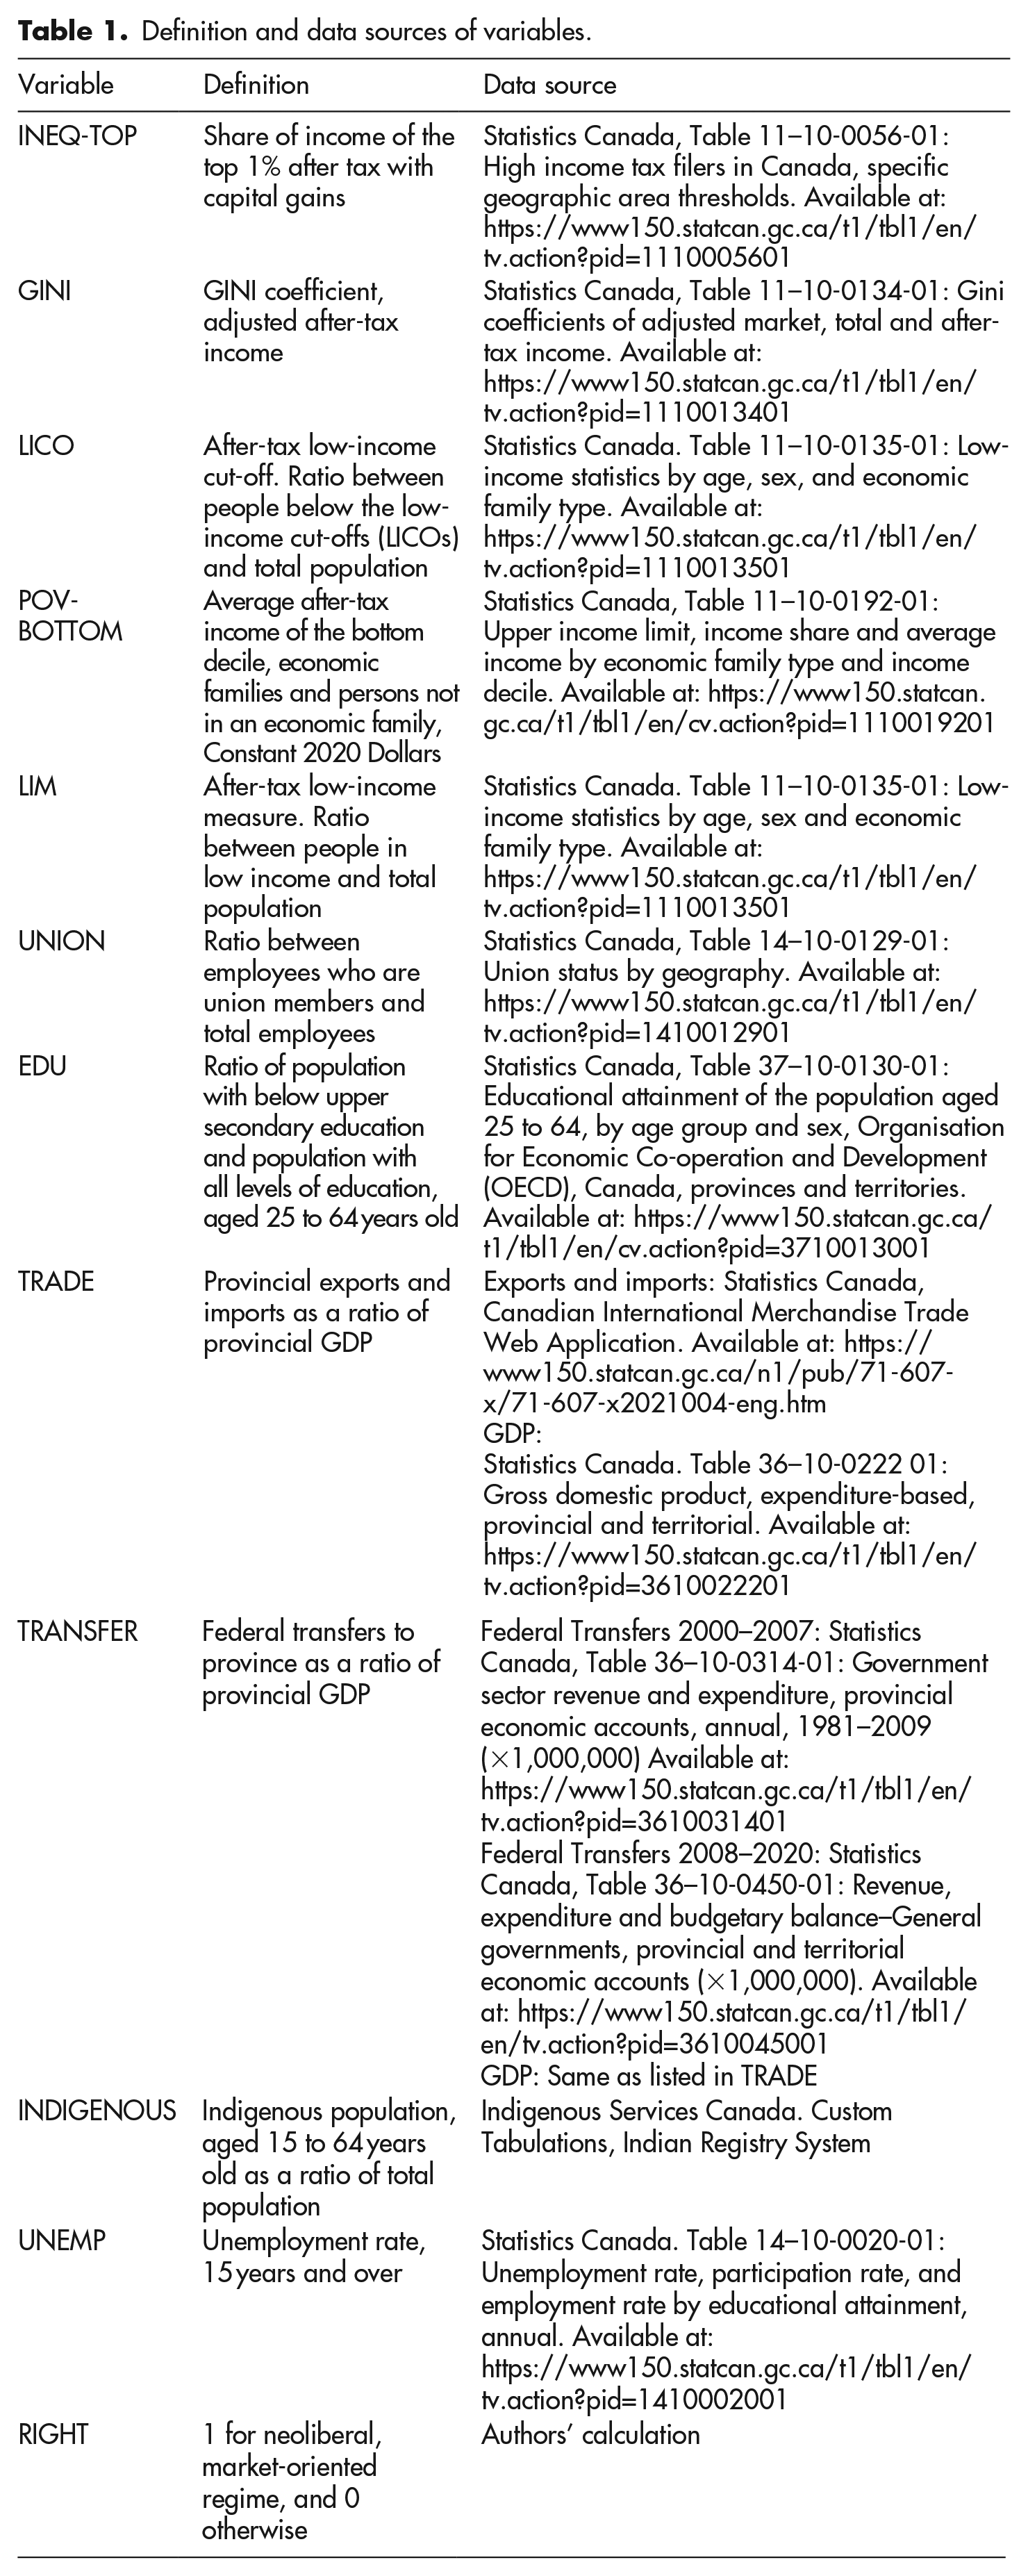
In both inequality and poverty equations, we account for the impact of several socio-economic factors that were found to be significant in influencing inequality and poverty in the literature. The ratio between the population with below upper secondary education and the population with all levels of education (EDU) is based on the theory of skill-biased technological change, which posits that income inequality has grown because those with higher levels of education are more complimentary with technology while those with lower rates of education will be replaced by technology (Acemoglu 1998; Baccaro 2011; Breau 2007; Hailemariam et al. 2021). TRADE is defined as the sum of international exports and imports as a ratio of gross domestic product (GDP). This variable is used to control for the degree to which provincial firms, and the workers in them, compete with firms and workers from other nations, which would suppress wages and increase inequality (Baccaro 2011; Breau 2007; Haddow 2014; Hailemariam et al. 2021; Scrimger 2020). The ratio of federal government transfers to GDP (TRANSFER) accounts for the fact that, in Canada, larger transfers from the federal government would give a provincial government more revenue, which it could potentially spend on either transfers to lower income households or equalizing public expenditures like well-funded public schools and universal health care (Breau 2007; Haddow 2014). Total Indigenous population aged 15 to 64 years old as a ratio of total population from the same age cohort (INDIGENOUS) controls for the fact that, due to the long and ongoing history of racism and colonialism, the Indigenous population has much lower incomes than the rest of Canada. The Indigenous population is distributed unevenly in Canadian provinces. A greater Indigenous population in a province would be expected to be associated with higher degrees of poverty and inequality. Empirical work in the United States on inequality and poverty has found the racial composition of the population to be an important factor (Akee et al. 2019). The rate of unemployment among the people who are 15 years and over (UNEMP) accounts for the fact that higher unemployment rates have a greater negative effect on workers, especially those lower income workers in more precarious jobs, than they do on capital and more secure workers (Breau 2007; Castells-Quintana et al. 2015; Farber et al. 2021; Haddow 2014; Scrimger 2020). To identify different political regimes and their potential impact on inequality and poverty policies, independent of union rates, we include a regime-specific dummy variable (RIGHT) in the data set (Haddow 2014; Scrimger 2020). When a province had a political party in power that supported more neoliberal, market-oriented policies, those years were assigned a value of 1, and otherwise 0. For example, the province of Alberta was governed by the Progressive Conservative Association of Alberta from 2000 to mid-2015 and the United Conservative Party from mid-2019. Therefore, these periods were assigned the value of 1. From mid-2015 to mid-2019, this province was governed by the Alberta New Democratic party, which is more likely to favor social welfare programs. Hence, we categorize the period 2015–2018 as 0. Table 1 presents the definition and data sources of the variables.
Definition and data sources of variables.
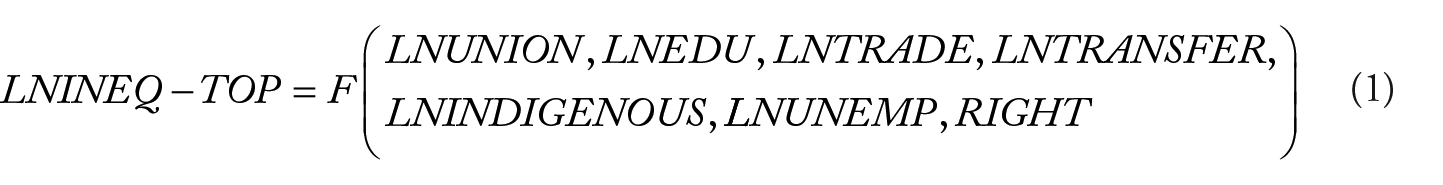
Before proceeding with regression analysis, we first convert INEQ-TOP, GINI, LICO, POV-BOTTOM, LIM, UNION, EDU, TRADE, TRANSFER, INDIGENOUS, and UNEMP using their logarithmic transformation and denote them as LNINQ-TOP, LNGINI, LNLICO, LNPOV-BOTTOM, LNLIM LNUNION, LNEDU, LNTRADE, LNTRANSFER, LNINDIGENOUS, and LNUNEMP, respectively. There are several reasons why we transformed the variables using their natural logarithms. First, log transformation linearizes relationships between variables. Second, logarithmic transformation can reduce the impact of outliers and bring those values closer to their means. Third, a logarithmic transformation of a ratio is affected equally when either the numerator or the denominator changes. Finally, since all variables in the long-run equation are transformed using natural logs, the coefficients of the independent variables can be explained using a percentage change.
LNINQ-TOP and LNGINI are treated as dependent variables in the inequality equations, and LNLICO, LNPOV-BOTTOM, and LNLIM are dependent variables in the poverty equations. The independent variables are LNUNION, LNEDU, LNTRADE, LNTRANSFER, LNINDIGENOUS, and LNUNEMP. Finally, the dummy variable RIGHT enters in all five equations in the short-run estimations. 2 The following two equations are used to measure the impact of unionization on different measures of inequality:

The equations that represent the effects of unionization on poverty are the following:
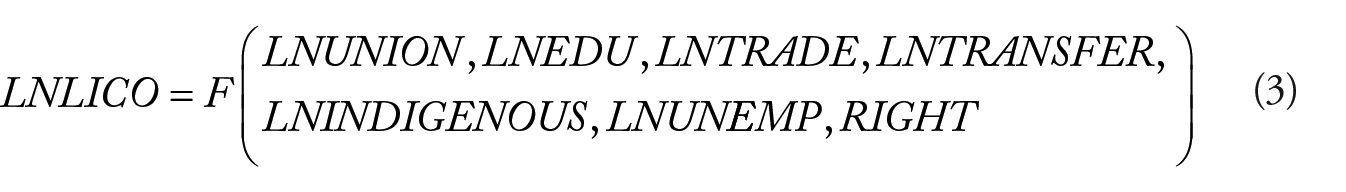
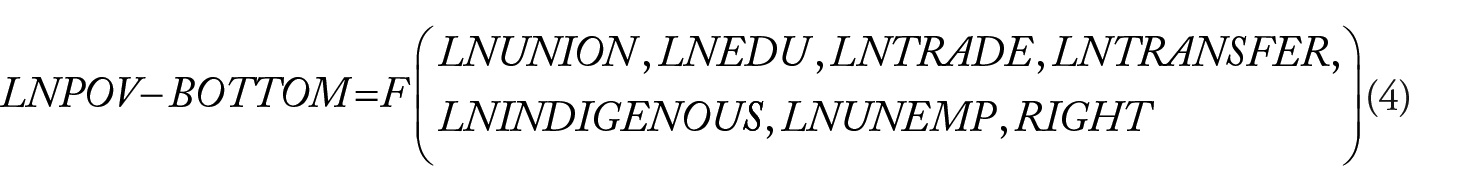
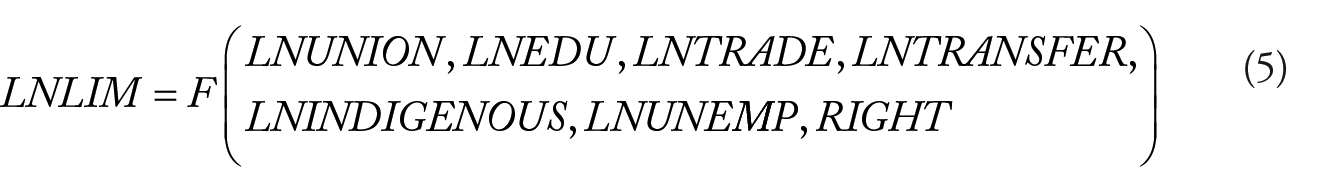
The data set used in the analysis contains 21 years of observations. Because of the length of the period, it is imperative to examine whether the variables follow a unit root process. In Appendix 1, we discuss the unit root test and present the results from this test. Based on the unit root results, we use the pooled mean group (PMG) technique, proposed by Pesaran et al. (1999), to estimate equations (1) to (5). We provide the details of this method in Appendix 2.
Results
Table 2 presents the results from estimating the inequality equations that are presented as equations (1) and (2). Due to space constraints, we limit our discussion on the error correction term and the political-regime dummy variable in the short-run equation. Other results from this equation are available upon request. In both short-run error correction equations, the error correction term is negative and statistically significant. This implies that any deviation from the long-run equilibrium is corrected within a certain period. Therefore, both estimated inequality models converge to the long-run equilibrium. Among the short-run variables, RIGHT is not statistically significant. This suggests that, statistically speaking, political regimes do not have any significant impact on income inequality. This is consistent with what has been found in the existing literature. Das et al. (2020) noted that, in the Canadian provinces of British Columbia and Manitoba, the political-regime dummy did not have any statistically significant impact on income inequality.
Inequality: long-run results from the pooled mean group estimation.
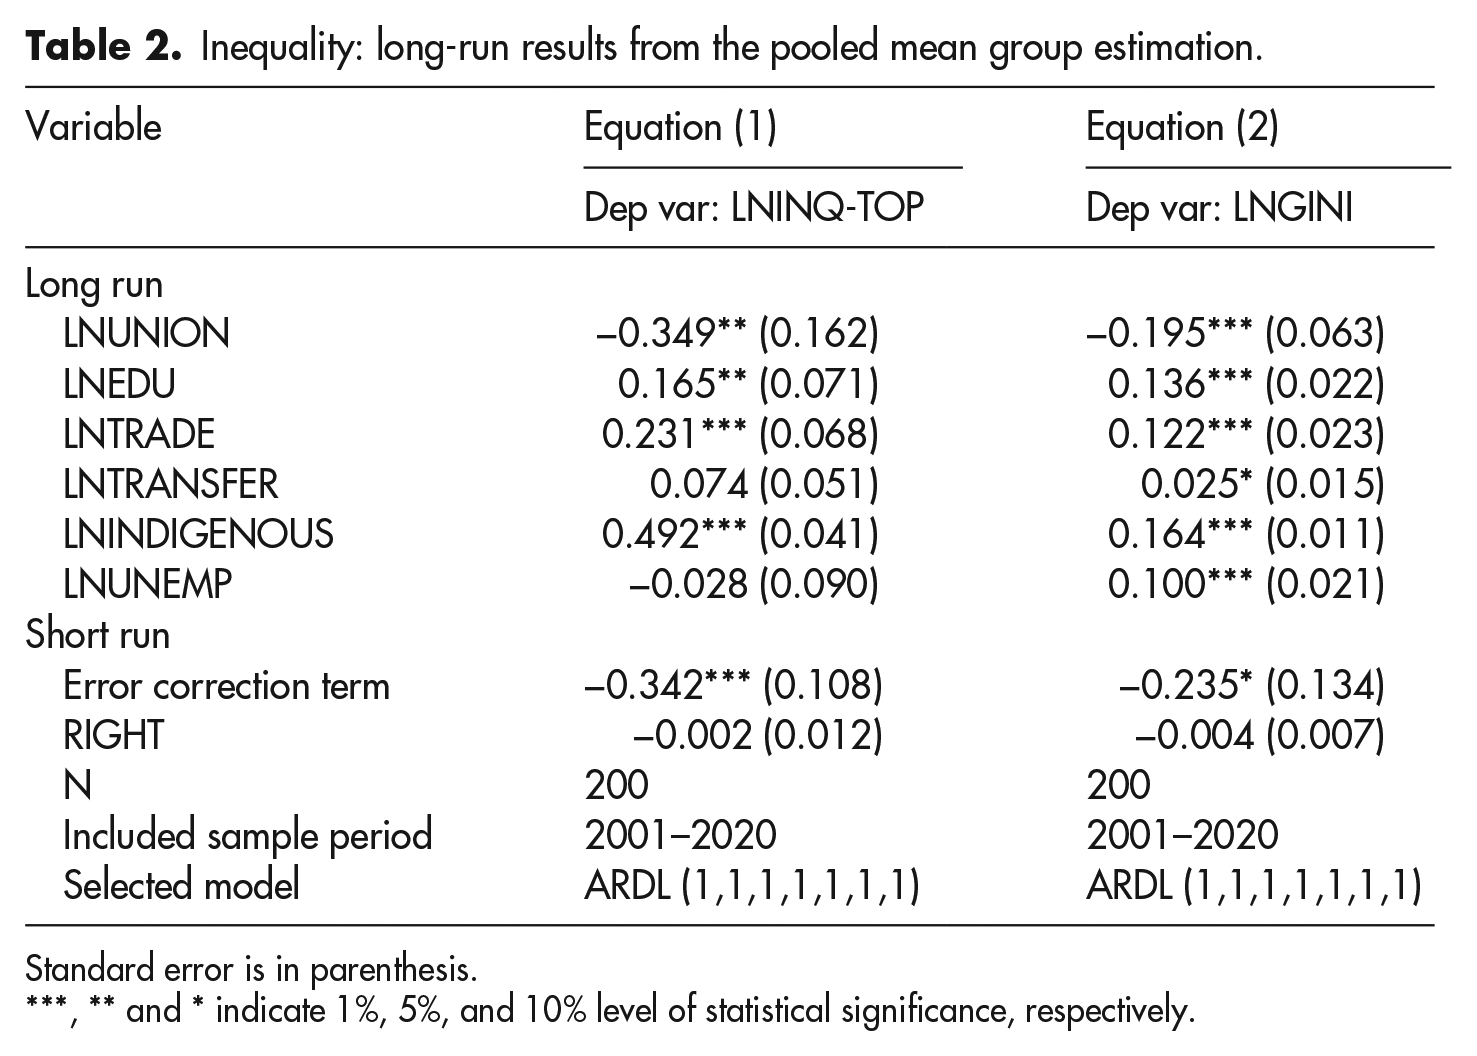
Standard error is in parenthesis.
** and * indicate 1%, 5%, and 10% level of statistical significance, respectively.
Our goal is to understand how unionization and the other control variables are dynamically associated with income inequality in the long run. Therefore, we mostly focus on the results from estimating the long-run equations. The coefficients of LNUNION are negative and statistically significant at the 5% level in equation (1) and 1% level in equation (2). In the first equation, the size of the coefficient suggests that a 1% increase in the rate of unionization in Canada reduces the share of income of the top 1% by approximately 0.35%. Similarly, in equation (2), a 1% increase in the rate of unionization tends to reduce the Gini coefficient by almost 0.2%. The negative association between unionization and income inequality in Canada was previously established by Brown and Das (2023), who used a time-series data set. Among the other control variables, increased international trade generally increases income inequality, consistent with the theory that globalization drives down the wages of workers in high wage regions. An increase in the Indigenous population compared to the total population is associated with an increase in both the income share of the top 1% and the Gini coefficient. Transfers from the federal government are positively associated with the Gini coefficient at the 10% level of statistical significance. However, the coefficient of this variable is statistically insignificant when the income share of the top 1% is treated as the dependent variable. Similarly, an increase in the unemployment rate tends to increase the Gini coefficient but does not seem to have any statistically significant impact on the income share of the top 1%. Coefficients of LNEDU are positive and statistically significant in both equations. In other words, as the size of the population of unskilled workers rises, both the income share of the top 1% and Gini coefficient rise.
Moving our attention to unions’ impact on poverty, we report the results from estimating equations (3), (4), and (5) in Table 3. The error correction term is always negative and statistically significant. The absolute value of the coefficient is 0.45 in equation (3), 0.49 in equation (4), and 0.38 in equation (5). This suggests that almost 40% to 50% of any deviation from the long-run equilibrium is corrected within the first year. As before, the political-regime variable (RIGHT) is not statistically significant in any of the three equations – a result consistent with the previous findings of Das et al. (2020). Among the long-run-level variables, LNUNION does not have any statistically significant impact on poverty irrespective of what measure is used to define poverty. A possible explanation for this is that unions tend not to represent workers at the lower ends of the income spectrum. In part, this can be viewed as a success of the union movement in increasing the wages of their members. However, it also speaks to the difficulties unions have in organizing low wage workers, including the strong resistance of low wage employers to unionization drives. Almost all the other variables have the predicted sign: an increased population with less education, international trade, Indigenous population and unemployment increase poverty rates (equations (3) and (5)) and decrease the average income of the bottom 10% (equation (4)). Federal transfers are the only exception. We speculate that increased federal transfers might allow provinces to increase assistance to the poor, but although increased federal transfers are associated with a lower percentage of the population below the LICO (as predicted), it is also associated with a lower average income for those in the bottom 10% of the income distribution. A possible explanation for this might be that lower incomes in a province will increase federal transfers, and those transfers might lift some people, just below the poverty line above it. However, they might also not be reaching those with the lowest incomes. This variable is found to be statistically insignificant in equation (5).
Poverty: long-run results from the pooled mean group estimation.
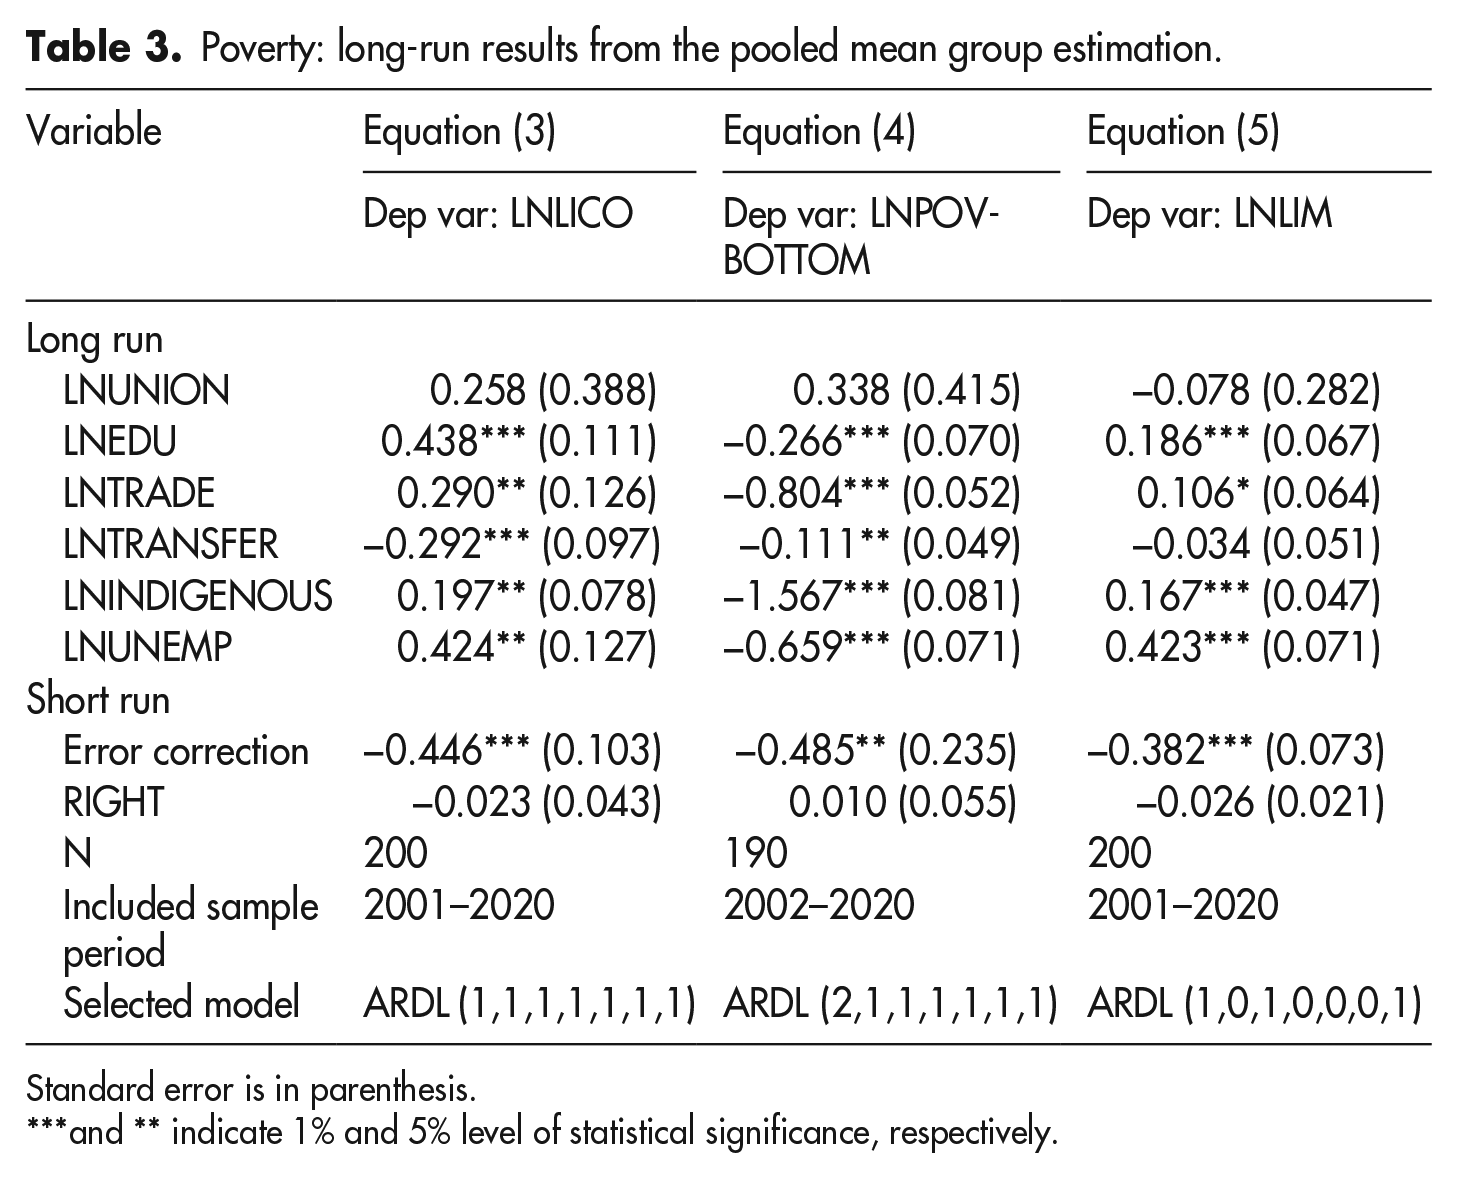
Standard error is in parenthesis.
and ** indicate 1% and 5% level of statistical significance, respectively.
In summary, we argue that the rate of unionization is negatively associated with income inequality in Canada. However, we were unable to establish any statistical association between the rate of unionization and poverty. These results are robust in a sense that the impact of unionization rate on both income inequality and poverty remains unchanged irrespective of how inequality and poverty are measured.
Discussion
Of Therborn’s three types – vitality, existential, and resource – this article most obviously focuses on resource equality, although, as Therborn noted, resource equality is intimately linked to both vital and existential equality. Resource equality not only focuses on the commodified resources differentially available to people based on their income and wealth but the extent to which resources can be accessed independent of income and wealth, such as the right to vote or free universal programs. In the conflict over both how income and wealth are going to be distributed between capital and labor and the extent to which income and wealth will determine access to resources, unions can potentially act as an equalizing mechanism in society through their roles in both collective bargaining and in the political process. Historically, they have been crucial in extending the right to vote beyond the propertied classes and the expansion of the welfare state that was partly responsible for the great equalization in the post-War period in Europe and North America. Yet, the extent to which they fulfill this potential, particularly in the current political environment, is a more open question. Unions operate amid varied constraints over time and in different places – from the extent of employer and/or state, policing and persecution, to variation in place-specific regulation surrounding the right to organize, to different rules concerning how unions can operate in the political system. Unions also face varied political structures that can either facilitate or impede the ability of business and its allies to mobilize against equality-increasing policies. An obvious example of this is the Citizen’s United ruling in the United States that dramatically expanded the ability of corporations to use finance to influence political outcomes. This might explain why, although past empirical results predominantly find that unions are associated with greater income equality, this result is far from universal. The findings on poverty are even less unanimous.
In the Canadian context, unionization rates have generally declined over the period of this study, mirroring the decline in many other countries. However, there is considerable variation on this trend between provinces, caused, in part, by the fact that provinces have discretion over many of the labor market rules that impact union formation, collective bargaining strength, and even the ability of different groups in society to influence the political process that determines these rules. These differences make a subnational study of Canadian provinces as relevant cross-national studies.
Compared with the three Canadian interprovincial empirical studies that this study most closely follows, this study contradicts Breau’s (2007) results on the Gini but agrees with Haddow (2014) and Scrimger (2020) in finding that unions increase equality. Although it uses less recent data, Breau’s dependent variable, total income (although without taxes) is closer to the after-tax measure used in this article than the other two studies. Haddow (2014) also found that unions had an impact on reducing poverty that our empirical results failed to confirm.
The empirical results on inequality would suggest that unions act as an important equality creating institution in society, at least as measured by the Gini and income share of the richest income earners. An obvious policy implication from this is that rules making it easier for unions to organize and collectively bargain should be implemented. However, it also suggests that those at the top ends of the income distribution have a material interest in resisting this change. The lack of impact of unionization rates on poverty is predictable from a collective bargaining standpoint, given that unions rarely represent low wage workers in Canada. This is not a fact independent of the rules around unionization and employer hostility toward union organizing in low wage occupations. However, it also might suggest that unions have not been particularly active around campaigning for anti-poverty measures.
The results in this article suggest some avenues for future research. Although using the after-tax measure for income equality and poverty is important, in that it captures both the labor market and political influence of unions, it cannot distinguish between which of these two impacts is operating. Previous research by Haddow and Scrimger found that both were significant, but to what degree is uncertain. Furthermore, the specific measures for inequality and poverty in this study are widely utilized, but far from the only ones available. It would be interesting to determine whether alternative measures for inequality and poverty would yield similar results. Finally, we have not distinguished between unionization in the public and private sectors. The public sector in Canada has a much higher unionization rate than the private sector. It would be interesting to see whether there was any difference between the impacts of changes to public- and private-sector unionization rates on inequality and poverty.
Footnotes
Appendix 1
Appendix 2
Funding
The author(s) disclosed receipt of the following financial support for the research, authorship, and/or publication of this article: The authors received funding for this article from the Social Sciences and Humanities Research Council funded Manitoba Research Alliance and the University of Manitoba Undergraduate Research Award.