
Abstract
Various types of control methods are utilized in wind turbines to obtain the optimal amount of power from wind. The turbine dynamics are required in said methods, and the wind speed is a critical component of the analysis. However, the stochastic nature of wind means that wind speed sensor signals are noisy. This paper proposes the utilization of a radial basis function neural network (RBFNN) based filter to process the signal, by training the network with a simulated wind signal. The network is differentiated from a traditional filter in that the number of neurons and the “learning rate” of the network dictate the properties of the filtered signal. The information flow in the network consists of the signal to be processed as the input, the which is then used as an argument in a radial basis function (which determines the “distance” of each value in the input from a particular preset point), and then it multiplied by a weight. The learning rate is obtained from a novel equation that is proposed in the paper. The results showed that the proposed scheme has versatility in terms of noise removal and signal smoothing, and if required, can viably match performance with a Butterworth filter. Furthermore, live training and adaptability also serve as advantages over a classic filter. Three “modes” of processing the signal are determined based on choosing certain ranges of values for parameters which comprise the RBFNN (number of neurons used and learning rate), and the control designer can choose which one to implement based on performance requirements.
Introduction
A neural network is a generalized term for a configuration where units are interconnected and are able to communicate with each other to perform some task. Such systems are mathematical models that utilize nodes, generally referred to as “neurons” or “nodes,” that take one piece of information, “activate” it, and pass the information to the next neuron in the chain. The nodes themselves have fixed “activation functions.” However, the connections between the nodes can have variable weights. It is the nature of the activation functions, the weights, and the number of hidden layers (layers between the input and the output) that dictates the type of neural network it is. Here, the interest lies in using radial basis functions as the activation functions. Such neural networks are appropriately named Radial Basis Function Neural Networks (RBFNN). Radial basis functions use exponentials and are inherently non-linear. As such, the RBFNN is sometimes referred to as a universal approximator as it can replicate any inputs with arbitrary precision. For functions with highly non-linear dynamics, input-output mapping algorithms that use RBFNNs can be developed that can accurately reproduce said dynamics. Unlike other types of neural network which have multiple hidden layers (Multilayer Perception Networks), a RBFNN only has one hidden layer composed of nodes that utilize the radial basis activation function.
A technology that relies critically on an accurate reading of wind speed is a controller for wind turbines. The developments in this paper were performed with the intent of application to this technology. The controller can actuate certain elements of the wind turbine, such as blade pitch, yaw, and generator torque. This actuation requires usage of electromechanical components that are sensitive to fatigue. It is desirable to increase durability of these components by modulating the controller response. A wind speed sensor produces a noisy signal due to the stochastic nature of wind. Using this signal directly would produce reference values which would jolt the actuators with high frequency, contributing to their fatigue. As such, a method to obtain a wind speed signal that has variability on the amount of noise is required for maximizing the durability of these components.
This paper uses an RBFNN to estimate wind speed in real-time based on simulated sensor data to bypass modeling the relevant wind turbine dynamics. This is done by utilizing a RBFNN as a filter on the sensor data. The purpose of said estimation is to feed to a controller a wind signal with certain characteristics, such as a level of noise that would increase the durability of the actuators while still providing a good estimate of the wind spped. A RBFNN is utilized because the flexibility of the parameters of the RBFNN allow the filtered signal to have said desired characteristics. The result is a controller response that would account for the durability of electromechanical actuators on the wind turbine as well as the over-all performance of the turbine in extracting energy from the wind.
Materials and methods
Literature review
Stemming from the work of Powell (1987), Broomhead and Lowe (1988) introduced the idea of utilizing radial basis functions for machine learning purposes. Much of the development of this method has remained more or less the same at a basic level and the descriptions given in the following sessions are almost identical to those given in Powell (1987). When it comes to wind turbines (Kaur et al., 2014; Qiao et al., 2008; Tian et al., 2011), use an RBFNN for approximating highly non-linear dynamics of a turbine itself (Qiao et al., 2008). uses input-output mapping algorithms to train a RBFNN to obtain the wind speed by approximating the inverse of the function

where
There is also application of RBFNN to predict wind speeds for use in weather models, as reported in (Chunlin et al., 2017; Sideratos and Hatziargyriou, 2006; Silva et al., 2006). The centers of the hidden layers in the RBFNN are determined by K-means clustering with addition of Recursive Least Squares in Silva et al. (2006) to obtain relatively acceptable errors. For sample rates that are not fixed (unlike what is presented in this paper), K-means clustering is preferable at finding the proper centers for the neural network (Sideratos and Hatziargyriou, 2006). uses an RBFNN and compares it to existing algorithms, with a reported improvement range of approximately 50% (Chunlin et al., 2017). combines a back-propagation neural network and an RBFNN to improve results compared to each alone in wind speed prediction. With these texts, it is notable that there are a myriad of permutations in the neural network methods and they are sufficient for application in wind speed estimation when it comes to weather models. While this particular application showcases the scope of applicability of neural networks, weather models cannot be utilized for wind turbine controllers. Additionally, the rate at which the wind speed is obtained in the literature is far below what is required for proper controller response. Regardless, the methods used are comparable to the method developed herein and the final product is the wind speed. However, changes to the approach are required so that the result obtained is beneficial to a control designer, for whom a proper wind speed signal is critical to achieve desired performance.
Background
The development of a RBFNN has a largely defined procedure, as outlined in Liu (2015). The following sections are an overview of the procedure, and present modifications as necessary. While there are many other types of neural networks that exist, a RBFNN is chosen due to lack of complexity because there is only one hidden layer. This also reduces the computer power required for calculations. Additionally, the method developed can be noted for its ease of implementation in coding. Furthermore, other types of filters are not used because of the previously mentioned versatility of the RBFNN.
Radial basis function
A radial basis function is a function whose output is based solely on the distance of the input from a particular point. While there are many choices for radial basis functions, a Gaussian is suitable for the application of wind speed estimation due to its ease of implementation. As shown in Figure 1 below, the Gaussian function has a peak at x = 0 and is an exponential decrease to 0 everywhere else. Thus any input value has a result based on how far it is from some particular point in the output space (this point can be decided to be the origin of the function with no functional drawbacks.)
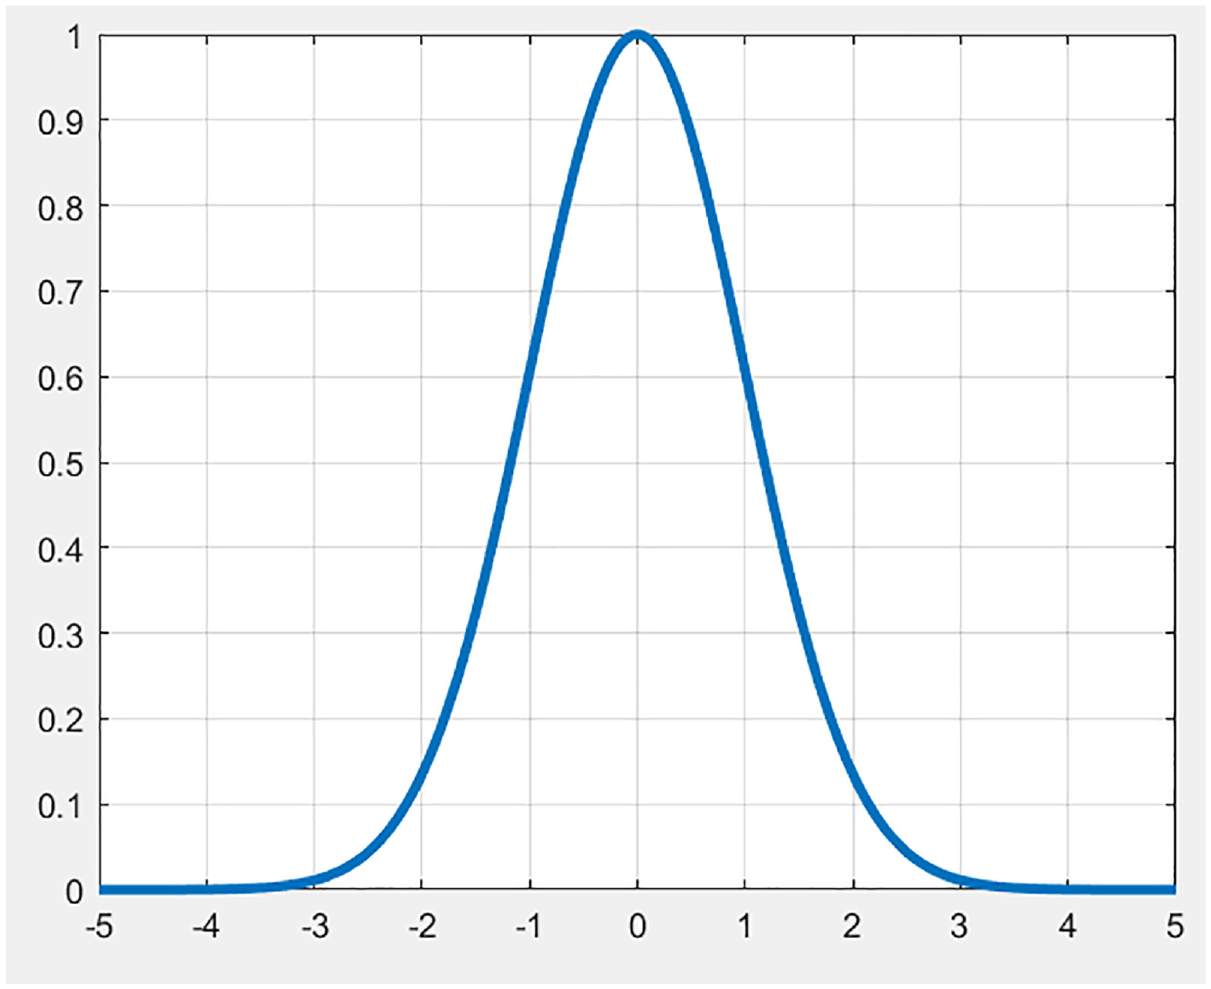
Plot of a Gaussian function.
The Gaussian function itself is the following:

Where μ is the center of the function (0 in Figure 1), and σ is the standard deviation. Utilizing the
Radial basis function neural network
A overview map of a RBFNN has the structure shown in Figure 2.
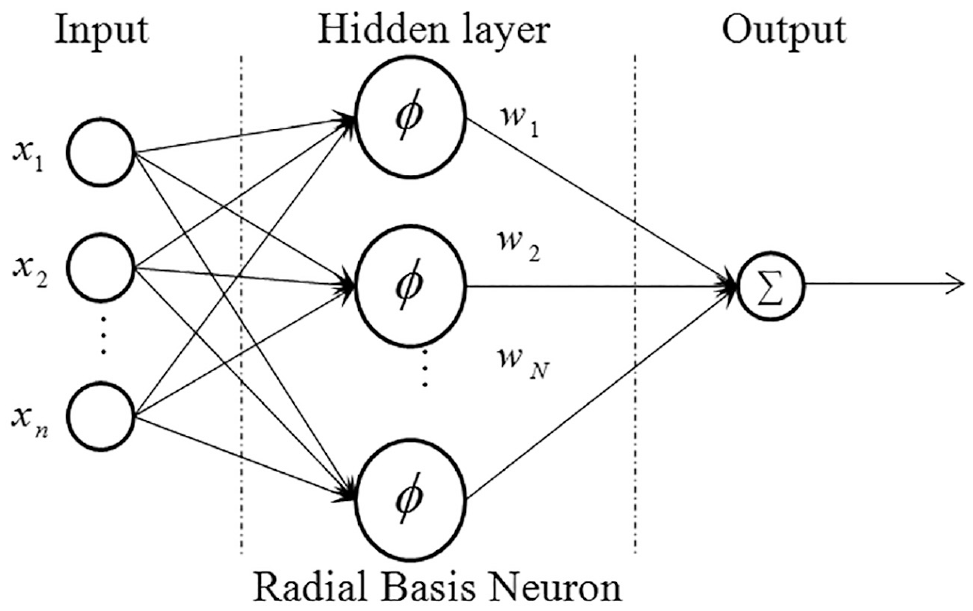
RBFNN layer structure.
Neural networks are characterized by the fact that they require training to perform their function. Generally, the more training data there is, the better the network performs, although over-training can become an issue wherein the unwanted frequencies are introduced back into the output signal. Regardless, the output is inherently dependent on the training data. Thus, this data must be incorporated in the network design. The input layer has n-dimensional input data. Each of these is sent to each node in the hidden layer. Assuming just one output, it is the weighted sum of all of the outputs of the hidden layer. Each of the ϕ in the hidden layer is the activation function. As stated previously, this is the Gaussian function. According to its definition, two properties are still required before it can be activated, μ and σ.
For wind speed estimation, the training data is one dimensional and the sample rate is uniform. As such, the centers of the Gaussians can be selected randomly. Each node thus gets one randomly center from the vector

Where
Finally, the output weights must be determined. The output of the neural network can be denoted to be the following equation:

With each element in the x vector propagating through out the entire network one at a time, the equation above can be rearranged to a matrix form as shown below, assuming c elements in the x vector. However, obtaining the weights means that the network output must be as close as possible to the training output:

As stated before, the left-most matrix here is known as the interpolation matrix. Reducing it to a compact form:

Obtaining the weights then must be a simple matter of inverting the interpolation matrix and multiplying it by the output vector on the right hand side. However, unless c = H, as is almost always the case, inversion is not directly possible as the matrix is not square. As such, a pseudoinverse can be utilized:

This allows a reasonably reliable way to calculate the weights in a batch formulation. There are still limitations to this method, namely the size of the training data and invertibility of
As such there needs to be a recursive way to obtain the weights. A technique known as back-propagation is used extensively in neural network research to modify weights across multiple layers. For application to RBFNNs, it is straightforward as only one layer of weights must be determined. This involves a gradient descent approach to obtain the weights at each time step. A quadratic cost function can be designed as follows, which outlines the error between the actual output and the network output (denoted as z):

This cost function must be minimized as it is the error between the network and the training output. The gradient descent equation is then the following, with

The parameter η is known as the learning rate and is a critical value to be tuned to obtain the desired results. If this value is too large, the weights will increase exponentially and destabilize the network. If it is too small, the network will be untrained. Typically, a value of 0.01 is first used to determine how well the network performs. It became evident that this value was unable to stay effective for a wide range of neurons and sample rates. With an increase in neurons, the training data was over-fit and noise would effectively be reintroduced. With an increase in the sample rate the frequency of the network response would proportionately increase. A reduction in the learning rate as the neurons increased and an increase as the sample rate increased was shown to be effective at counter-acting unwanted response noise as a result of changing the properties of the network. As such, the following novel equation is proposed:

Where a is the sample rate, H is the number of neurons, and λ is a correction constant that is most effective when equal to 20 for this particular application. This implies that there is further tuning to be performed, although 20 has demonstrated to be reliable for a wide range of neurons and sample rates.
Results
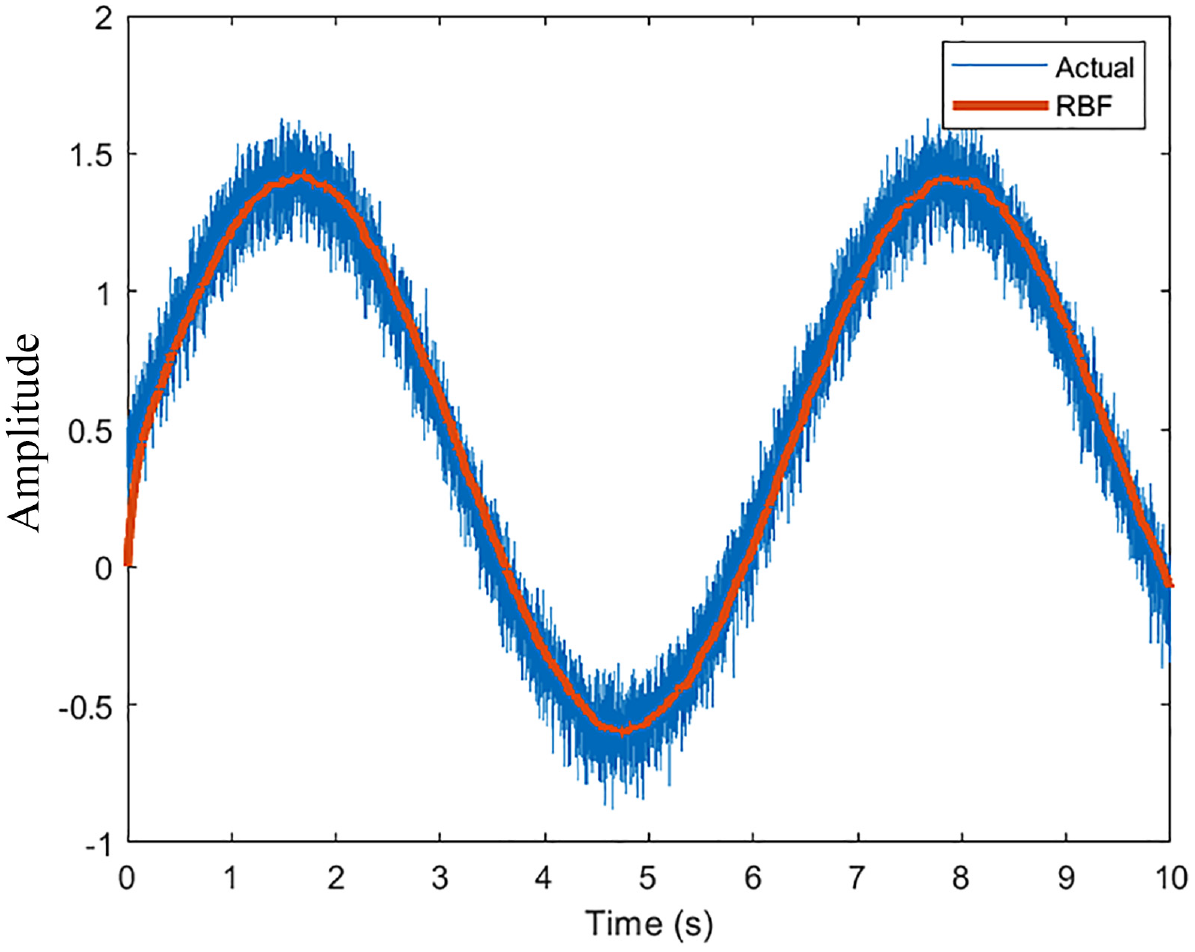
As a preliminary result, a sinusoid input with Weibull noise was used as training data to gage the performance of the network. The resultant graph is shown in Figure 3. With 10 neurons and a sample rate of 100 Hz, the results show that the network can reproduce the input wave. There is a noticeable delay in the network output and the actual output as the network adjusts weights recursively. The initial guess of the weights (0) can be seen as the network stars from the origin. Increasing the neurons to 100 produces a smoother output as expected (Figure 4). Increasing the sample rate to 1000 Hz with 10 neurons produces a noise eliminating signal that is most evident (Figure 5).
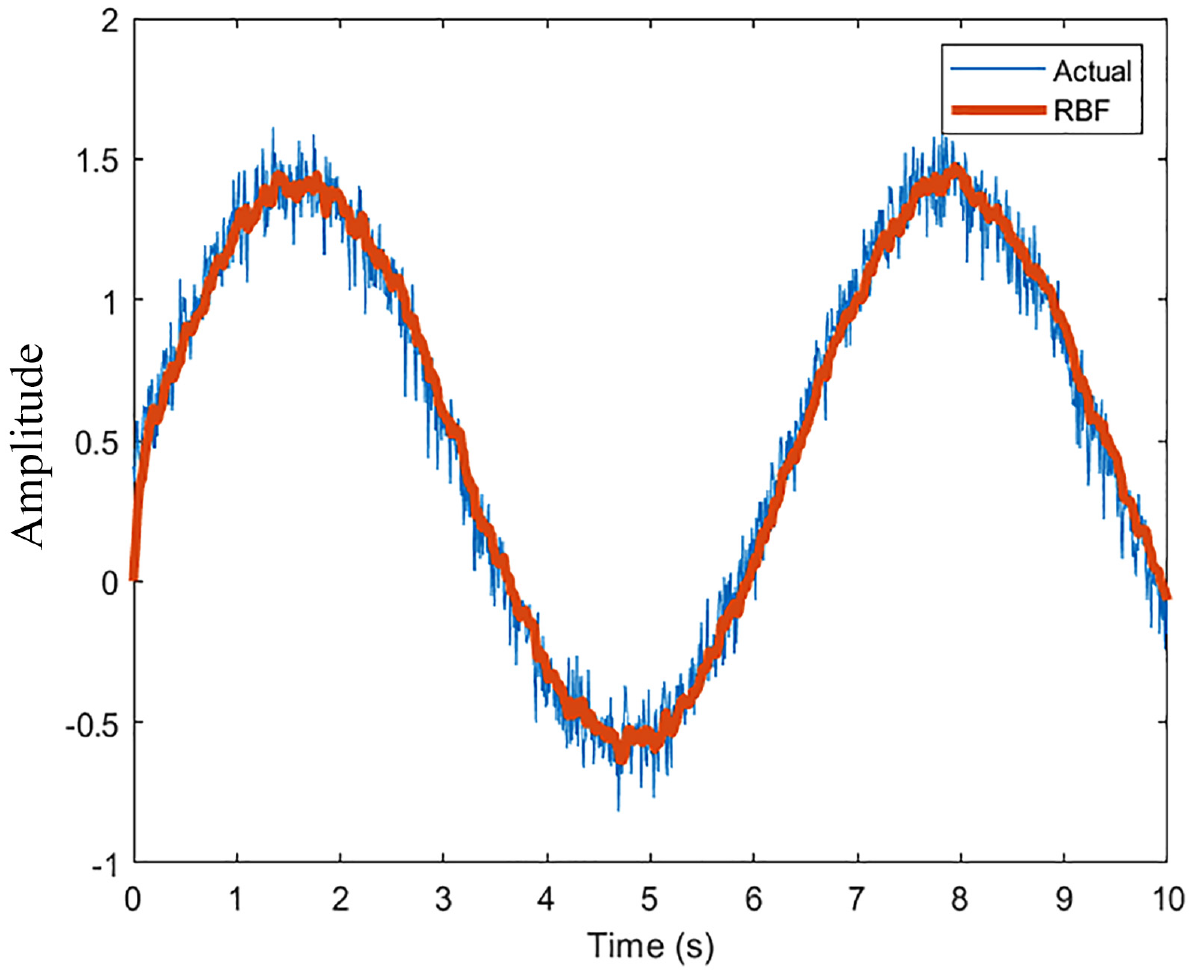
RBFNN performance (10 Neurons, 100 Hz).
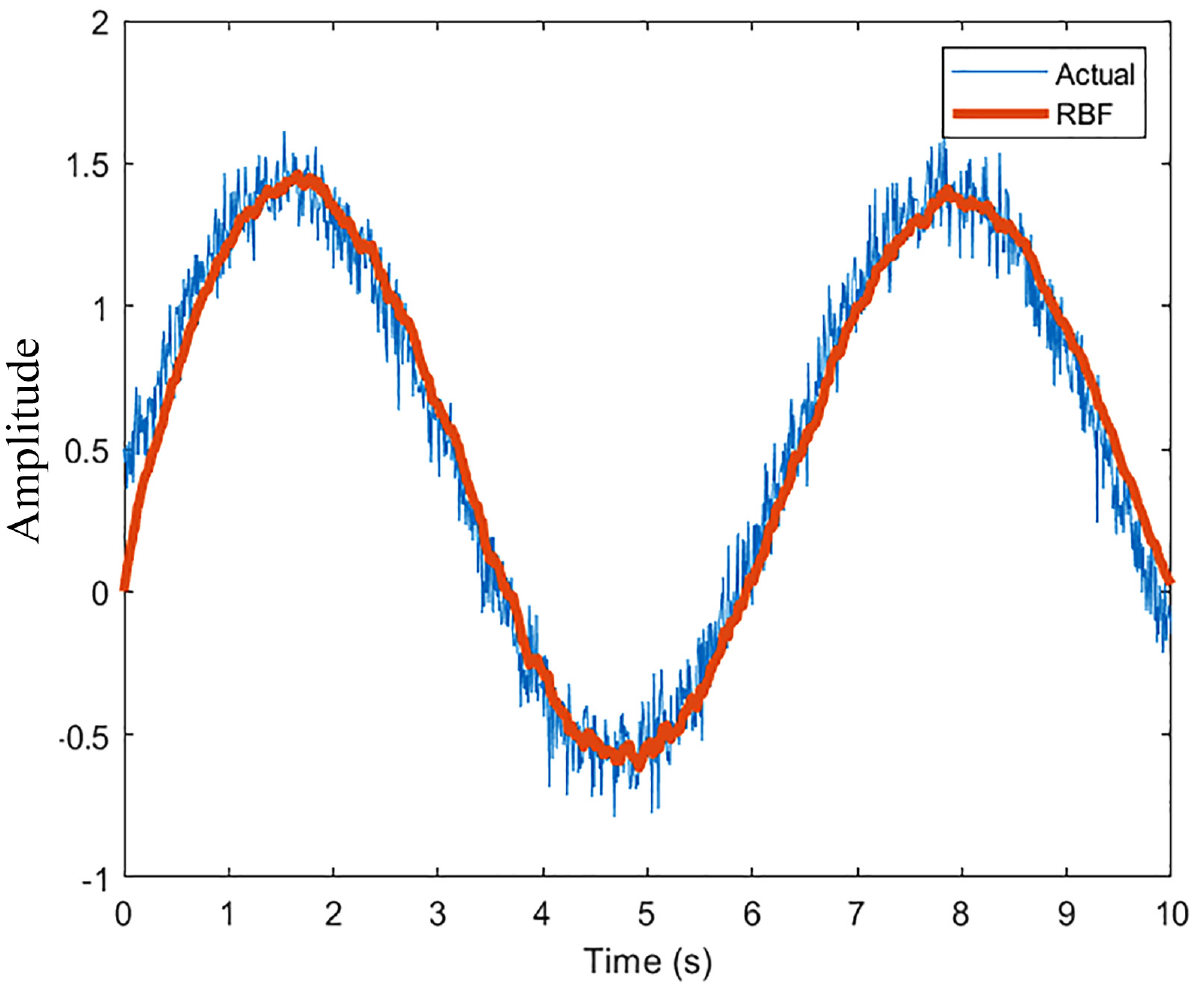
RBFNN performance (100 Neurons, 100 Hz).
RBFNN performance (10 Neurons, 1000 Hz).
The high frequency nature of the training signal ensures that the local gradient descent is most effective at finding the best weights to suit the training signal. However, it must be noted that despite the fact that the gradient descent is designed to minimize the cost function, the calculation nonetheless has a marginal error that prevents it from matching the input signal exactly. This is because the weights are calculated at each time step and are an accumulation of previous weights and errors.
Changing the training signal from a sinusoid to a square is a reasonably better way at testing the non-linear filtering capabilities of the network. The following are the results of doing so with identical parameters are the preliminary results.
The results are qualitatively identical to the sinusoid. Both the cases with 10 and 100 neurons behave as expected with greater elimination in noise with increasing the neurons as shown in Figures 6 and 7. The estimation, again, is favorable with a higher sample rate as shown in Figure 8. A desirable outcome of this analysis is the fact that the network can effectively keep up with rapid changes in the simulated wind speeds. The first drop from 1.5
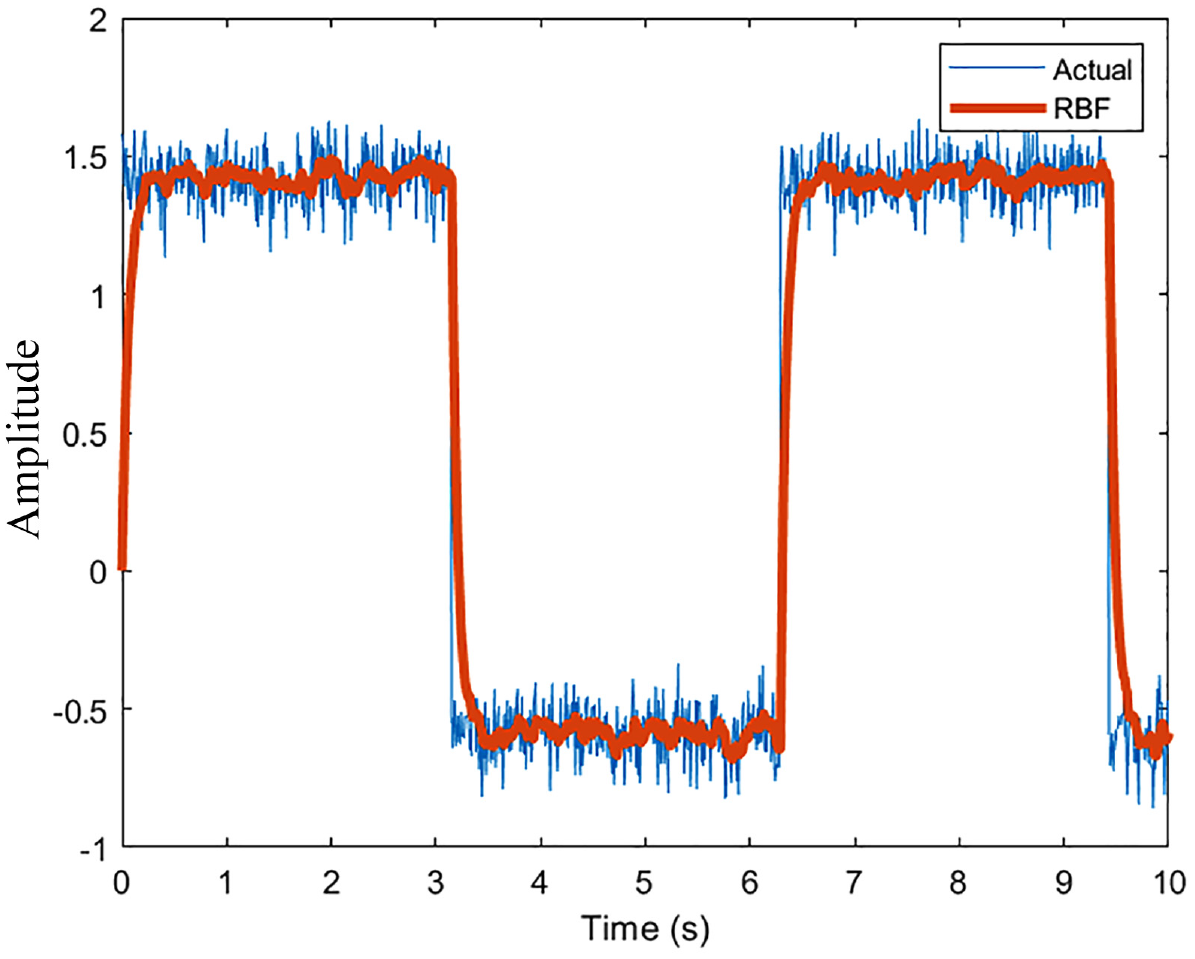
RBFNN performance (10 Neurons, 100 Hz).
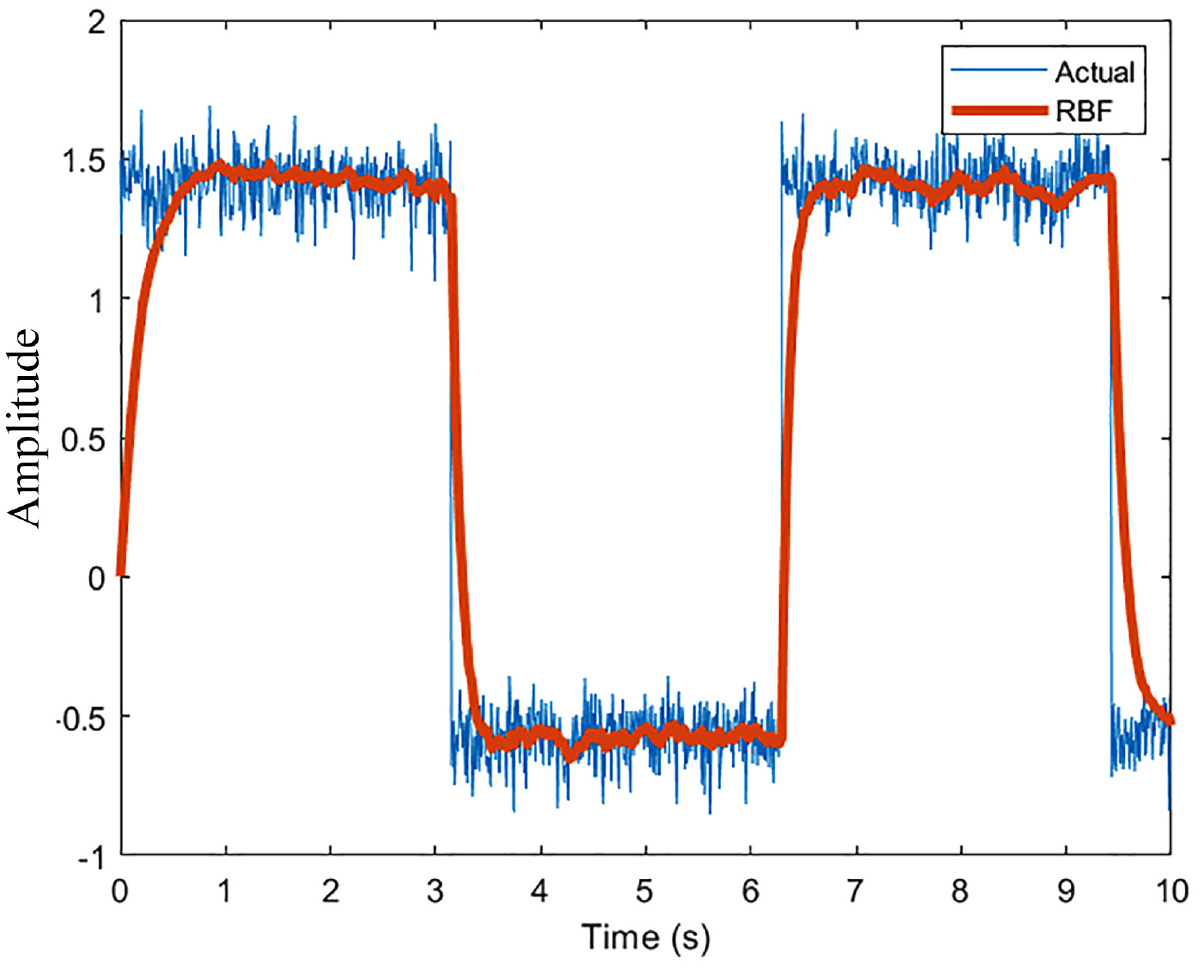
RBFNN performance (100 Neurons, 100 Hz).
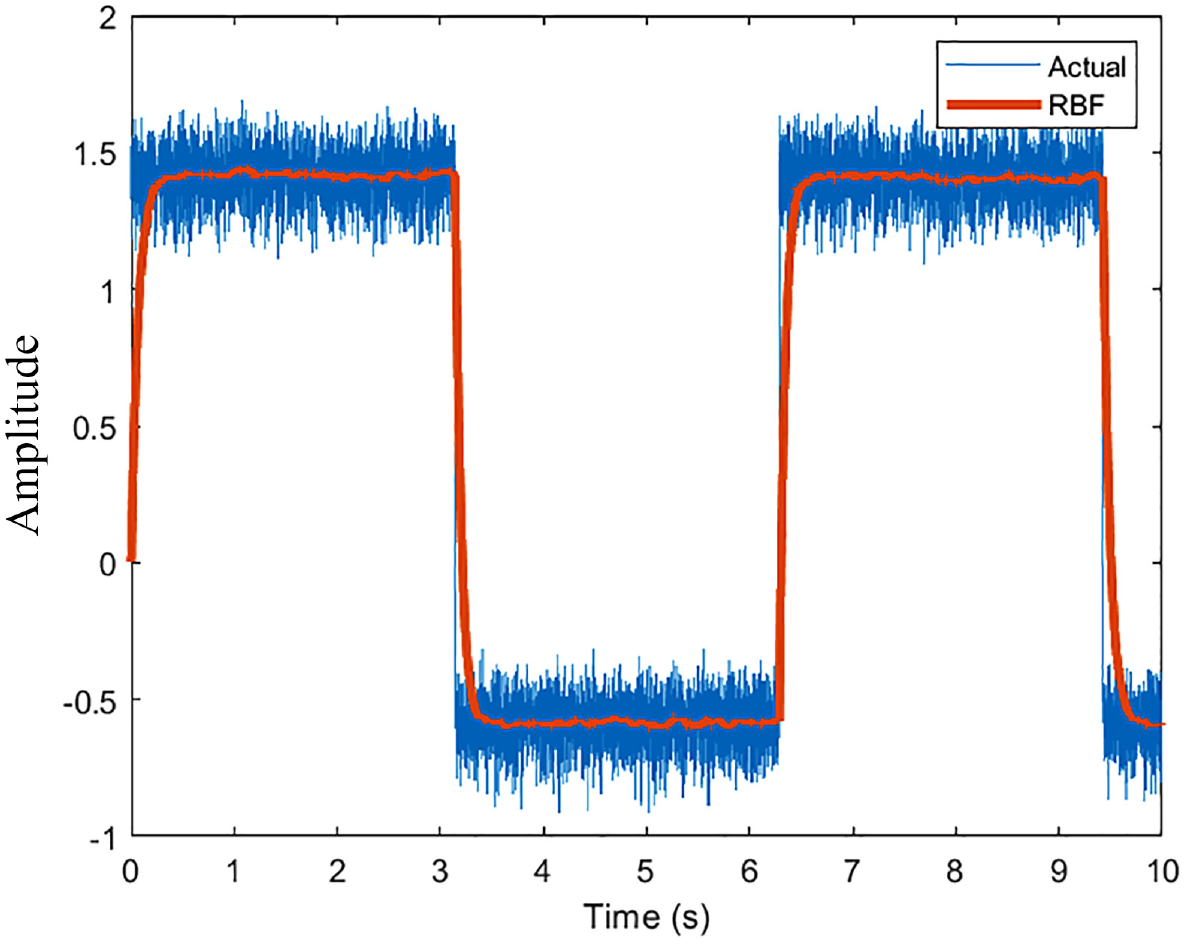
RBFNN performance (10 Neurons, 1000 Hz).
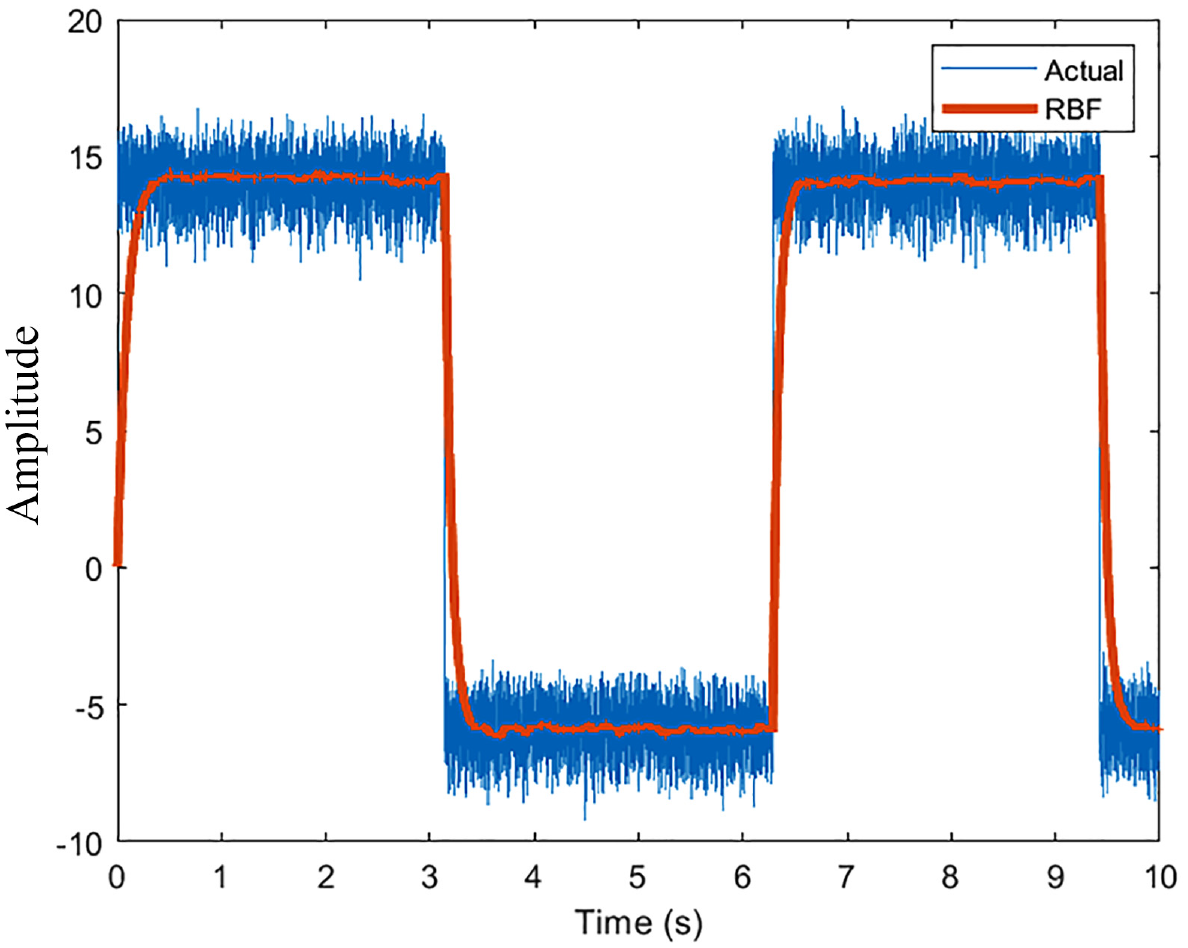
RBFNN performance (10 Neurons, 1000 Hz).
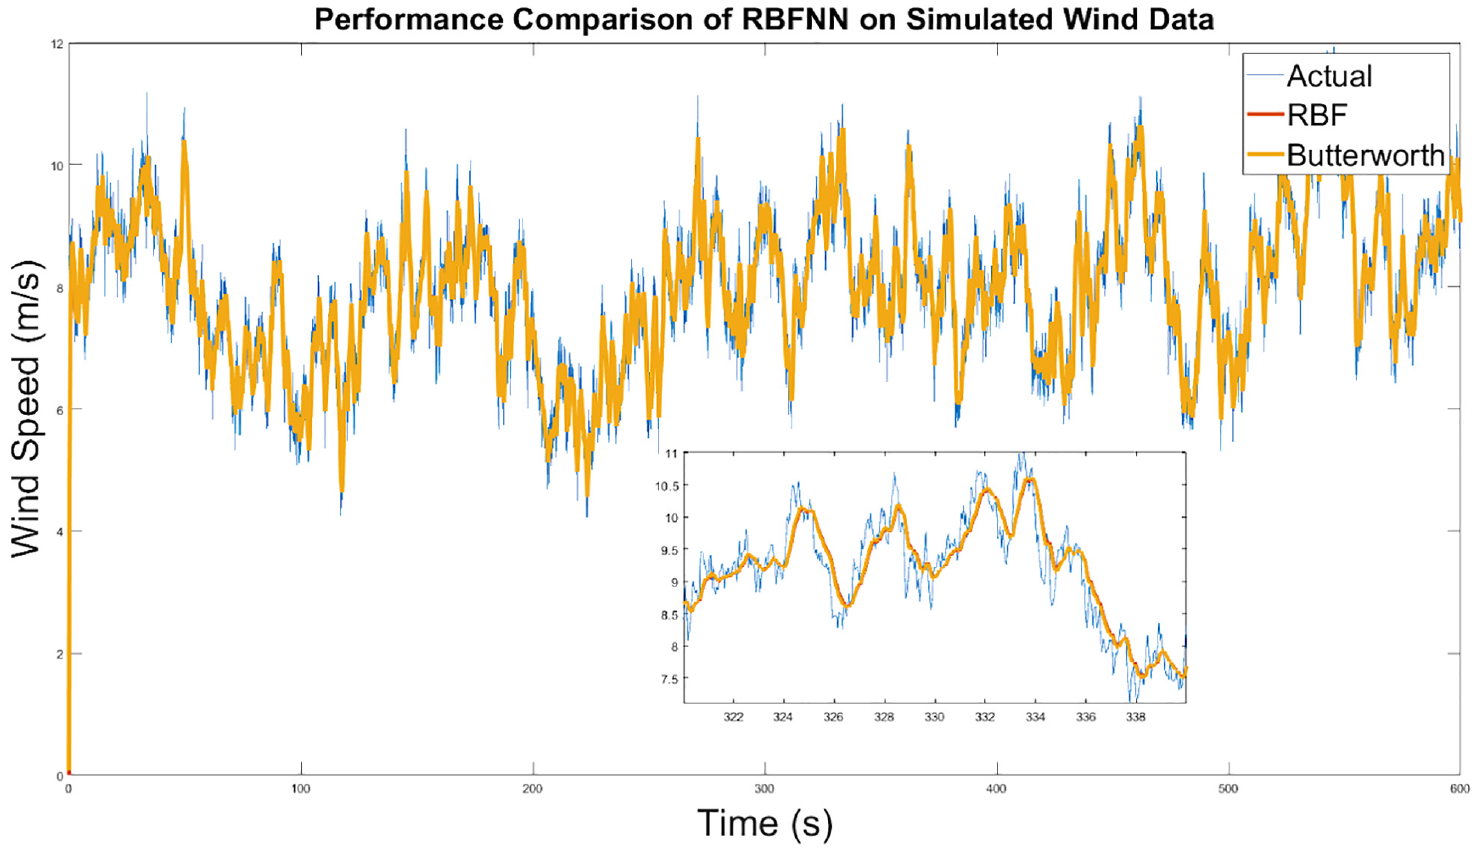
While the network performs sufficiently on such nonlinear functions, it is worthwhile to analyze the results of application to simulated wind data. Such data was obtained from TurbSim. A continuous time turbulence simulation was run for 600 seconds in three-dimensional space. For all intents and purposes, the x-direction is sufficient to test the network. The stochastic nature of wind is evident, and the noisy element is rich enough to reflect non-ideal conditions, as shown in Figure 10. In the same figure, the network’s performance is shown as well. It is well maintained. However, λ has to be modified to 0.5. This implies that the network is not encountering the same frequency of noise in the simulation as it did with previous tests which utilized the Weibull distribution. As such, a high λ is not required to compensate. There is again lag in the system which is approximately 1.5 seconds throughout. Another component is that the weights take approximately 10 seconds at the beginning before reaching appropriate values after which the network has no issue in maintaining performance. This is dependent on the initial values which were set to 0. A box plot is shown which shows a portion of the plot. The noise removal is adequately performed.
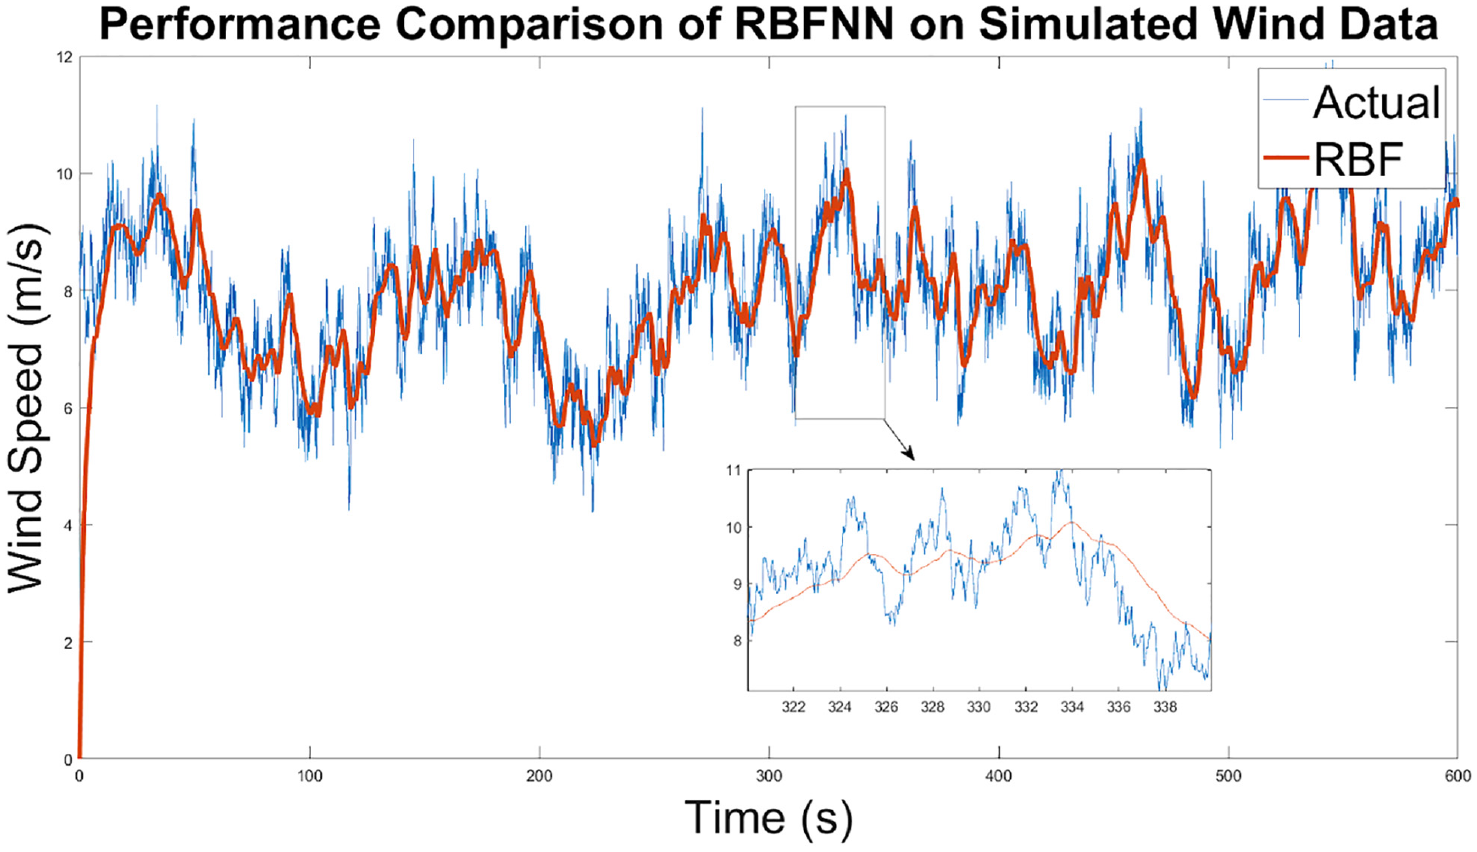
RBFNN performance on simulated wind speeds.
Butterworth filter
This section introduced a Butterworth filter to compare performance with the RBFNN. It is a low-pass linear filter which ideally is as flat as possible in the band-pass region. The result should thus be a filter that removes higher frequency noise in the data. The order of the filter is dictated by the slope of the frequency response after the cut-off frequency. Figure 11 shows the magnitude bode plot of a Butterworth filter with the cut-off frequency of =1
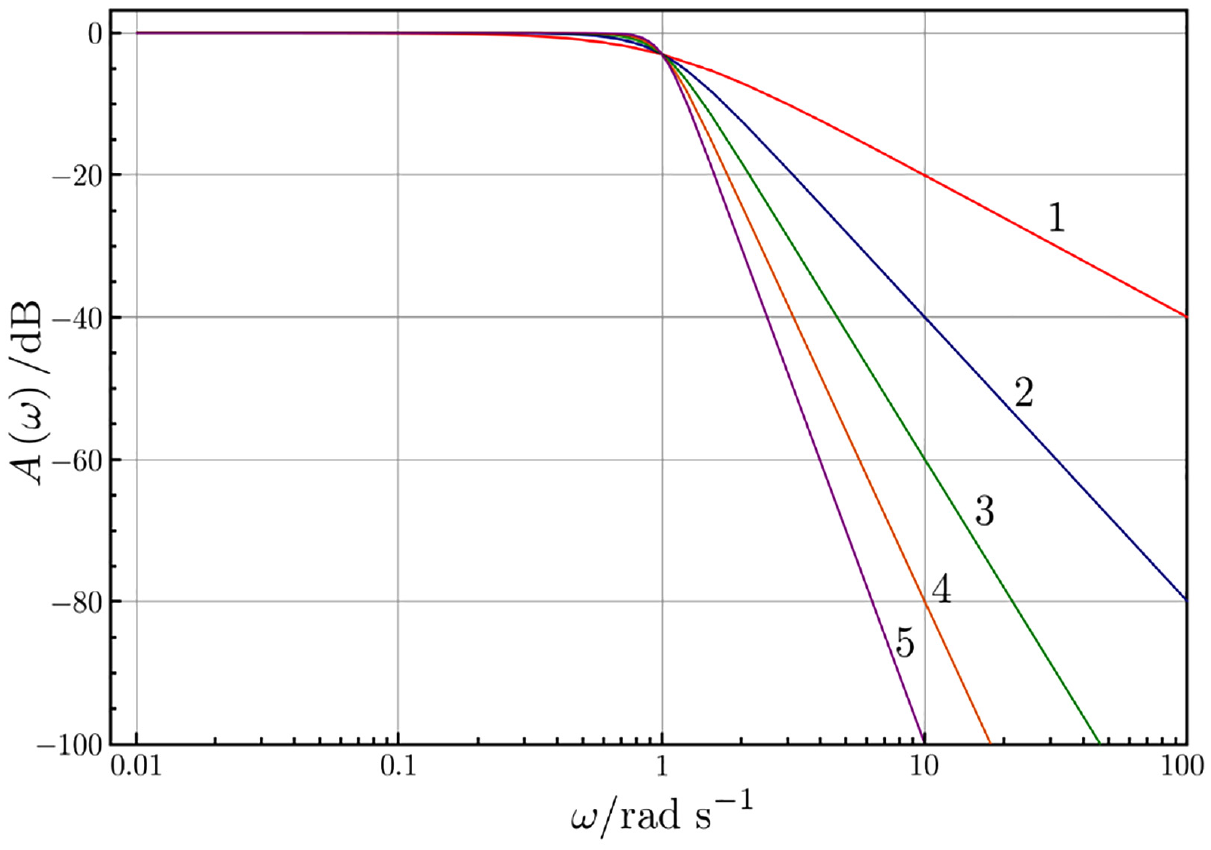
Frequency response of a Butterworth filter.
Performance wise, there are a few properties that are immediately noticeable in the Butterworth filter (first order, cut off frequency of = 0.5
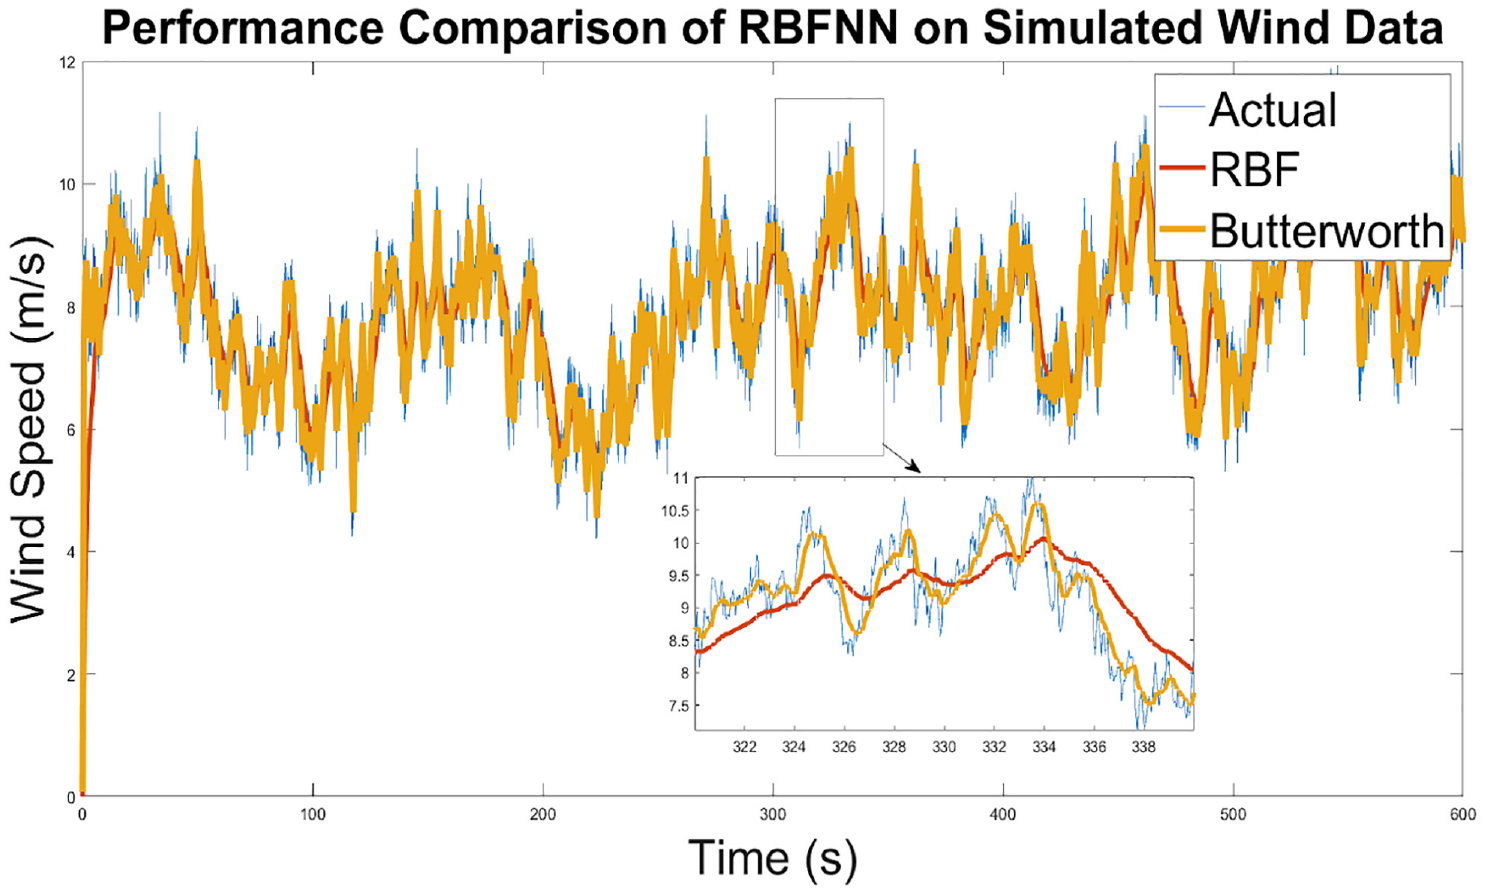
Filtering performance of the Butterworth filter.
Firstly, the Butterworth filter takes approximately a quarter of the time compared to the neural network to find suitable weights, which is desirable. The Butterworth filter is a recursive filter, which means it has the following recursion equation (Smith, 1997):

The output y of the nth sample is thus dependent on previous samples from the input x as well as the output y. The sets of coefficients a and b are the weights of the filter. They must be continuously modified with each sample to maintain output. The z-transform can be used to obtain a transfer function of the filter in pole-zero form (Smith, 1997):

Obtaining the weights involves specifying the pole-zero placement in the z-plane based on filter properties (cut off frequency and order), writing the corresponding transfer function in pole-zero form, then finding the polynomial form, and identifying the coefficients (weights) required. Built in MATLAB functions can be used for this purpose.
Secondly, the process delay is about the same as the neural network. Lastly, the noise removal ability is notably superior to the neural network, as the “smoothness” of the filtered data is substantially more pronounced.
Visually, there is only limited information that can be extracted. Signal analysis is required to numerically compare the performance. Furthermore, the neural network has not been finely tuned (learning rate and number of neurons can be modified) to achieve optimal performance.
Performance analysis
With a built-in signal analysis tool in MATLAB called Signal Analyzer, the power spectrum of the actual wind signal, as well as the Butterworth processed signal can be obtained, as shown in Figure 13:
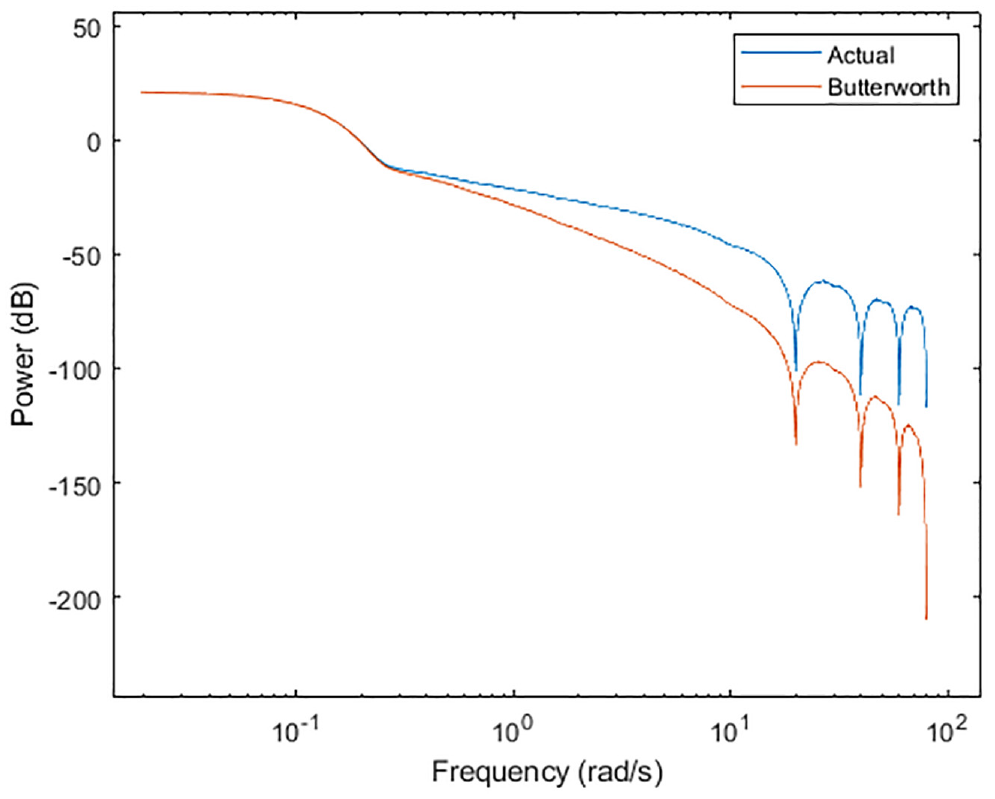
Power spectrum of simulated wind and Butterworth signal.
In the original signal, there are low-frequency contents in the signal which are most notably present. The slope for this region (up to
Introduction of the RBFNN into this graphing space shows its capabilities in eliminating higher frequency content even still. Figure 14 shows the comparative spectrums of the signals shown in Figure 12. The RBFNN can be seen as an “averaging” entity for the simulated signal in Figure 12. This is displayed in its sharp rejection of the signals beyond the
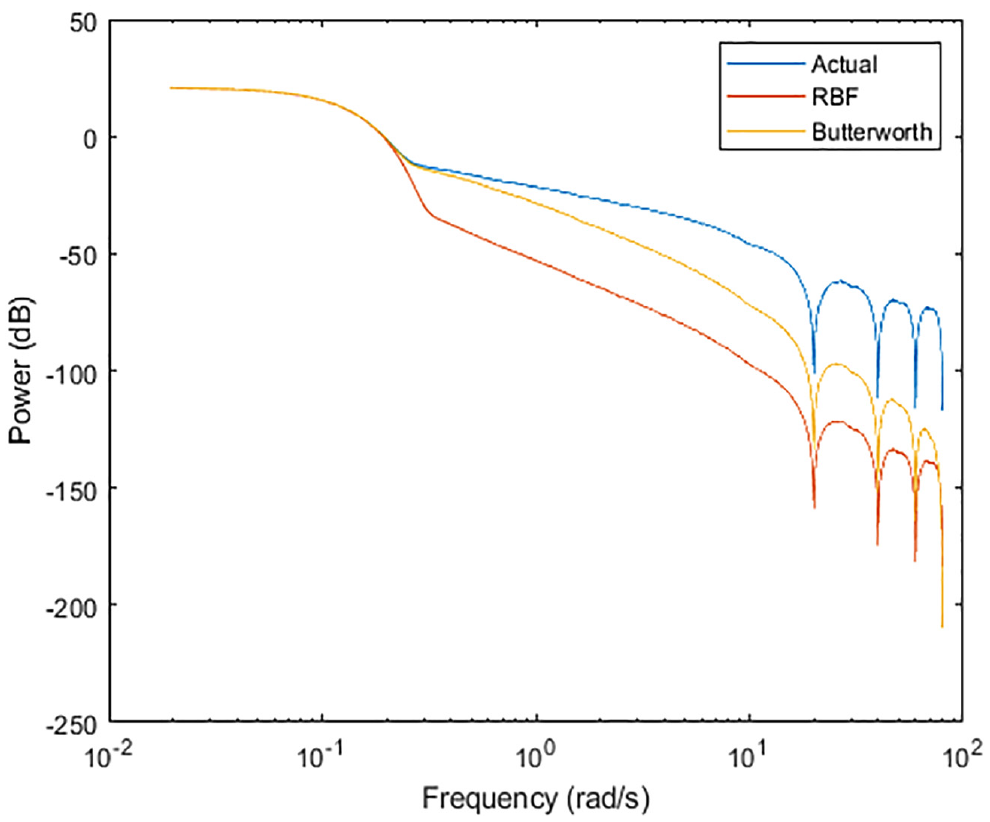
Power spectrum of simulated wind, Butterworth, and the RBFNN filter.
Modification of the RBFNN such that it has 10 neutrons with λ = 3 yields the following results. The power spectrum is almost identical at low and middle frequency ranges, and reasonably so in the majority of the high frequency range, as noted from Figure 15. Visually, however, there is no practical difference between the outputs in either filter, as seen in Figure 16. In terms of a control method, it would be inconsequential which filter is utilized. However, it goes to show that with just a few neurons and minimal tuning, the RBFNN can match the performance of the Butterworth filter. Figure 14 can then be the result is more filtering is desired, and Figure 15 can be the result if the RBFNN is to match the performance of the Butterworth filter.
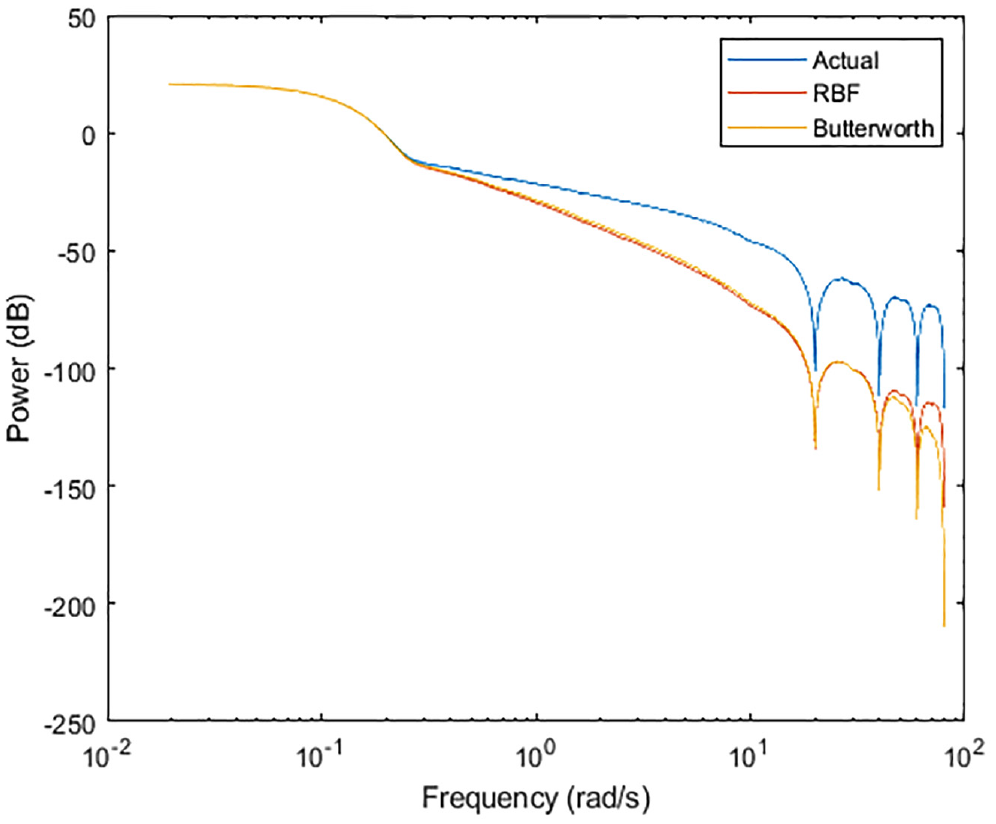
Power spectrum of simulated wind, Butterworth, and the RBFNN filter.
Power spectrum of simulated wind, Butterworth, and the RBFNN filter.
A simple method to compare the filters with a quantifiable result is to compare the relative power of the original signal with Butterworth and RBFNN processed signals. This can be done by numerically integrating the signals with the following formula:

Where
Likewise, the formula can be adjusted for the RBFNN as

Where NN is the RBFNN signal vector.
The Butterworth and the wind signals stay constant and therefore are reasonable metrics to compare against the RBFNN. With the equations stated above, the integral is as follows:

The results for the RBFNN can be normalized about the performance factor stated above. It is expected that the network will shift about the graphs shown in Figures 13 to 15 as the number of neurons and λ are modified, and this will be reflected in its normalized performance factor. The resultant data can be combined into a surface plot shown in Figure 17. Since the data is normalized, a semi-transparent plane showing the base value of 1 is shown for clarity. Across the entire range of the neurons tested, there are values of λ that can be selected such that the performance of the network is practically identical to the Butterworth filter. This range is approximately
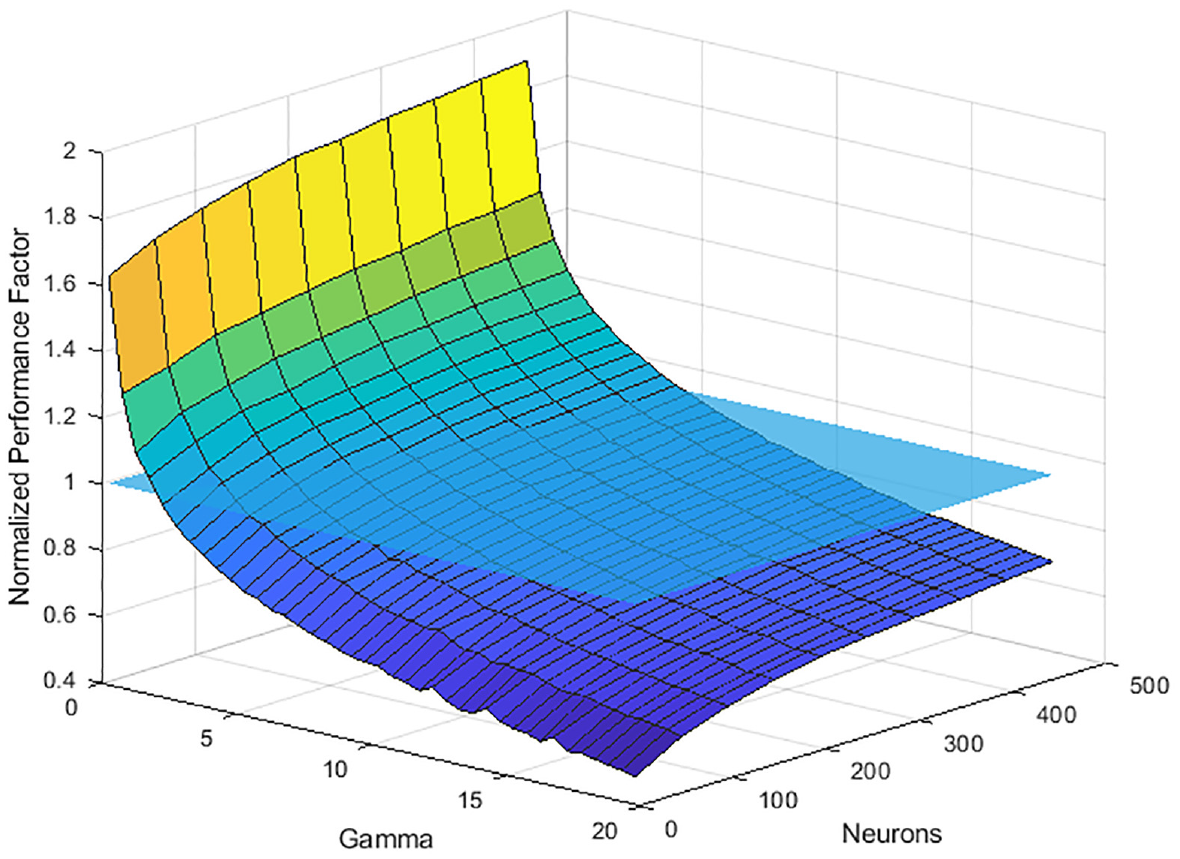
The normalized performance factor as a function of λ and neurons.
The normalized performance factor dictates the noise removing element of the network. As such, a higher factor would translate to a less noisy signal. However, the cost becomes signal integrity with respect to the original. Conversely, a lower factor would translate to more noise, while increasingly preserving the signal integrity. The conclusion being that at a certain point, the network would recreate the original unfiltered signal.
It is also evident that modification of λ has a significantly higher impact than modification of the number of neurons, especially at lower λ ranges as shown in Figure 18. The displayed curve can be approximated by some arbitrary exponential decay function. As such, the performance factor has an increasing slope as the λ keeps increasing indicating that there is a steady state value. Based on how the performance factor is calculated, this steady state value is 0, which pertains to the unfiltered signal as mentioned before. When it comes to the number of neurons, the impact on the performance factor is not nearly as drastic as λ, as seen in Figure 19. Here, the displayed curve can be approximated by some arbitrary bounded exponential growth function. Similar to λ, the highest impact is in the lower range of neurons utilized, after which there are diminishing returns.
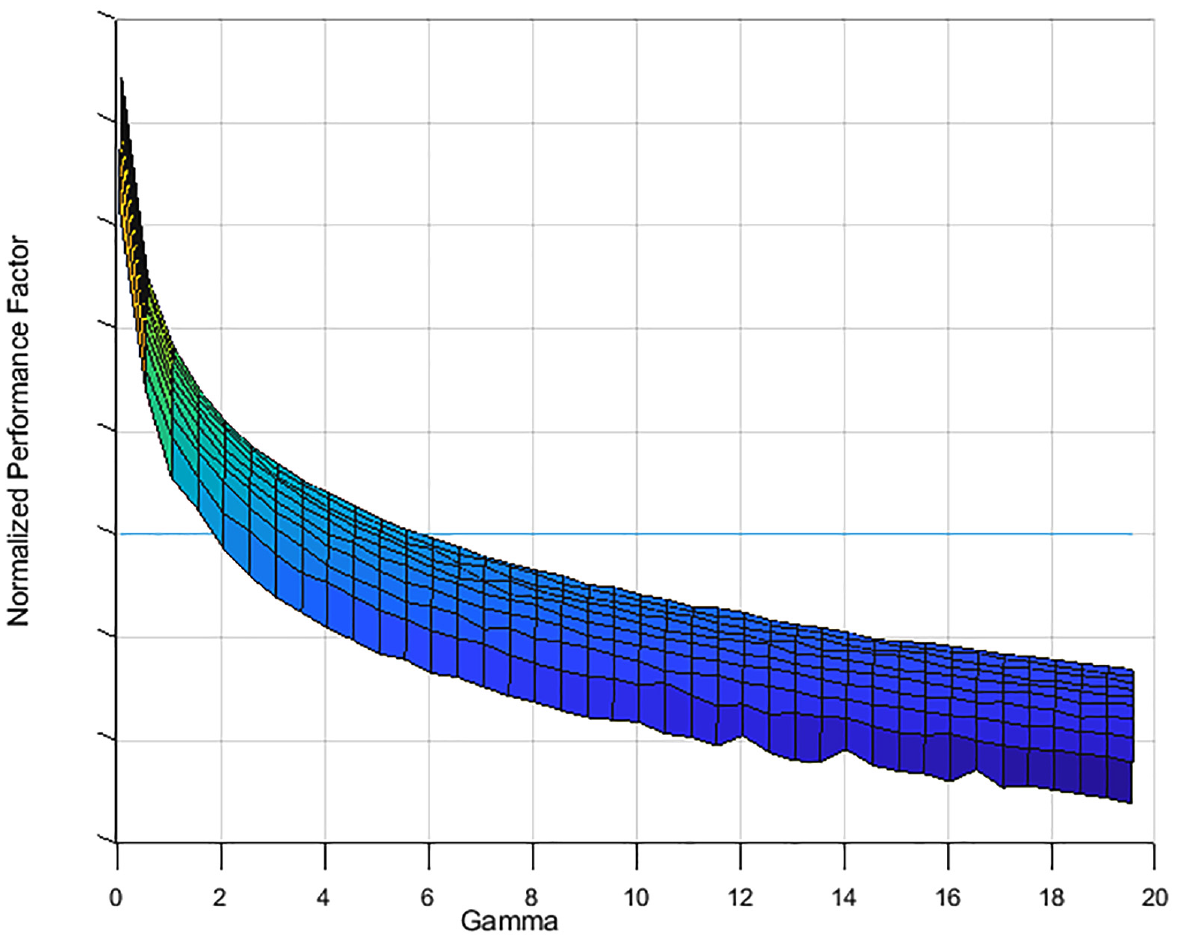
Impact of λ on the normalized performance factor.
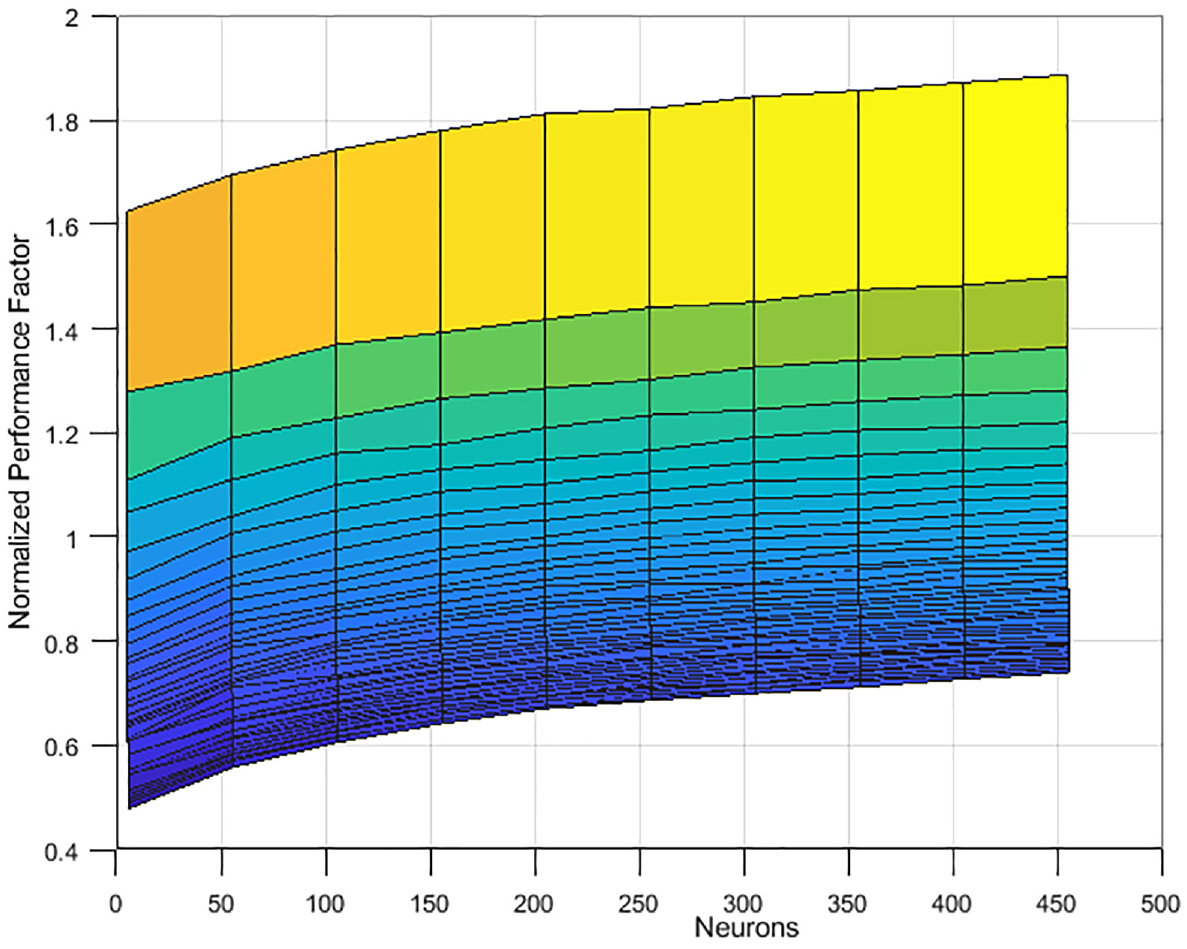
Impact of the number of neurons on the normalized performance factor.
The inquiry then becomes the following: in this interplay of computational cost, signal integrity, comparison to an existing filter, and noise removal, what are the ideal parameters to choose for the RBFNN? It comes down to the requirements of the output signal. The control designer must choose the appropriate parameters for the application that is utilizing the output signal. There may be instances where high frequency noise must be eliminated, or the middle range be kept. Or a signal delay might be critical or irrelevant to the performance of the whole system. These are a few examples of the factors that must be considered.
Tabulated below are the characteristics present in the tested λ and neuron ranges that outline the factors mentioned above, along with others.
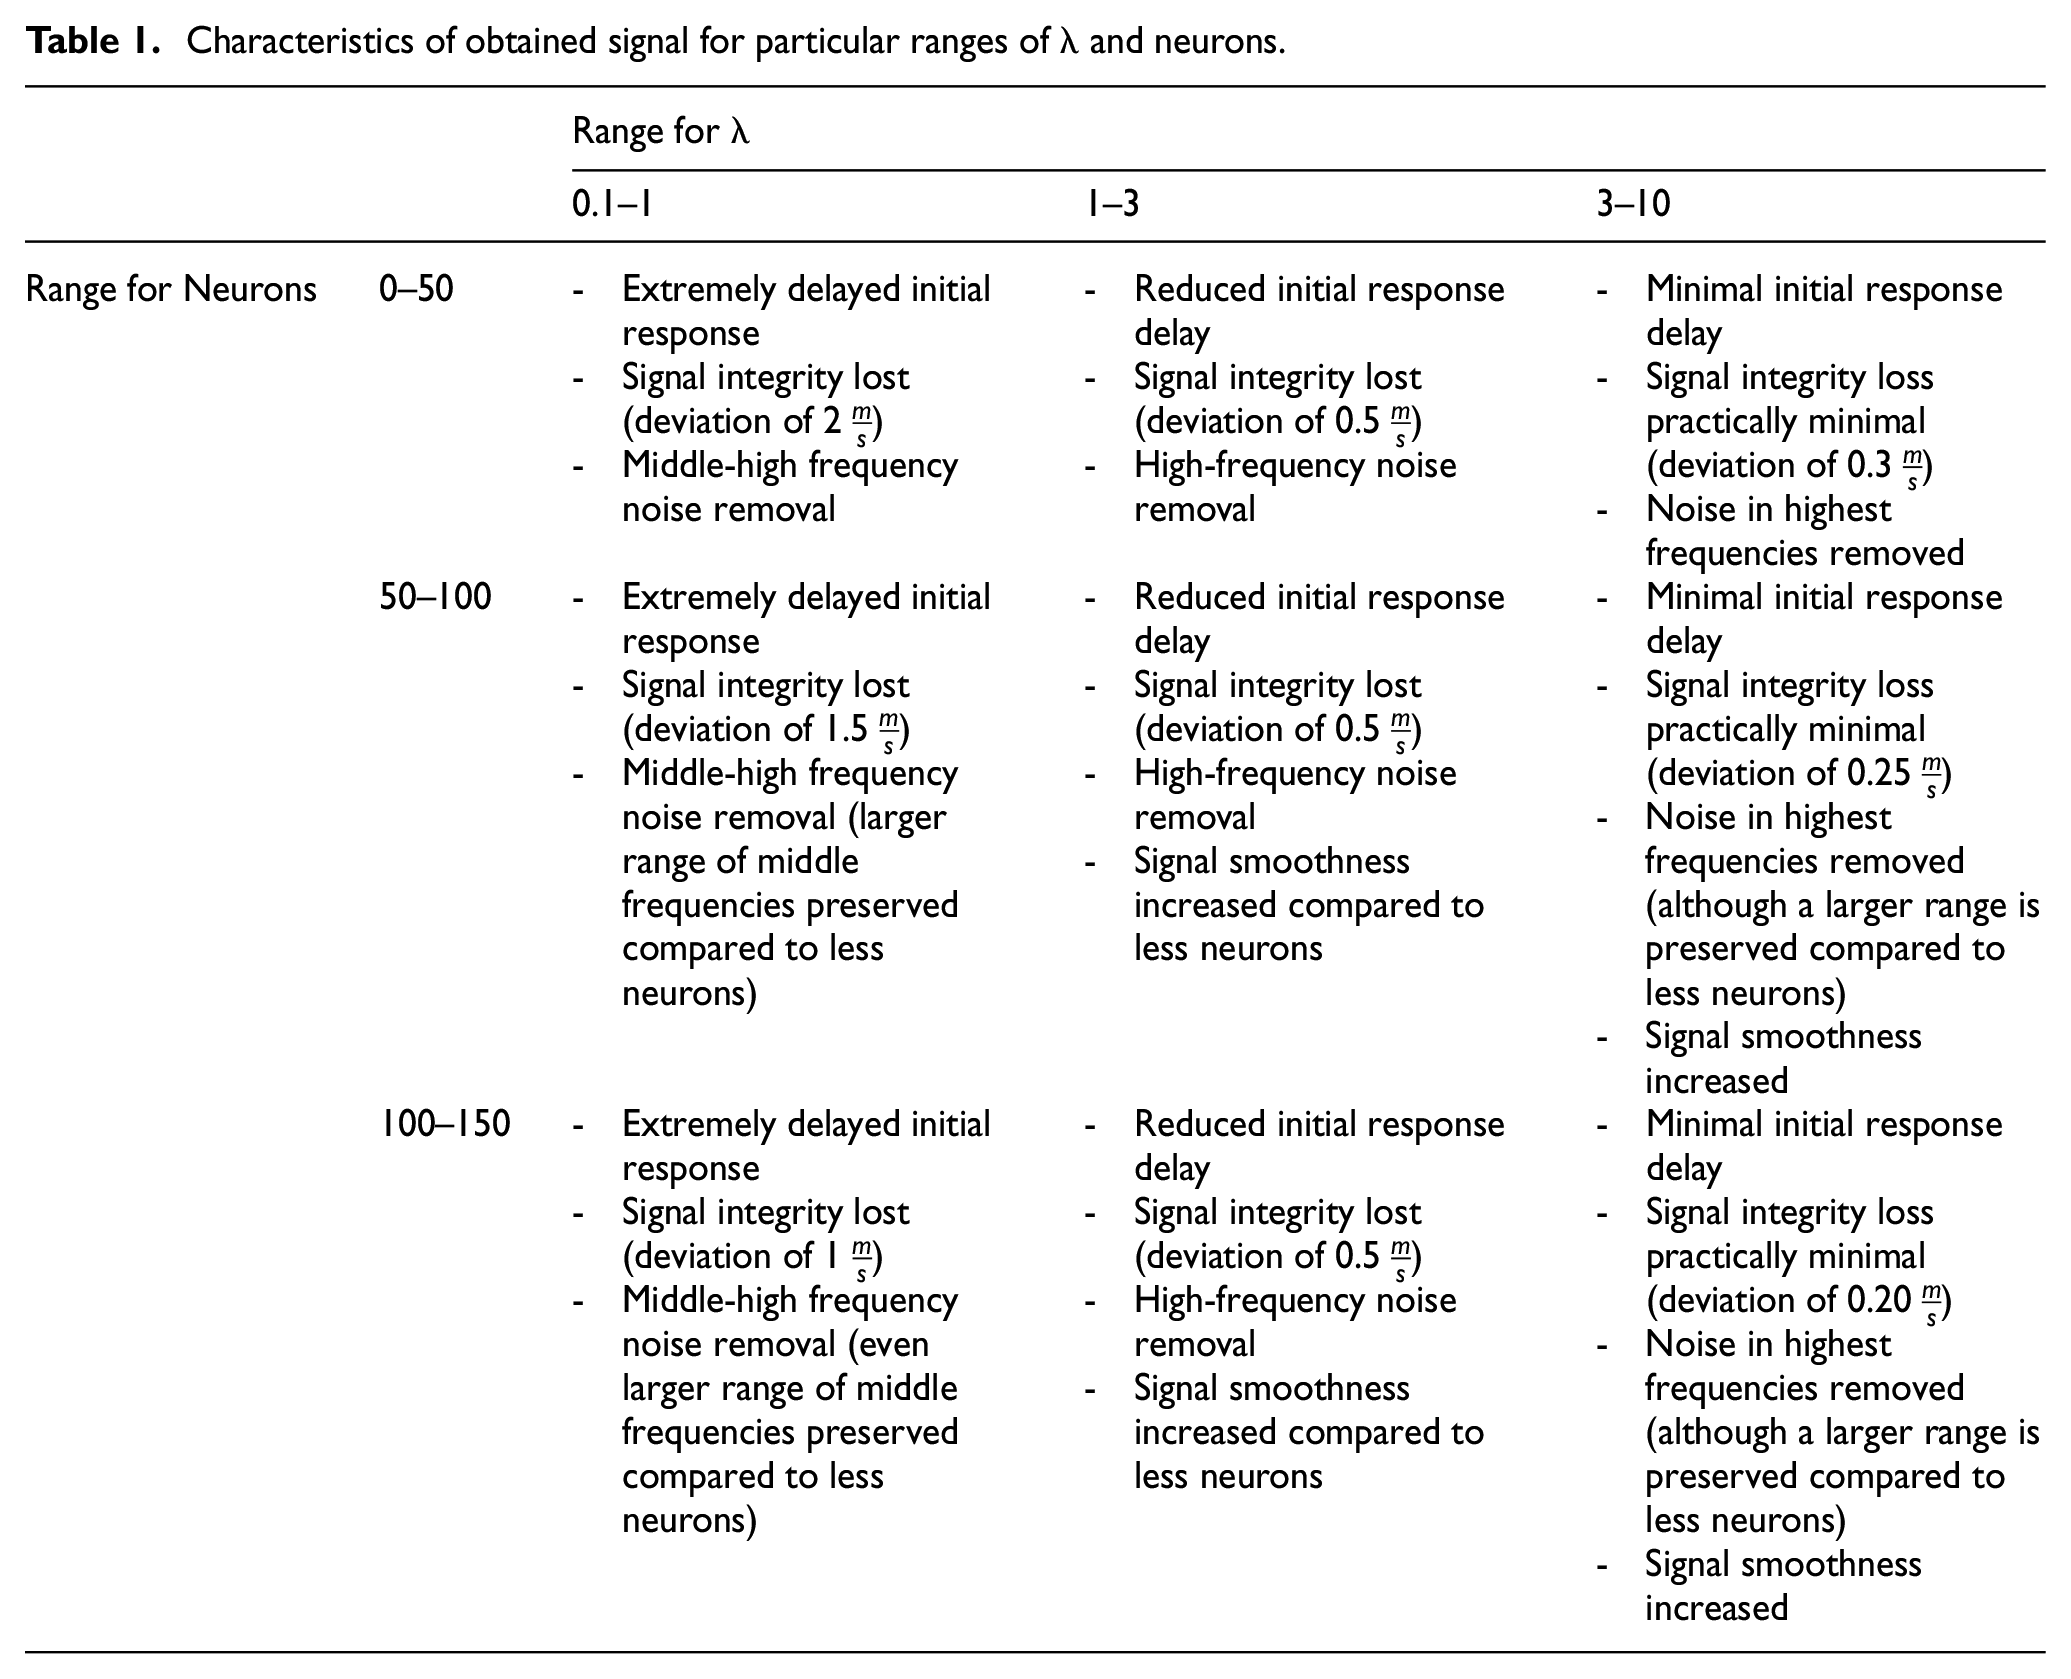
Every additional neuron added is an additional six calculations at every time step. Depending on the sample size, this can become unfavorable very quickly at high numbers of neurons. For application to control design, and control design for wind turbines in particular, it is critical to minimize active delay in the output since wind is extremely stochastic. At the same time, wear and tear of moving parts must be taken into account as the controller attempts to overcome the rapid changes in the disturbances. As such, shown in Table 1 are several modes that can be deduced from Table 2 that a control designer might utilize:
Characteristics of obtained signal for particular ranges of λ and neurons.
Modes that can be derived from Table 1.
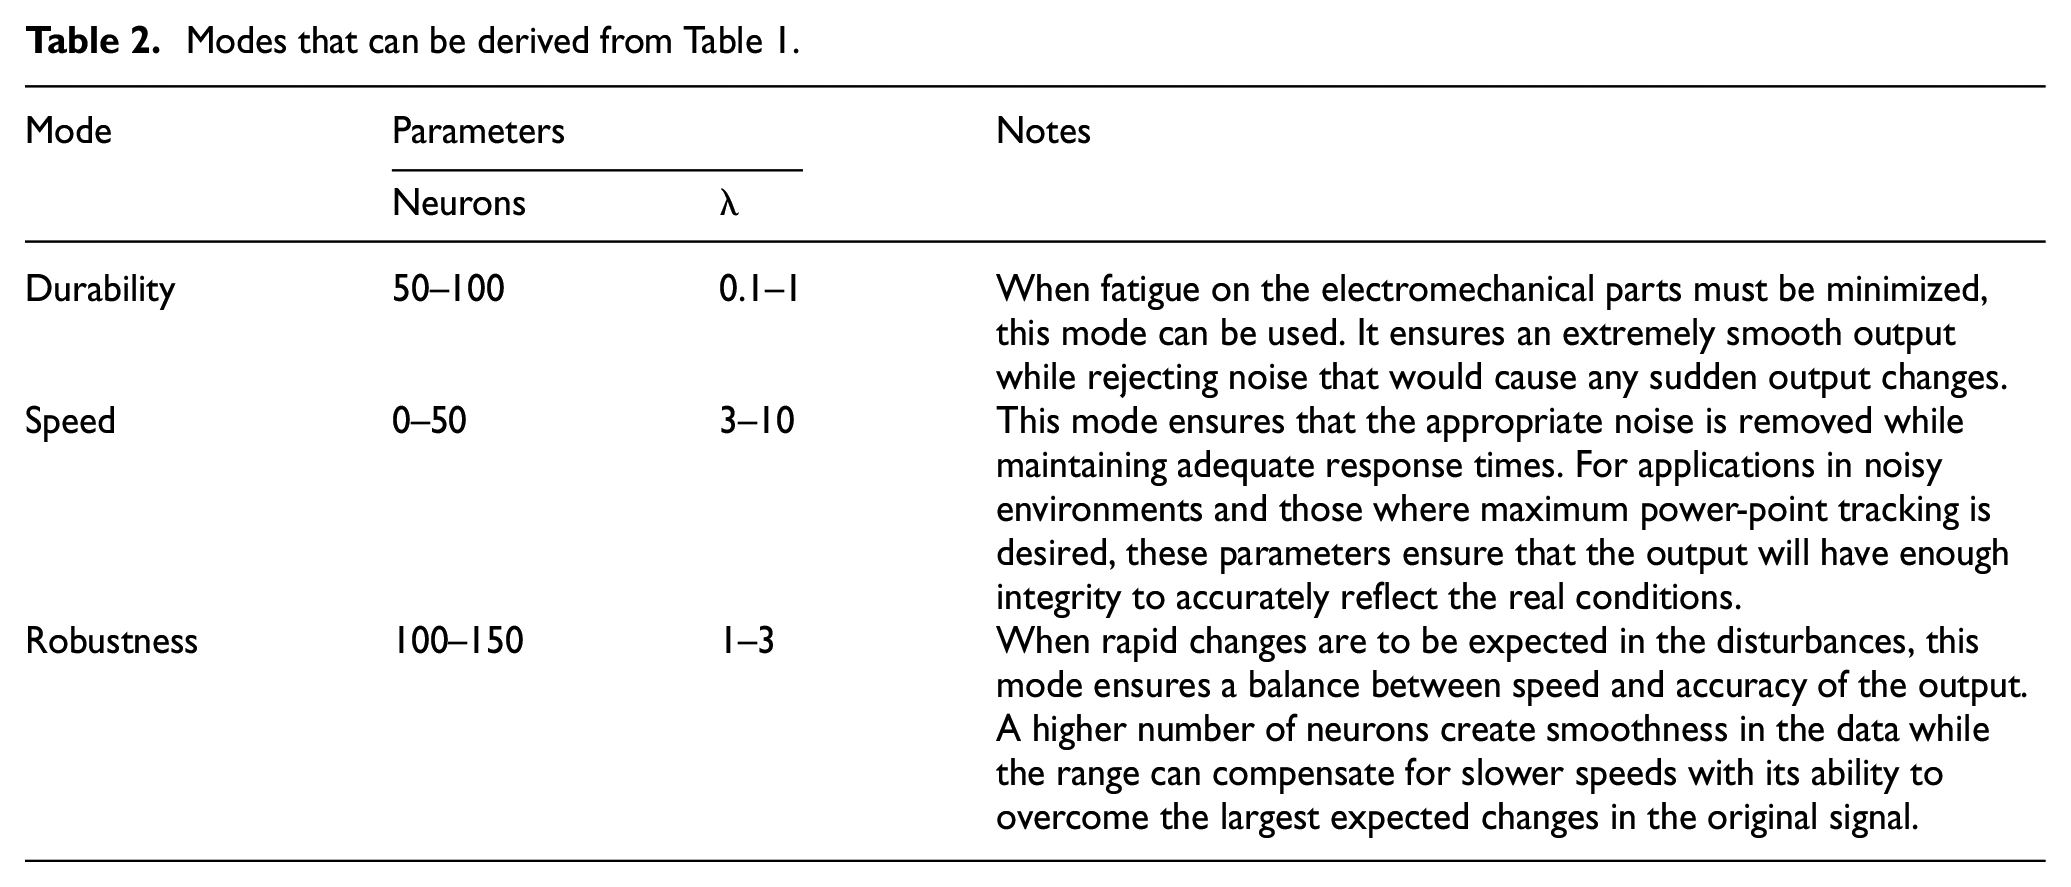
With the modes obtained above, a control designer can pick characteristics in a way that produces certain qualities in the processed signal. As stated before, this signal is separate from the turbine dynamics. This has the effect of increasing controller fidelity as equation (1) has a (if desired) more accurate input for the wind speed.
When it comes to control design, there are often exogenous disturbances in the system. Wind is such a disturbance as well as an inherent component of the dynamics of a wind turbine. As such, the same signal is fed to different sections of the controller. And the neural network can filter said with different modes and offer another layer of flexibility. For example, as a speed mode as a disturbance and durability mode for equation (1). When placed in this context, the potential configurations for application are many.
It must be noted that while the wind speed can be obtained while bypassing the wind turbine dynamics, the network does not act as a substitute for modeling the dynamics. As discussed in section 2.1, such approaches have been completed in obtaining the wind speed. As such, it is those approaches that act as a “black box” for the dynamics, whereas this paper presents a direct filter for the measured signal.
Conclusions
This paper proposes a RBFNN based filtering technique for wind speed estimation for application to wind turbine control methods. Simulated wind data was input and the resulting signal was analyzed. The parameters of the RBFNN (number of neurons and learning rate) can be manipulated as per the tabulated results to obtain the desired characteristics in the filtered signal. The modes that can be demonstrated are for wind turbine durability, control method response speed, and control method robustness. The first mode demonstrated an extremely smooth output devoid of noise. The second mode demonstrated a rapid response which ensured the controller was on par with the changes in the wind speed. The Third mode was a balance in between the previous modes in that the response was fast enough for practical application while maintaining accuracy of the unfiltered signal. Thus, a control designer would be able to utilize the method developed and simply choose the mode based on their preferences. In implementation, a novel equation was developed that results in a range of optimal values for the learning rate of the network. The results also show that the RBFNN can be on par with a Butterworth filter if the design parameters are particularly set. Additionally, the entire range of parameters that can be implemented means the performance of the network can be improved over the Butterworth filter. In terms of the parameters, the learning rate has been shown to be more significant for the network’s performance compared to the number of neurons. As the number of neurons is directly proportional to the computational power required, there are ranges where the performance of the network can be maintained with decreasing power.
Footnotes
Declaration of conflicting interests
The author(s) declared no potential conflicts of interest with respect to the research, authorship, and/or publication of this article.
Funding
The author(s) received no financial support for the research, authorship, and/or publication of this article.