
Abstract
This paper reviews the recent advancement made in data-driven technologies based on SCADA data for improving wind turbines’ operation and maintenance activities (e.g. condition monitoring, decision support, critical components failure detections) and the challenges associated with them. Machine learning techniques applied to wind turbines’ operation and maintenance (O&M) are reviewed. The data sources, feature engineering and model selection (classification, regression) and validation are all used to categorise these data-driven models. Our findings suggest that (a) most models use 10-minute mean SCADA data, though the use of high-resolution data has shown greater advantages as compared to 10-minute mean value but comes with high computational challenges. (b) Most of SCADA data are confidential and not available in the public domain which slows down technological advancements. (c) These datasets are used for both, the classification and regression of wind turbines but are used in classification extensively. And, (d) most commonly used data-driven models are neural networks, support vector machines, probabilistic models and decision trees and each of these models has its own merits and demerits. We conclude the paper by discussing the potential areas where SCADA data-based data-driven methodologies could be used in future wind energy research.
Highlights
Recent literature on data-driven techniques proposed for wind turbine operation and maintenance (O&M) activities are reviewed.
The review focuses on various O&M tasks, including failure detection, power curve monitoring and condition monitoring (CM).
Models grouped by data-driven steps: data collections, feature engineering, model selection, validation and decision making.
Findings show that data-driven models mostly use SCADA data for condition monitoring and performance monitoring (PM) tasks.
Data-driven methods mostly use SCADA for classification tasks but have recently seen significant attention towards regression.
SCADA data-based state-of-art data-driven technologies reviewed over the last 5 years.
For trends and outlook investigation, recent news articles and reports are taken into consideration.
Introduction
Wind power is considered one of the most sustainable and eco-friendly energy sources; hence WT technology is experiencing rapid growth. The EU aims to double its renewable energy capacity by 2026; analysis in Energy Voice (2020) showed spurred by the wave of mostly wind power investments. The total installed capacity of solar and wind power plants will climb to 64 GW in 2026 in the UK. Installed offshore wind turbine capacity is set to rise from 10.5 GW in 2020 to 27.5 GW in 2026 in this country.
Europe installed 14.7 GW (10.5 GW in the EU-27) of new wind capacity in 2020. Even more, Europe could install around 105 GW of new wind energy capacity over the next 5 years if Governments adopt their promised measures and aim to reach the targets set in their National Energy and Climate Plans. Around 70%–72% of new installations will come from onshore wind. Over the next 5 years, the UK is expected to install the most wind capacity in Europe – 18 GW in total. Indeed, wind energy met 16.4% of demand across the EU + UK (WindEurope, n.d.).
Motivation
Although wind energy may be rightly considered clean energy, it is not completely carbon-free because carbon is released during the wind farm life cycle (manufacturing, transport & installation, maintenance and decommissioning) processes. As a result, numerous cutting-edge data-driven technologies have begun to find applications in the wind farm life cycle, with the operation and maintenance cycle receiving special attention due to its high cost and complexity.
The expected development of offshore wind would require a substantial increase in the size of turbines, with which there is an increasing need to lower the Cost of Energy (COE) of wind power. The operation and maintenance (O&M) contribution to the Levelized Cost of Electricity (LCOE) is significant. For wind power, the LCOE represents the sum of all costs of a fully operational wind power system over the project’s lifetime, with financial flows discounted to a typical year. The principal components of the LCOE of wind power systems include capital, operation, maintenance and expected annual energy production (Costa et al., 2021).
The total COE spent on O&M in offshore WTs is 30% more than onshore WT developments (Costa et al., 2021; Dao et al., 2019). However, considering the economy of scale factor and the continuous improvement in the WT reliability, the O&M cost for larger WT is observed to have a downward trend (IRENA, 2021; Milborrow, 2020). O&M cost of the WT can broadly be broken down into the following items with their percentage contribution to the overall cost (Wind Energy the Facts, n.d.):
Total O&M Insurance: (provided by the manufacturing companies) 35%
Regular service: 28%
Administration: 11%
Repairs and spare parts: 12%
Other purposes: 14%
Due to the increased reliability, the manufacturer of the WT provides guarantees and standard contracts at lower prices which cover considerable insurance and regular maintenance share. The major cost of O&M is related to routine maintenance, unplanned maintenance and downtime of the WT; in addition, spare parts are difficult to predict and these costs increase with the WT age. By shifting the focus from the infrastructure of WT farms to servicing and minimising the O&M cost, the average lifespan of a WT will be increased and the cost of scheduled and unscheduled O&M work will be reduced, and so will be the overall wind energy generation cost.
Many countries use wind turbines to produce electricity, which is considered a clean energy technology, and a friendly alternative to fossil fuels to minimise carbon footprints. Wind power emits carbon during the production, shipping & installation, maintenance and decommissioning processes, therefore even though it is low-carbon, it is not carbon-free. As a result, numerous cutting-edge data-driven technologies have begun to find applications in the wind farm life cycle, with the operation and maintenance cycle receiving special attention due to its high cost and complexity.
Although the O&M and the transmission costs of the offshore WT are higher than onshore WT, they benefit from its relative youth and reliable modern technology, reducing the unscheduled maintenance costs by almost 25% on average (Froese, 2019). More advanced WT means more complex machinery; the operators should be up to skill for the new O&M services and technologies. But so far, not much significant data for O&M is available for offshore WTs.
WTs are designed to operate under extreme environmental conditions; this is particularly true for offshore ones (OWT) and, more specifically, for recent floating wind turbines (FOWT); hence, their components experience extreme and varying loads that need to be accounted for along with the accessibility of the WT farms, as offshore wind farms can be inaccessible for months (Igba et al., 2016). Achieving high asset availability in the operation of offshore wind power plants has been a challenge for many years. Today, the industry standards of the availability of the WTs are set to approximately 95% (Fox and Hill, 2018; Koukoura et al., 2021; Pfaffel et al., 2017).
Condition monitoring
In recent years, efforts have been made to develop advanced condition monitoring (CM) and maintenance optimisation techniques to improve the safety and availability of WTs. However, components of rotating machines, such as shafts, bearings and gears, are subject to performance degradation, which, if left unattended, could lead to failure or breakdown of the entire system (Li et al., 2019). Therefore, identifying critical components of the WT is vital to have them monitored more cost-effectively and efficiently with minimal downtime. Determining the performance of the WT at its optimal level for the lifetime of a WT (about 20–25 years) (Maatallah et al., 2020; Stetco et al., 2019) could cost about 25% of the offshore installation.
Current WTs have large structures prone to dynamic problems and fatigue wear. However, the actual structural condition of WTs is not monitored throughout the life cycle of the WT, which prevents the complete analysis of the actual condition of the support structure, causing a significant setback in analysing the possible operating life of the WTs. On the other hand, the knowledge of the WT structural condition can help anticipate situations of severe damage. It can also permit extending the operation period of the WT if the conditions are promising (Oliveira et al., 2017). Some examples of continuous monitoring of the structural condition can be seen in Kamariotis et al. (2022) and Oliveira et al. (2016).
Larger WTs have Supervisory Control, and the Data Acquisition (SCADA) system externally installed to the WT. SCADA data is transmitted and stored at an average of 10 minutes intervals, making processing faster and storage much easier for the operator (Dhiman et al., 2020). In addition, this system can generate monitoring data that could help build models for a process operating under different conditions. Amongst the research community, SCADA has proven to be an excellent system to facilitate data-based preventive maintenance for WTs (Maldonado-Correa et al., 2020). Still, SCADA also has some prediction reliability and accuracy issues, which are well explained in Tautz-Weinert and Watson (2017).
The interest in dealing with real SCADA data is because these data represent the actual health status of the WT that is directly and strongly related to the possibility of reducing maintenance cost and, thus, the COE. That is why the last years have witnessed an increase of studies about technologies to process and analyse the data to improve and optimise the O&M of WTs.
WT requires a reliable and comprehensive CM for operations and maintenance teams, making renewable energy more competitive and cost-effective in operational maintenance. CM approaches rely on analyses of specific measurements and aspects of the operation (e.g. vibration analysis, strain measurement, thermography and acoustic emissions). Recent developments of state-of-art technologies have opened up opportunities for integrated and in-depth CM analytics where different data types can facilitate informed, reliable, cost-effective and robust decision-making (Stetco et al., 2019). By performing statistical analysis on the trends within the data, it is possible to detect if the WT is entering a sub-optimal performance zone or even detecting a fault’s development. This can be achieved without installing any additional sensors to the turbine (Yang et al., 2014).
The principle of condition-based monitoring (CBM) is to plan a maintenance strategy based on the physical condition of the component, that is, maintenance is performed before failure as soon as the threshold value of a condition indicator is exceeded (Koukoura et al., 2021). Recently maintenance management in WT has seen enormous significance and improved reliability and accuracy. Some of the artificial intelligence (AI) methods, such as Artificial Neural Network (ANN) (Bangalore, 2016), Long Short-Term Memory (LSTM) (Feng et al., 2019), Convolutional Neural Network (CNN) (Fu et al., 2019), are being used for the condition monitoring of WT. Many methods have been proposed to optimise wind farm power output control. According to the WT CM and predictive maintenance, these review papers present the latest techniques and practices (Artigao et al., 2018a; Rinaldi et al., 2021; Salameh et al., 2018; Stetco et al., 2019).
This paper reviews recent ML-based approaches (2017 onwards) to CM of wind turbines. The survey is organised regarding WT data, and CM model approaches. To conduct the review, articles were retrieved mostly from Google Scholar using the keywords ‘wind turbine condition monitoring regression’, ‘SCADA data’ and ‘wind turbine condition monitoring classification’ and filtered by year (≥2017), access, citations and relevancy; selected papers from pre-2017 are introduced for their historical importance. This resulted in 105 documents for task relevance (CM and PM) and related data-driven techniques, including review articles as well. Particular emphasis is given on WTs catastrophic failures and models used to identify them at their early stage. We also discuss the potential challenges and future scenarios for SCADA data and data-driven techniques for WTs in the upcoming sections.
The paper is structured as follows: Section ‘Importance of condition and performance monitoring in WTs’ explains the importance of condition and performance monitoring in wind turbines. Section ‘Different types of data and feature selection’ introduces different data types and features used in recent years for WTs CM. Section ‘Advanced data-driven technologies for wind turbines’ explains numerous data-driven techniques used for specific CM approaches and validation metrics. Section ‘Data-driven frameworks to support the WTs maintenance decision-making process’ describes recent SCADA-based models used for improving WTs O&M decision-making process. Section ‘Conclusions and further developments’ concludes and discusses future work.
Importance of condition and performance monitoring in WTs
Condition monitoring can assist in reducing the maintenance cost by monitoring the critical component through real-time measurement of data. One of the essential steps in CM systems to detect and isolate the type of failures is Fault Detection and Diagnosis (FDD). FDD approaches can be divided into three categories: (1) model-based methods; (2) data-driven methods; (3) knowledge-based methods (Hu et al., 2016; Kordestani et al., 2019). These three approaches in first approximation can be considered separate, although some attempts at employing a mixture of them are being formulated: for example, in Corley et al. (2021) a combination of thermal modelling and data-driven methods is used for diagnosing gearbox faults based on drivetrain temperature data.
To maximise the electricity production from the wind, it is crucial to improve the reliability of the WTs. Component failures result in unscheduled or reactive maintenance on turbines which incurs significant downtime and, in turn, increases production cost, ultimately limiting the competitiveness of renewable energy. Thus, a critical task is the early detection of faults with the help of CM. This can save up to 20%–25% of maintenance costs versus scheduled maintenance of WT (Coronado and Fisher, 2015). Indeed, O&M costs can be directly used to determine whether the system is efficient regarding energy production compared to other types of power plants (Salameh et al., 2018). Thus, operators and researchers are constantly focusing on improving the fault detection techniques to render WTs more reliable.
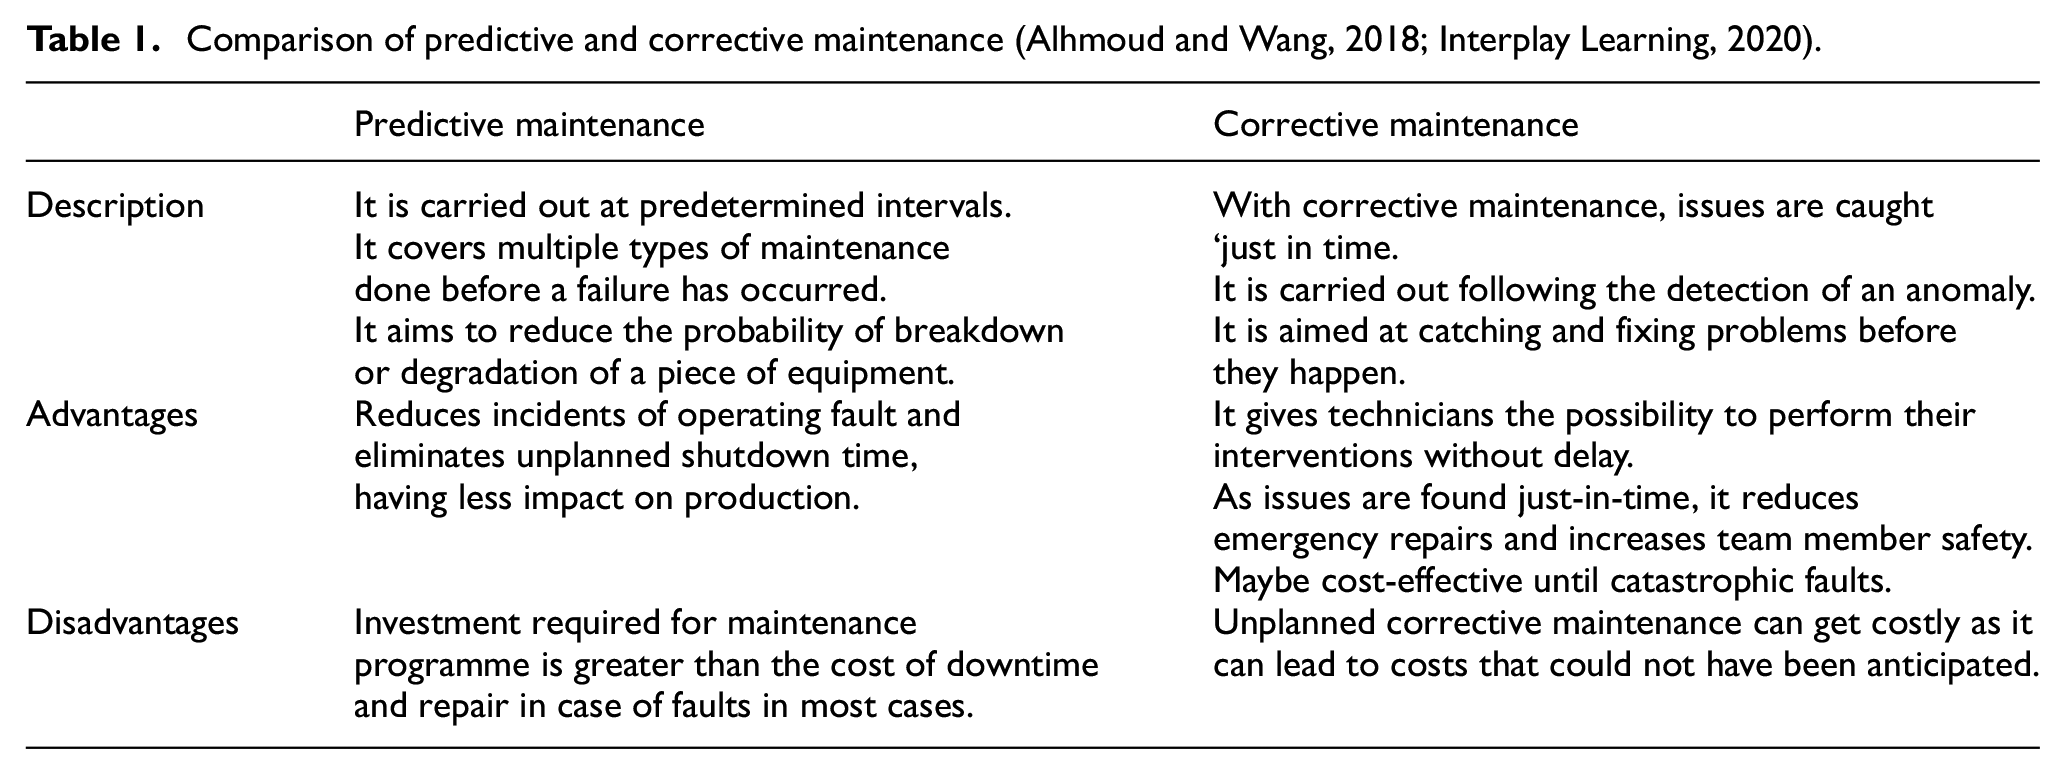
As shown in Figure 1, three maintenance strategies are commonly implemented (Chan and Mo, 2017): time-based (TBM, i.e. preventive), condition-based (CBM, predictive) and failure-based (FBM, corrective). Conventional onshore O&M activities consist of a combination of preventive and corrective maintenance operations (Table 1), but this approach could be improved and is not suitable for offshore WTs. Therefore, new trends move from TBM and FBM towards CBM (Reder et al., 2016). In the latter strategy, CM determines the optimum point between preventive and corrective maintenance, which reduces unnecessary repair actions and saves unplanned downtime (Qiao et al., 2015). In this framework, condition monitoring has been identified as the key to achieving higher availabilities while reducing O&M costs. Nevertheless, the uncertainty in the wind energy sector makes it difficult to understand which components are critical for CM (Artigao et al., 2018a).
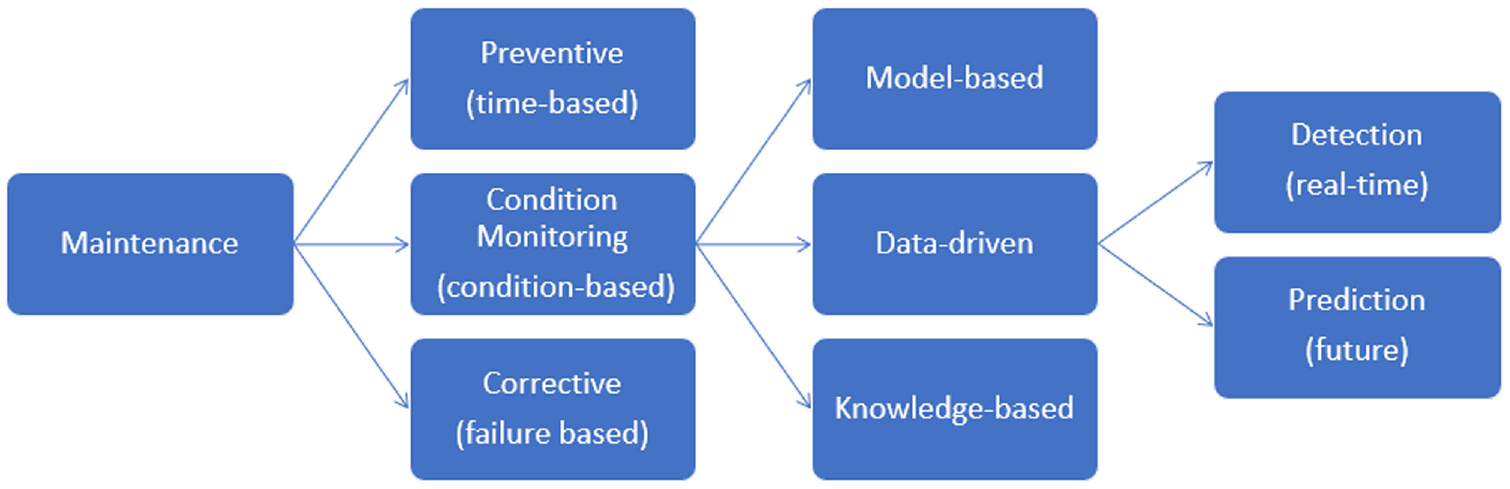
Flow chart of data-driven CM of WTs.
Comparison of predictive and corrective maintenance (Alhmoud and Wang, 2018; Interplay Learning, 2020).
CM can be used for fault detection in real-time or in the future (Figure 1), so we distinguish between- CM for diagnosis (fault detection), where we identify a fault when it happens, and CM for prognosis (fault prediction), where the underlying model finds patterns in the signal data that are predictive of failures in the future (Stetco et al., 2019).
There are two main types of monitoring: Intrusive monitoring, which involves vibration analysis (Zhang et al., 2017), oil debris monitoring, shock pulse etc., imposing wear on the component being monitored and Non-intrusive monitoring, which involves ultrasonic testing, thermography, power signal analysis and so on (Qiao and Lu, 2015).
It is vital to consider the failure rates and downtimes per failure of different sub-components when deciding which components to monitor. Components that are more likely to fail or can lead to long downtimes, as they may incur significant potential impact, are prioritised (Stetco et al., 2019). Using RMS and extreme peak value of the vibration signals facilitate early detection of faults, which supports holistic health assessment of the WT components (Igba et al., 2016). Koukoura et al. (2021) simulate the impact of CMS performance on the life cycle costs of the WT using a time-based Hidden Markov theory. The variation of maintenance strategy by transforming unplanned activities into planned interventions conducted during a suitable weather window ahead of a component failure can lead to reduced O&M costs. Research on CM have different specific goals like maintenance optimisation (Bangalore, 2016; Qiao et al., 2015; Rinaldi et al., 2021) and the economics of CM (Dhiman et al., 2020; Pandit and Infield, 2019a).
Implementing CM guarantees the prevention of the premature breakdown of the system with early maintenance and component protection. It also saves cost in avoiding the replacement of parts and components which are intact. Furthermore, CM provides remote supervision and diagnosis of the entire WT system. CM also helps plan maintenance activities during low wind seasons increasing the overall capacity of the WT (Salameh et al., 2018).
Different types of data and feature selection
Variety of data used and its descriptions
The data collect from WTs for CM can be categorised as (1) Vibration data, (2) Current signature data (CSA) and (3) SCADA data. Data typically available in a wind turbine pose the ‘big data’ challenges: Volume (a wind farm with about 20–30 sensors for each WT would generate 60–100 SCADA signals. These then, when sampled every second, would produce about 0.2 GB of raw data per turbine); Velocity (the frequency at which data is produced and transmitted, with new wireless and acoustic sensors); Variety (CM systems must integrate sensor data with images, video (e.g. captured by drones) and free-text action reports, etc.) and Veracity (ideally, data should be free of missing or impossible values and inconsistencies; if not, automatic or semi-automatic data cleaning (scrubbing) procedures are typically needed. This need increases with the number of sources of data, especially if heterogeneous) (Stetco et al., 2019).
(a)
Merizalde et al. (2019) suggest the predominance of vibration data for CM over SCADA and current signature. This predominance can be explained as mechanical equipment transmit vibrations to coupled components; the magnitude of the vibration can indicate the component health, or fault detection and diagnosis and vibration data provide evidence of the earliest failure of the component. Nevertheless, the counterpart of vibration data is that it is costly, require a high data sampling rate, the installation is intrusive and it can also be contaminated by the environmental noise, provide false alarms and cannot detect generator fault. For this reason, most studies in the literature based on vibration analysis deal with laboratory data, as for example Meyer (2022), where two 750 kW gearboxes (one healthy and one damaged) are run on the National Renewable Energy Laboratory test rig: health state classification is obtained using convolutional neural networks and isolation forests.
Real-world data are analysed by Castellani et al. (2020) where, basing on the intuition formulated by Mollasalehi et al. (2017) using laboratory data, the diagnosis of drive-train components is performed by processing tower vibrations data measured by the authors at a damaged and several healthy wind turbines of an industrial wind farm. The pro of the approach formulated by Castellani et al. (2020) is that the measurements are collected by the authors without interfering on the operation of the industrial wind farm; the drawback is that, being the vibrations collected at the tower, it is prohibitive to indicate what component is damaged: the realistic outcome is a generic anomaly indication.
(b)
On the other way round consequently, for practical convenience, the data typically are not stored continuously and are recorded and made available to the end user only when some trigger conditions occur. It is therefore challenging to employ this kind of data for data-driven studies devoted to condition monitoring, but first attempts have been formulated in the literature. In Natili et al. (2021), gearbox and bearings vibration time series with 25 kHz frequency of healthy and damaged wind turbines are processed in the time domain through feature extraction and principal component analysis. From the principal components, the information is squeezed to one dimension through the formulation of a novelty index, from which it arises that the damaged wind turbine can be statistically distinguished with respect to the healthy ones. A critical aspect of this procedure is that, given the way data are stored by the industrial condition monitoring system, the available data of the various wind turbines are synchronised: nevertheless, the authors Natili et al. (2021) support that it is possible to identify the faulty wind turbine.
(c)
For optimum CM, Turnbull et al. (2021) propose using multiple sources of data – SCADA temperature and vibration monitoring for fault detection and reliability analysis. Using SCADA data alone, the anomaly detection was consistent but adding the vibration data allows the multivariate to better describe error distribution over the chosen period and form complex decision boundaries. However, also consider the vibration data has less samples than the SCADA data to build the model, which may cause overfitting due to the imbalance.
A condition monitoring method based on SCADA data usually targets secondary effects of the fault. The abnormal vibration of the damaged mechanical component or anomalous electrical behaviour of the faulty electrical component are very prohibitive to be detected directly using data having 10 minutes of averaging time, as argued for example in Astolfi et al. (2017). For this reason, typically SCADA-based condition monitoring methods individuate an incoming fault in the form of abnormal components heating or wind turbine under-performance. For example, in Meyer (2021) several regression types are applied for modelling multi targets of wind turbine operation which are active power, rotor speed, generator speed and blade pitch current and no information about components temperature is employed. Similarly, in Gao and Hong (2021) the systematic yaw error of a wind turbine is diagnosed through the individuation of under-performance based on the data-driven analysis of the wind turbine power curve. In McKinnon et al. (2020), the target of the model is the gearbox temperature and the input variables include a mix of environmental measurements (wind speed), operation variables (generator speed and power) and temperatures collected at other meaningful subcomponents (generator temperature, bearing temperature, nacelle temperature). A similar procedure is applied in Encalada-Dávila et al. (2021), while in Vidal et al. (2018) the target of the model is the temperature of the component of interest and the input variables are working parameters and do not include temperatures of other components.
(d)
Feature engineering and its importance
Feature selection is a process of selecting variables significantly related to the outcome that our model should study or predict (Gonzalez et al., 2019; Lyons and Göçmen, 2021; Vidal et al., 2018). This can be done automatically or semi-automatically. Wrapper methods, embedded methods and filter methods are helpful for automatic feature selection, whereas for semi-automatic the guidance of an expert is necessary. Wrapper methods view ML algorithms as BlackBox, feed them with a different subset of features and calculate their model performances to determine which variables subset performed best. Embedded methods are usually used in ML algorithms like decision trees, where the relative importance of nodes is considered for feature selection. Finally, filter methods perform significance tests like correlation to rank each feature. Correlation coefficient analysis is a commonly used approach in filter-based categories (Kordestani et al., 2019): it is so important that the miscorrelation between features can even be considered as a simple fault diagnosis method (Zhao et al., 2017).
The high dimensional data is compressed in feature extraction, keeping their main characteristics intact while removing correlations and discarding noise. This speeds up the model’s training time and produces better outcomes than when applied to raw data. Feature extraction methods can be split into statistics, fitted time series model parameters and time-frequency domain properties (Stetco et al., 2019). By extracting only, the dominant features for the modelling will provide good predictions and reduce the computational time (Astolfi et al., 2022).
Jing et al. (2017), demonstrate how deep learning (CNN) can be used for feature extraction as it can adaptively learn features and is capable of sensitive features mining from raw vibration data. As a result, the model can get over 98% accuracy, while the traditional method yields less than 85%. A combination of feature selection and learning vector quantisation (LVQ) neural network method is introduced in Malik and Mishra (2015) to diagnose wind turbine bearing fault where Empirical Mode Decomposition (EMD) is used to extract the valuable features. Then, the LVQ neural network is implemented to classify various failures. The experimental test results indicate the high accuracy of the proposed fault diagnosis method.
Modern-day SCADA data contain many variables from which redundant data need to be removed. Neighbourhood component analysis for regression aids this process by calculating feature weights. Features with higher importance are considered for regression analysis with SVR, neural network, decision tree and logistic regression under evaluation. This experiment performed in Turnbull et al. (2021) observed accuracy up to 99%. In Turnbull et al. (2018), it shows that by analysing high-frequency vibration data and extracting key features to train support vector machine algorithms, an accuracy of 67% can be achieved in successfully predicting failure 1–2 months before occurrence.
Fu et al. (2019) introduced deep learning for condition monitoring of WT adaptive elastic network, CNN and LSTM are combined to do feature extraction, dimension reduction and classification. This algorithm solves the issue of gradient explosion and overfitting, reducing the prediction error. It is necessary to select the appropriate variables related to the transmission bearing temperature as the research object before analysing the data collected by SCADA. Variables with different correlations have different effects on gearbox bearing temperatures. Gougam et al. (2020), propose ANFIS to estimate the remaining useful life (RUL) of bearings based on vibration data and feature extraction. Health indicators can be extracted from three main categories: time domain, frequency domain and time-frequency domain. Here, average spectral kurtosis (SK) features perform exceptionally well to monitor and detect the health condition of the bearing, as seen in Figure 2. This feature (SK) is used to learn the model for effective remaining useful life (RUL) prediction. The model gave noticeable results. Correct feature extraction helps in building a well-fitted model.
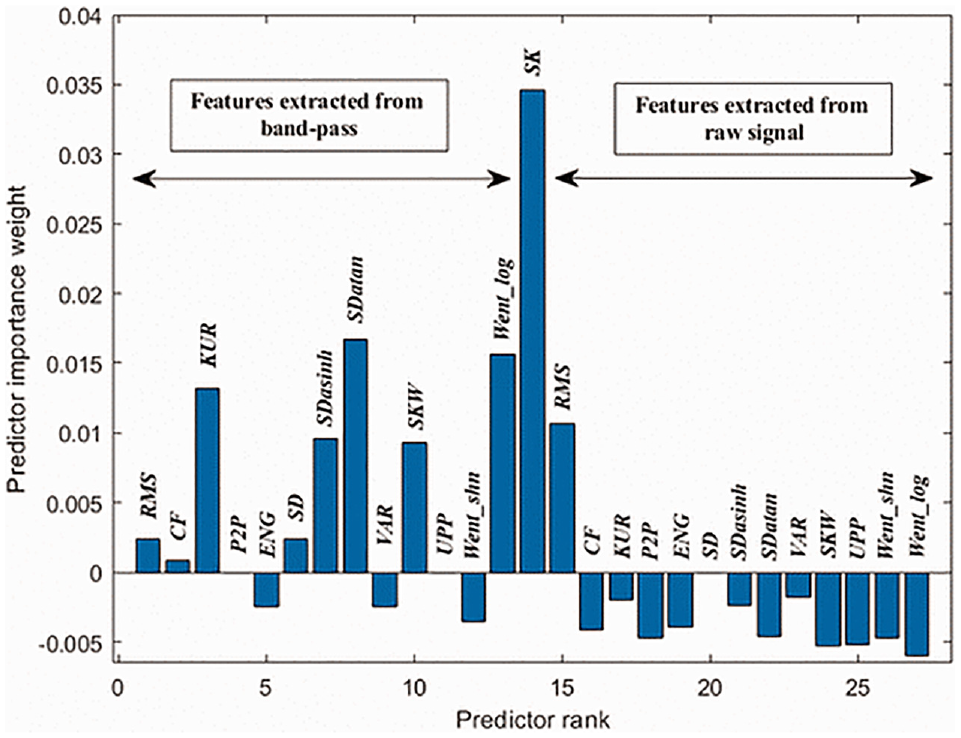
Feature weights (Verma and Yang, 2014).
With the increasing scale of the WTs, the data generated also grow exponentially, making it challenging to analyse all the data together. Hence, an efficient approach is required to deal with extensive real-time data. Black et al. (2021) showed promising performance for a data-driven benchmark model to transform the high frequency to low frequency without data loss.
Advanced data-driven technologies for wind turbines
CM involves gathering of data of various signals, such as vibrations, electric signals, temperature variations, oil quality and so on; analysis of which intends to highlight the health of the components and the overall WT system, determining the RUL of the components or the faults in any component (Artigao et al., 2018b; Chen et al., 2020). Two types of approaches are carried out for WTs CM: a) the traditional approach and b) the machine learning (ML) approach. Traditional approaches are deployed when the component frequency does not change with time. However, if the frequency component changes due to wear and tear, the machine learning approach is preferred to learn and adapt to varying situations. Hence, the ML approach is preferred for fault diagnosis of mechanical systems (Astolfi et al., 2022; Joshuva and Sugumaran, 2017).
Earlier, CM systems focused on vibration techniques applied on the drive train, like gearbox and bearings. Recently, SCADA-based methods have gained popularity for their capability in fault detection of pitch, yaw, hydraulics, etc. Current signature analysis (CSA) is not as popular as SCADA, but it has good scope for further research. CSA is preferred for fault detection in induction machines. However, for rotor eccentricity fault diagnosis Multi-resolution mean power indicator is used over CSA to quantify the fault (Merizalde et al., 2020). Nevertheless, the model demonstrated promising results even under different fault degrees. A comparative study is performed in Escaler and Mebarki (2018) to determine the current spectra of the faulty doubly-fed induction generator (DFIG) machine and the healthy machine, using CSA to monitor mechanical and electrical faults within the induction generator. In addition, exciting work has been done in Chandrasekhar et al. (2021) to determine the hidden fault frequencies in the non-stationary frequency spectra using CSA and artificial neural networks, delivering promising results.
Several traditional diagnosis methods have been used in WT systems to detect failures like bearing faults, for example, methods based on the analysis of the vibration signal, the acoustic signal, the temperature and the lubrication oil parameter (Gao and Liu, 2021). However, all these diagnostic methods need signal-acquisition devices with a high sampling rate. In addition, signals may be attenuated or interfere in the transmission process between defective components and sensors. Hence, electrical signal-based analysis methods have received more attention in recent years because they are non-invasive and cost-effective (Pandit et al., 2021).
Data-driven methods, also known as model-free models, only need historical system data to construct fault diagnosis systems (Jing et al., 2017). In Shi et al. (2017), real-time data is used to control the simulation process to achieve good fault detection performance. Environmental variations impact the fault detection capability of CMS; hence a controlled simulation framework is suggested. The need for a simulation framework is that it is often impossible to find multiple, identical fault signatures on geographically distant wind farms. Therefore, it becomes difficult to isolate the impact of the failures from the impact of other local factors. Thus, a controlled but realistic simulation setup is necessary for standardised performance comparison under different test scenarios.
For learning from data, several different models have been proposed such as support vector machines (SVMs), logistic regression, Gaussian process, decision tree, random forest, neural networks (NNs) and so on. Out of which SVMs and NNs are two popular machine learning models used for wind turbine condition and performance monitoring activities, for example, diagnostics and prognostics. In Stetco et al. (2019), recent literature on machine learning models proposed for condition monitoring in wind turbines is reviewed. Neural networks, support vector machines and decision trees are most commonly used. According to this study, around two-thirds use classification, the rest rely on regression.
Most of data-driven techniques aim to solve wind turbines problems related to classification and regression. Both, regression and classification algorithms are Supervised Learning algorithms and are used in machine learning for prediction and work with labelled datasets. The distinction between the two is how they’re applied to various machine learning situations. The main difference between regression and classification models is that regression algorithms are used to predict continuous values (e.g. price, salary, age and so on) whereas classification algorithms are used to predict discrete values (e.g. male or female, true or false and so on). Majority of machine learning techniques are classification to solve wind turbine condition and performance monitoring related challenges for example, fault labelling (Jing et al., 2017; Malik and Mishra, 2015). However, in recent year regression were also gaining its importance in solving many wind turbine issues, for example, online condition monitoring, forecasting and uncertainty quantifications (Chandrasekhar et al., 2021).
In the next sections, works that use regression and classification based models are presented. Both are ML approaches that apply supervised learning, that is, they use labelled input data to obtain the output. For supervised learning we distinguish between models that predict a numeric variable (regression) or a categorical variable (classifiers). Learning in models translates into fitting a model’s parameters to a specific dataset, iteratively updating them with several passes through the data until a specific predefined function is minimised (Stetco et al., 2019). The use of unsupervised methods for wind turbine CM has been relatively less explored.
Regression models
In CM, it is equally important to model the healthy state of components and subcomponents to detect faults and predict failures. Ideally, the normal behaviour data should be recorded when the failure rate is low, that is, the Weibull parameter equals one (Tautz-Weinert and Watson, 2017). Regression models take inputs (independent variables) and predict the output (dependent variable), which is numeric. They can be applied over a single WT component’s data or for the entire WT analysis, like in a power curve where the whole WT data is a black box to the model. Regression model can be parametric or non-parametric. Parametric models have a finite set of parameters in a parametric vector. At the same time, non-parametric models are defined by parametric vectors which are unbound in length (Shi et al., 2017).
Bogoevska et al. (2017) proposed an interesting overview of the bi-component condition/performance monitoring strategy a for wind turbine that incorporates both environmental and vibrational datasets as shown in Figure 3. This framework monitors the wind turbine dynamics over the complete operating spectrum of the structure that depends on changes in wind flow profile, stochastic loads caused by turbulence together with uncertain environmental conditions. They proposed the threshold autoregressive moving-average models (TARMA) model combined with the PCE method and suggest that the synergy between these two models enables a holistic assessment of a wind turbine structure interacting with its environment.
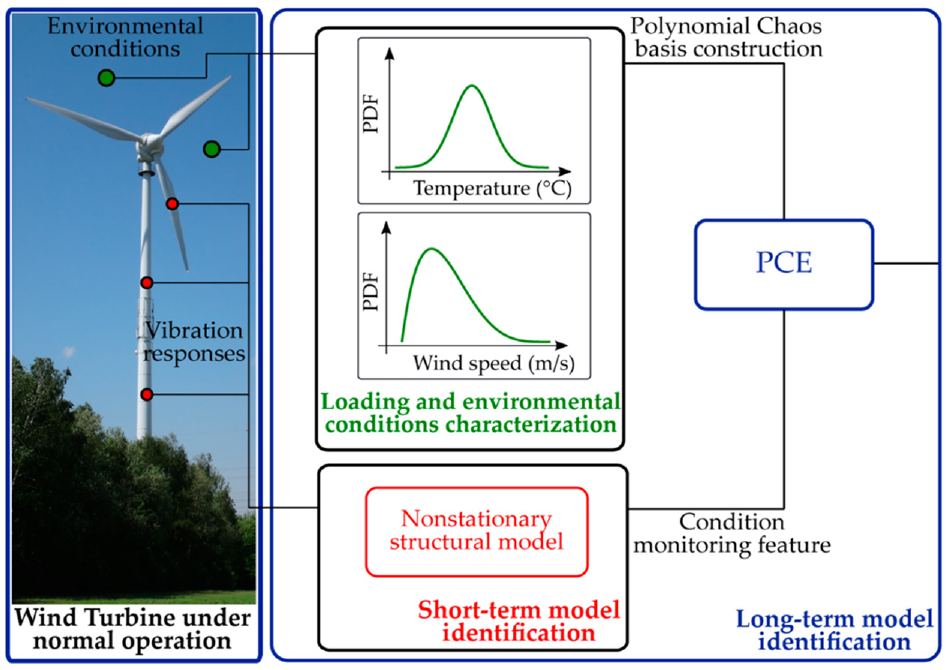
Schematic overview of the proposed bi-component monitoring strategy (Bogoevska et al., 2017).
Choosing which regression model to consider can be decided by comparing models. It is essential to consider issues such as intercorrelation and covariance within the data before applying regression techniques (Gougam et al., 2021). Standard regression analysis fails when dealing with non-stationary variables. It shows spurious regressions, that is, suggesting a relationship even when there is none, between feature and output. Dao et al. (2018) suggest a cointegration analysis approach to avoid the spurious regression issue, reduce the computational resources and deal with the undesired effect of environmental and operating conditions on the analysed data. Some non-stationary time series have the cointegration property where a linear combination can produce a stationary residual. This residual is used in control charts as a potential damage indicator or effective damage feature. The wind speed is the critical parameter; its non-linear relationship with other parameters was identified. Calculation of the optimal cointegration vector improves the fault diagnosis results.
The analysis of the WT power curve aid in energy assessment, warranty formulations and performance evaluations. Power curve deviation could suggest anemometer error, power transducer calibration error or controller setting error. A consistent significant deviation from the reference power curve may be due to blade damage, yaw drive issues or possibly tremendous wind shear or wind veer for below-rated operation (Pandit and Infield, 2018, 2019b). Wind turbine blades require a robust structural condition monitoring technique as it is an essential component in the wind turbine framework, which cost about 20%–25% of the total turbine cost (New Energy Update, 2017). Reconstruction models have demonstrated satisfying performance in abnormality detection in WT components, generally using PCA, ANN, Auto-Association Kernel Regression (AAKR). A support vector regression (SVR) based model is proposed in Yang et al. (2019) for reconstruction modelling to predict early fault in the component and used penalty factor and slack variables in the computation. Furthermore, it suggested that the SVR algorithm can identify outliers in model construction and filter out noise in training samples to some extent. Probability indicators (such as health index) are easy to fuse and better balance missed and false alarms. Alarms are generally based on comparing a single signal with corresponding thresholds. For example, in Figure 4 the health index is successfully able to detect three temperature high fault points at an early stage. A similar approach is proposed in Castellani et al. (2021) for the diagnosis of an electrical fault to a wind turbine DFIG. A normal behaviour model for the power of the wind turbine is established through a multivariate SVR whose input variables are selected based on correlation coefficient and subsequently reduced in dimension through PCA. The fault incipience is diagnosed through a novelty index elaborated from the residuals between measurements and model estimates.
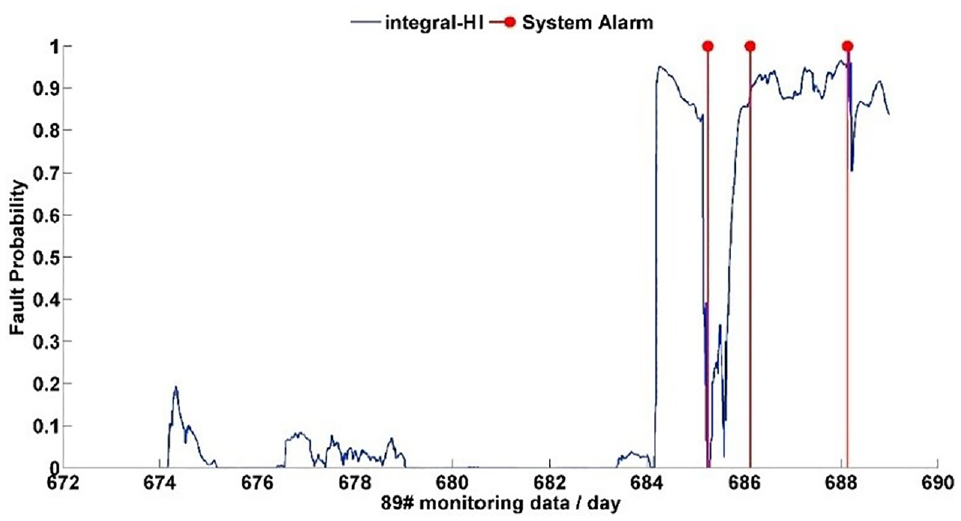
Integral Health index of a wind turbine (Black et al., 2021).
In Schlechtingen and Ferreira Santos (2011), a comparative study is performed on the regression model to predict early gearbox damage before it reaches to catastrophic stage. In this paper, the authors suggested a threshold based approach for the regression-based model to improve sensitivity against anomalies and the number of false alarms. Autoregressive ANN outperformed regression-based models in terms of accuracy and predicted days before the defect occurs. Furthermore, the ANN can give higher weightage to signals that represent the patterns in the output signal as compared to the highest correlation to the target signal method of regression. Thus, improving the model’s performance, as implementing regression on one input signal, can affect the correlation of the prediction error of the other input signals.
In cold climates, WTs experience energy production loss due to icing. Molinder et al. (2021) employed a quantile regression forest algorithm to forecast the icing-related production loss probabilistic. They included data from different stations to test the influence of location on the icing loss. Splitting the data into a 10-day chunk method for cross-validation showed a higher forecast skill using RMSE. However, some extremes could not be forecasted due to the model’s predicted production loss and observed production loss had low variability. This uncertainty forecast may greatly value the wind energy trading involving power production loss estimations because it can provide cost-loss estimations for the decision-maker. A regression-based method for blade icing detection is proposed in Guo and Infield (2021), based on the XGBoost method. Two models are employed: the former targets as output the produced power and the input variables are wind speed and blade pitch angle; the latter is a model for the rotor speed and the input variables are wind speed, produced power and generator torque. The residuals between model estimates and measurements are elaborated through a Sequential Probability Ratio Test in order to robustly detect the icing occurrence.
Iannace et al. (2019) developed sound pressure level prediction models built on the receiver. The model based on the random forest showed higher values of the Pearson correlation coefficient (0.981) than the multiple linear regression model (0.897). In Figure 5, it is visible how the predicted data by random forest show very little isolation and are more like the actual data, whereas the multiple linear regression model shows greater isolation, indicating more error. This random forest model effectively predicts noise produced at the receiver from the system in different operating conditions. Installation of the model is also easy, inexpensive and very useful for the receiver and wind farm managers.
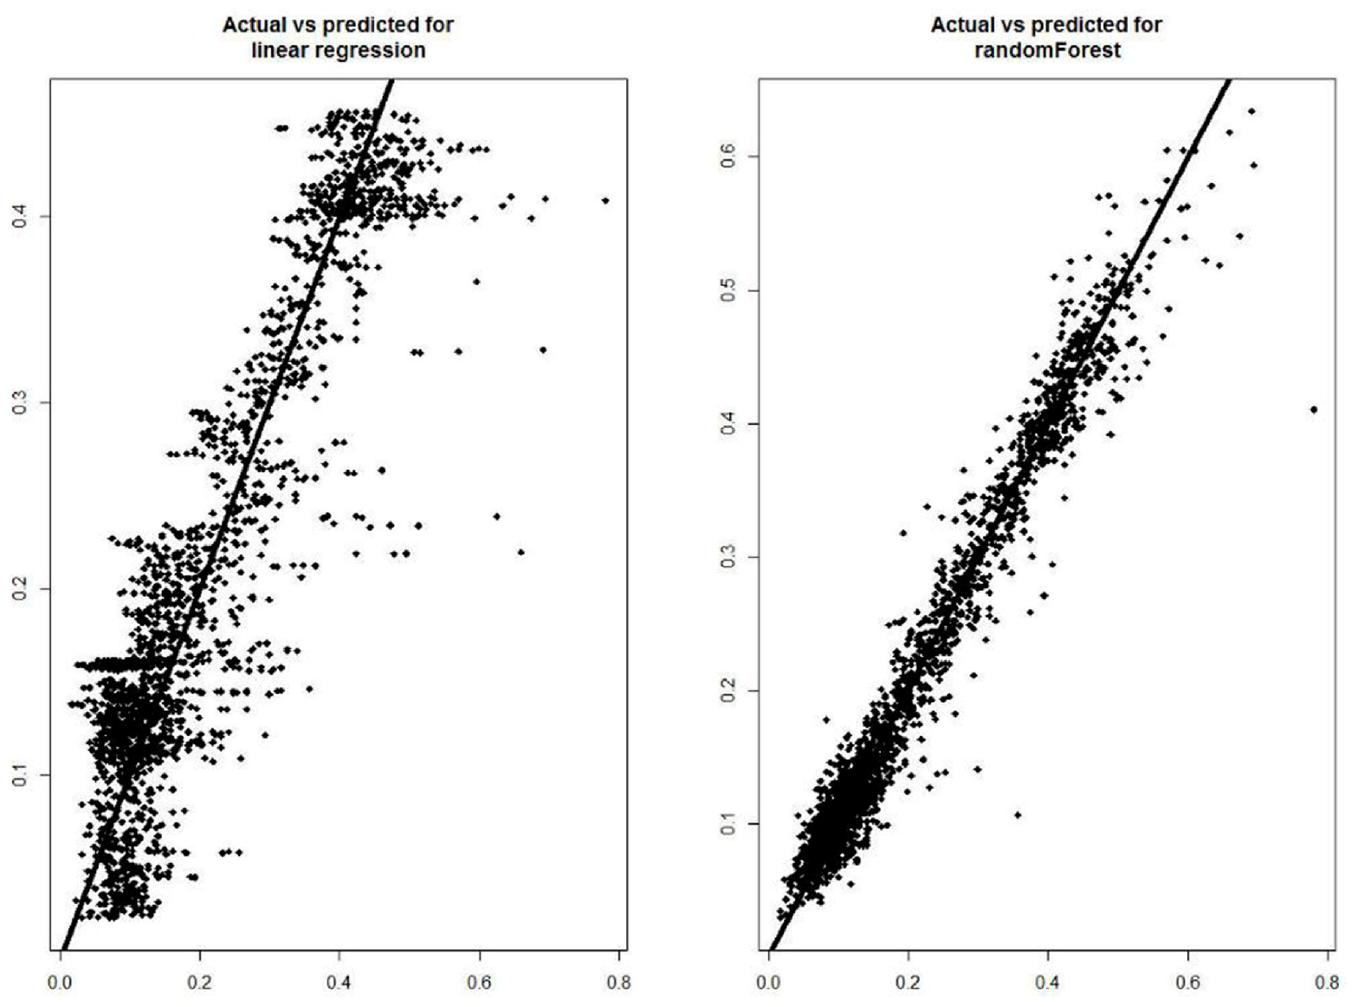
Actual versus predicted values for both the tested models (Multiple linear regression model at the left, Random Forest model at the right) (Iannace et al., 2019).
Classification models
Classification is the process of recognising, understanding and grouping objects into pre-set categories. Here, it refers to predicting a model that can assign (or predict) a class label for the input data. The model uses train data to map out the most suitable class labels for that input data. The class label can either be numeric or can have a string value. Classification accuracy is a good metric to evaluate the model’s performance. Classification can be categorised into four types−(1) Binary classification (only two class labels – normal and abnormal state), (2) Multi-class classification (multiple class labels, greater than two), (3) Multi-label classification (two or more class labels for each instance) and (4) Imbalanced classification (unequally distributed classes) (Browniee, 2020; Ruiz et al., 2018).
In wind turbines, anomaly detection can be considered a good classification problem where the task is to label the incoming data either to healthy or unhealthy (due to anomalies). For example, Chen et al. (2020), proposed modulation signal bispectrum (MSB) detector for diagnosing bearing faults in DFIGs of WT, and overlapped segmentation is proposed to improve computational accuracy with limited data. Since vibration caused by bearing faults led to the quadratic phase coupling (QPC) and the amplitude modulation (AM) in current signals, the MSB algorithm was found to be an effective, space-saving method to retrieve modulation information from data. In contrast, traditional methods based on a single spectrum were only concerned with the amplitude. To determine the failure of high-speed shaft bearing (HSSB), a vibration-based diagnosis methodology for WT high-speed bearing is proposed using PCA in Maatallah et al. (2020). Though this method fails to predict the exact date of failure in advance, it showed good accuracy in monitoring the component’s health. PCA and hypothesis test are employed in Pozo et al. (2018) for diagnosing faults on data simulated through the FAST (Fatigue, Aerodynamics, Structure and Turbulence) software for the 5 MW NREL wind turbine prototype.
The power coefficient (Cp) tells us how efficiently a WT converts wind energy into electricity. Asghar and Liu (2017), have tried to design an Adaptive neuro-fuzzy inference system (ANFIS) to estimate the power coefficient. It is a hybrid technique integrating neural network and Takagi-Sugeno fuzzy inference system. In an ideal circumstance, it would be expected that the total wind energy gets converted into power (electricity), but practically that is not possible in real-time. The most optimal output a wind turbine can produce is 53% of the wind energy input (Betz limit). Reduced extracted power is a secondary effect also of blade icing, which in Tao et al. (2021) is individuated through a classification algorithm based on stacked-XGBoost applied to a mixture of long and short-term features which include for example the rotational speed, the produced power and the blade pitch.
Diagnosing WT generator failure using CMS is expensive. The method proposed by Zhao et al. (2016) does not require any additional hardware beyond the SCADA system for determining WT generator failure. They proposed a method to predict generators’ remaining useful life (RUL) using the Anomaly Operation Index (AOI), which determines performance degradation in runtime. SCADA monitors the runtime operation condition of WT, such as temperature, speed and power. Such information may be leveraged to support generator prognosis. However, SCADA data is limited as compared to CMS data, making it challenging to predict failure. This method proposes an autoregressive integrated moving average (ARIMA) based statistical model to conduct online prognostic and a time series analysis-based RUL estimation method to provide accurate RUL prediction. The AOI is analysed based on prior historical failure data to predict performance. With the help of advanced data mining algorithms like DBSCAN (density-based spatial clustering of application with noise) and SVM algorithm, the normal and anomaly can be identified at runtime. This makes this experiment a more efficient and affordable failure detection method. The diagnosis of wind turbine generator faults through classification methods is pursued also in Jin et al. (2021), where an online classification monitoring is formulated based on the Mahalanobis distance with respect to a set of features in a healthy reference state.
One of the most straightforward and robust techniques, the bagged decision tree (DT), is used in Abdallah et al. (2018) on 48 WT data to estimate vibration faults and link to their root causes. Data-driven automated root cause analysis is performed using bagging DT to programme the sequence of events leading to the root node of the DT. This can as well be applied in simulation scenarios to replicate faults. The model could trace to the root node, but more experiments should be conducted to verify different scenarios and conditions. Pandit and Infield (2018) propose two methodologies, namely, Gaussian process and IEC binned based on power curve to detect yaw misalignment failures. Result suggests that both techniques are effective in identifying yaw failure in advance, but GP outperform binning.
It is worth noting that extensive SCADA data points in the model can lead to computational cost issues or high processing power. Hence, it is crucial to maintain a balance while implementing data-driven ML approaches for better accuracy. The sparse representation technique can significantly compress the measured signal into a few nonzero coefficients as the signal projection on dictionaries, solving the massive data problem in WT (Wang et al., 2019). The fault features of wind turbine bearings are extracted from measured current/vibration signals. However, this method will only work when the model represents the mathematical function of the dictionary. The general principal component (GPCA) and the K-singular value decomposition (K-SVD) are more adaptive to represent signal data, but the learning process is complex and time-consuming (Zhao et al., 2016).
Analysing and determining fault indicators corresponding to fault modes help in unscheduled shutdowns. Liu et al. (2020). analyse three main system failures – generator failure, converter failure and pitch system failure. They extract indicator data from the SCADA dataset and generate radar charts, as shown in Figure 6. SVM is used for graphic detection accuracy analysis of the radar chart. Using the Level Cooccurrence Matrix (GLCM) features of the chart, mean and variance are extracted from the chart, the limitation being that it can only be applied over a small sample of charts (250 here). Nevertheless, the model effectively detects the system operation status with and without faults with more than 80% accuracy. Using CNN for the same gives up to 98.8% accuracy, suggesting being the more accurate model. Also, it can be applied over larger data samples, making it a more robust model.
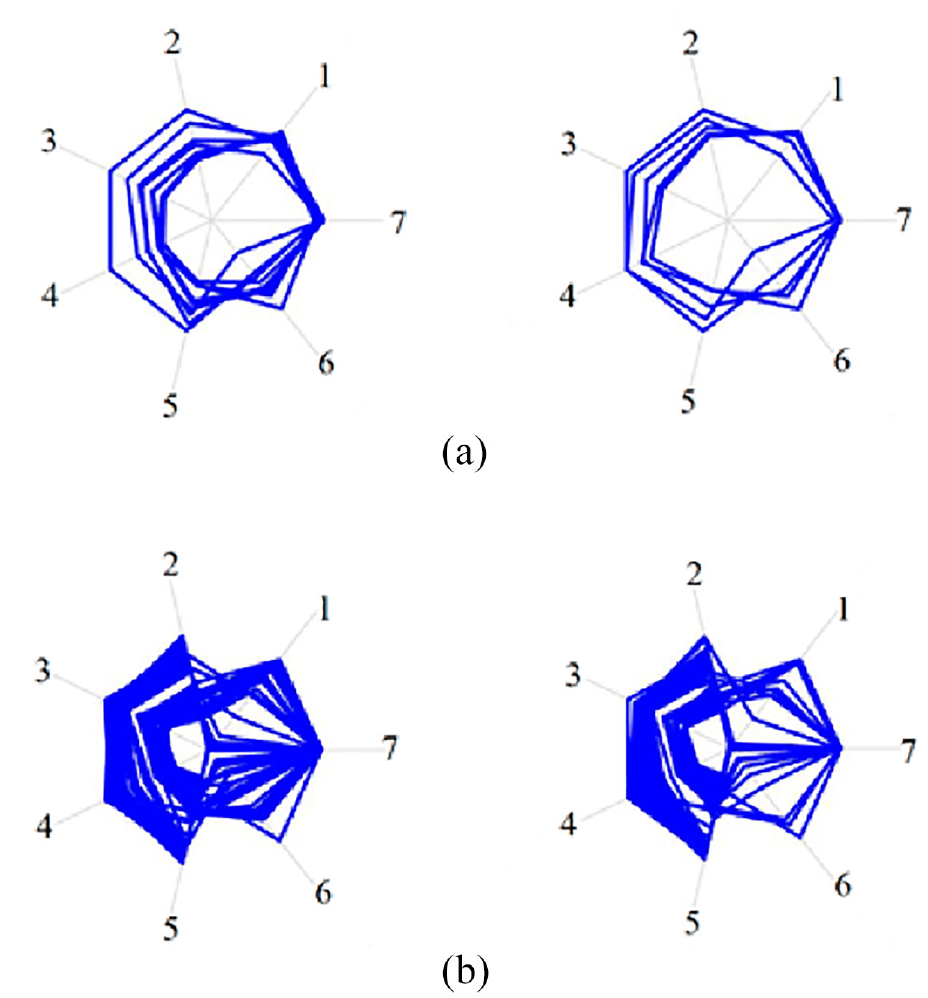
Indicator data radar chart (Liu et al., 2020): (a) radar charts with indicators data under normal generator operation and (b) radar charts with fault indicators data under generator faulty operation condition.
Models performance validation
Validation is used to evaluate a given model and estimate an unbiased generalisation performance. A standard approach in ML is to use cross-validation techniques. There are several validation techniques; some of the most common ones are k-fold cross-validation (to minimise sampling bias), holdout set (to avoid overfitting of the model), Leave-one-out-validation (LOOCV) (Grootendorst, 2019). It is often used to fine-tune the model’s hyper-parameters, indirectly affecting the model (Shah, 2017). It is done during the training phase. While optimising the hyperparameters, the model can get overfitted by fitting the model to the train data. To avoid this, a validation set, and an additional hold outset can be incorporated.
For regression models, the validity can be measured through the distances between the predicted output vector of the model and the actual output vector of the system, using mean absolute error (MAE), root mean squared error (RMSE), coefficient of determination, mean absolute percentage error (MAPE) and symmetric mean absolute error (sMAPE).
Validity for classification models is measured by the accuracy, recall, precision, specificity and F1 score of the model (Black et al., 2021). For example, to determine if the wind direction impacts the WT power curve, Marčiukaitis et al. (New Energy Update, 2017) used MAPE to measure the accuracy of their model. Another practical idea shared in Marčiukaitis et al. (2017) is considering the mode approach (rather than the traditional mean approach) to eliminate the outlier for modelling as it gives the most probable values of the power curve and leave-p-out cross-validation method, performing 8.4% MAPE, which is good accuracy. Overall, the model has performed well, and the methods used were computationally simple and less time-consuming.
Data-driven frameworks to support the WTs maintenance decision-making process
The data-driven approach is primarily used in analysing large real-time datasets to solve numerous challenges associated with O&M activities and has become necessary in recent years for offshore WTs to improve availability and reliability at reduced costs (Gopalakrishnan et al., 2022). Offshore O&M directly influences power production and depends on various factors like component health conditions, environmental conditions, component degradation, maintenance plans, etc.
The operational efficiency of the WT is calculated by considering the utilisation losses and speed losses of the WTs, and these losses reduce the productivity of the WT. During downtime, the WT is not utilised, causing idling loss, affecting the productivity of the WT. In Reder et al. (2018), it is discussed that the specific components’ failure rate increases by increasing the wind speed. In addition, factors like temperature and humidity affect the failure rate due to corrosion and degradation of the components. Therefore, short-term wind changes need to be analysed prior to obtaining the conditions leading to component failures. This improves the component repair time in case of failures, reducing the O&M cost to some extent. Some of the critical parameters to consider for analysis are wind speed, relative humidity, ambient temperature, output power production, downtime severity and maintenance strategy.
Sustainability has gained much importance for now and the future generations. Performance evaluation is necessary for sustainable initiatives (Kumar et al., 2018). To minimise the time and cost of repairs and maintenance of the WT, robust algorithm architectures like SVM, CNN, ANN, logistic regression, KNN, random forest and several others are built, supporting sustainable maintenance management practices (Zhang et al., 2019). Predictive maintenance is done before the breakdown of the components and system. It is well-calculated and scheduled. Condition monitoring, on the other hand, continuously keeps finding failure patterns in components and systems. It has been proven that CM has significantly reduced the O&M costs of the WT (Aikin, 2020).
Conclusions and further developments
Due to the advancements in data-driven technologies, SCADA data started finding an application in reducing O&M cost and improving wind power generation, especially in CM and PM areas. In addition, SCADA data-based data-driven techniques were found to be effective in developing robust decision support systems, resulting in fewer maintenance interventions to offshore wind farms. In this study, an attempt has been made to review the SCADA data-based methods developed in the last 5 years for WTs condition and performance monitoring activities.
Data-driven techniques are employed for classification and regression tasks and suggest that classification-based data-driven models are more widely used than regression models. However, other algorithms (e.g. probabilistic, deep learning and so on) have also started finding significant attraction in recent years.
A very critical aspect of SCADA-based literature about wind turbine condition monitoring is data availability and quality. On one hand, several studies cited in the present paper employ synthetic data sets produced by mathematical models: these have the pro of being potentially available to the whole scientific community but have the drawback of not fully reflecting the real-world operation conditions of wind turbines. On the other hand, in the latest years the number of studies dealing with real-world SCADA data sets has been remarkably growing: typically, this kind of studies develops as the result of the collaboration between a company and a particular research group working in academia and the data are protected by confidentiality agreement. This bottleneck obstructs progress in the development of modern technology significantly because it hinders scientific collaboration on the same problem and on the same data. Therefore, it is desirable that the attitude of each wind energy company advances towards a more genuine open access mentality: a concrete development without drawbacks would be, for example, the disclosure of at least few selected data sets to the scientific community. This would create the conditions for the major step forward which is needed.
Actually, from the literature discussion conducted in this paper, it arises that the structure of most studies regarding SCADA-based condition monitoring is the following: a fault test case is selected and a method is proposed, whose superiority with respect to other state of the art methods is discussed. This structure is substantially consolidated and what is missing in the literature is the demonstration that methods can be formulated which are capable of diagnosing reliably a large number of a given class of faults (for example, drivetrain faults). For this reason, companies should be encouraged in sharing (possibly open access) long data sets which include, as typical in the lifetime of a wind farm composed by many wind turbines, a large number of faults of different types and scholars should be encouraged in applying to this kind of problems.
Actually, the best data-driven model relies on solving issues, as no single model will outperform others across all datasets and tasks. Also, from the present literature review, it arises that feature selection and extraction can increase the model’s accuracy, but caution should be exercised while lowering the dimension of the data to avoid overfitting the model. However, recent studies suggest that as data volume expands, deep learning (DL) techniques may outperform more standard models in terms of accuracy. However, DL is computationally expensive and may require high computational recourses while working with large datasets and this is critical in the perspective of industrial applications.
Footnotes
Appendix
Declaration of conflicting interests
The author(s) declared no potential conflicts of interest with respect to the research, authorship, and/or publication of this article.
Funding
The author(s) received no financial support for the research, authorship, and/or publication of this article.