
Abstract
Condition monitoring of wind turbine gearboxes has mainly relied upon vibration, oil analysis and temperature monitoring. However, these techniques are not well suited for detecting early stage damage. Acoustic emission is gaining ground as a complementary condition monitoring technique as it offers earlier fault detection capability compared with other more established techniques. The objective of early fault detection in wind turbine gearboxes is to avoid unexpected catastrophic breakdowns, thereby reducing maintenance costs and increase safety. The aim of this investigation is to present an experimental study the impact of operational conditions (load and torque) in the acoustic emission activity generated within the wind turbine gearbox. The acoustic emission signature for a healthy wind turbine gearbox was obtained as a function of torque and power output, for the full range of operational conditions. Envelope analysis was applied to the acoustic emission signals to investigate repetitive patterns and correlate them with specific gearbox components. The analysis methodology presented herewith can be used for the reliable assessment of wind turbine gearbox subcomponents using acoustic emission.
Introduction
Wind power is one of the world’s fastest growing renewable energy sources with an ever increasing importance for the sustainable growth of the global economy. In 1990, the world wind generation capacity was approximately 2 GW. By the end of 2013 this had risen to 318 GW. 1 Typical sizes of modern turbines are from 1 to 3 MW nominal generator power and a rotor diameter ranging from 80 to 100 m but larger prototypes up to 5 MW and with a rotor diameter of 126 m have now been installed. 2 Wind power production has the potential not only to address the looming global energy crisis but also to be the cheapest energy source available to the global economy. However, wind power production is still an emerging technology and, therefore, it faces significant technological barriers which are directly related to operational reliability, maintenance, lifetime and grid integration of wind turbines and wind farms. Unpredictable failure of certain wind turbine components, such as turbine blades, tower, gearbox, generator, braking system, yaw system, etc., can lead to substantially higher maintenance costs and reduced availability of wind turbines. A crucial problem faced by the wind turbine industry is the reliability of rotating components, especially the gearbox. 3
The wind energy industry has experienced high gearbox failure rates from its inception. 4 In wind turbines, the price of the transmission system is usually between 15% and 20% of the total turbine value. Whitby 5 reported on 20% gearbox-related failure on 200 NEG-Micon 65 wind turbines with over 10,000 h of operation. Any downtime due to gearbox failure is costly and needs to be avoided with the use of condition monitoring (CM) systems. There have been continuous challenges in designing robust CM systems capable of diagnosing damage in its early stages of development and predicting the remaining life of the rotating machine.
There are different technologies being used for the purpose of monitoring gearboxes. Vibration and oil analysis monitoring are among the most popular methods of CM used in the wind energy industry.6,7 The oil analysis monitoring involves analysing and measuring the wear particles and contaminates inside the lubricant. This method is very time consuming as is it mostly applied offline and requires fairly advanced and expensive laboratory equipment. 8 Vibration analysis is an established technique for gearbox CM.9,10 However, it has two main drawbacks (i) the low sensitivity to fault detection in low-speed rotating machines and (ii) limited capability of defect detection at an early stage. On the other hand, acoustic emission (AE) is gaining ground in gearbox defect detection as it overcomes the two drawbacks previously presented for vibration analysis.
AE is commonly defined as transient elastic waves generated during rapid release of strain energy, caused by a deformation of damage within, or on the surface of a material. 11 An advantage of AE over other non-destructive testing (NDT) methods, such as ultrasound is its passive nature. AE is a technique capable of detecting dynamic changes and effectively in detecting the initiation and progression of defects particular in metallic structures, where the attenuation of signal is low. The mechanical event can be produced by different sources such as cracks, plastic deformation, rubbing, cavitation, leakage, etc. 12 Particularly, AE in rotating machinery is produced by the interaction at the interface of two different surfaces in relative motion, i.e. asperity contact. An extensive review of AE applied to rotating machinery (bearings, gearboxes and pumps) was carried out by Mba and Rao. 13 In addition, AE has also been applied for the detection of rotor-dynamic faults. 14
Several studies have been carried out to detect defect in bearings using AE technique such as flaking or spalling.15,16 Mba 17 studied the changes produced in AE signals by changing the speed, load and defect size in the outer and inner race. The experiments showed that increasing rotational speed and load can cause an increase in root mean square (RMS) value. Small and large defects introduced in the outer race also resulted also in an increase in RMS value. However, in the case of defects in the inner race, the same tendency was not observed. In Rahman et al., 18 the application of AE to monitor rolling contact fatigue tests using a test-rig running under constant load and speed for detecting the incipient damage and damage location was investigated. The test rig consisted of just a ball instead of an entire rolling bearing. Thus, the system was simpler and the fault detection complexity was reduced. The authors concluded that the AE hit count rate is an important parameter to define incipient damage, its detection and the size of the damage during the damage propagation. Al-Ghamd et al. 19 observed that the primary source of AE was the material protrusions above the mean surface roughness and the burst duration was directly correlated to the seeded defect length along the race in the direction of the rolling action. Al-Dossary et al. 20 showed that the energy values correlated with increased defect severity for the inner and outer race. Furthermore, burst duration was shown to be as a good parameter to find geometric size of the outer race. However, this did not apply for the inner race defect.
In the recent past, several investigations have been published regarding the use of AE for fault detection in low-speed rotating machinery. This is vital for wind turbines as part of the drivetrain, which is connected directly to the blades rotates at very low speed. In addition, the limitation of vibration analysis to be applied for fault detection of low-speed rotating machinery magnifies the importance applying complementary techniques such as AE. 21 Elforjani and Mba 22 presented a study about the detection of degradation in bearings at low speeds. To accelerate the bearing degradation, one race of the thrust ball bearing was replaced with the flat race of the thrust roller bearing. The authors introduced information entropy as a new method to detect degradation in bearings and applied three non-linear power spectral estimation methods (Prony’s energy method, eigen-analysis and auto-regressive). They also correlated AE burst duration with defect size obtaining positive results. The authors remarked the potential of AE to detect defects in low-speed bearings. Widodo et al. 23 applied multi-class relevance vector machine for defect detection in low-speed bearings. This study was aimed at finding a reliable method for low-speed machines fault diagnosis based on AE signal. The result showed that multi-class relevance vector machine offers a promising approach for fault diagnosis of low-speed machines.
There is a limited number or publications regarding the use of AE to monitor the integrity of wind turbine gearboxes.24–26 Currently most of the wind turbine gearboxes CM systems are based on vibration measurements, which often suffer low signal-to-noise ratio (SNR) because the accelerometers are usually installed in the case. 27 To overcome this problem AE can be applied due to the higher SNR in comparison with vibration analysis, which allows the detection of defects at an earlier stage.28,29
The main aim of this study is to present the concepts, field tests and how AE can be used as an alternative to the existing methods such as vibration analysis and oil analysis. The approach reported here has the potential to be simple, reliable and suitable for early stage diagnosis. For this reason we report the use of AE technique for monitoring the wind turbine gearbox. With this aim, AE sensors have been installed in the gearbox of a real wind turbine. The results shown in this paper show high variability of AE signals measured in the gearbox with varying wind turbine operational conditions.
Acoustic emission as a technique for condition monitoring
AE is a well-established NDT technique that allows defect initiation and evolution to be monitored in a component. Since it is a passive technique, it does not require excitation of the sensors but relies on the detection of surface displacements caused by AE activity. In rotating machinery, these displacements are caused by the high-frequency noise generated by the interaction of the interface of two different components rotating with respect to each other. AE is also capable of detecting dynamic changes and, therefore, capable of monitoring evolution of damage effectively and efficiently in various materials including metals, composites, fibreglass, plastics, ceramic, wood and concrete. 30 Thus, it is well suited for deployment in wind turbines.
The AE signals that arise from a defect travel at a distance from its origin in the form of ultrasonic waves. These signals are detected by AE sensors placed in pre-determined positions on a component or structure. Typical AE sensors normally incorporate piezoelectric elements that operate in a frequency range from 20 to 1000 kHz (above the audible range of 20 Hz to 20 kHz) and allow the generated mechanical AE signal to be converted to an electrical signal. The sensors used are often of resonance type operating in a narrow frequency range. Due to the low amplitude of the signals generated by the AE sensors (usually made of piezoelectric material), the signal is first amplified between 20 and 60 dB and then is filtered before being further amplified and digitised for further processing. There are two types of major AE signals, continuous and burst. In the case of the continuous signal the amplitude varies with AE activity, while in the case of the latter, the pulses are of short duration and associated with the release of discrete strain energy; the amplitude of this type of burst activity is greater than the continuous type.
Signal processing applied to acoustic emission signals
Health assessment in wind turbine gearboxes is usually carried out by trending features extracted from the AE signals. In numerous studies, standard AE parameters have been used to identify different AE mechanisms
31
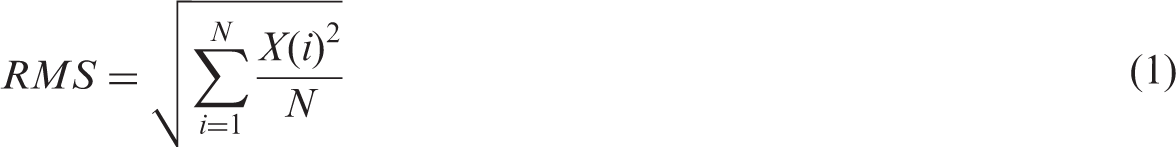
or gearbox degradation.32,33 In this investigation, several features are extracted from the AE signals captured from a wind turbine gearbox. Assuming a defect-free machine, the signals vary significantly according to its operational state. Thus, to allow for meaningful comparison the features have been classified in groups or ‘bins’ for each state. The bin classification can be performed according to wind turbine rotating speed or power output. However, as in the test wind turbine the rotating speed is fix, the power output has been selected as parameter for bin classification. The RMS, peak value, crest factor (CF), information entropy (IE) and counts are extracted from the waveform. The ‘counts’ parameter is defined as the number of times the signal crosses a given threshold value. However, it has been shown that the relationship between bearing mechanical integrity and AE counts is independent of the chosen threshold level.
34
Define x(i) the ith data point of the AE signal. Then, RMS, peak value, CF and IE are defined as follows


The IE is a measure of the uncertainty; that is to say as the component deteriorates, the uncertainty or entropy increases, flagging potential failures. Elforjani and Mba 22 showed that by employing IE, the presence of a crack onset and its propagation can be detected by the AE technique.
To obtain further information from the gearbox condition, envelope analysis is applied to the AE signals to detect periodic increases in the amplitude of the signal, correlating these periodicities to specific faults. It is mostly used in vibration analysis to detect defects in inner race, outer race and rolling elements; however, it has been successfully applied to bearing and gearbox defect detection using AE.22,35 The process of extracting the envelope of a signal has two different steps: signal rectification and a Hilbert transform (HT). The HT application to the signal provides additional information about the amplitude, instantaneous phase and frequency of vibrations.
36
The HT h(t) of a function x(t) is defined as

The HT of x(t) (
Experimental setup
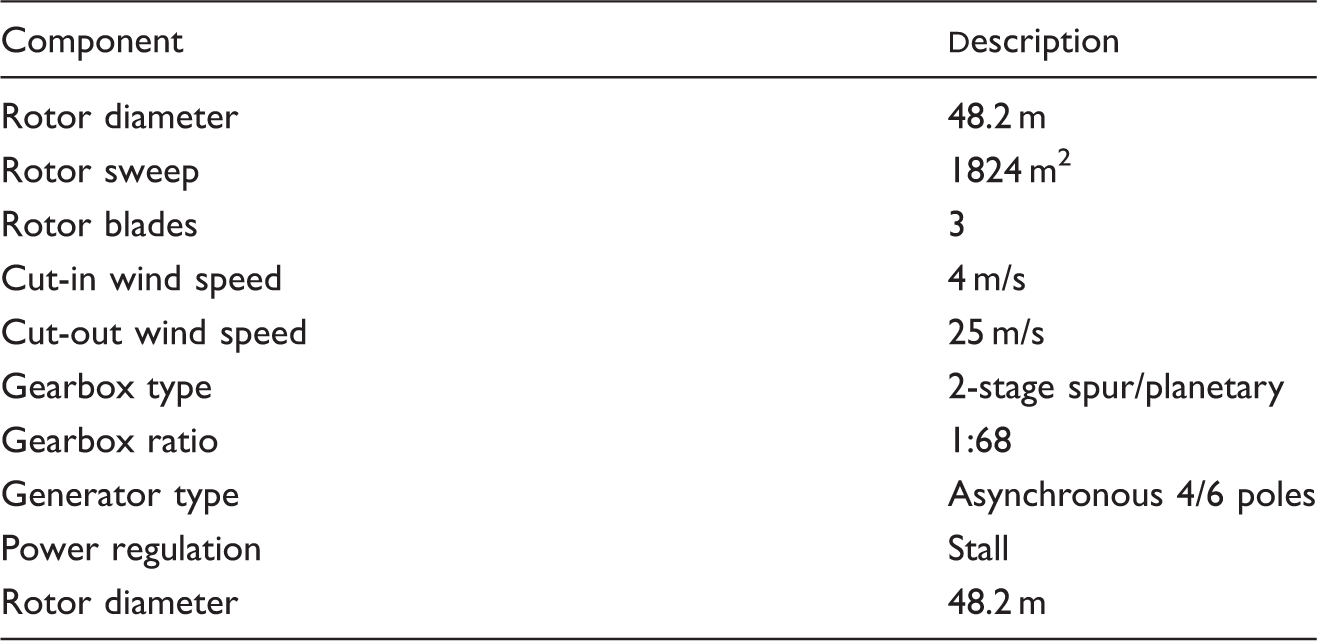
In this work, the potential use of AE for monitoring wind turbine gearbox is evaluated with real-life testing on NEG MICON NM-48 wind turbine (Figure 1) located at the ‘Center for Renewable Energy Sources’ (CRES) in Greece. The NEG MICON NM-48 is a 750 kW stall-type wind turbine rated to operate within a wind speed range of 4–25 m/s. A selection of the specification for the wind turbine (Gearbox, Generator etc.) is given in Table 1.
Wind turbine NM750/48 at CRES wind farm in Lavrio (Greece). Specifications of wind turbine.
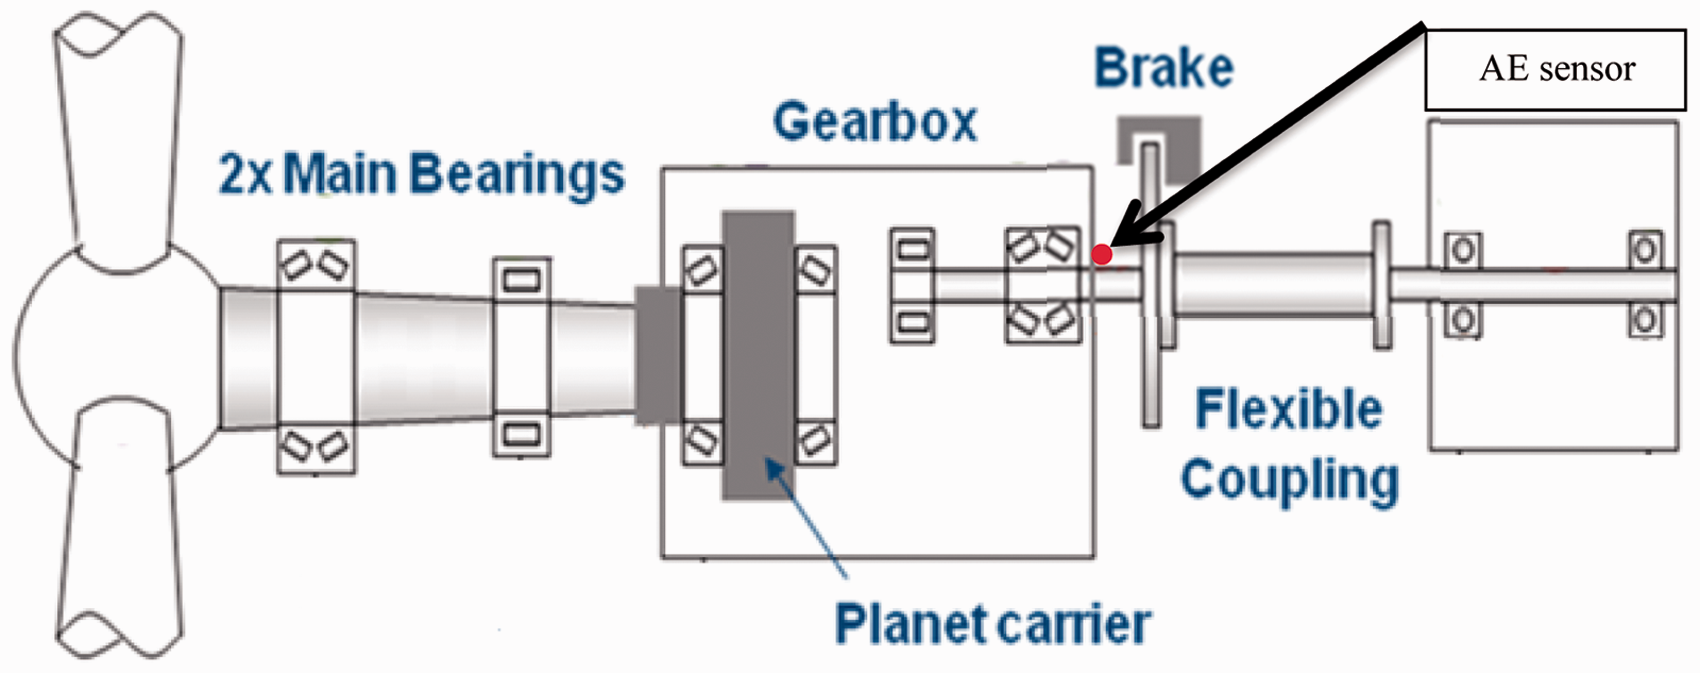
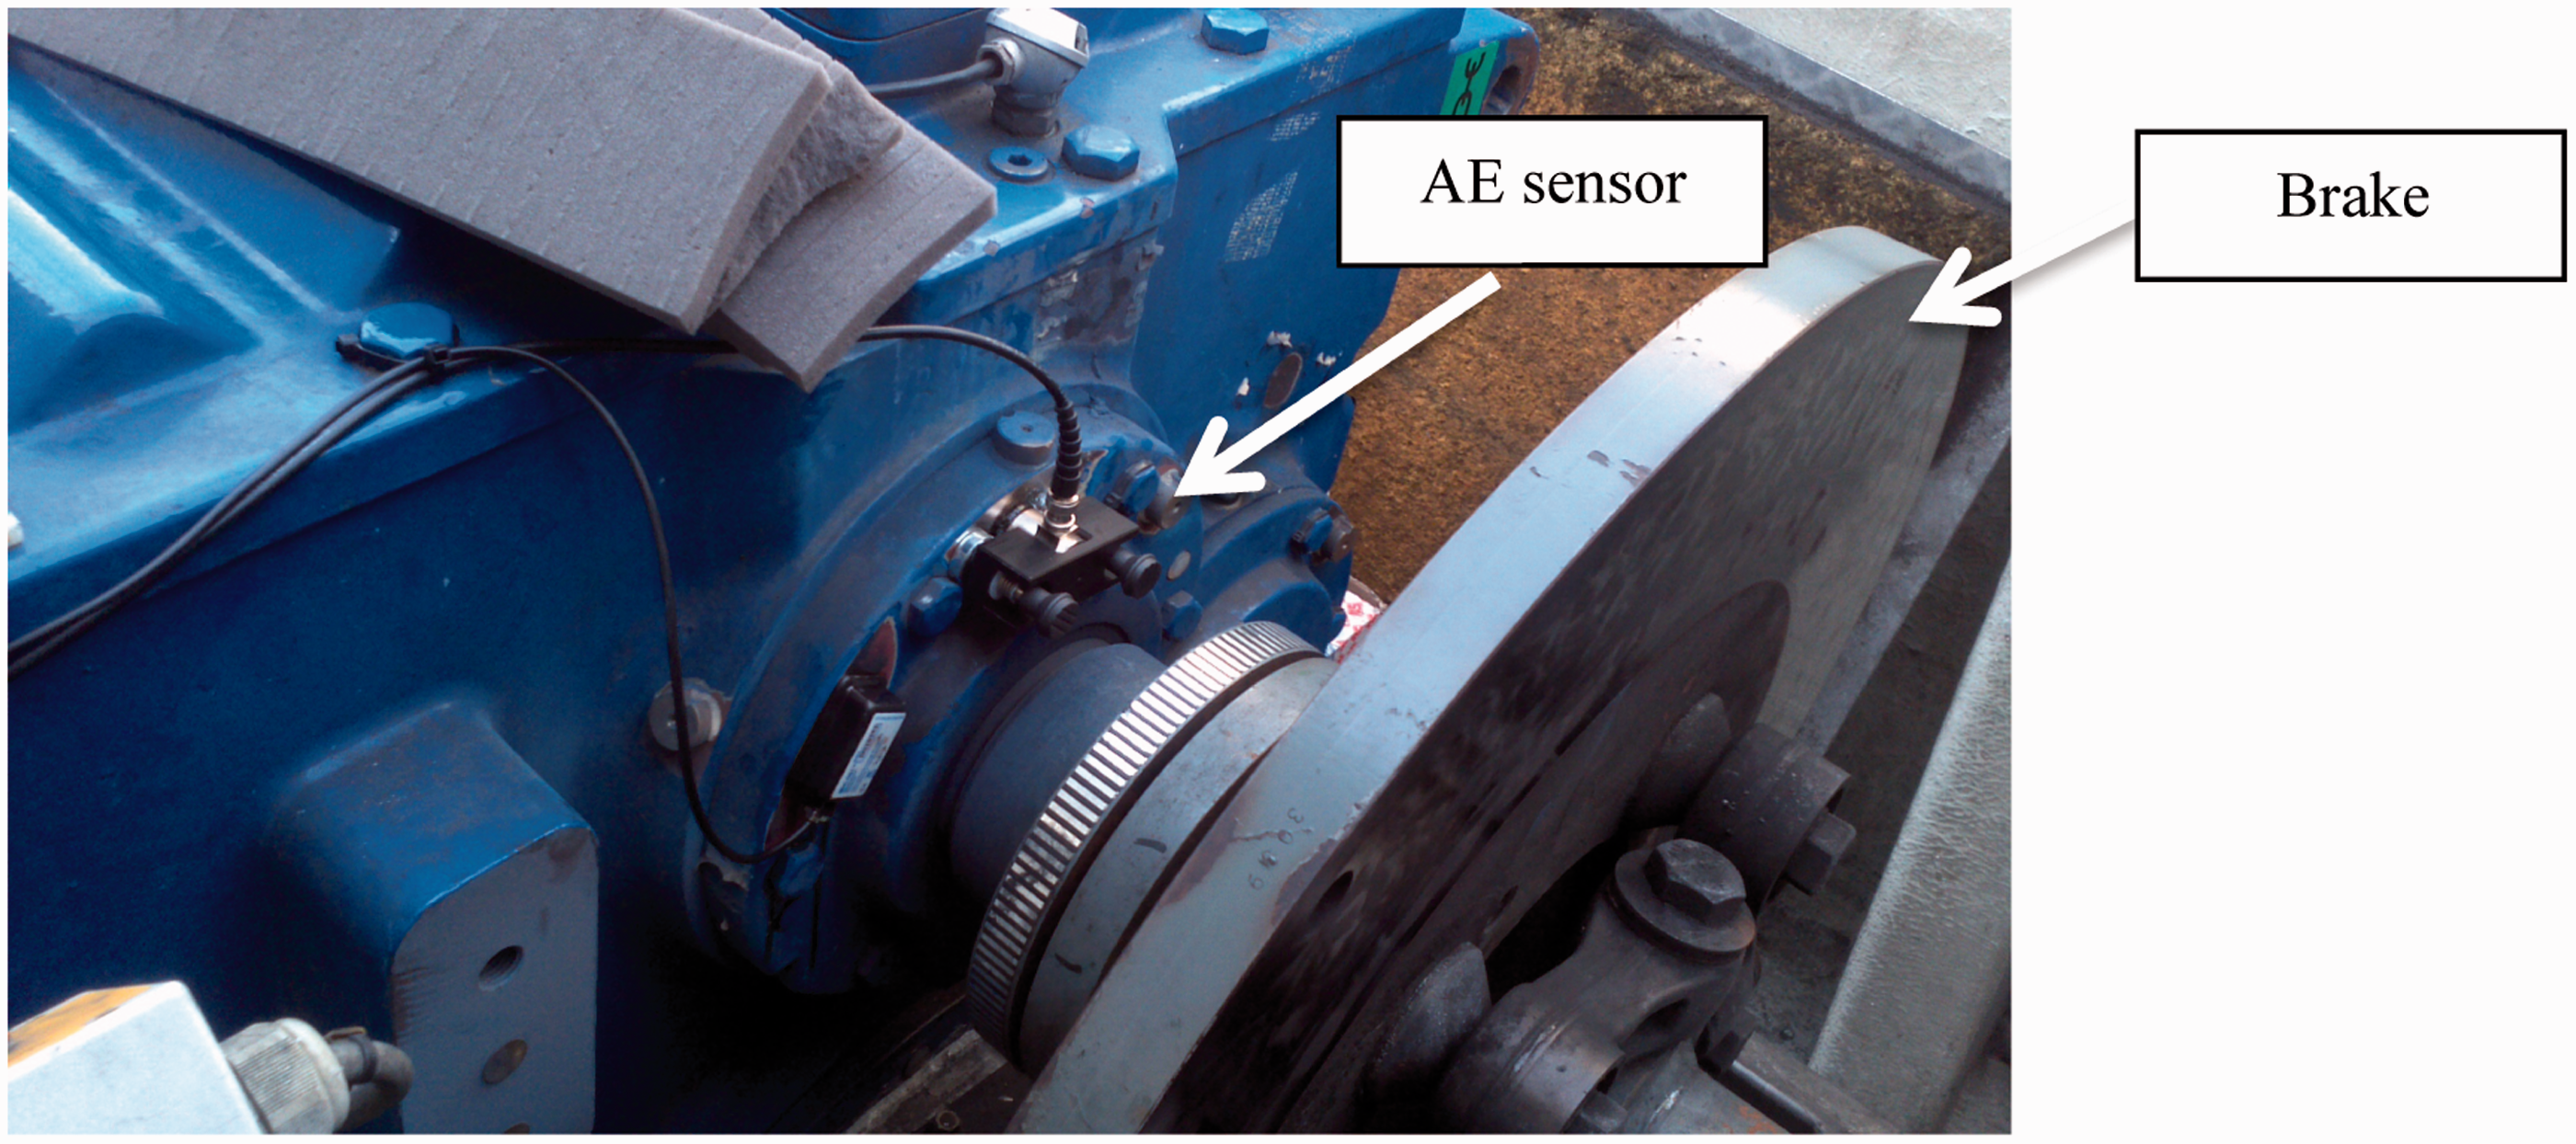
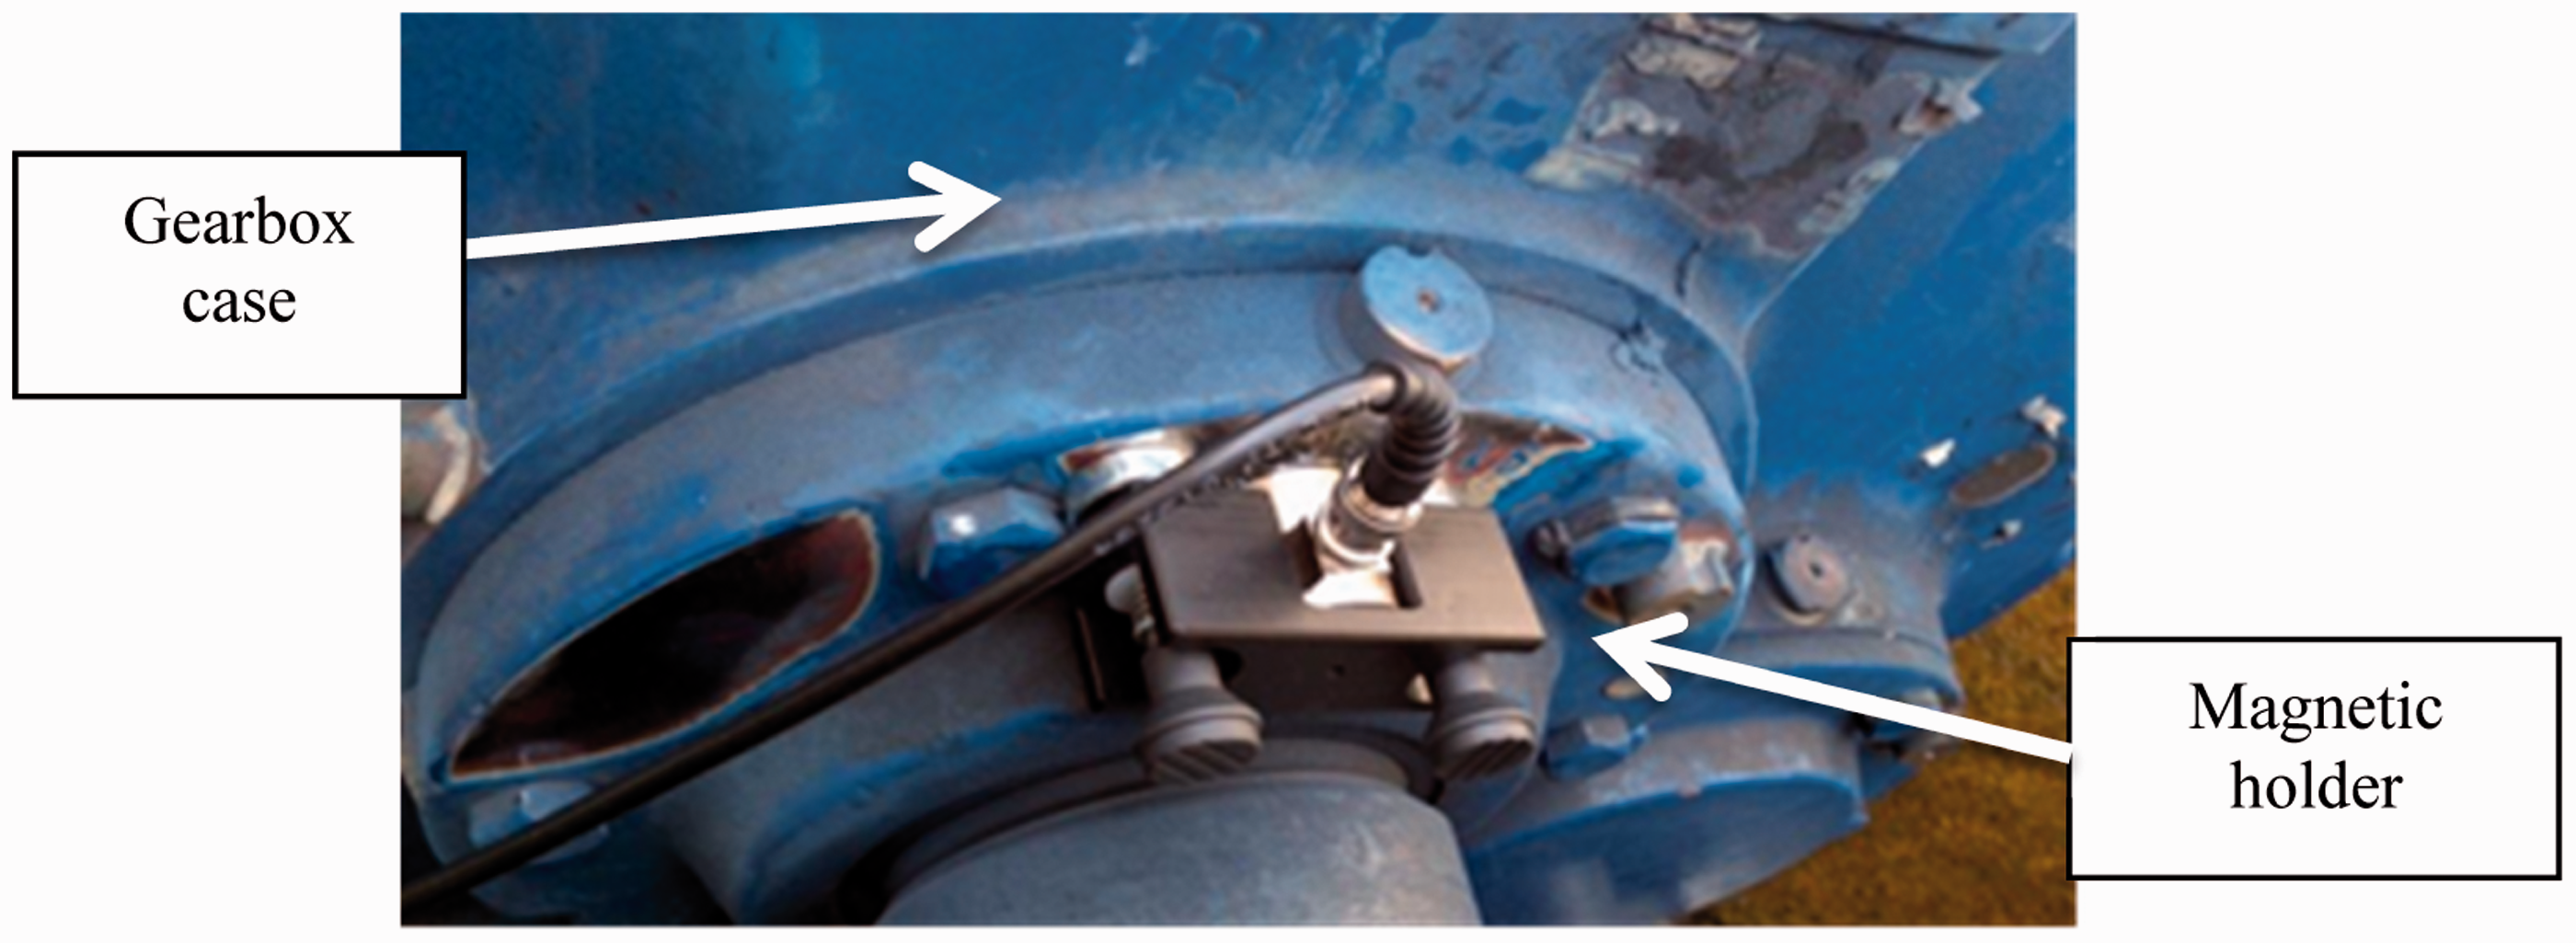
The schematic of the measurement system is shown in Figure 2. It consists of two Vallen VS900RIC AE transducers were employed with a bandwidth from 100 kHz up to 1000 kHz. These sensors include an internal preamplifier with a 34 dB gain and can operate at temperatures between −40℃ and 85℃. The AE sensors were attached onto the gearbox bearing using magnetic holders. A schematic of the drivetrain with the AE sensor location is shown in Figure 3.Ultrasonic couplant was used to avoid attenuation between the gearbox case and the sensors. The couplant selected for this task was Ultragel II®. In addition, the paint of the gearbox was removed in order to avoid the attenuation of the AE signals. The sensor was installed in the high speed gearbox bearing as shown in Figures 4 and 5. The position of the AE sensors is expected to have a significant impact on the signals measured due to the great size of wind turbine gearboxes. Therefore, the AE signals have to travel a long distance to reach the sensor. In this study, the sensor position was arbitrary and it could have been installed in the low-speed side of the gearbox obtaining possibly significantly different results. The preamplifier was powered through a decoupling box connected to a linear power supply. The decoupling box was connected to a commercial data acquisition card through a coaxial cable. The data acquisition card used was ADlink PCI-9816, with a maximum sampling rate of 10 MS/s, 16-bit resolution and ±5 V input range. The sampling rate was set as 2 MS/s and the data was acquired, saved and processed using LabView® 2012. The data was collected at regular time intervals rather than threshold-based. The acquisition time was set as 8 s (16 million samples) being the time between acquisitions 10 min. The power output of the wind turbine (750 kW) was divided in 30 bins (25 kW per bin). In total 1500 AE waveforms were acquired, 50 samples for each bin.
Schematic of the measurement system. Schematic of the NEG MICON NM-48 wind turbine. Installation of the AE sensor in the high-speed shaft bearing of the gearbox. Location of AE sensor in the gearbox case.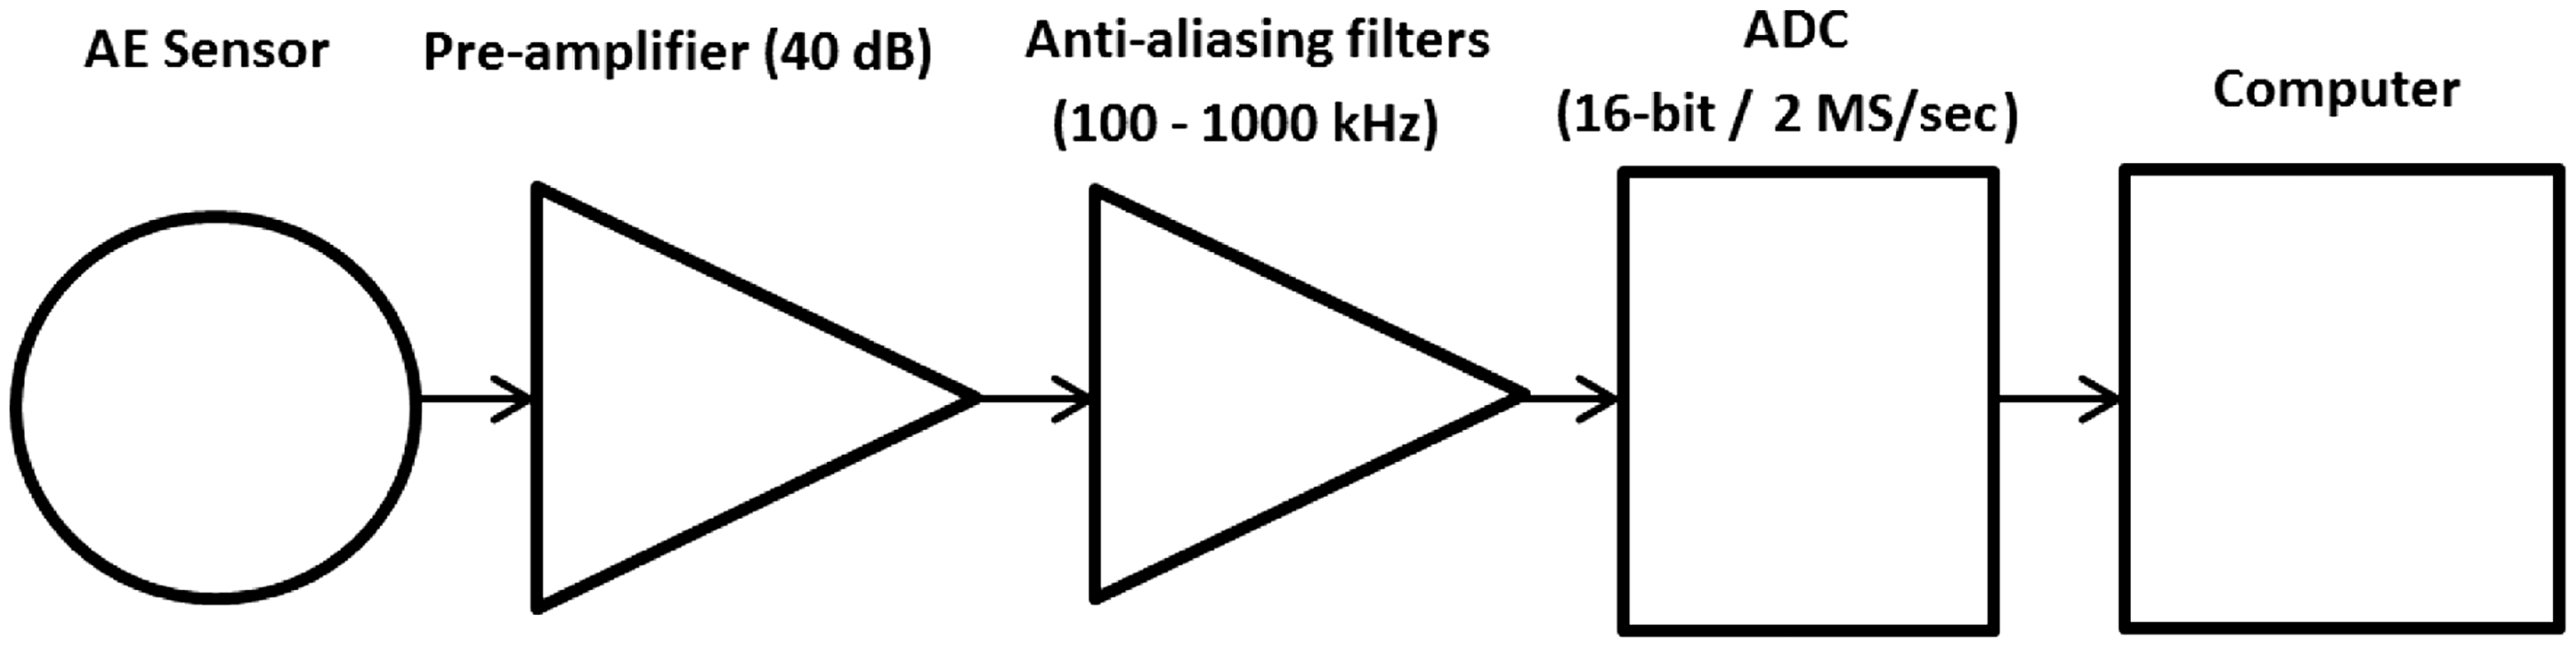
System calibration and testing was done using the Hsu–Nielsen test based on the breaking of a pencil lead tip of 2H hardness. In the environment that the AE sensors are installed, unwanted environmental noise is a limitation and needs to be removed from the true AE signal before analysis. For this reason, a Butterworth low-pass filter with a cut-off frequency at 450 kHz was applied to the AE signals.
Conventional V-type strain gauges (manufactured by HBM) were used to measure the torque on the high-speed shaft. These measurements were used to correlate the torque at which the shaft is exposed to AE activity. The strain experienced by the high-speed shaft is determined by measuring the small change in the output voltage that results from the small change in the resistance of the bonded resistance strain gauge (Figure 6) which is installed using Wheatstone bridge circuit configuration.
Strain gauges installed on the high-speed shaft.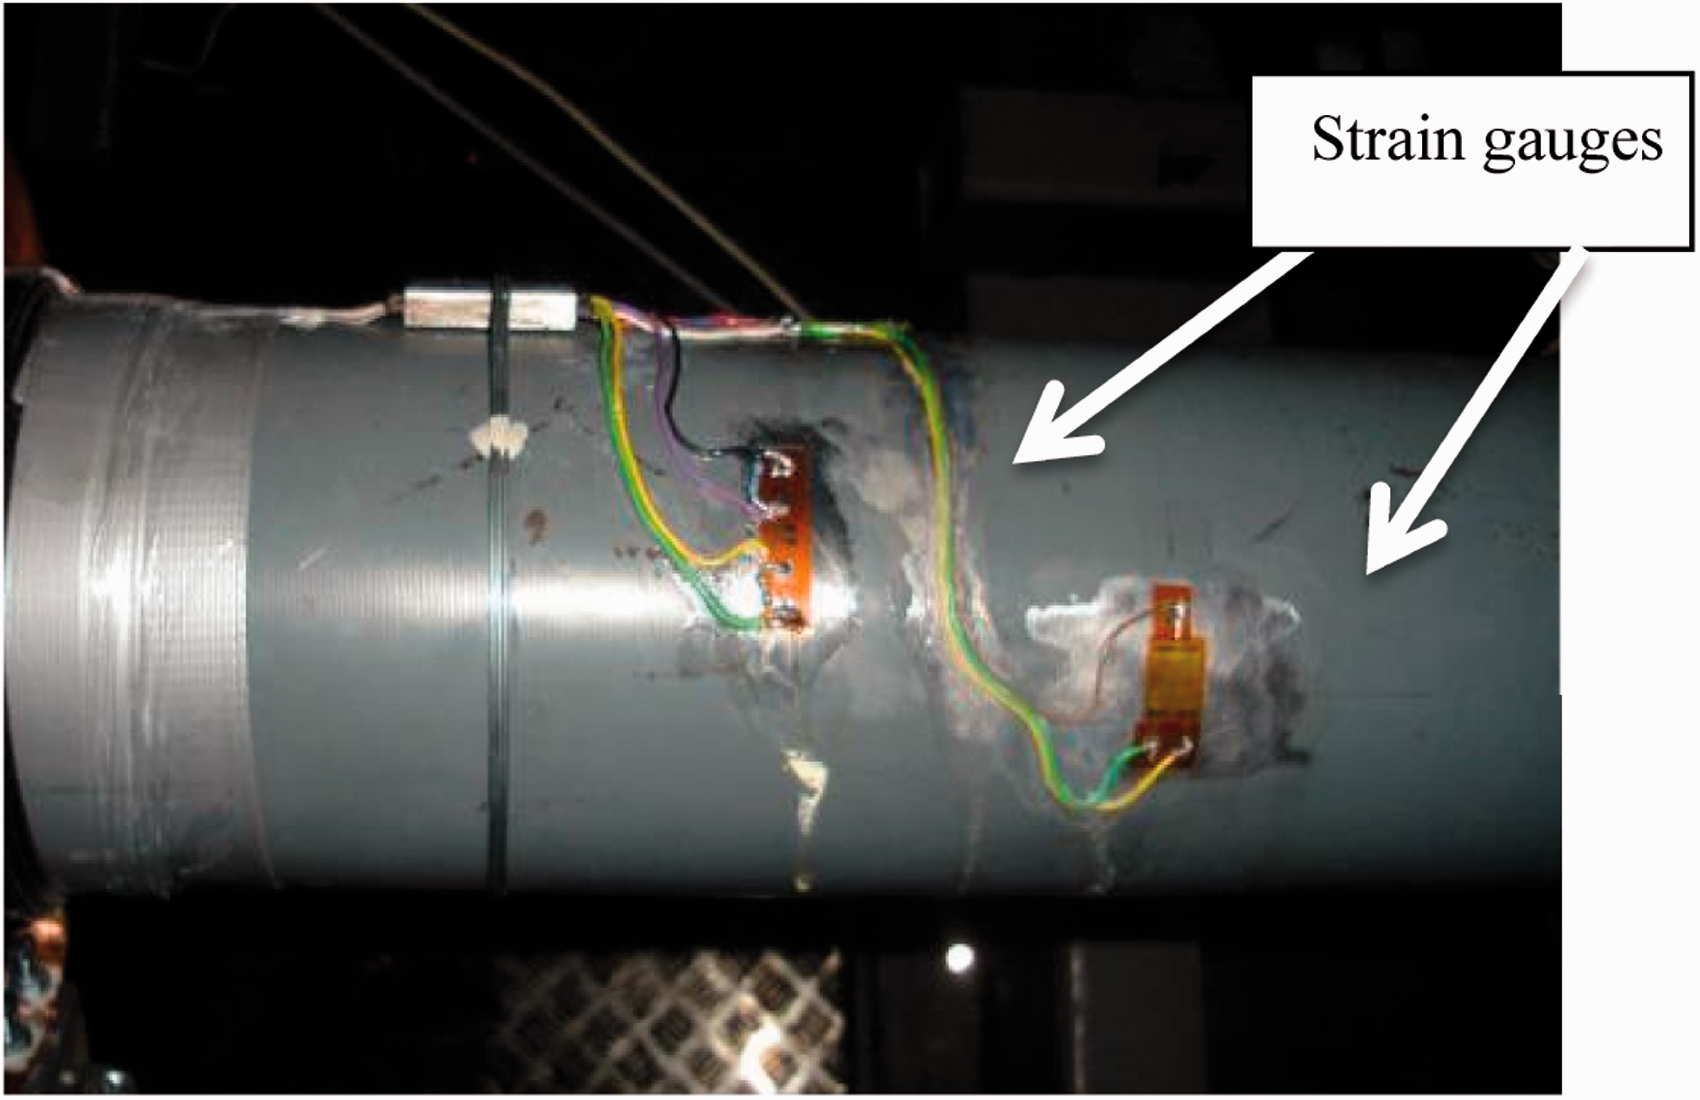
Results and discussion
Impact of operational conditions on AE features
An example of frequency domain AE signal acquired from the AE sensors installed in the NEG MICON NM-48 wind turbine is shown in Figure 7. It shows two different components in the signal. The low-frequency components of the signal, up to 450 kHz, which is dominated by genuine AE signal and high-frequency components which is dominated by electronic noise. To remove this noise and increase the SNR, a low-pass filter has been applied to the signal with cut off frequency of 450 kHz.
AE time domain signal and frequency domain of a typical burst acquired during wind turbine operation.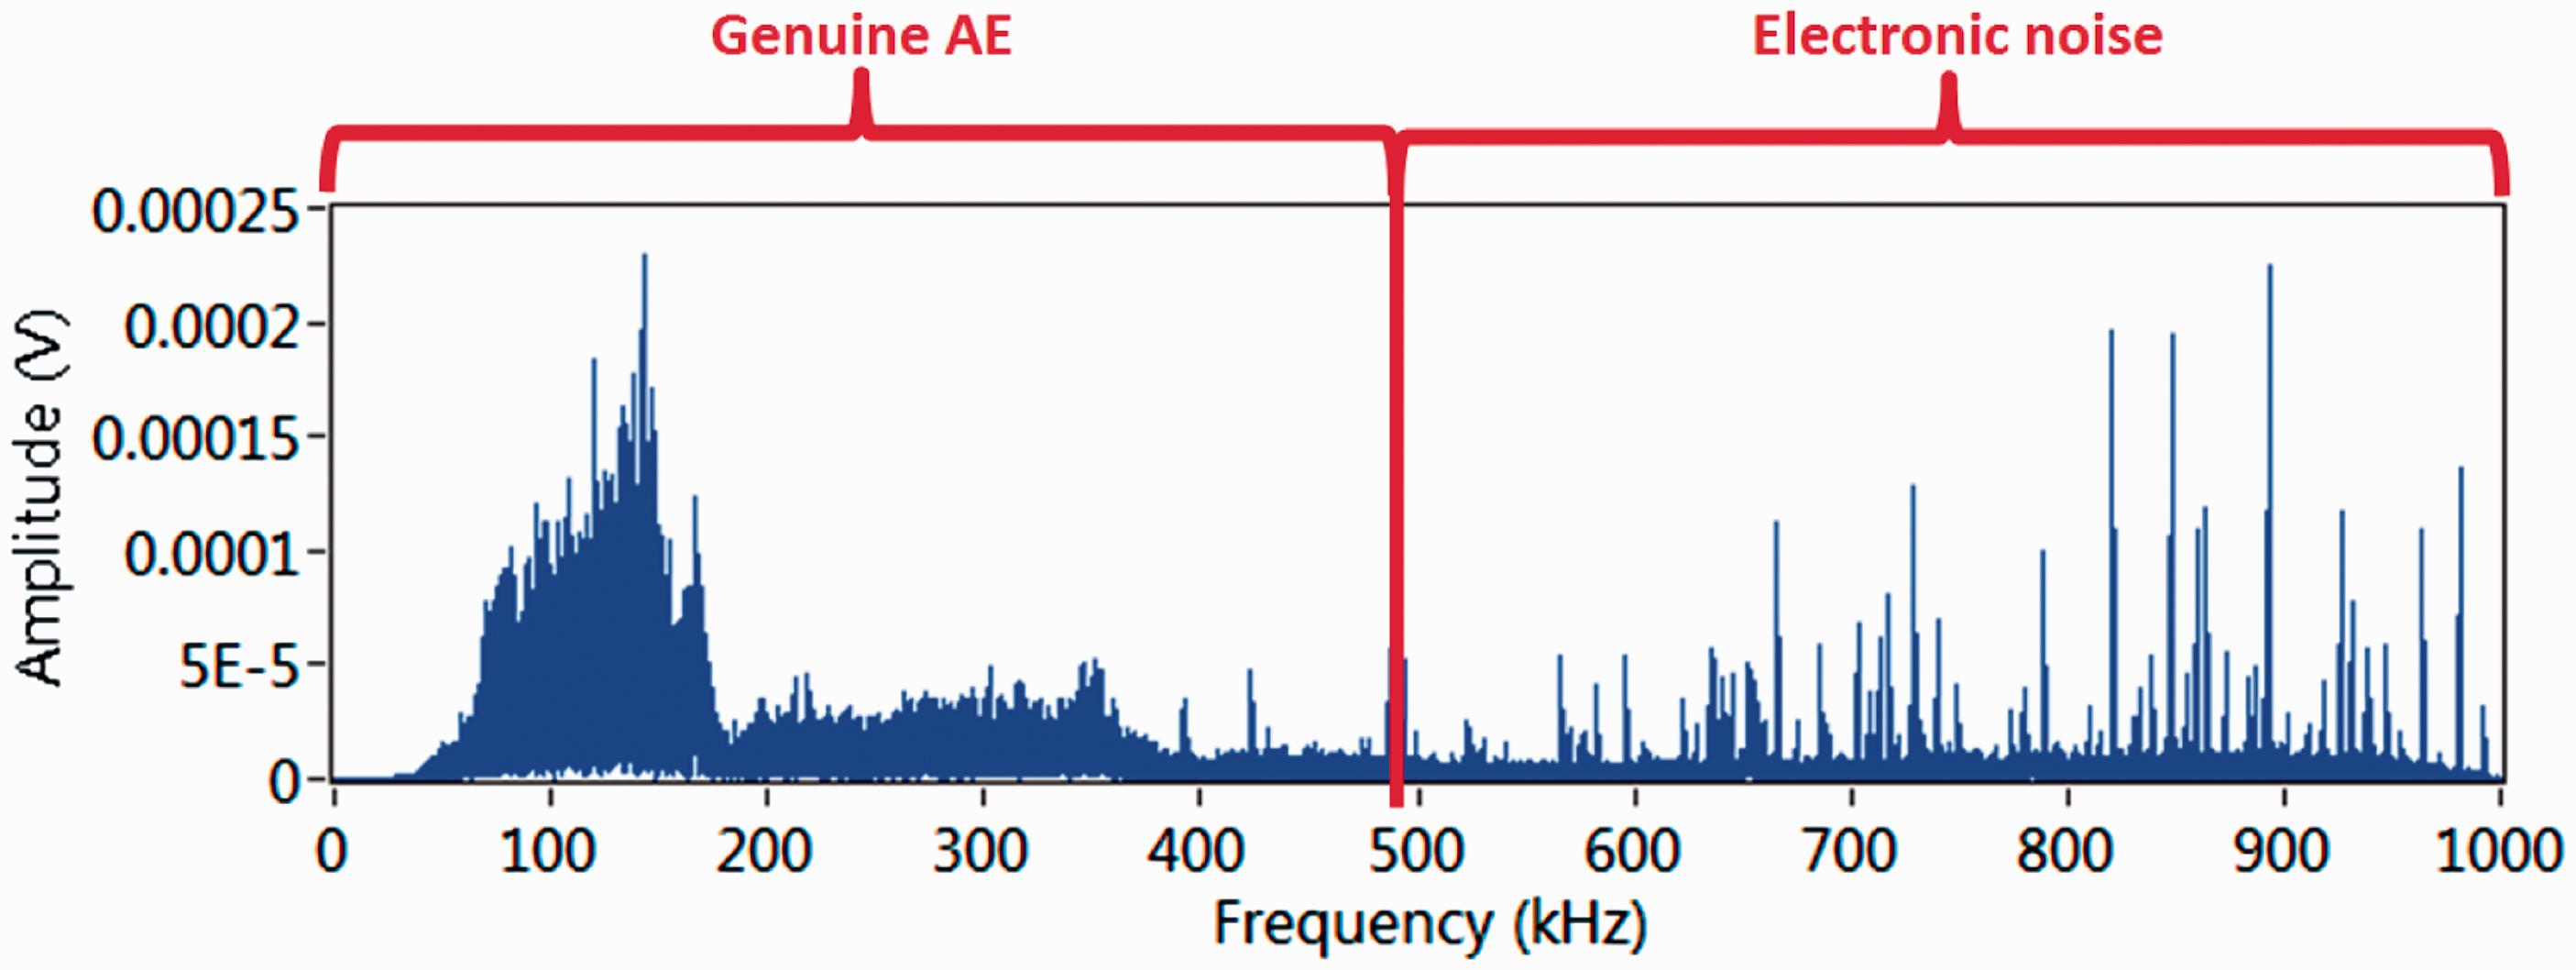
Typical AE signal acquired from the wind turbine gearbox applying the low-pass filter is presented in Figure 8. Continuous AE is present in the signal with several discrete AE events of high amplitude.
Typical AE signal acquired in the gearbox case.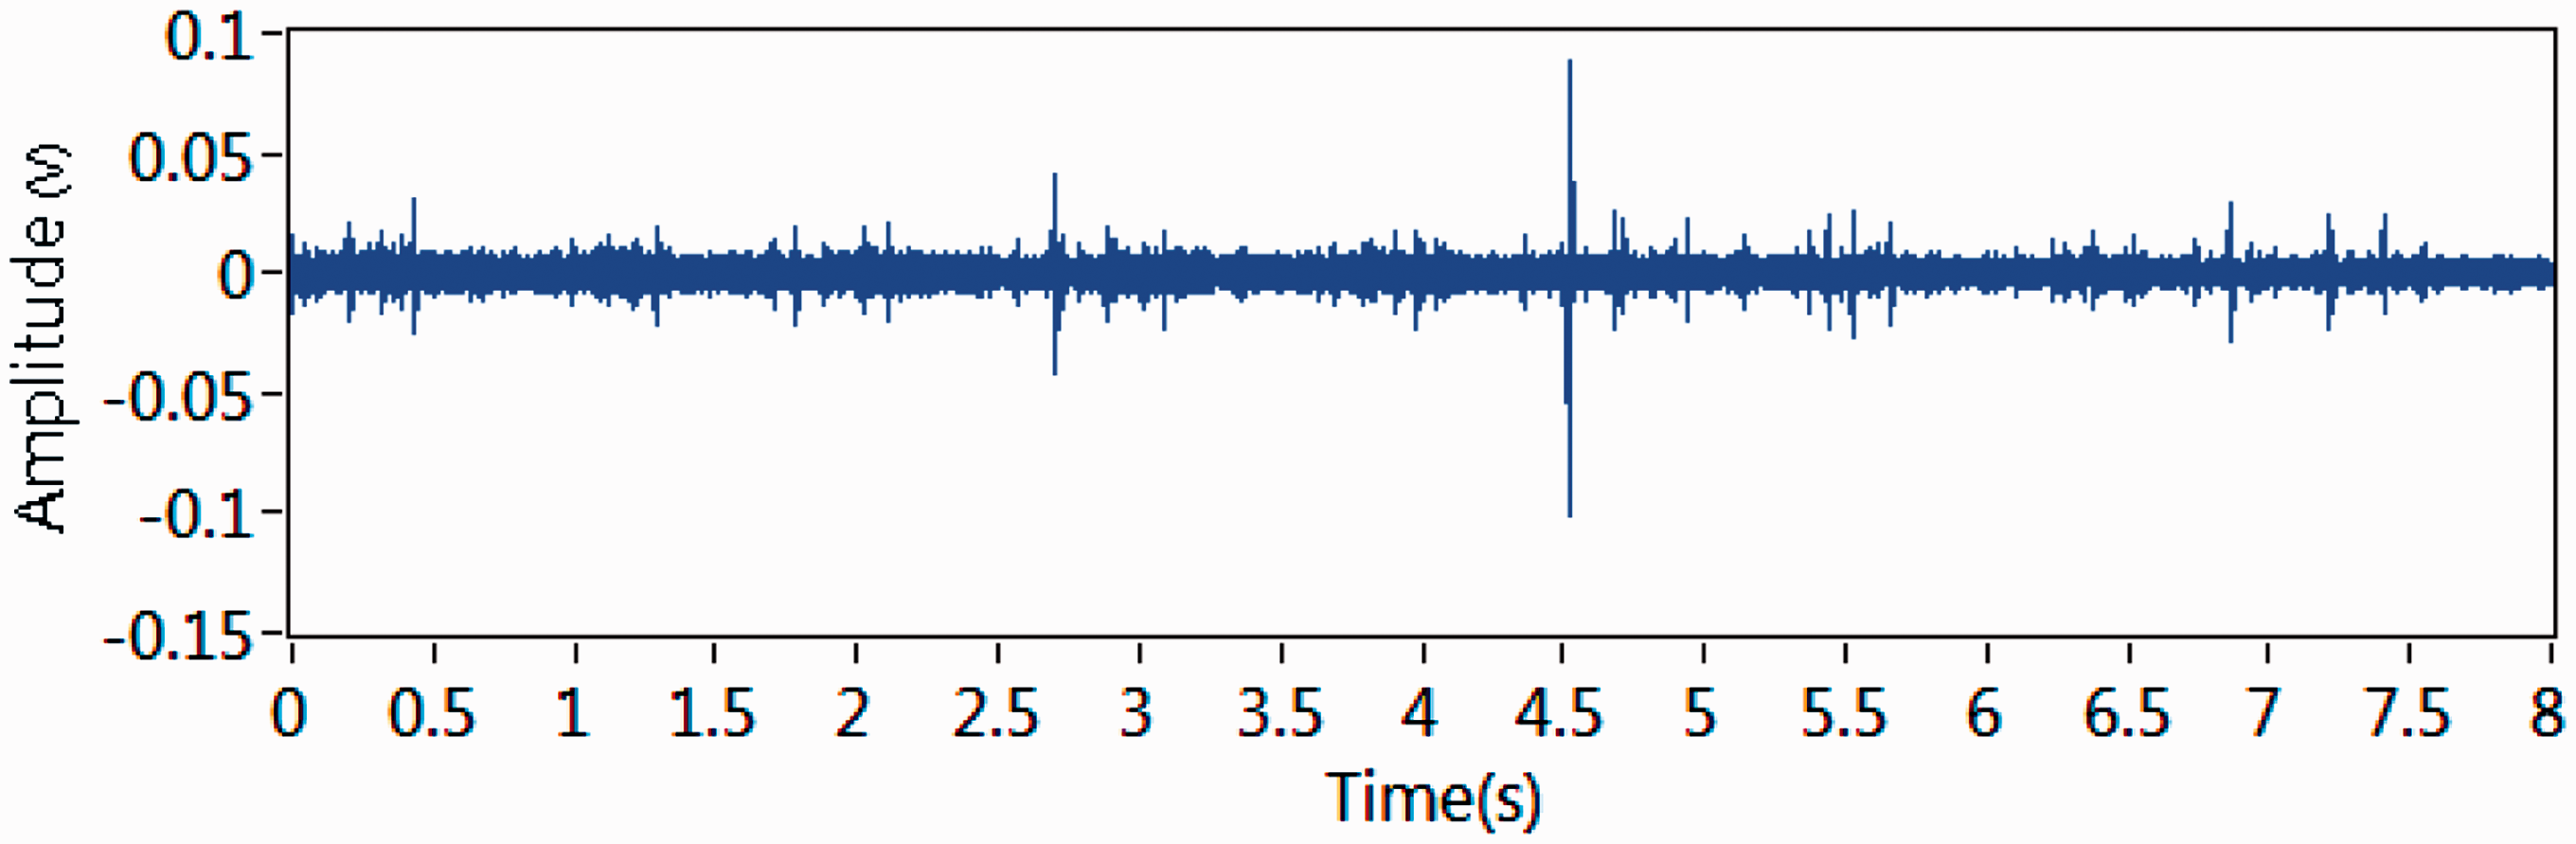
Figure 9(a) shows a detailed view of one of the transients shown in Figure 8. Figure 9(b) displays the frequency spectrum of the signal. It clearly shows that most of the AE activity is concentrated in the range between 100 and 350 kHz with peak value at 140 kHz. The low amplitude of the signals is attributed to the high attenuation between the gears and the gearbox case.
Typical AE burst in (a) time and (b) frequency domain.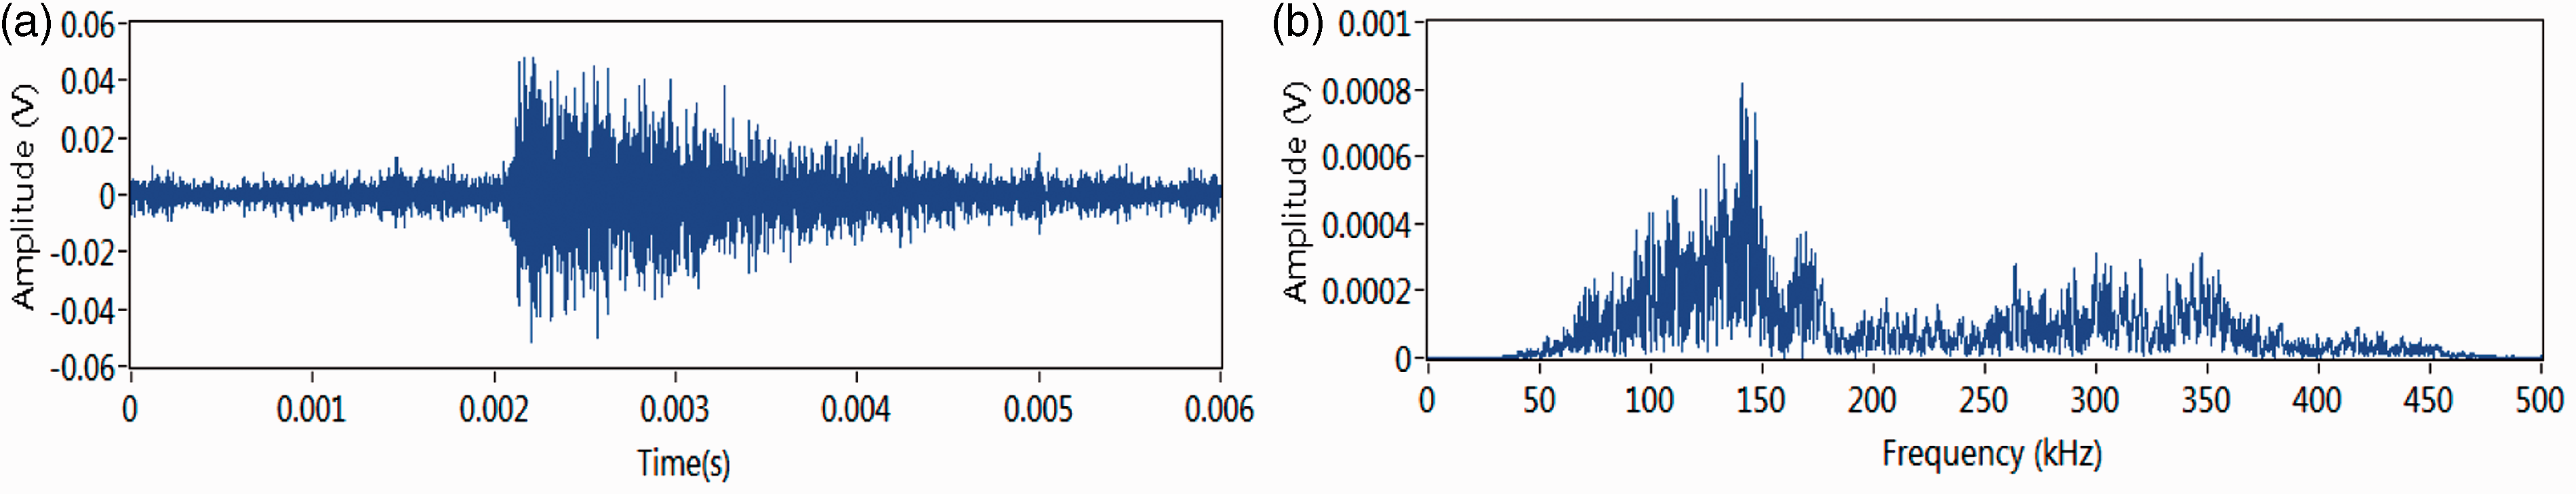
Figure 10 displays the plot of the RMS values extracted from all AE waveforms acquired as a function of power output. The plot shows, as expected, increasing RMS with increasing power output. In addition, the scattering increases at with increasing power output. Two different gradients are observed in the plot. Firstly, low gradient until about 400 kW which sharply increases until 750 kW. The reason of these two different gradients in the graph is unknown to the authors and cannot be attributed to any known machine mechanism or condition.
RMS (V) as a function of output power (kW).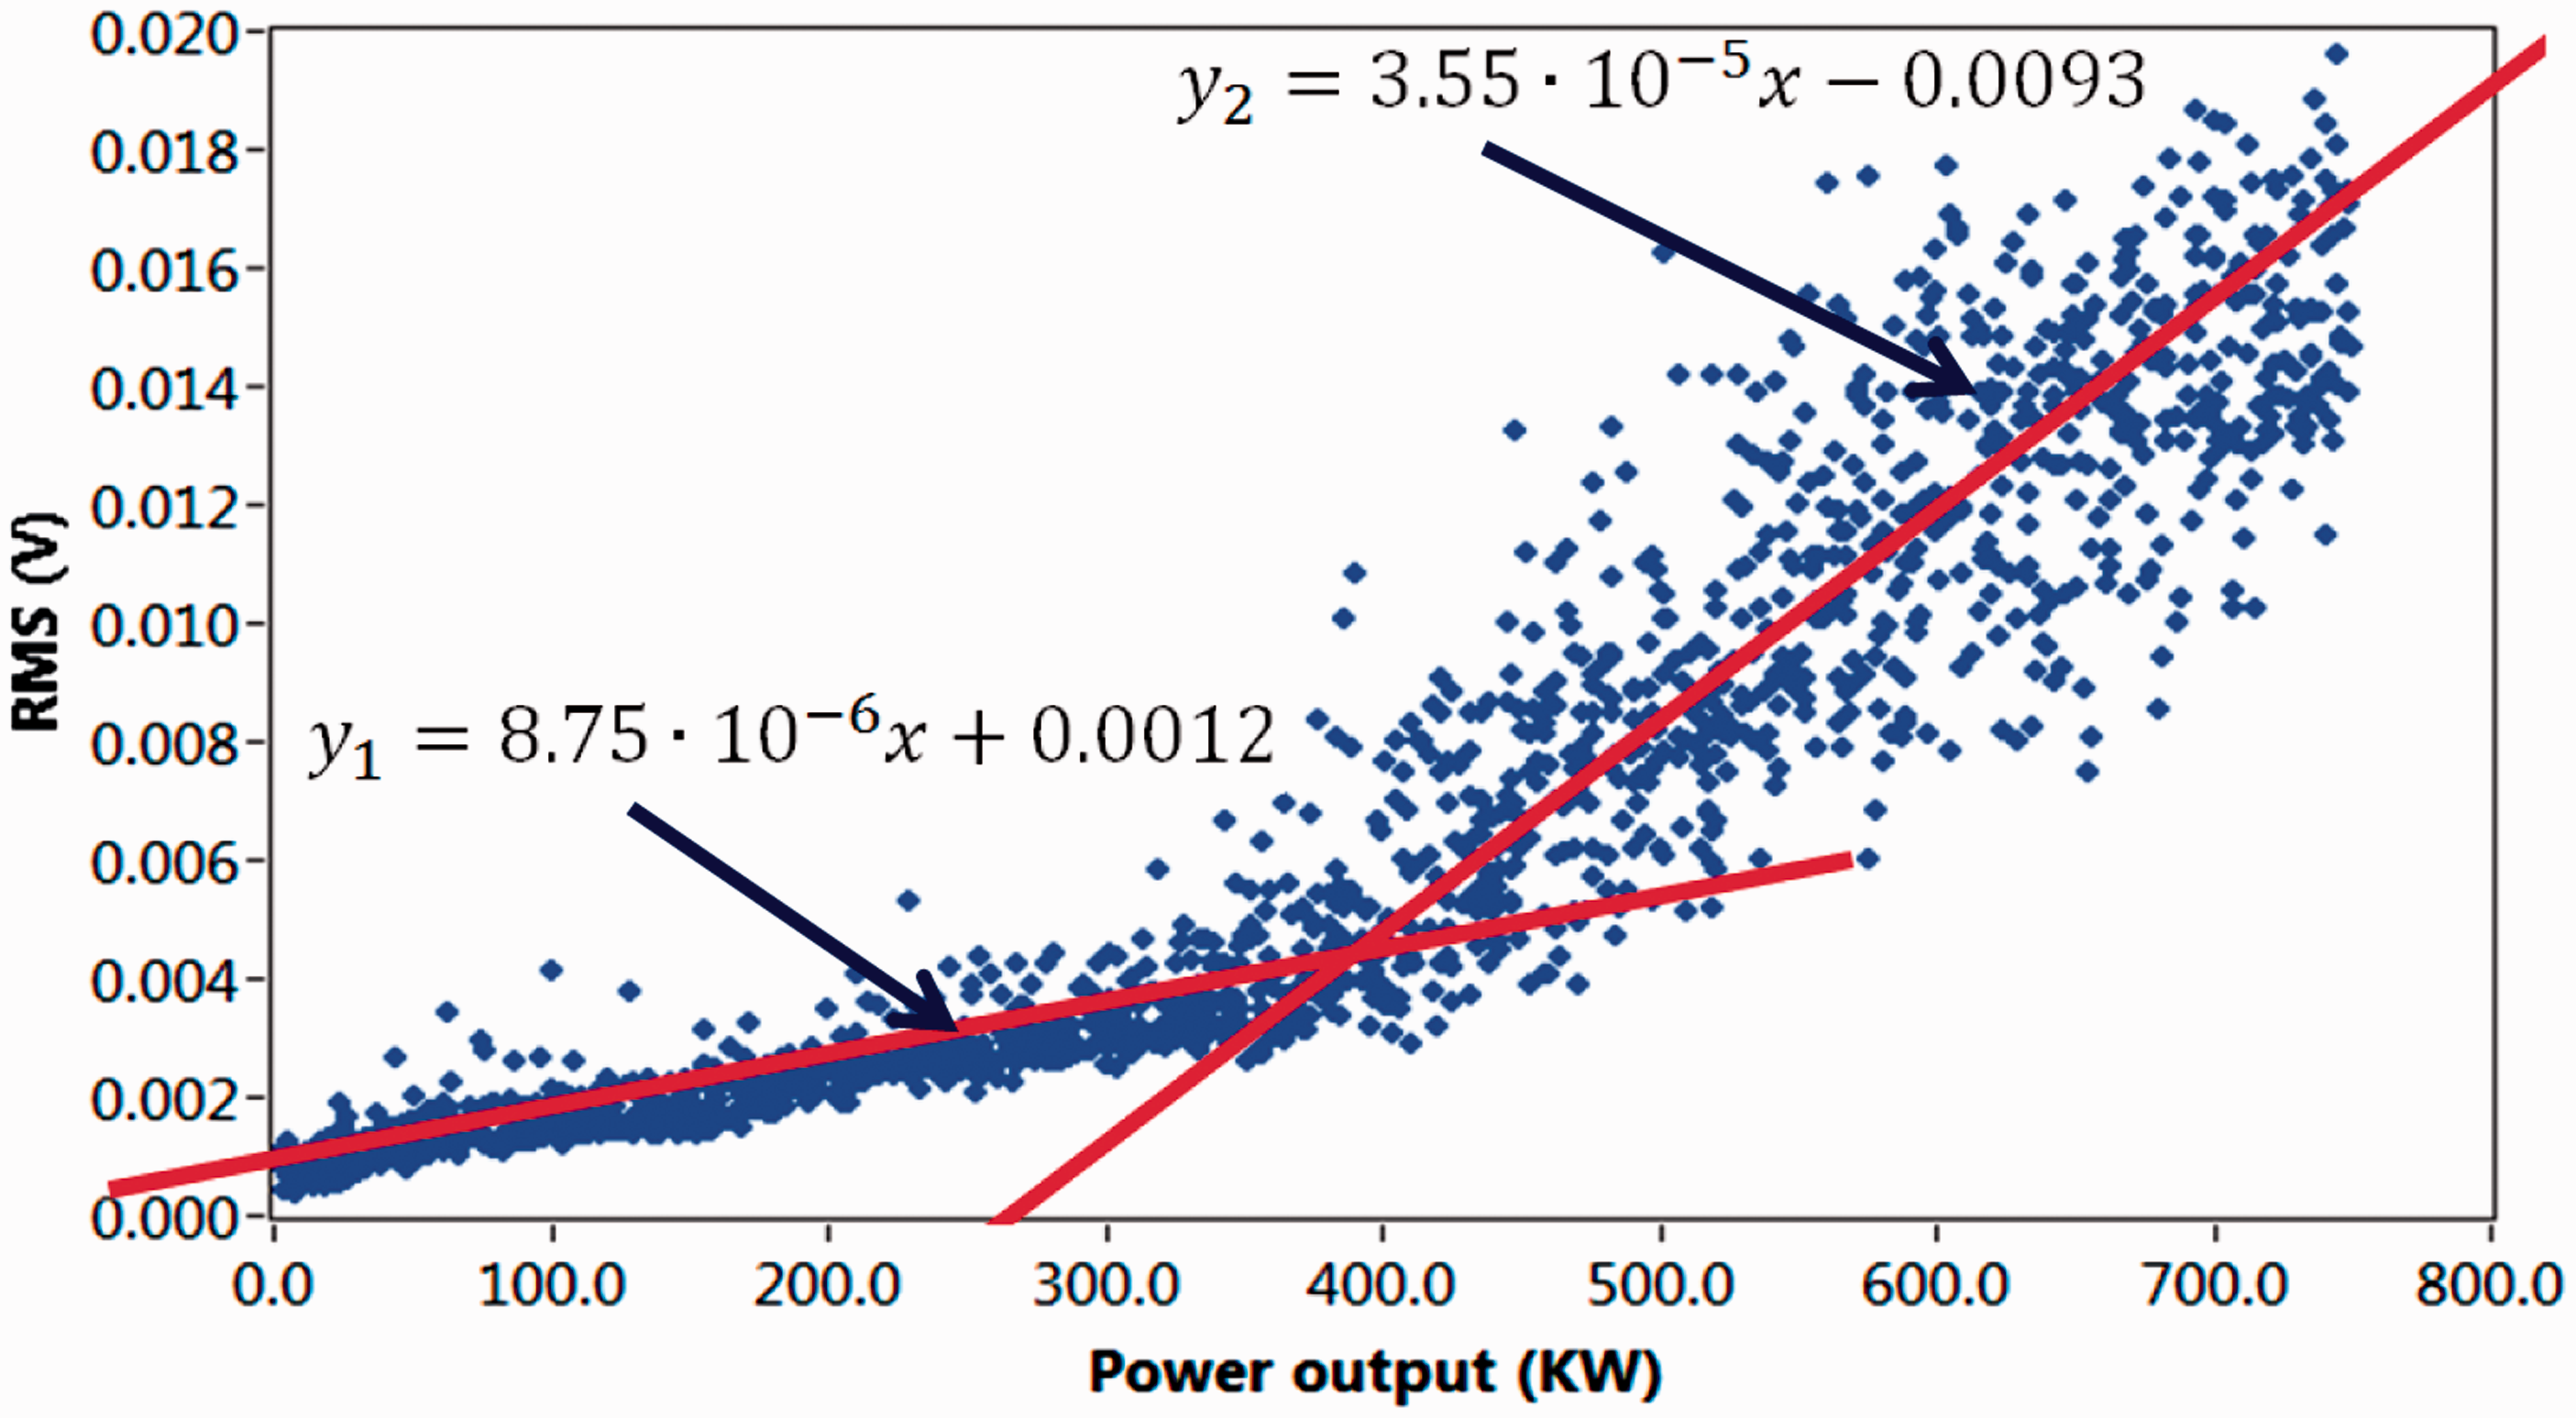
Figure 11 shows the RMS, CF, IE and peak values extracted from the AE signals as a function of BIN Number (power output). These plots show the mean value of the 50 samples acquired with the error bars computed from the standard deviation (SD) given by
RMS, CF, peak value and IE as a function of bin number (power output).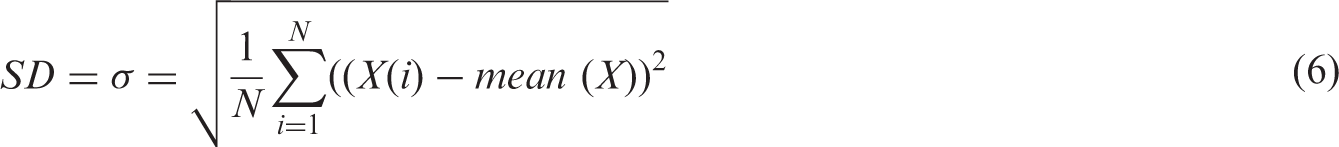
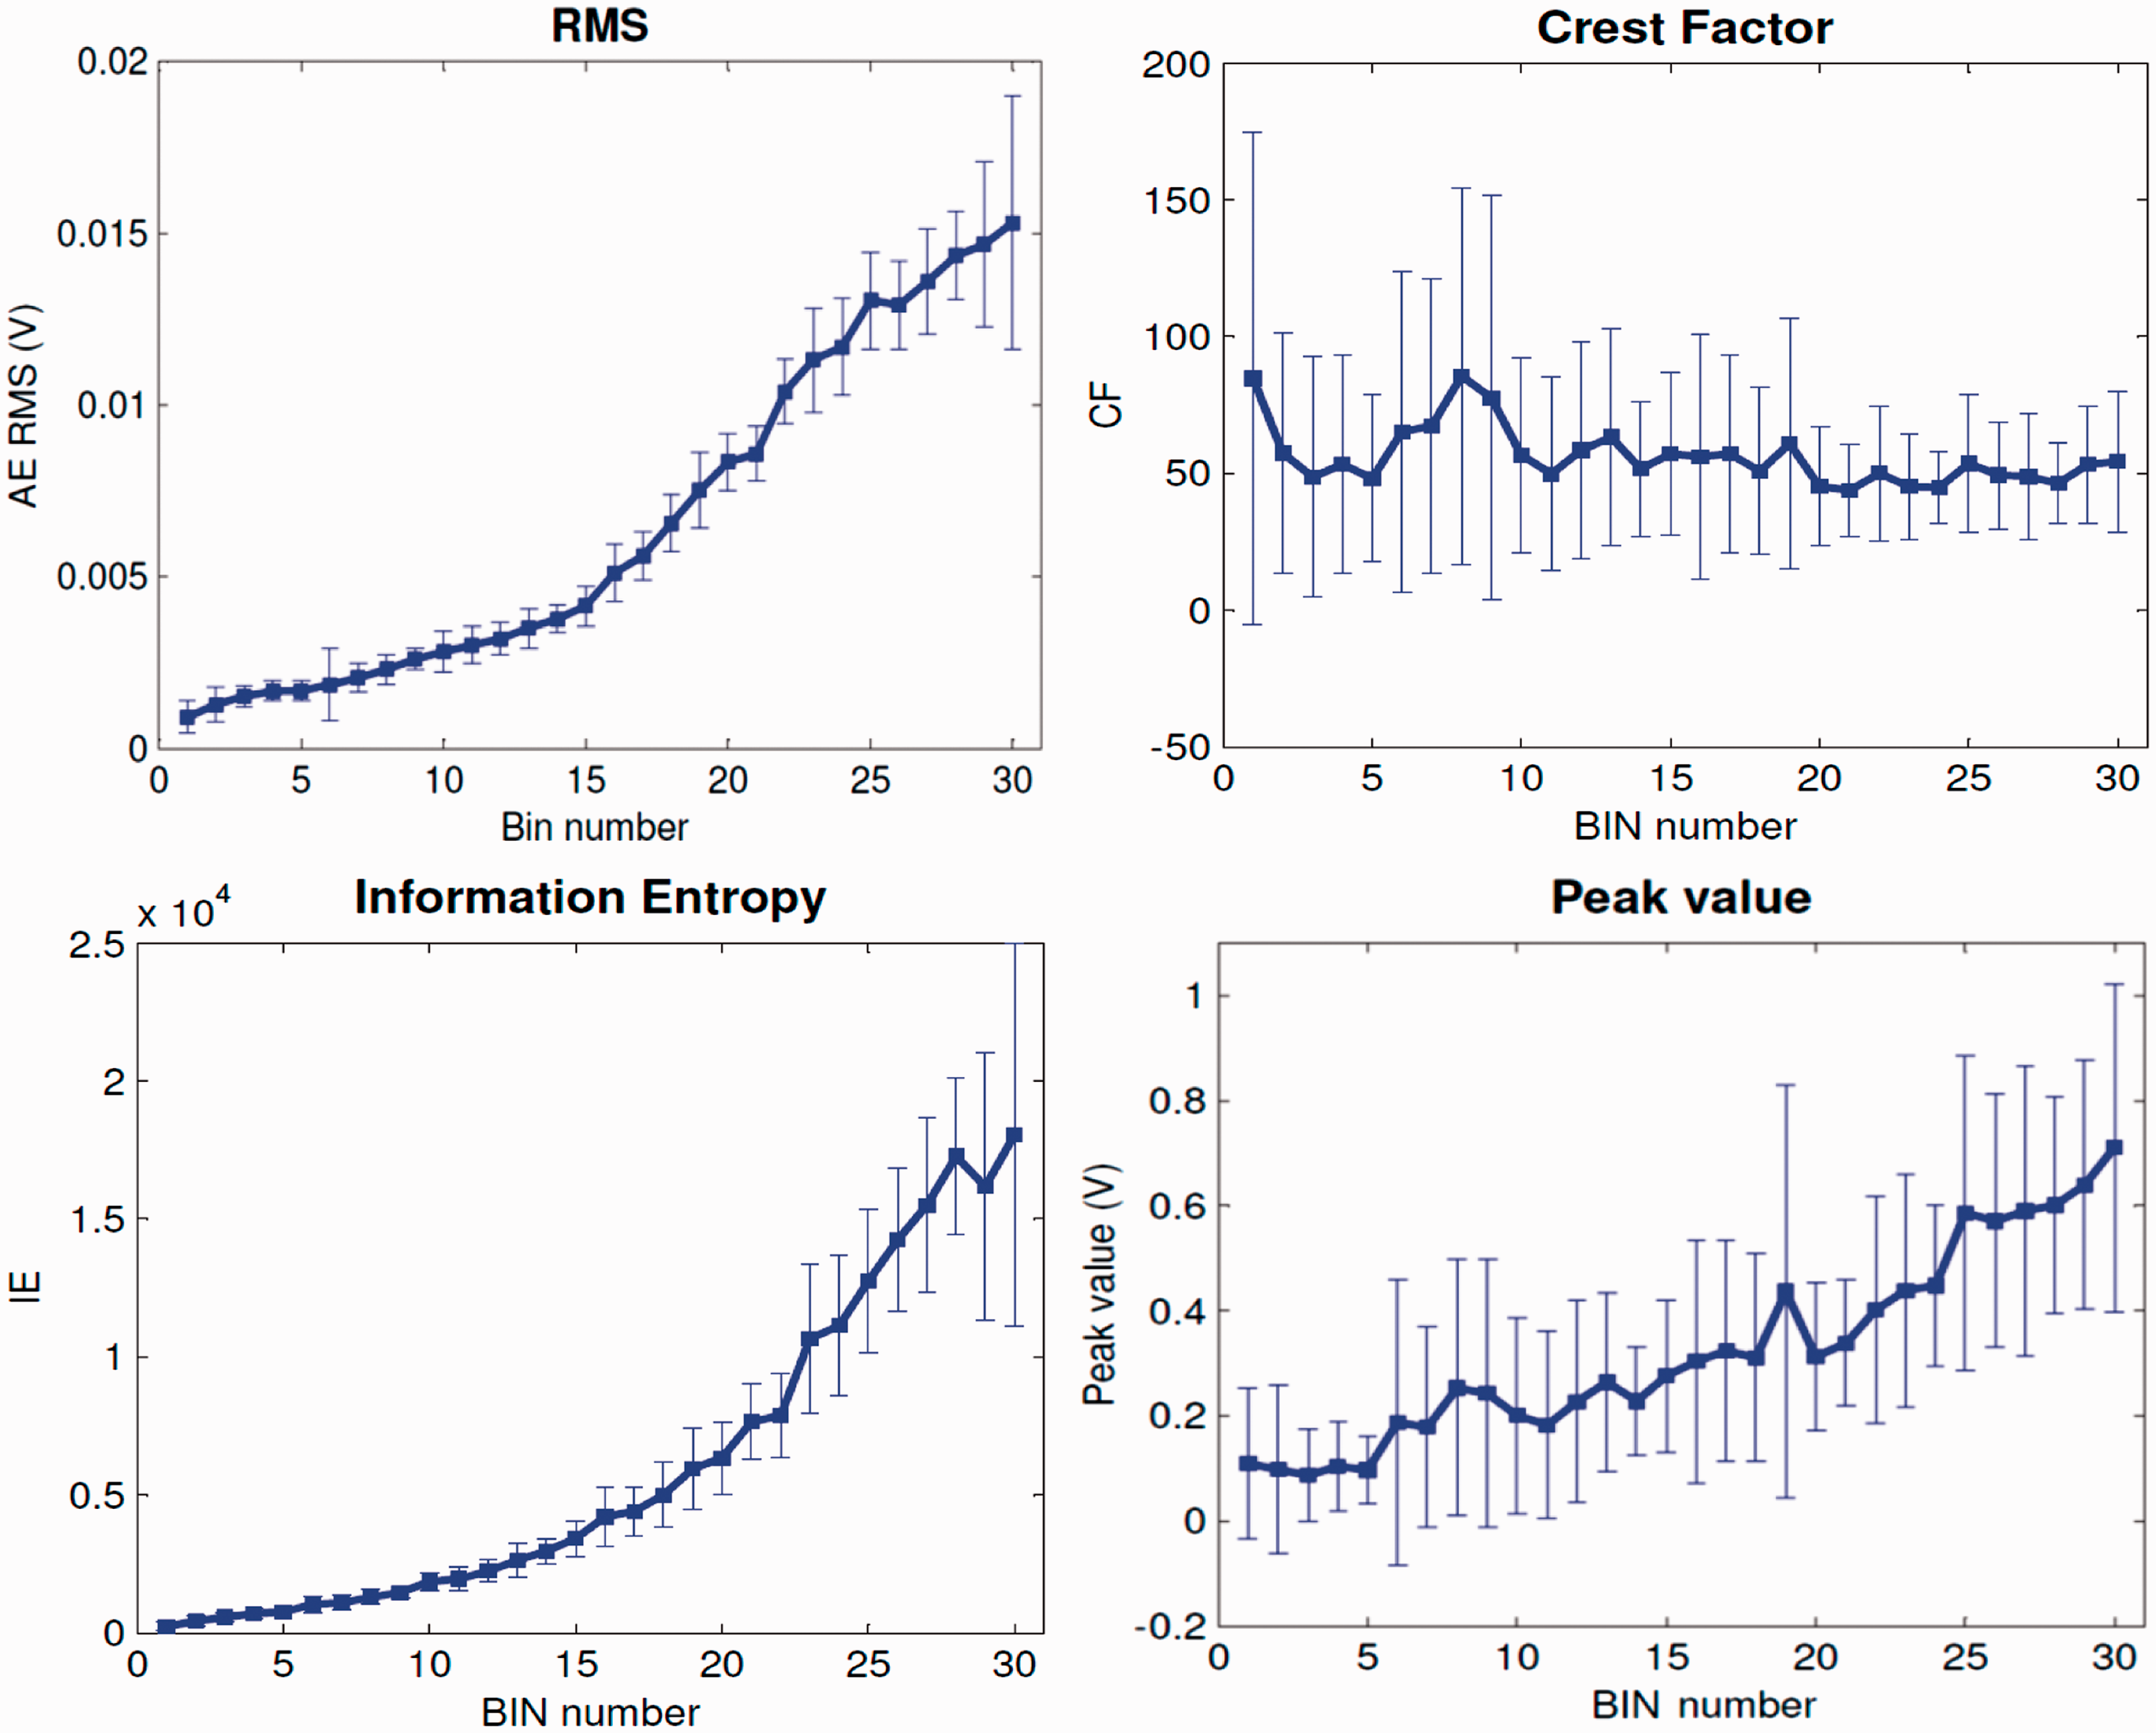
The plots for RMS, IE and peak clearly show an increasing trend with power output. An increase of power output involves an increase of the load on the different components which increases the real contact area between bearing components. This is due to the increase of the contact spot number while the spot dimensions grow significantly. 37 The pressure undertaken by each junction is constant and, thus, the real contact area is proportional to the load. 38 Parameters such as RMS and counts have been demonstrated to correlate directly with increasing load.28,34 However, the pattern of CF with varying power output shows a different trend. Since the CF is defined as ratio between the peak value and the RMS, as both indicators show increasing trend the quotient of them keep a steady pattern. The most sensitive parameter with respect to power output is IE which increases from 225 to 18,046 (approximately 80 times) from bin 0 to bin 30.
In general, the error bars which represent the standard deviations increase with the increasing bin number in the RMS, peak and IE plots. However, the results shown in the CF plot shows the opposite trend. In addition, an increase in error with increasing bin number is observed in all plots except for CF.
Figure 12 displays the count parameter as a function of bin number. It is evident from Figure 9 the counts increases initially gradually and then quite sharply at the higher bin numbers. As observed for RMS value, the graph shows different gradients, the first in the bins 0 to 15 which corresponds to 0–400 kW and the second from 400 kW to the maximum output power. Again the bins corresponding to high power display higher error. The increase in the mean value of the counts with higher bin numbers is a manifestation of the increasing torque at high output power.
Counts as a function of bin number (power output).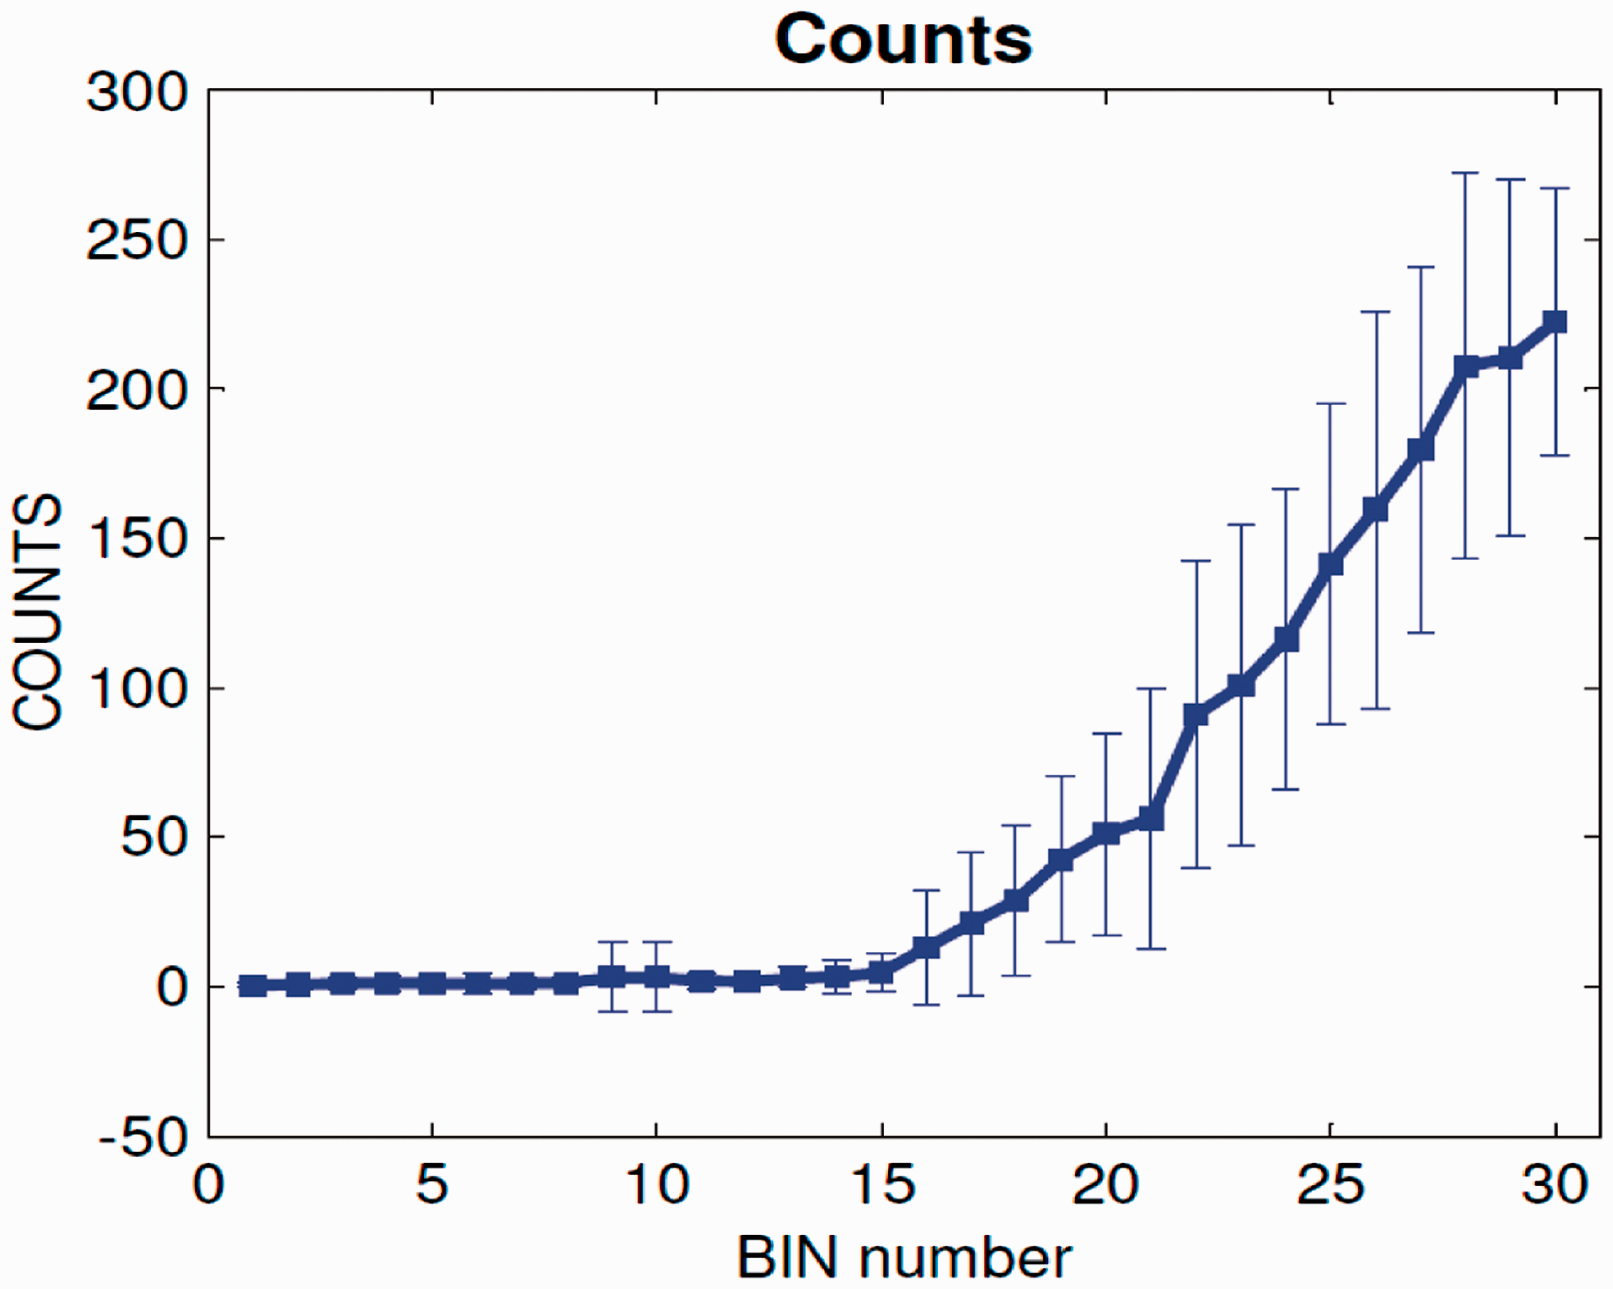
The evolution of AE RMS with torque is shown in Figure 13. It displays similar trend as observed with power output. Also the scattering is higher with increasing torque. It also shows two different trends. The first one covers up to 2.5 kN with lower gradient, which increases with higher torque values.
The RMS voltage as a function of torque (kN).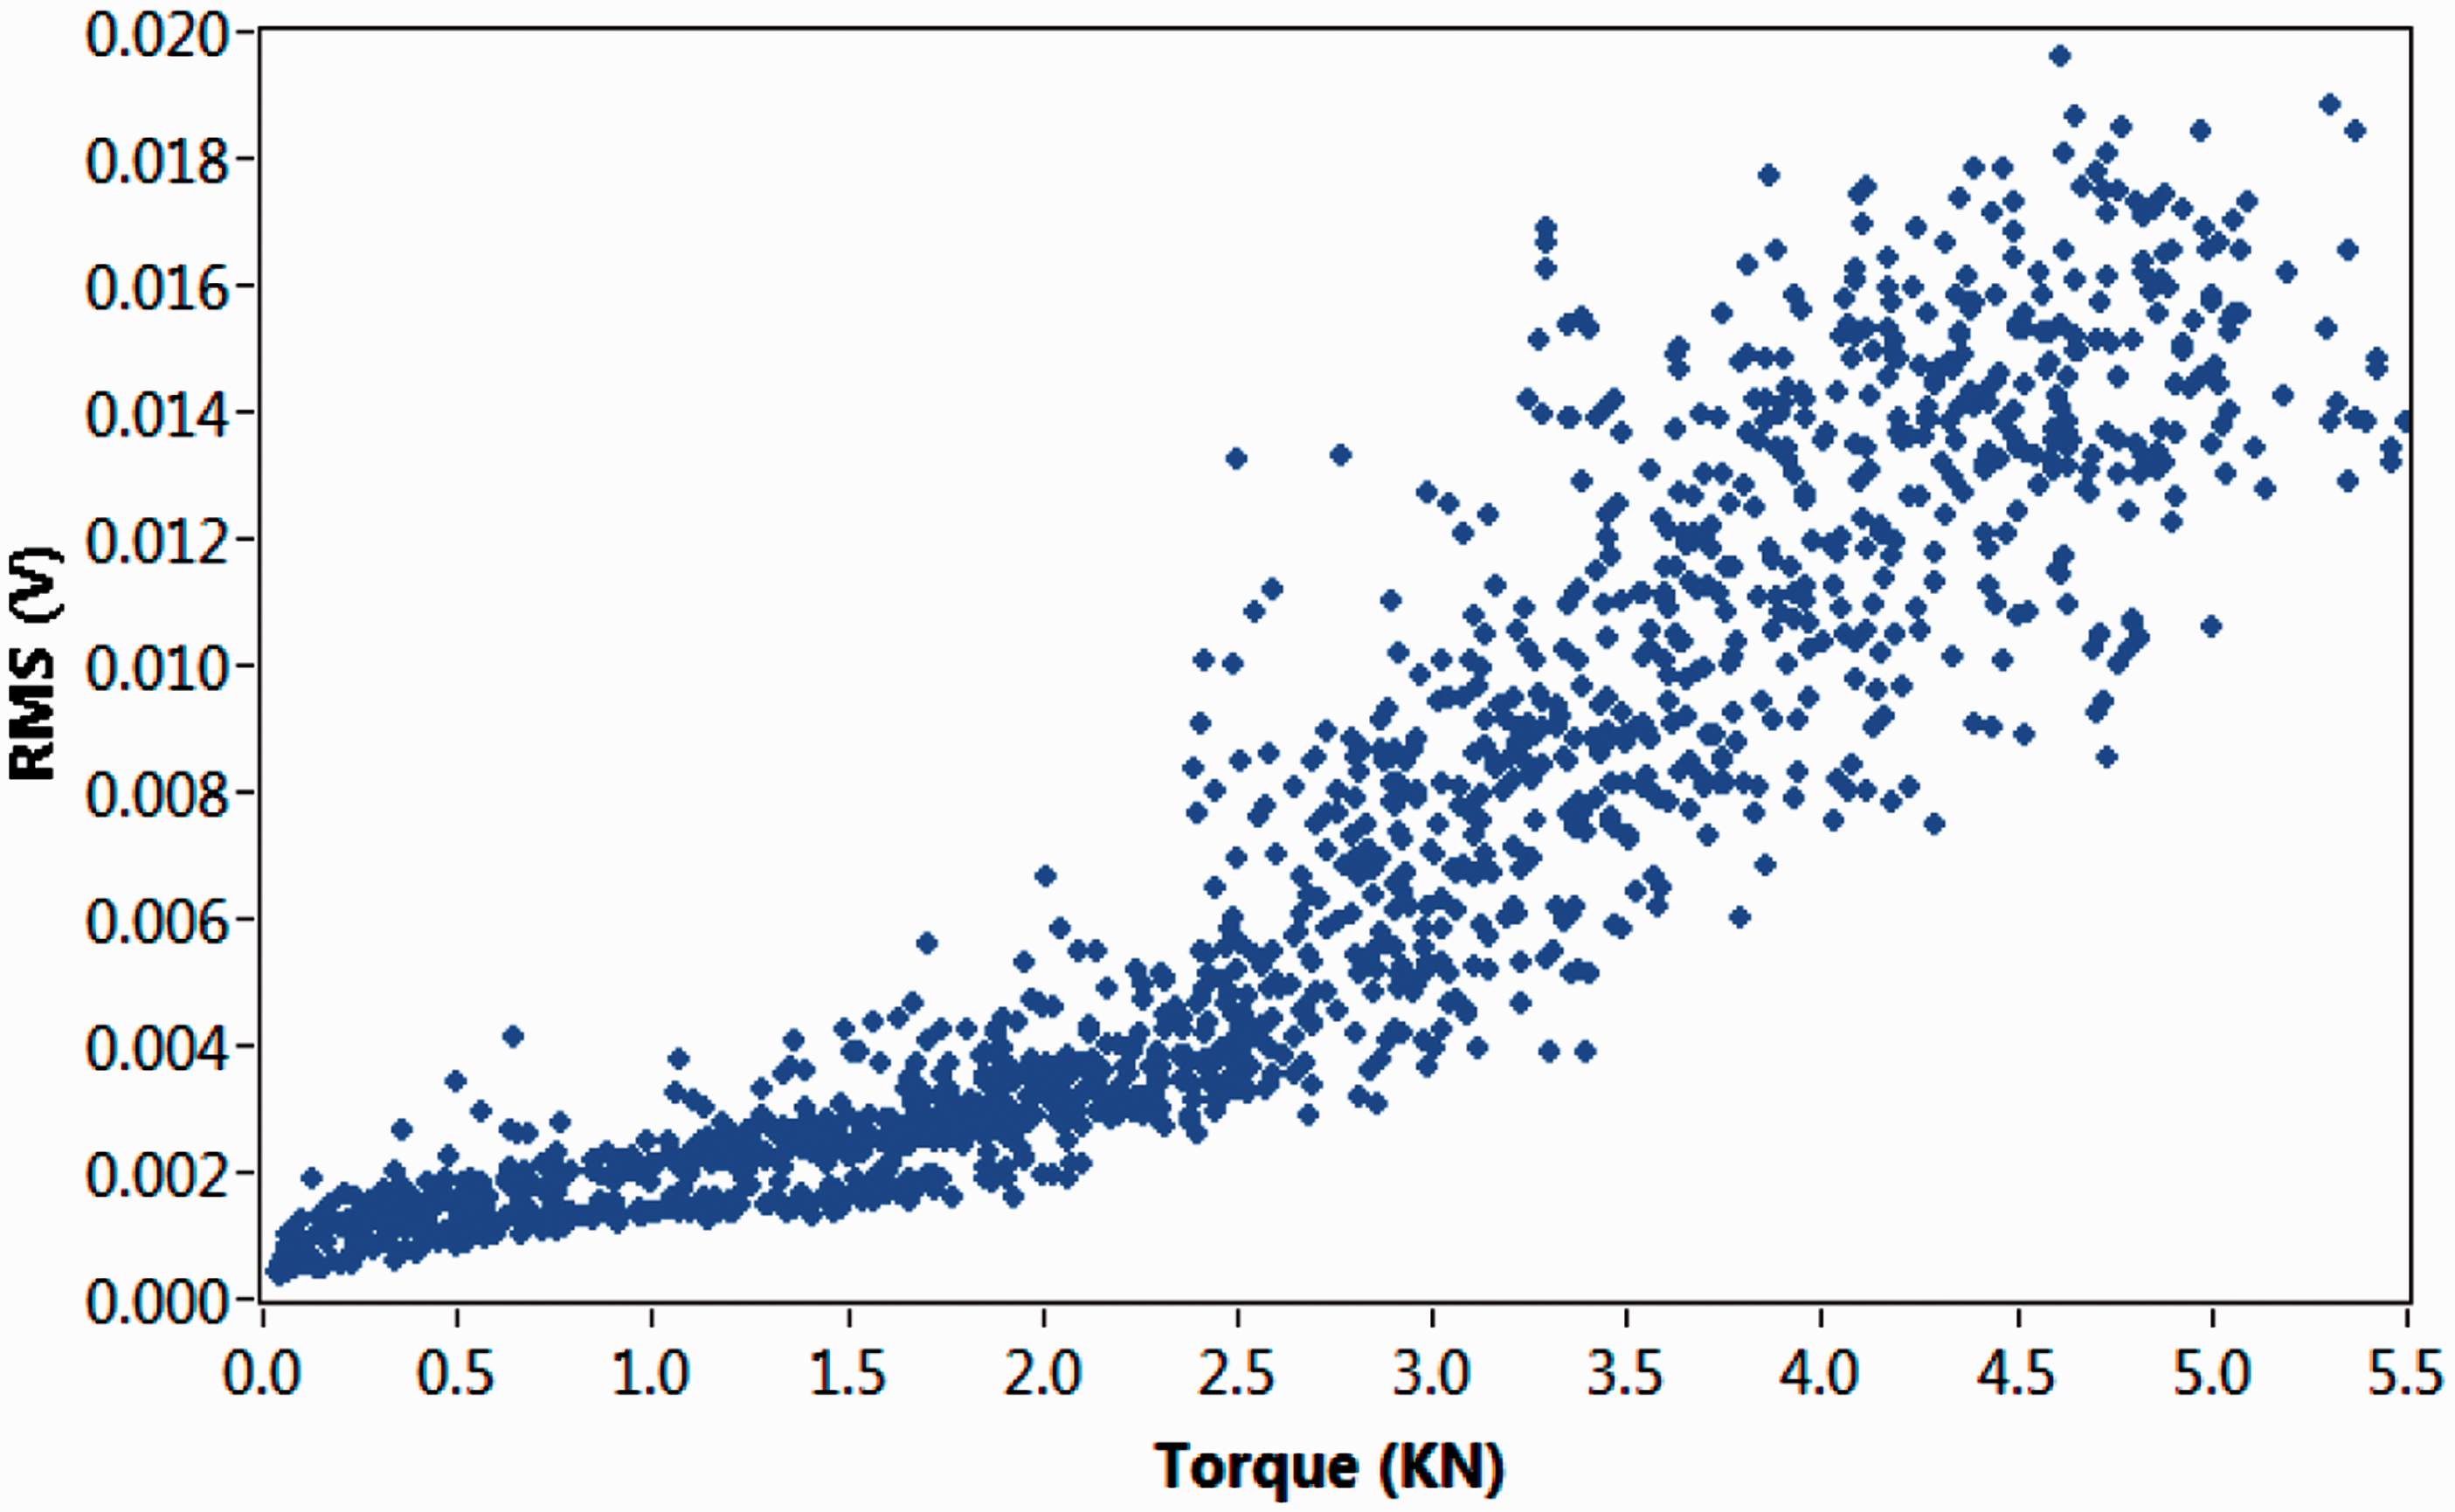
Envelope analysis
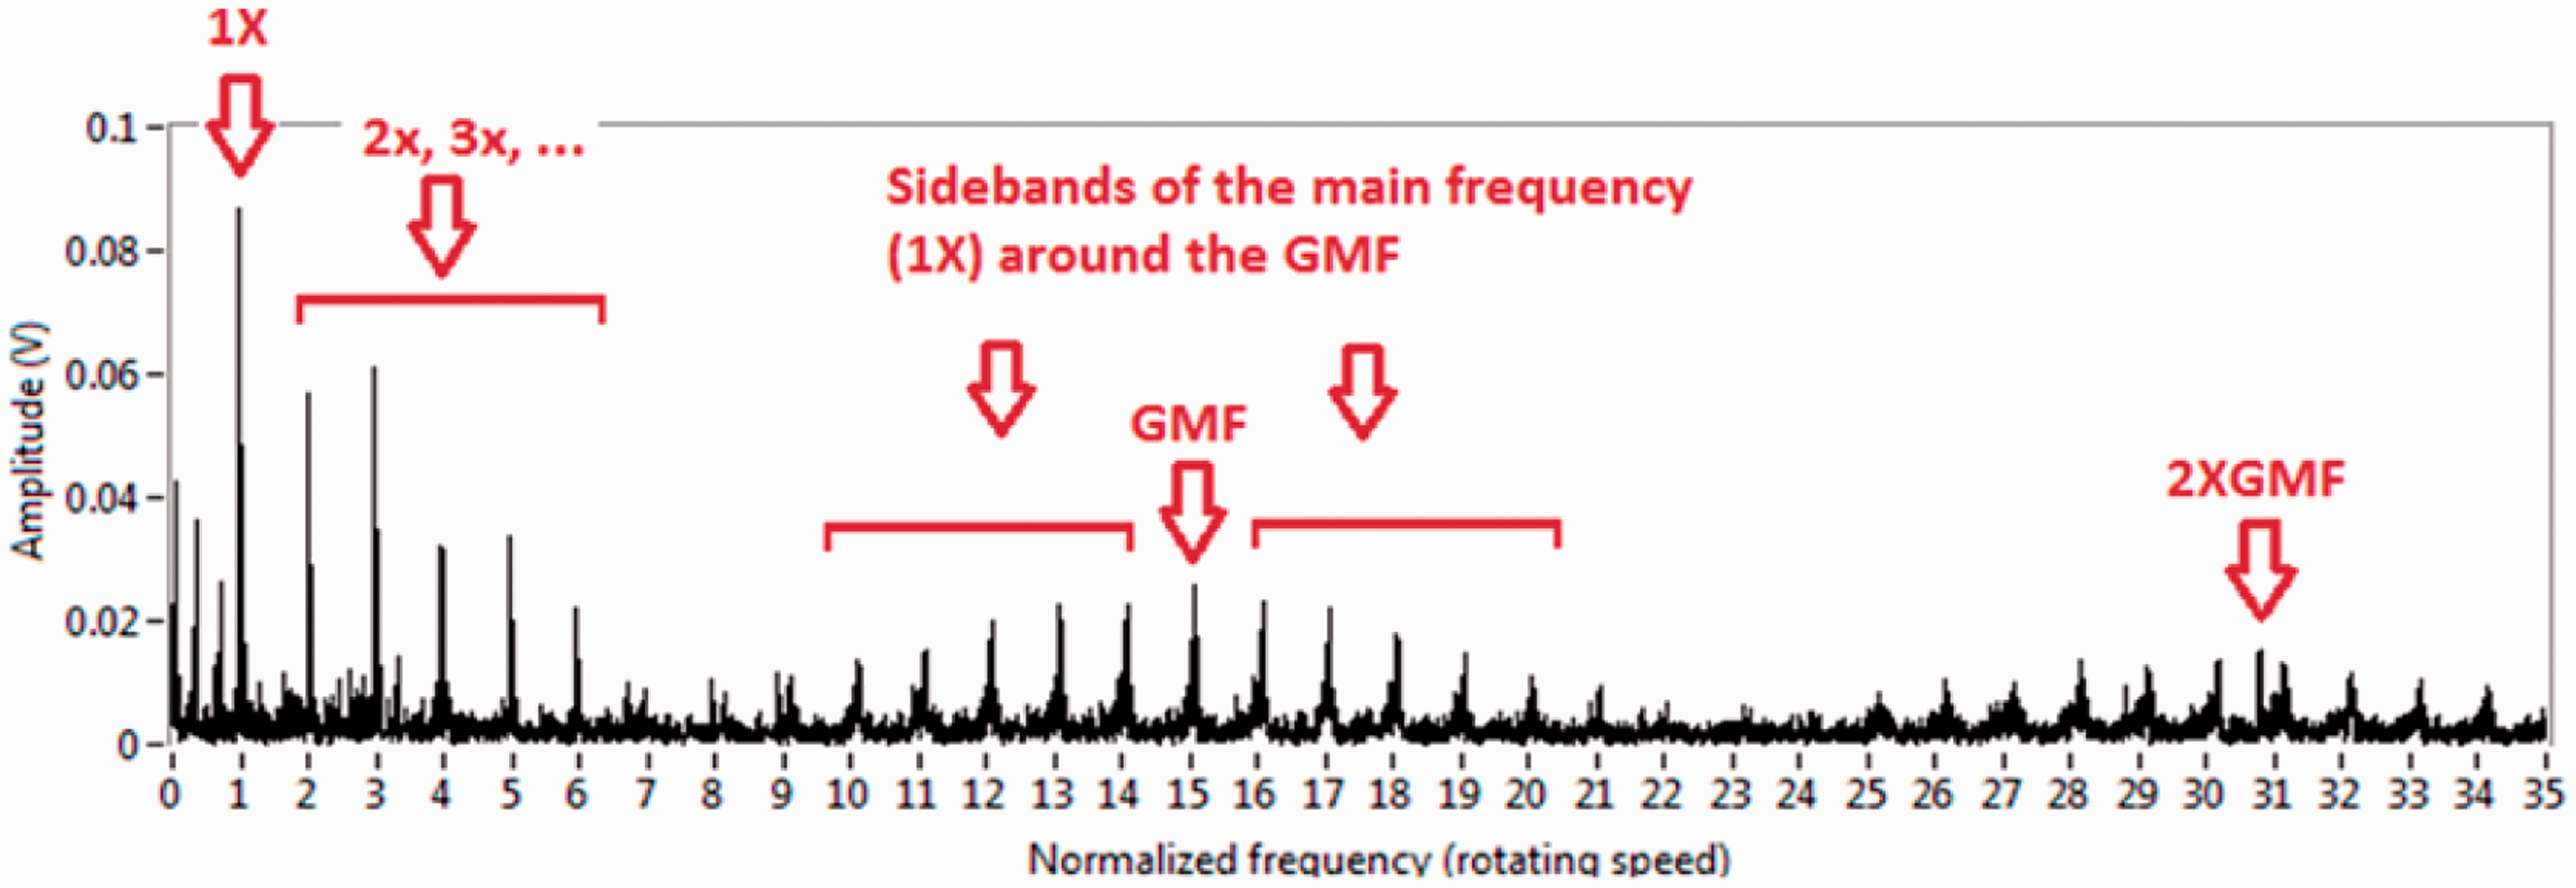
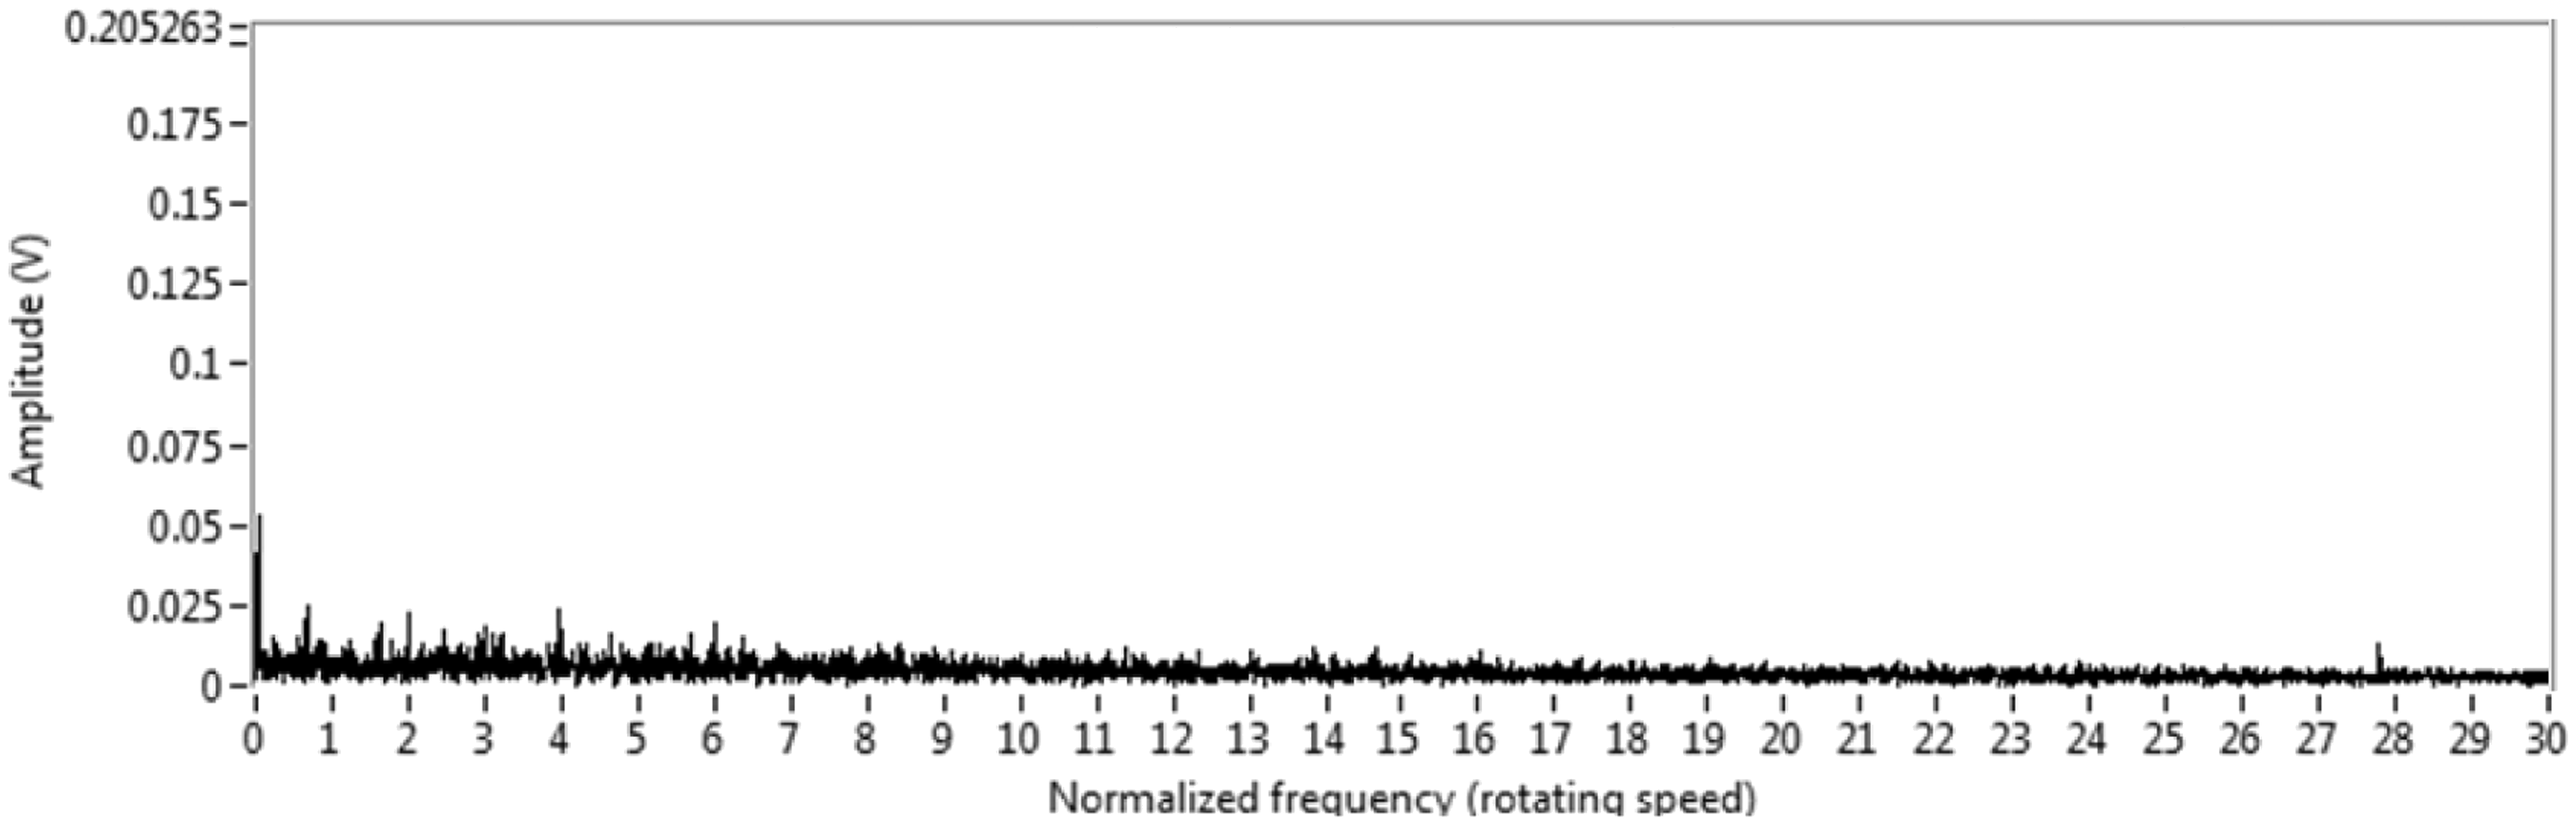
Figure 14 displays a representative AE signal. The envelope of the AE signal was extracted by applying the HT as presented in section ‘Signal processing applied to acoustic emission signals.’ Following this, an FFT was calculated to extract the characteristic frequencies of the AE envelope shown in Figure 15. In this plot, several modulation frequencies are present. These include the rotating speed (1X) and harmonics (2X, 3X, 4X), gear mesh frequency (GMF) and sidebands of the main frequency. In addition modulation at two times the GMF is present in the AE envelope spectrum. However, a small number of samples of the acquired present this type of modulation. Most of the samples present a nearly flat AE envelope spectrum with no characteristic frequencies as shown in Figure 16. The presence of modulation peaks in the envelope analysis is usually attributed to gear and bearing faults.39,40 However, the modulation appears randomly in few samples, which is probably due to the variable load effect from wind turbulence. Thus, the presence of the characteristic frequencies in the envelope spectrum is attributed to increased torque produced by strong wind gusts. Wind bursts create an abrupt change in load that increases the AE generated in gear mesh producing a modulation in the AE signal.
AE time domain signal. Envelope spectrum of the AE signal showing some characteristic frequencies of the gearbox. Typical envelope spectrum in which no characteristic frequencies are present.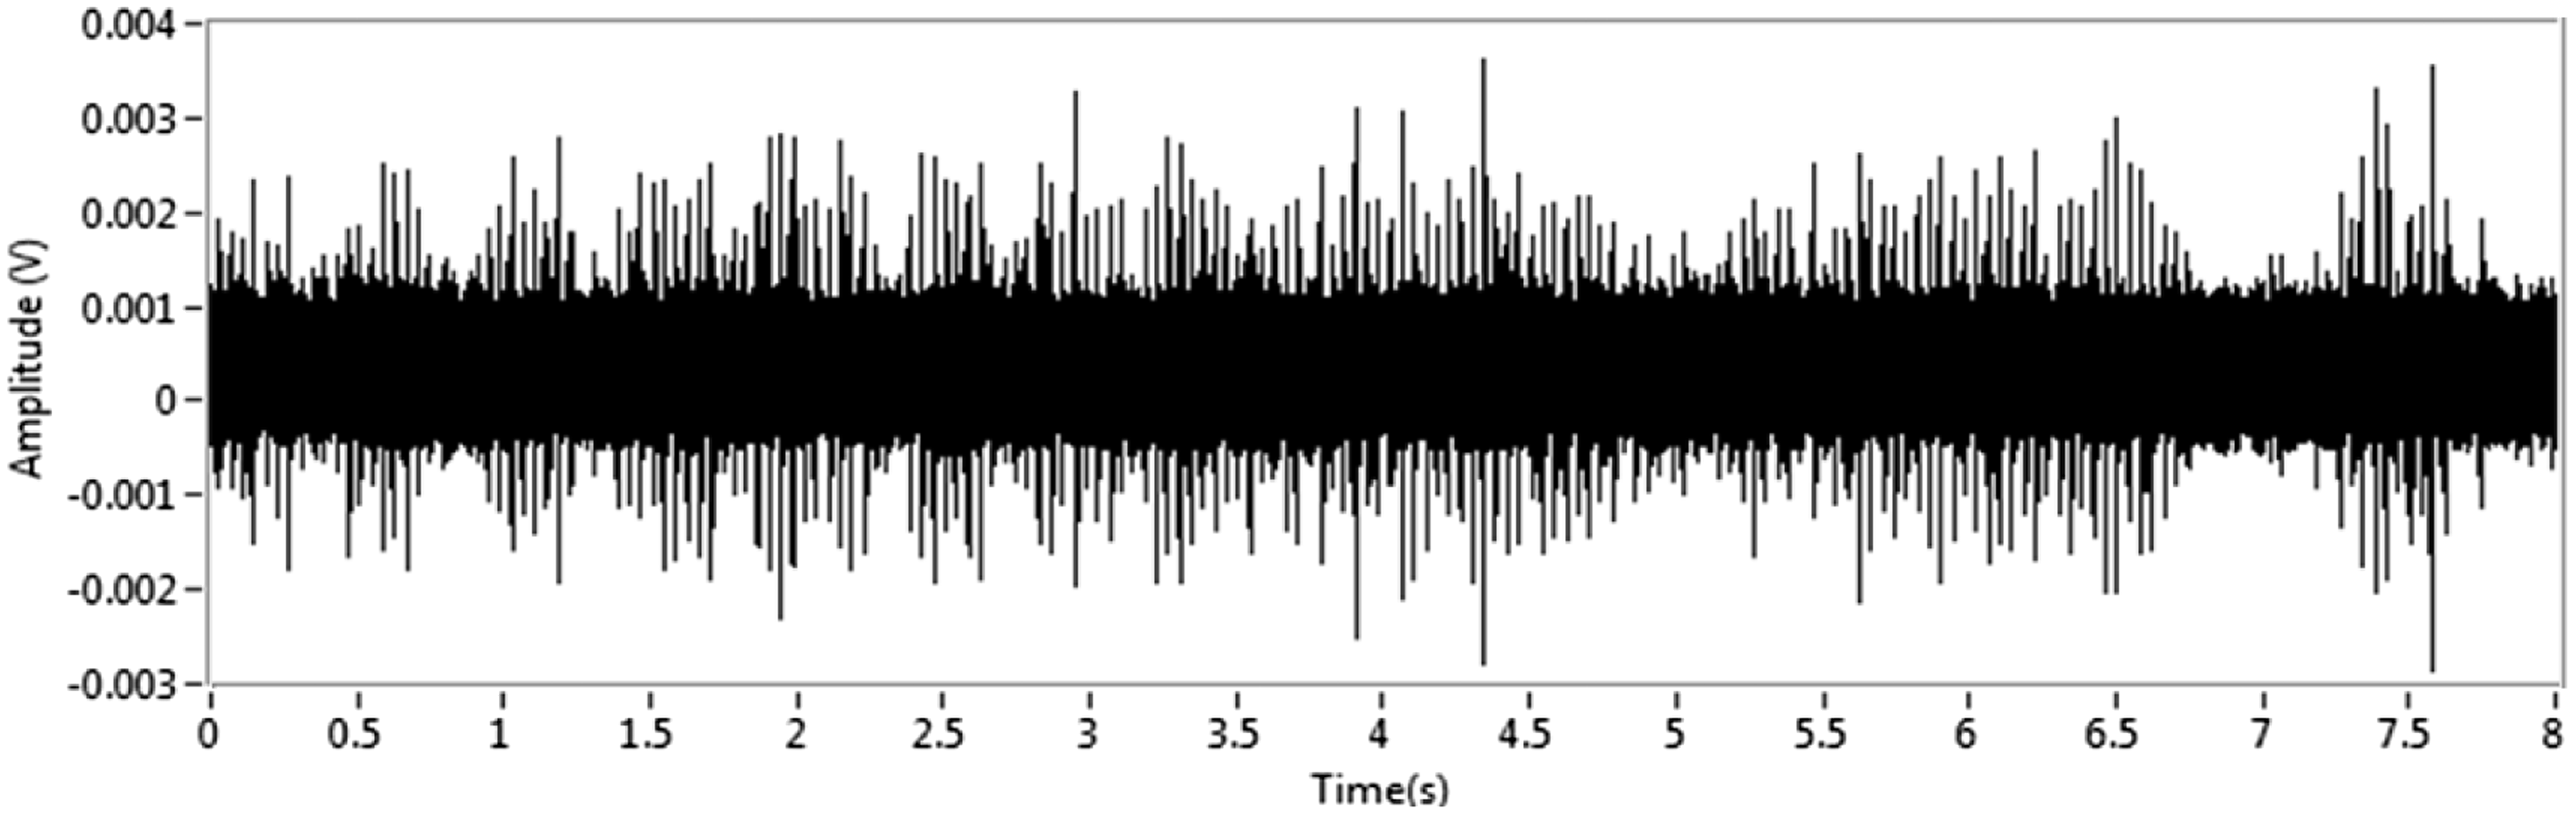
Conclusions
Multi-MW industrial wind turbines readily incorporate CM systems. However, with a large number of wind turbines in the field still without built-in CM it is necessary to monitor the gearbox, which is a critical and expensive component. The relatively slow rotation of the wind turbine, limits the overall efficiency of the widely used vibration monitoring technique and other traditional techniques as an early warning signal. For these reasons, in this paper, the application of AE for wind turbine gearbox CM has been explored. The baseline of a healthy gearbox and the impact of different operational conditions are presented. These results provide excellent information for the development of an alarm-based CM systems for wind turbines gearboxes.
The results obtained in this investigation show that the impact of power output and torque on the AE signals generated by the wind turbine gearbox is high. In addition, the signals show high uncertainty (standard deviation) which increases with power output. Furthermore, also the results obtained using envelope analysis with the AE signals draw high variability with varying operating conditions. While in some samples the envelope spectrum is nearly flat, in other samples several sources of modulation are observed including harmonics of the rotating speed and gear mesh frequency. Thus, to obtain consistent results when applying envelope spectrum the average of multiple measurements should be performed. This will avoid the false alarms generated by the few samples with characteristic frequencies produced by wind burst. This study shows the baseline generated by a healthy gearbox as a function of torque and power output which can be used a pre-requisite for wind turbine gearbox monitoring. However, the signature generated by different failure modes is also required in order to find the different patterns among them. The results presented show the observations from one specific wind turbine; therefore, the observations extracted from other gearboxes are necessary to confirm these results. The authors highly encourage other researchers to publish results of monitoring gearboxes using AE from different wind turbines to confirm the conclusions of this study.
Identifying abnormal operation of rotating components of wind turbines is not sufficient. It is vital to know the remaining life of the subcomponent which shows the abnormal operation to plan the maintenance when it is most cost-efficient. Thus, the ultimate aim of CM is not only to detect the fault. The diagnosis and prognosis are also important aspects of CM. Further work must be carried out for diagnosis and prognosis which are vital aspects for predictive maintenance. 41
Footnotes
Acknowledgement
The authors are greatly indebted to the colleagues at CRES, particularly Dr Denja Lekou and Dr Fragiskos Mouzakis for their invaluable assistance during the instrumentation and testing at the NM-48 wind turbine in Lavrion, Greece.
Declaration of Conflicting Interests
The author(s) declared no potential conflicts of interest with respect to the research, authorship, and/or publication of this article.
Funding
The author(s) disclosed receipt of the following financial support for the research, authorship, and/or publication of this article: IntelWind Project is an FP7 project partly funded by the EC under the Research for the Benefit of SMEs programme, Grant Agreement Number 283277, coordinated and managed by Innovative Technology and Science Ltd. IntelWind is collaboration between the following organisations: Innovative Technology and Science Ltd, Corporate Services International, Atard Savunma ve Havacilik Sanayi Ileri Teknoloji Uygulamalari Arastirma ve Gelistirme A.S., Transense Technologies PLC, Romax Technology Ltd, Nuevas Energias de Occidente, S.L., Brunel University, Feldman Enterprises Ltd and Center for Renewable Energy Sources and Saving (CRES).