
Abstract
Location and geometry optimisations of Straight Plate Upstream Deflector (SPUD) for performance enhancement of a three-straightbladed Vertical Axis Wind Turbine (VAWT) are carried out at three regimes of tip speed ratios (TSRs). Results analysis reveals that SPUD location has significant effect on the power coefficient (Cp) increment of VAWT. Placing two SPUDs both upward and downward in upstream of VAWT can achieve the highest Cp improvement at all regimes of TSRs. Overall, placing SPUD in upstream of VAWT can improve the Cp value at all regimes of TSRs, but the percentage of improvement can vary. The largest Cp improvement of 126.7% is achieved at low regime of TSRs, while at the medium and high regimes of TSRs, Cp improvements decrease to 52.7% and 52.5%, respectively. Increasing the width of SPUD can increase the average VAWT Cp improvement by 2.83% at all regimes of TSRs.
Keywords
Introduction
Compared to drag-driven Vertical Axis Wind Turbine (VAWT), lift-driven VAWT is much more promising to be utilised as a power generation device due to its higher efficiency. However, in order to compete with commercial Horizontal Axis Wind Turbine (HAWT), lift-driven VAWT still needs to improve its efficiency and self-starting ability. One method that has been proposed and implemented to improve these two characteristics is by using flow augmentation devices to improve the incoming wind conditions around the turbines. This method is proved to be very effective by increasing the mass flow rate through the augmented area, resulting in an increased VAWT efficiency close to or even beyond the Betz limit (i.e., 59.3%) (Wong et al., 2017).
Based on the augmented flow direction, flow augmentation devices can be divided into two types, namely single directional flow augmentation and omnidirectional flow augmentation. Single directional flow augmentation devices, such as guide vane row and tail vane (Takao et al., 2009), diffuser (Letizia and Zanforlin, 2016; Watanabe, et al., 2016), curve plate upstream deflector (Stout et al., 2017) and Straight Plate Upstream Deflector (SPUD) (Kim and Gharib, 2013, 2014; Jin et al., 2018; Wong et al., 2018a, 2018b), benefit from simple design and light weight. However, they only work in one single direction of augmented flow, while omnidirectional flow augmentation devices have the ability to augment the flow in any direction. Nevertheless, single directional flow augmentation devices are more practical for VAWT applications, as omnidirectional flow augmentation devices such as omnidirectional guide vane (Chong et al., 2013; Wong et al., 2014) and omnidirectional stator (Nobile et al., 2014) are complicated in design and implementation. This study will focus on single directional flow augmentation and its application in VAWT.
Among single directional flow augmentation devices, SPUD has superior effectiveness, as it can improve the performance of VAWT while operating at all regimes of Tip Speed Ratios (TSRs) from low, medium to high (Wong et al., 2017). This is very important as VAWT tends to behave differently at different regimes of TSRs (Malael et al., 2014). Based on an evaluation of NACA 0021 aerofoil VAWT at low regime of TSRs (see, e.g., Castelli et al., 2011), it was found that during the operation, VAWT blades can experience higher angle of attacks (
More aforementioned, SPUD has the advantage of simpler design than most other single directional flow augmentation devices (e.g. a curved plate upstream deflectors that only give small performance increment, see Stout et al. (2017)) and has been widely applied in drag-driven VAWTs (Wong et al., 2017). The use of SPUD as a performance enhancement device for lift-driven VAWTs has also been investigated in several previous studies (Jin et al., 2018; Kim and Gharib, 2013, 2014; Wong et al., 2018a, 2018b). However, there are some limitations in those studies that need to be addressed. First, there is no investigation about the optimum location of the deflector in the upstream of lift-driven VAWT. For example, most of these studies (Jin et al., 2018; Kim and Gharib, 2013, 2014; Wong et al., 2018a, 2018b) choose one particular location at the upstream of VAWT (i.e., downward, upward or middle) without performing thorough parametric studies of the location and orientation effects, for example, the distance from the turbines in x and y directions. Second, most of previous studies only evaluated SPUD and performed geometry optimisation at a single regime of TSRs. It is known that flow around VAWT can behave quite differently depending on the TSRs regime of operation. One previous study did have evaluated geometry optimisations at wider regime of TSRs (Kim and Gharib, 2013). However, there was little explanation about the effect regime of TSRs on the geometry optimisations of SPUD with regard to the performance enhancement of VAWT. Third, there is little investigation on the use of SPUD for a single lift-driven VAWT with high solidity.
Therefore, the present study will address all these limitations identified in previous studies by including the location effect as well as performing geometry optimisation of SPUD at all regime of TSRs. Three regimes of TSRs at low, medium and high are considered with each regime of TSRs represented by one TSR value (e.g., low regime of TSRs = 1.44, medium regime of TSRs = 2.64 (optimum TSR), and high regime of TSRs = 3.3), due to similar behaviour of flow around VAWTs at the same regime of TSRs (Malael et al., 2014). A three-straight-bladed lift-driven VAWT configuration is adopted to accommodate higher solidity, and Computational Fluid Dynamics (CFD) is utilized to evaluate the effects of location and geometry of SPUD on the performance of lift-driven VAWT. In order to reduce the computational cost of running a full 3D simulation, a 2D plane cutting through the middle of 3D blades is considered and this approach has been widely used in design and optimisation process of devices that are utilized to improve the performance of VAWT (Acarer, 2020; Bianchini et al., 2019; Chen et al., 2015; Chong et al., 2013; Choudhry et al., 2016; Mohamed et al., 2020; Nobile et al., 2014; Sobhani et al., 2017; Stout et al., 2017; Yan et al., 2019a; 2019b, 2020). Moreover, it was concluded from the previous studies that 2D computational model of VAWT can give reasonable overall prediction on the performance and flow field around a rotor in the turbine mid-plane (Bianchini et al., 2017; Rezaeiha et al., 2018a). A hybrid Reynold-Averaged Navier Stokes-Large Eddy Simulation (RANS-LES) model applying Stress-Blended Eddy Simulation (SBES) together with Transition Shear-Stress Transport (TSST) turbulence model is applied for CFD simulations as this model can produce lower discrepancies of power coefficient (Cp) prediction compared to other URANS turbulence models (Syawitri et al., 2021) at all regimes of TSRs. All CFD simulations are carried out using ANSYS Fluent v19 (ANSYS, 2020).
Geometry specification
Bare VAWT
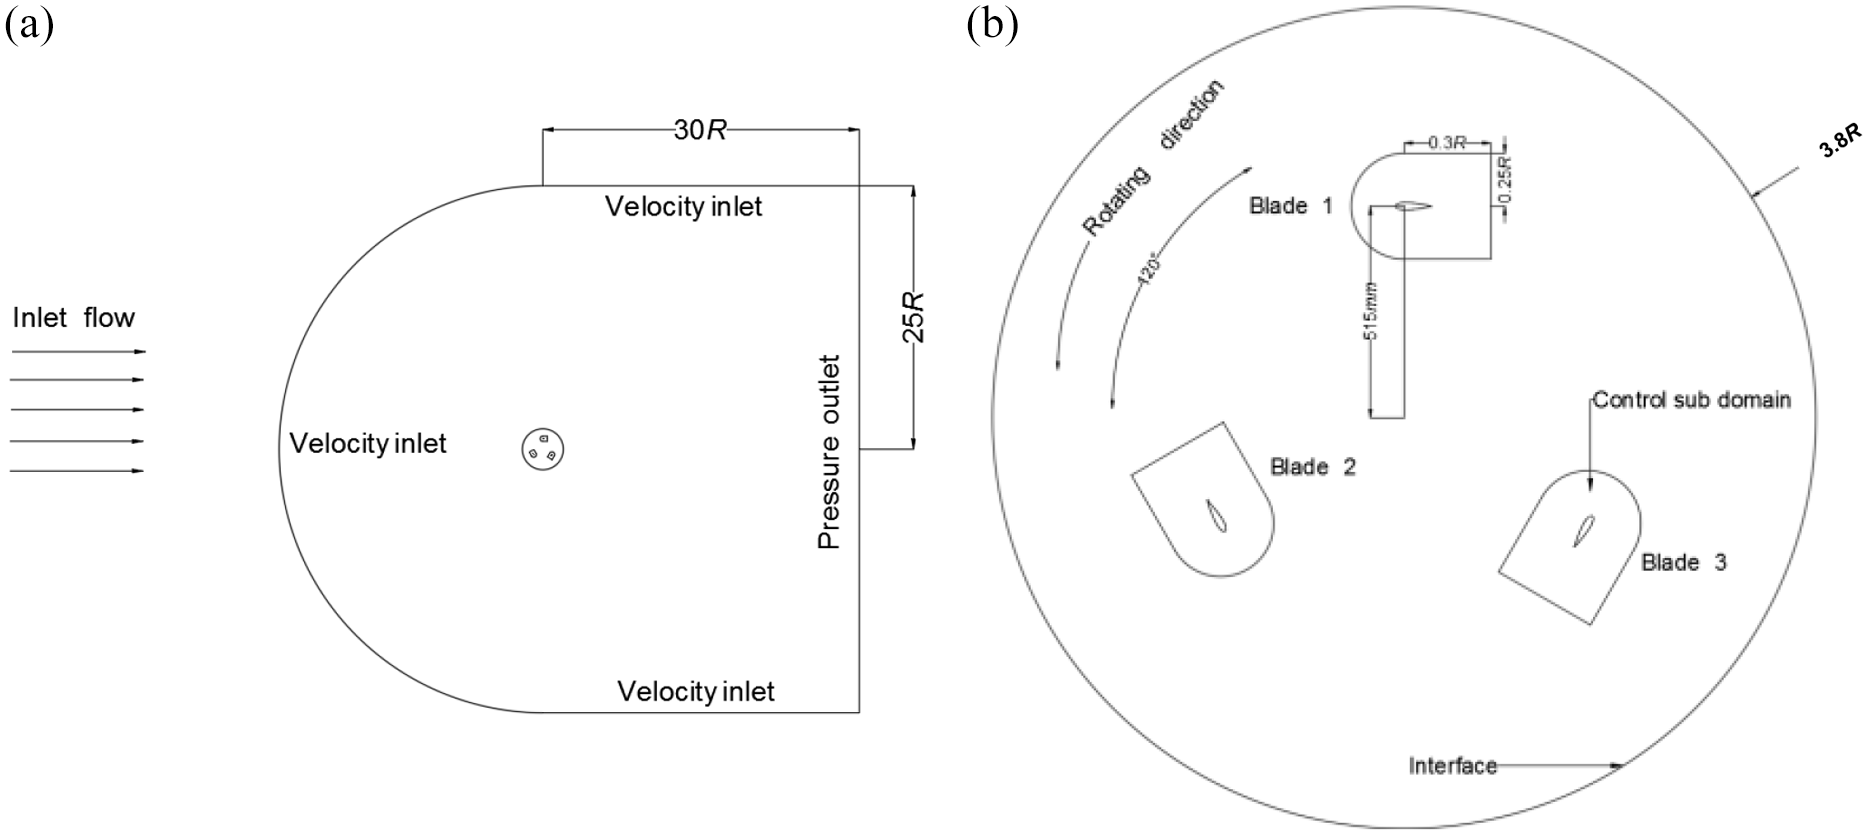
A bare VAWT adopted in this study is a three-straight-bladed lift-type VAWT with NACA 0021 aerofoil (see Figure 1) that has been studied experimentally and numerically by Castelli et al. (2011). This configuration has been widely used as a validation test case in several numerical studies (Ghazalla et al., 2019; Rezaeiha et al., 2019; Sobhani et al., 2017; Wang et al., 2018). Table 1 gives the main geometrical features and the operational parameters of both numerical and experimental models. In this study, all flow parameters are from Castelli et al. (2011). The bare VAWT is simulated over a wide regime of TSRs, particular at three TSRs regimes, namely low regime of TSRs (1.44–2.00), medium regime of TSRs (2.00–2.64 (optimum TSR)) and high regime of TSRs (2.64–3.3). The free stream velocity (

where R (m) is the turbine radius.
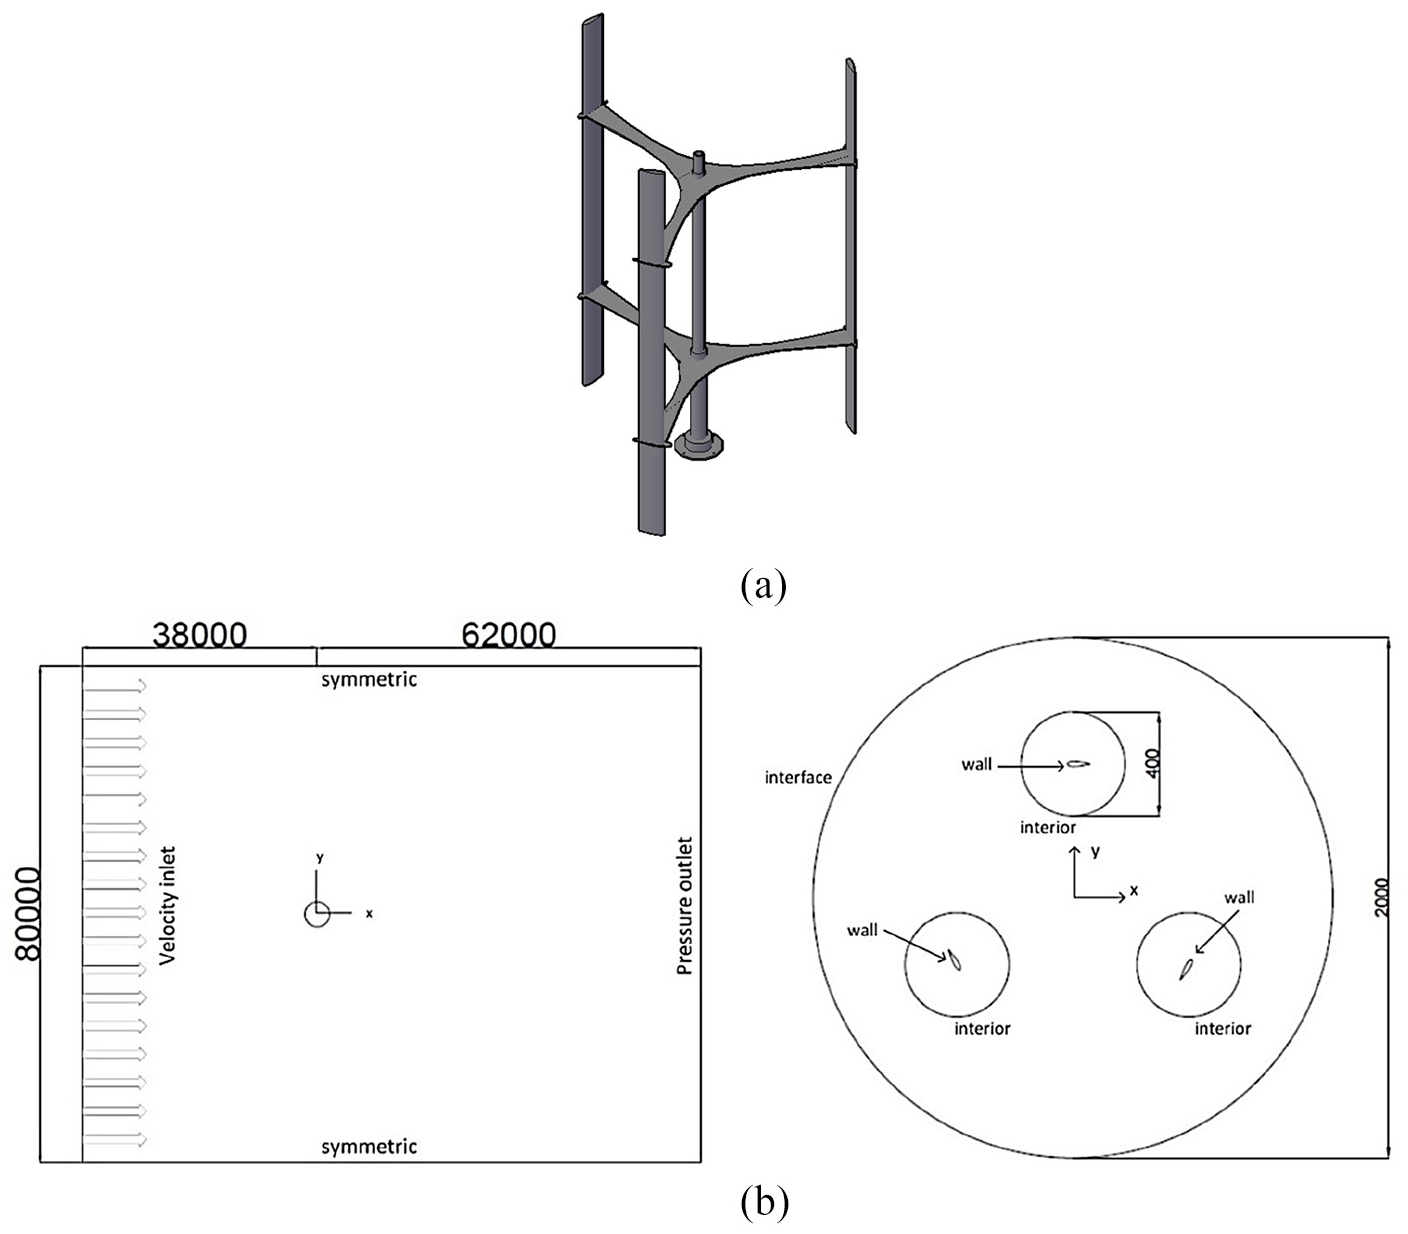
Bare VAWT model of Castelli et al. (2011), (a) 3D schematic of the turbine (experimental) and (b) 2D computational domain (not in scale; all measurements are in mm).
Main geometrical features and operational parameters of Castelli et al. (2011) model.
VAWT with straight plate upstream deflector
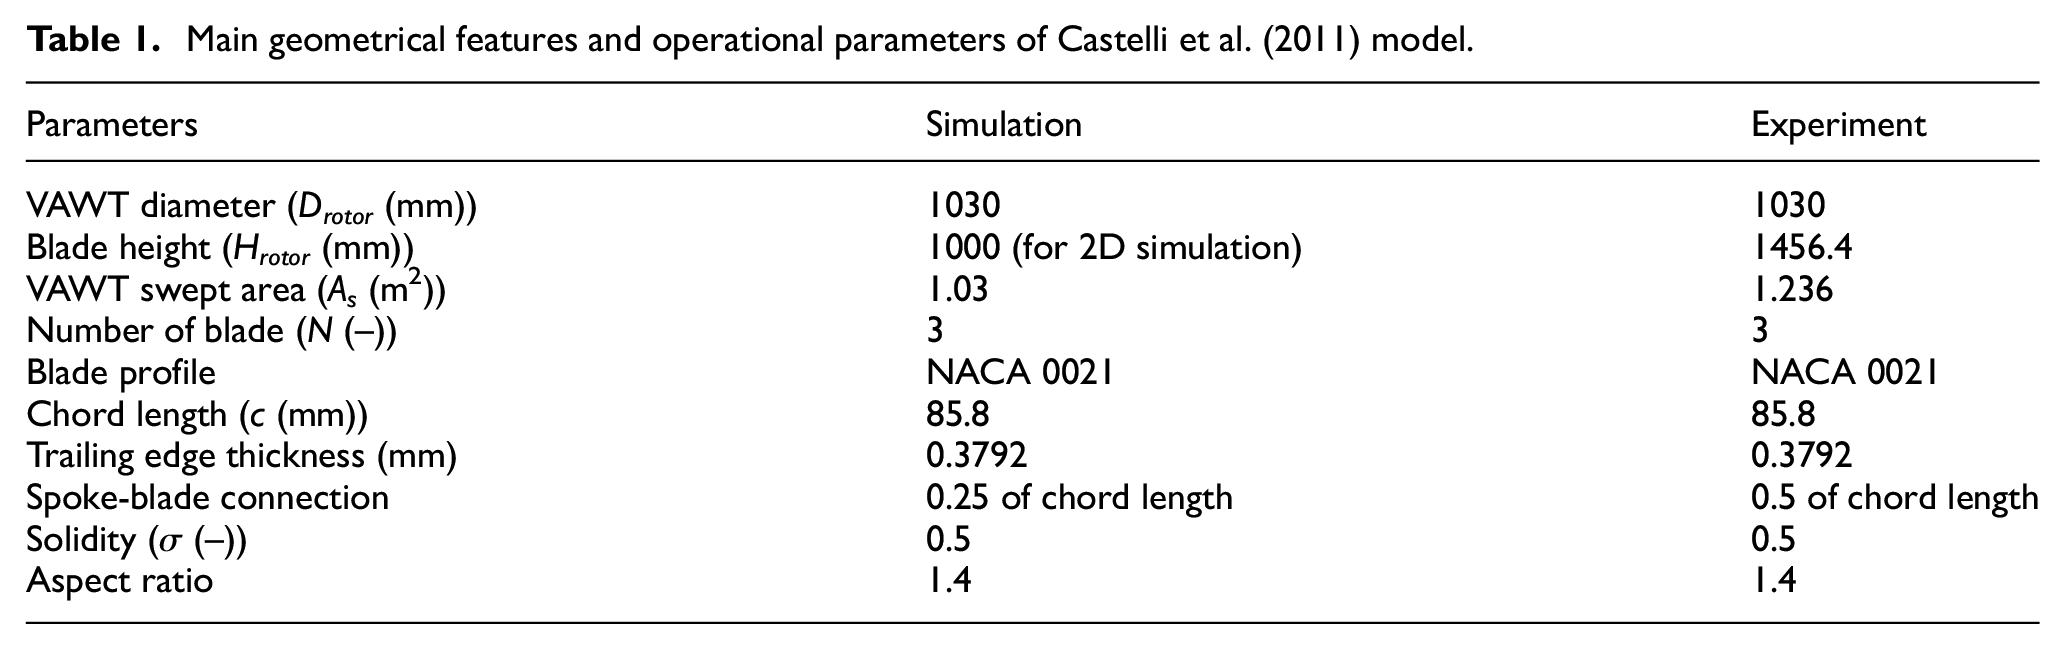
The effect of SPUD on VAWT performance improvement is investigated by placing straight plate deflector in upstream of a 2D plane cutting through the middle of a three-straight-bladed VAWT model. All turbine geometries are kept the same as the bare VAWT model. A baseline SPUD geometry (see Table 2 and Figure 2, respectively) is adopted from a previous study of Kim and Gharib (2013) due to same regime of Reynolds number investigated.
Geometry specification of a base SPUD.
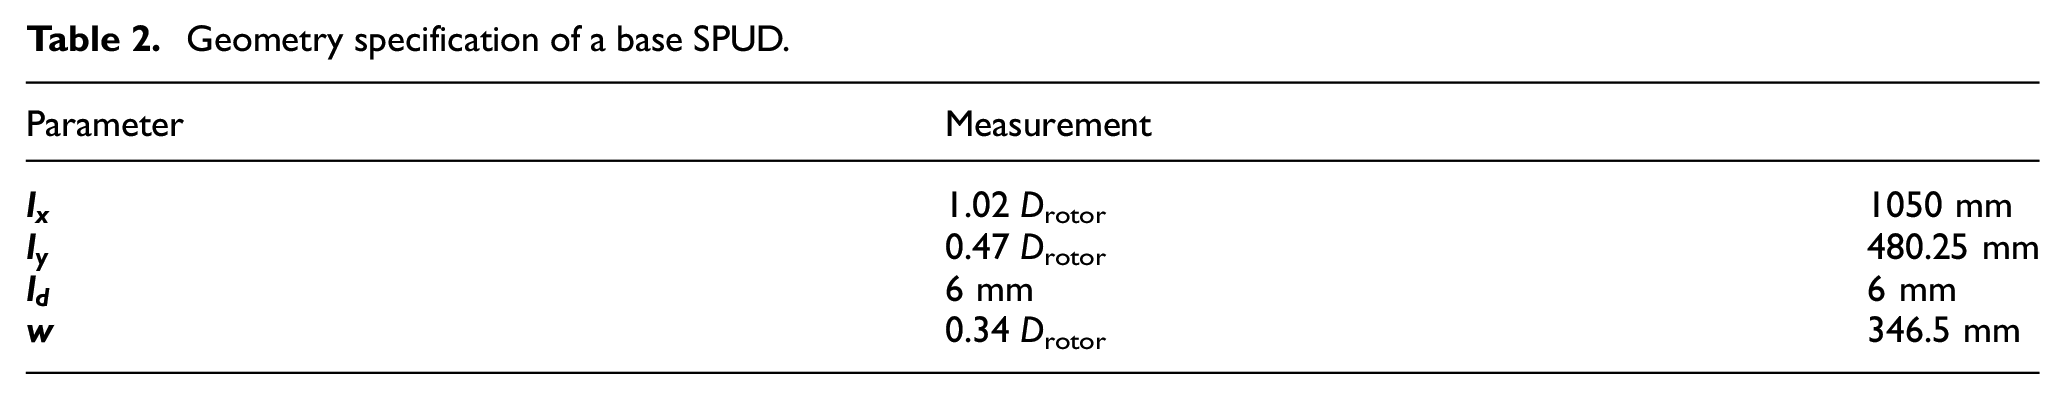
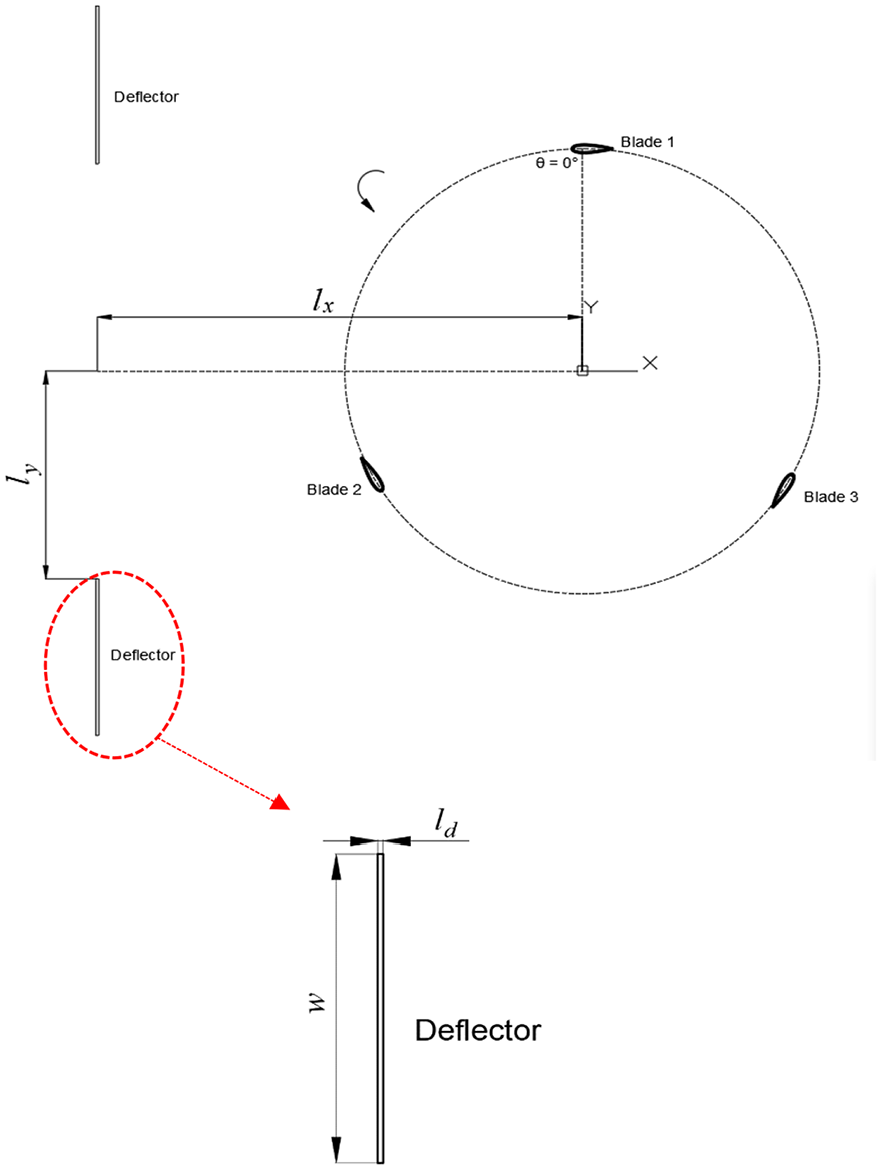
Detailed geometry of VAWT with SPUD, where
For design optimisation, three parameters, namely location, width and inclination angle of the SPUD, are considered. First, the effect of four SPUD locations in upstream of VAWT (i.e., upward, middle, downward, and both upward and downward) on the average power coefficient over one turbine revolution (Cp-ave) of VAWT is investigated. After identifying the SPUD location with the best performance, the effects of the width and inclination angle of SPUD on the Cp-ave production of VAWT are studied respectively. Noting that all of these investigations performed at all regimes of TSRs with TSR = 1.44 represents low regime TSRs while medium and high regimes of TSRs are represented by TSR = 2.64 and TSR = 3.3, respectively.
CFD simulation
Domain decomposition and grid generation
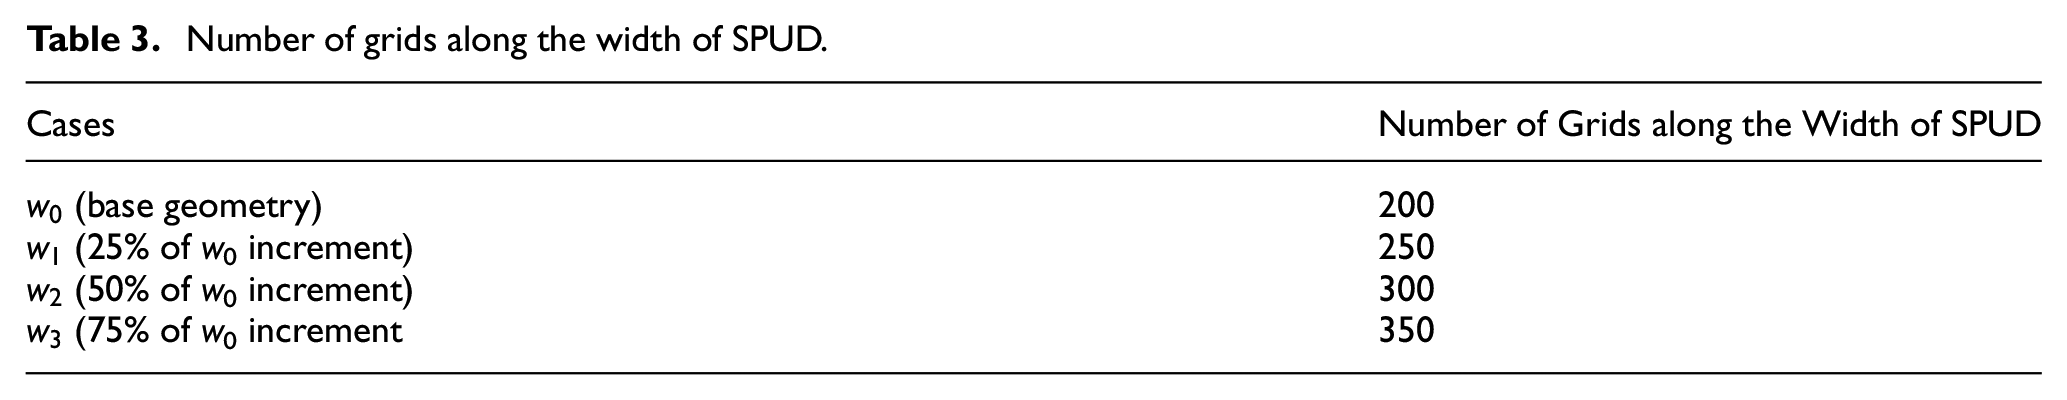
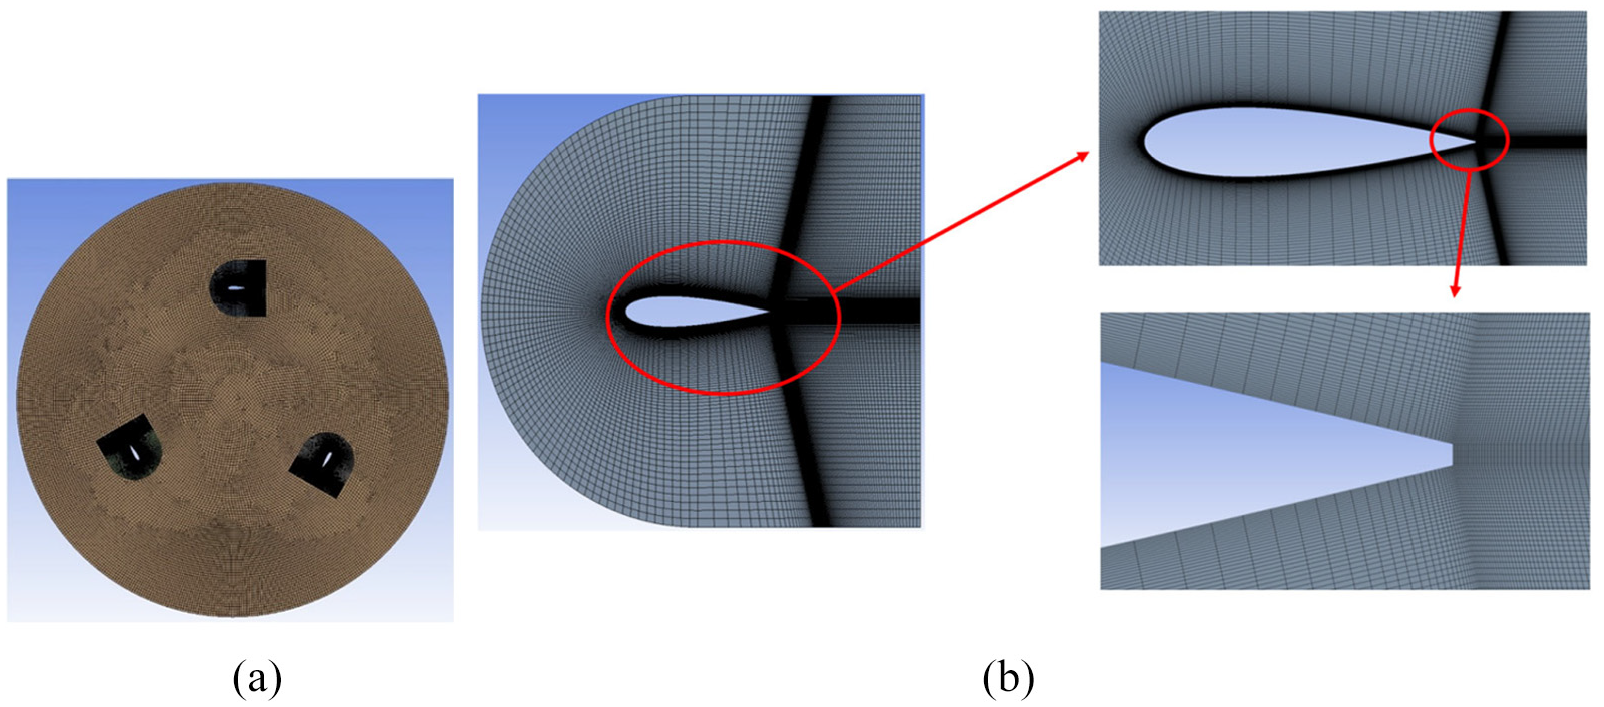
A C-type grid generation is adopted in this study. The simulation domain is divided into three sub-domains, namely the far-field, the rotating core and the control zone (see Figure 3). The far-field sub-domain is constructed by a C-shape together with a rectangular enclosure. The C-shape has 25R in radius and the rectangular enclosure has 30R in stream-wise distance from the centre of the turbine rotating axis to the exit plane as suggested by Zhu et al. (2018). SPUD is located in the far-field non-rotating sub-domain, surrounding the rotating core sub-domain. Hence, there is a slightly different approach to generate the grids in this domain between bare VAWT and VAWT with SPUD (see Figure 4). Structured grids are generated within the far-field sub-domain (see Figure 5(a)). The detailed grids around the deflector can be seen in Figure 5(b). Around the deflector, 50 grids are generated along the thickness of the deflector. Along the width of the deflector, 200 grids are created for the base SPUD. The number of grids increases with the increase of the width of the SPUD (see Table 3). The grids are distributed along both the thickness and width of the deflector by using finer grids to accommodate the near wall y+ criteria (e.g., y+< 1 for Transition SST turbulence model).
2D computational domain and rotating core sub-domains. (a) Computational domain. (b) Rotating core sub-domain.
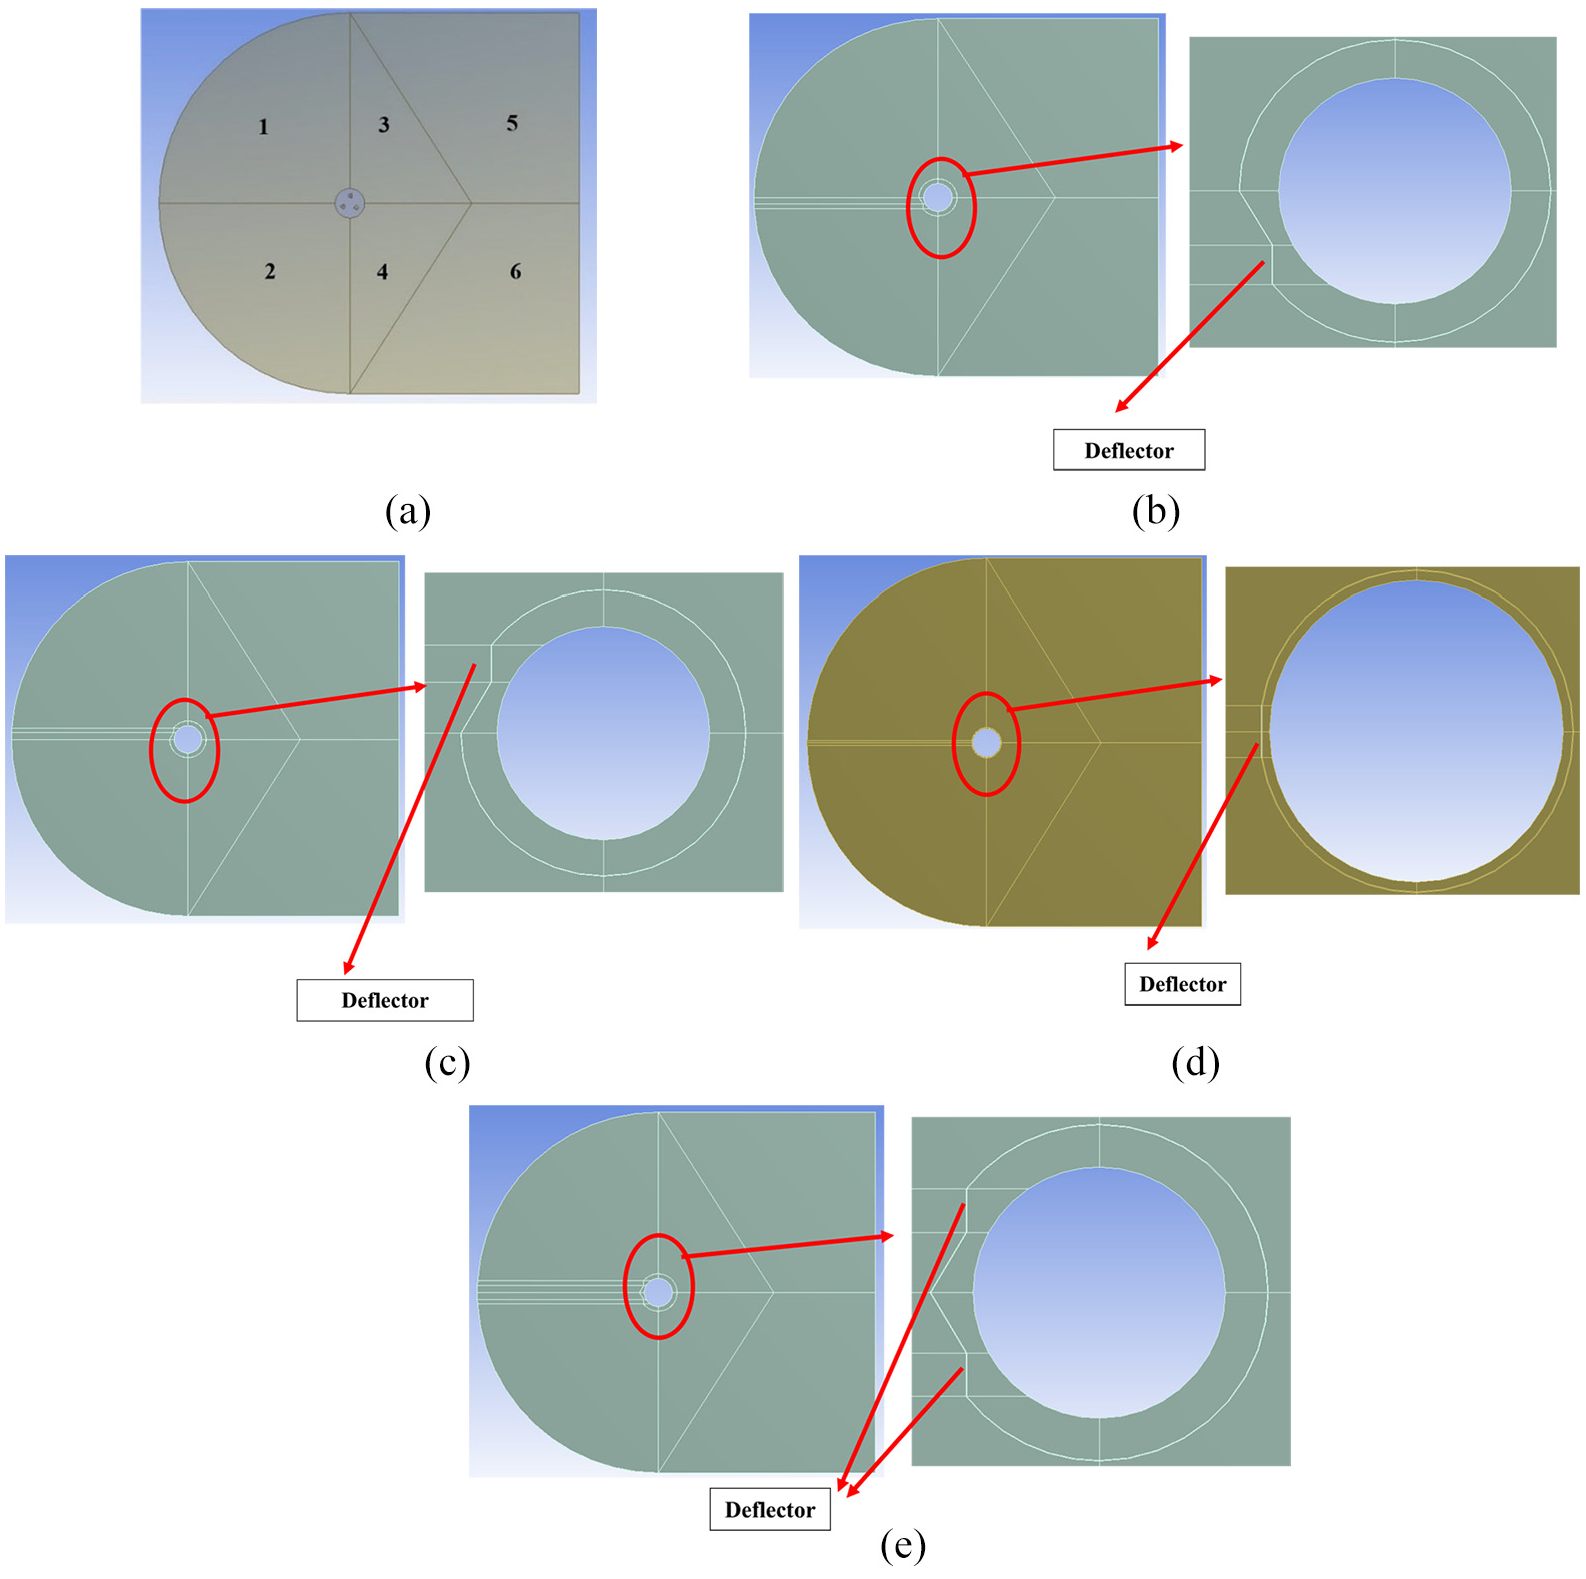
Comparison of the far-field sub-domain partition between base VAWT and VAWT with SPUD (four scenarios). (a) Base VAWT. (b) VAWT with a downward SPUD. (c) VAWT with an upward SPUD. (d) VAWT with a middle SPUD. (e) VAWT with both upward and downward SPUD.
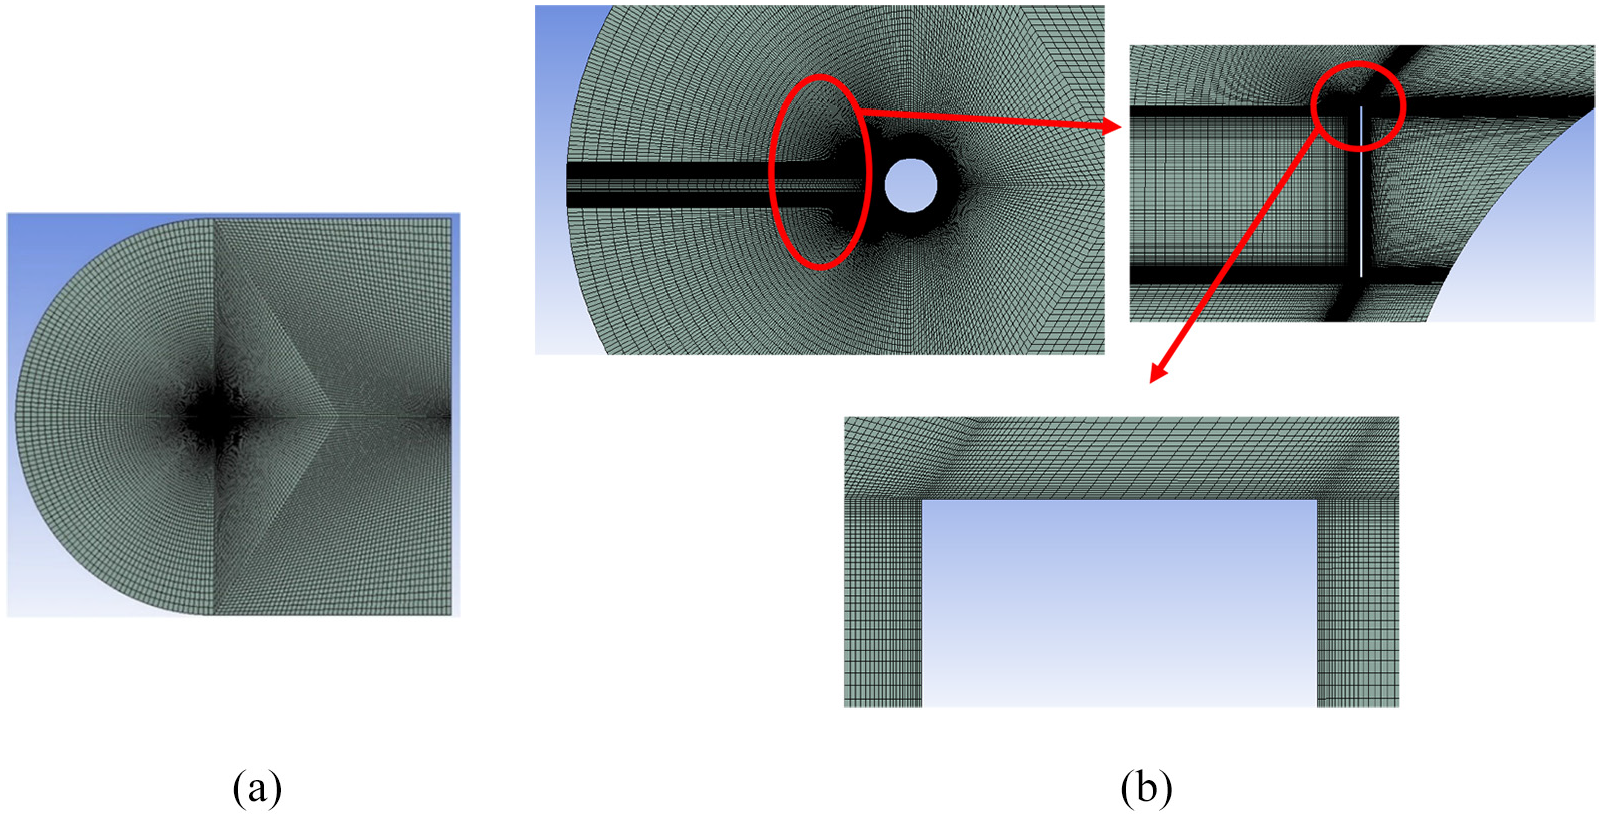
Detailed grids within the far-field sub-domain. (a) Detailed grids in the far-field sub-domain of a bare VAWT. (b) Detailed grids in the near wall region of SPUD.
Number of grids along the width of SPUD.
As mentioned above, the far-field sub-domain surrounds the rotating core sub-domain. This rotating core sub-domain is utilized to implement the revolution of the turbine, which is A circle shape domain with 2000 mm in diameter (about 1.94 times of the turbine diameter) is applied and it rotates in anti-clockwise direction around the rotating axis of the turbine at a given rotational speed. As mentioned in the previous studies (Balduzzi et al., 2016; Rezaeiha et al., 2018b), the size of rotating core needs to be at least around 1.5–2 times of turbine diameter to avoid unwanted disturbances produced by the sliding interface. Grids with quadrilateral dominant elements are implemented in this sub-domain (see Figure 6(a)). At the boundary intersection between the far-field and the rotating core sub-domains, a ‘fluid-fluid’ interface is set up to ensure the continuity of fluid flow cross these two sub-domains.
Detailed grids within (a) rotating core and (b) control sub-domains.
Inside the rotating core sub-domain, three control sub-domains with inserted blades are constructed for grid generation around the blades. These three control sub-domains are separated by 120° angular distance between the two adjacent blades. A C-shape with 0.25R in radius and 0.3R in length from the centre of the blade is used to construct each control sub-domain. Boundaries between three control sub-domains and the rotating core sub-domain are interpreted as “interior” to ensure the continuity of the fluid flow. Structured quadrilateral grids are generated in each control sub-domain, with fine grids in the near wall region (see Figure 6(b)) and coarse grids away from the wall. To satisfy the criteria of TSST turbulence model, the non-dimensional wall distance y+< 1 is adopted for generating the first layer height of the grid away from the wall of the blades.
Turbulence model
A hybrid RANS-LES turbulence model called Stress-Blended Eddy Simulation (SBES) is applied and this model is known for better resolving the Grid Induced Separation (GIS) issue occurred when the mesh is refined in the boundary layer region (Frank and Menter, 2017). This issue often appears in some hybrid RANS-LES turbulence models such as Detached Eddy Simulation (DES), Delayed-Detached Eddy Simulation (DDES) and Improved-Detached-Delayed Eddy Simulations (IDDES). The reason for GIS occurrence is mainly because there is improper balancing between RANS and LES turbulence contents due to the influence of LES grid limiter on the RANS model. In separating shear layers (SSL) region between RANS and LES zones, GIS can be triggered by the tendency of ‘slow’ transition from the RANS to the LES due to there is no clear differentiator between the two regions (Frank and Menter, 2017).
SBES turbulence model modifies the shielding function of the shielded DES (SDES) SST model by visualizing the shielding function and automatically switching to an existing algebraic LES model in the LES zone (Menter, 2018), thus to protect the RANS boundary layers and improve the ‘clearness’ of boundaries between the RANS and the LES zones. An explicit model is introduced to switch to an algebraic LES while maintaining the blending function the same as that of the shielding function SDES (fSDES) in the LES zone where fSDES = 0. As a result, the turbulence stress tensor and the turbulence eddy viscosity equations are modified as


where
SBES model can be changed rapidly from the RANS to the LES shielding function in SSL region, due to its lower enforced turbulence stress level of LES model, which then can produce better, realistic, and consistent solutions. In addition, SBES model works well on a coarser grid for predicting a RANS-LES ‘switch’ compared to some hybrid RANS-LES turbulence models such DES, DDES and IDDES so that the computational cost can be largely reduced.
Computational settings
In order to solve the governing equations with hybrid RANS-LES model, a coupled numerical scheme for pressure-velocity coupling and a second-order scheme for temporal and spatial discretization are adopted in this study. A bounded central differencing scheme is implemented for momentum spatial discretization due to the requirement of hybrid RANS-LES turbulence model. All residual convergence criterions for the inner loop are set to be equal to or less than 10-6. A total of 40 sub-iterations per time step is applied as suggested by Balduzzi et al. (2016) and this setting can reduce the turbulence kinetic energy residuals by an order of 10-4.
In this study, the time step is set to be equal to the lapse time of a rotor making a 1° rotation. It was found that this time step is sufficient for a stable VAWT simulation (Syawitri et al., 2020, 2021). Final results of statistically converged data are retrieved from the 35th revolution, based on previous studies (Syawitri et al., 2020, 2021) which have revealed that simulation using SBES model with Transition SST generally requires 34 revolutions before the difference of moment coefficient (Cm) between two neighbouring revolutions becomes less than 0.1%.
Model validation
The grid independence and model validation studies of VAWT CFD simulation have already been documented in the work published by present authors (Syawitri et al., 2020, 2021). In summary, three grid resolutions from coarse, medium, to finer meshes, each having 87, 174 and 348 cells around the blade, were considered for grid independence studies (Syawitri et al., 2020). Figure 7 gives instantaneous moment coefficient (Cmi) variations along azimuthal position, illustrating a small difference between the medium and the fine grids whilst the coarse grid could not produce satisfying instantaneous moment coefficients (Syawitri et al., 2020). These studies (Syawitri et al., 2020, 2021) have also found that better Cp-ave predictions can be produced even with the same turbulence model used by Castelli et al. (2011) and this is likely due to the improved grid quality, smaller time step and higher order of residual convergence criterion and increased number of internal iterations (Syawitri et al., 2021).
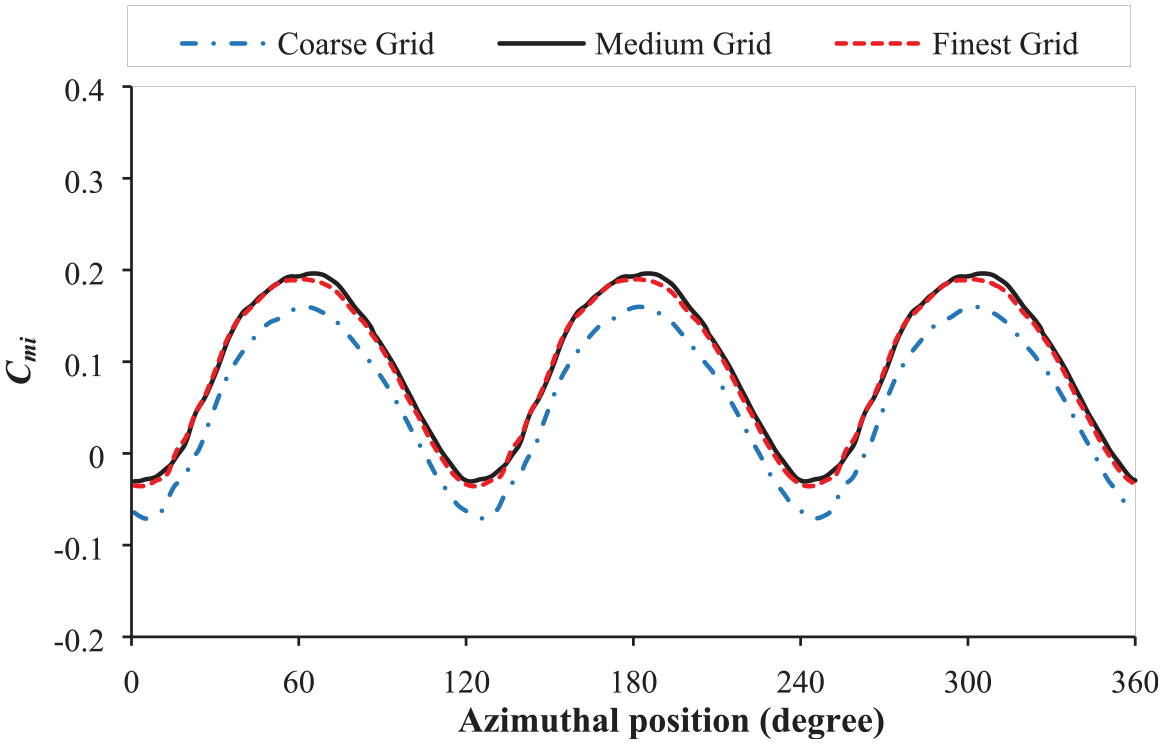
Comparison of instantaneous moment coefficients of VAWT with different grid resolutions for C-grid (Syawitri et al., 2020).
Moreover, these previous studies have found that SBES with TSST turbulence model has the ability to significantly reduce the discrepancy of power coefficient between CFD prediction and experiment results at all TSRs operations, compared to URANS turbulence models (Syawitri et al., 2020, 2021). In particular, SBES with TSST model is superior compared to URANS realizable k-ε turbulence model with enhanced wall treatment (RKE) that was used in the study of Castelli et al. (2011) at low regime of TSRs only. The Cp-ave prediction shows that RKE turbulence model produces nearly 450% of discrepancy compared to experiment data while SBES with TSST can reduce this discrepancy to less than 60% at low regime of TSRs. The ability of SBES with TSST turbulence models to improve the Cp-ave prediction is also found better than RKE turbulence models at the medium and high regimes of TSRs. While RKE generates about 16% of discrepancy compared to experiment data, SBES with TSST produces very small discrepancy of around 1% compared to experiment data (see Figure 8). Furthermore, SBES model was found to have the ability to predict accurate dynamic stall behaviour, compared to RANS turbulence models as implicated by vortex shedding away from near blade wall. In addition, weak trailing edge rolling up at high regimes of TSRs can be predicted by SBES with TSST turbulence model while URANS turbulence models only capture weak vortex shedding around the trailing edge (Syawitri et al., 2021).
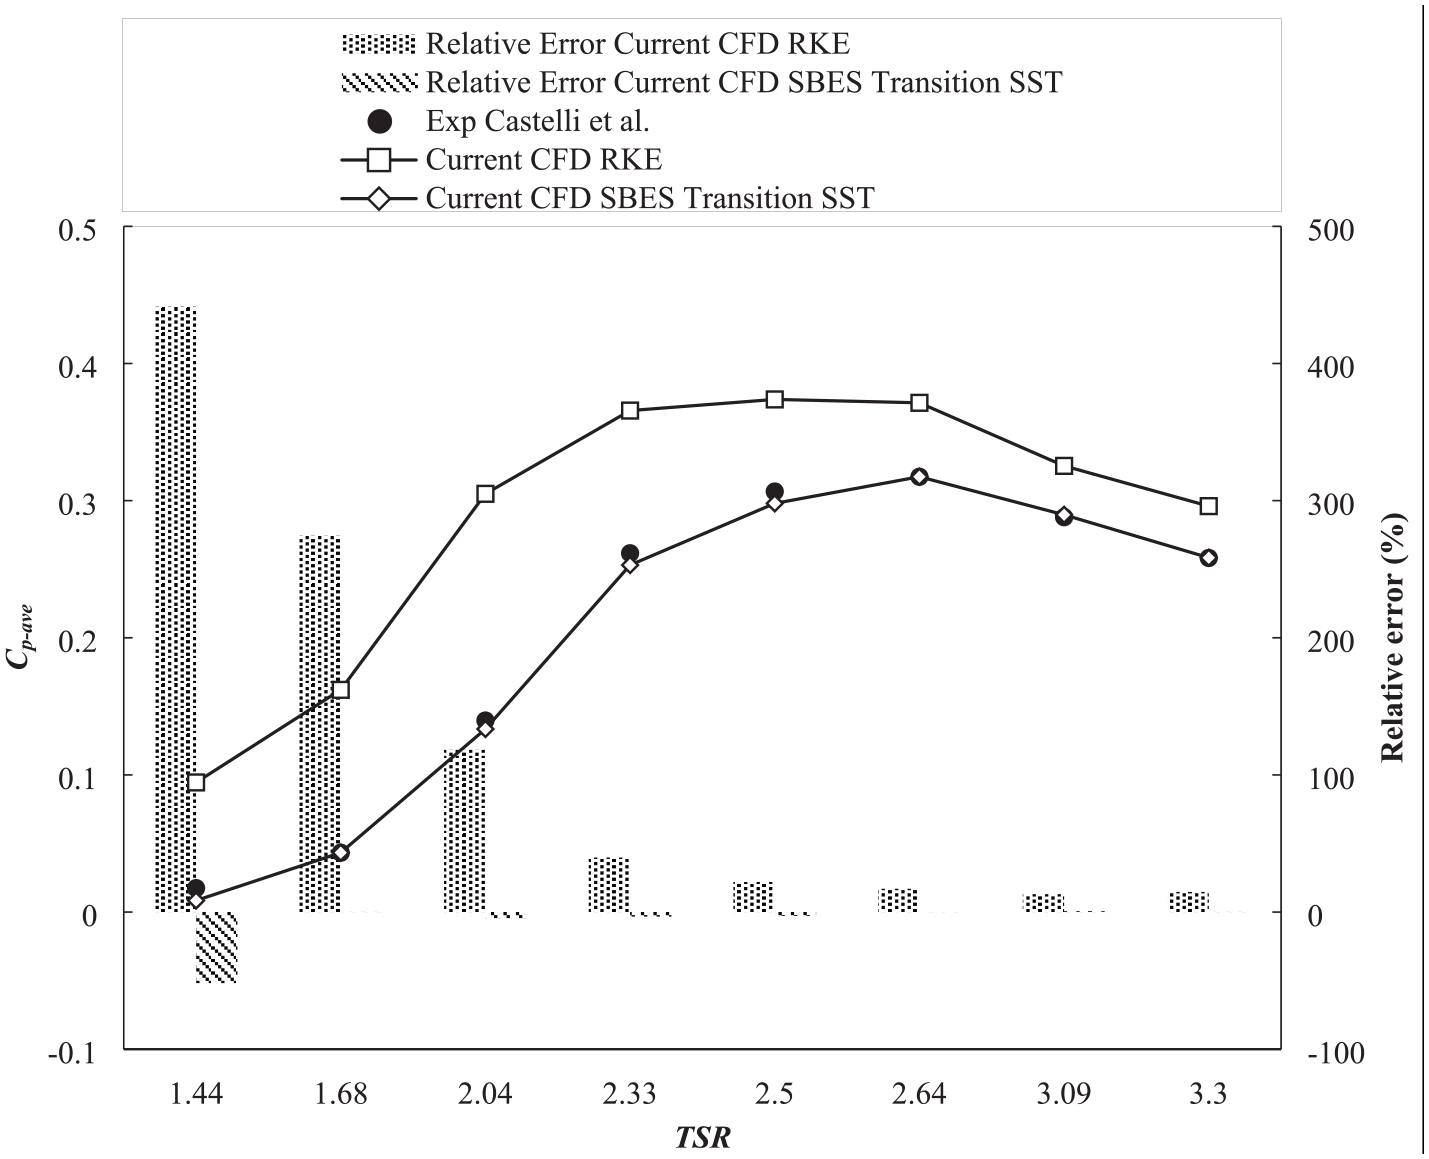
Comparison of average power coefficients between the experiments of Castelli et al. (2011) and current CFD simulation as well as relative errors in percentage (Syawitri et al., 2020).
It is worth noting that the primary purpose of this 2D simulation study is to perform geometry optimisation of SPUD as a practical solution for performance enhancement of VAWT at all regimes of TSRs, while still having reasonable accuracy. As mentioned above, this study evaluates a 2D plane cutting through the middle of 3D blade configuration. Previous study showed that a small discrepancy in power and moment coefficients predictions between 3D experiment and 2D CFD simulation, while 2D simulation represents the mid-plane of a turbine blade of high aspect ratio; where some 3D effects such as tip effects are small (Rezaeiha et al., 2017). While a full 3D simulation of experiment device is preferable to capture 3D flow features, a previous study using a hybrid LES-RANS model (DDES) showed that 2D simulation could produce relatively similar results as 3D simulation of turbulent flow separation on the blade (Lanzafame et al., 2020) as long as the spatial and temporal discretisation are fine enough to resolve the high vorticity gradients near the blades. Therefore, this study has focussed on 2D simulations to evaluate and optimise the key SUPD location and geometry parameters changes and its impact on turbine performance. Noting that, it takes about 100 hour CPU time on average to simulate one case using a high-spec workstation with 2 CPUs @ 2.2 GHz, and 128 GB RAM.
Results and Discussion
Effects of the location of upstream deflector
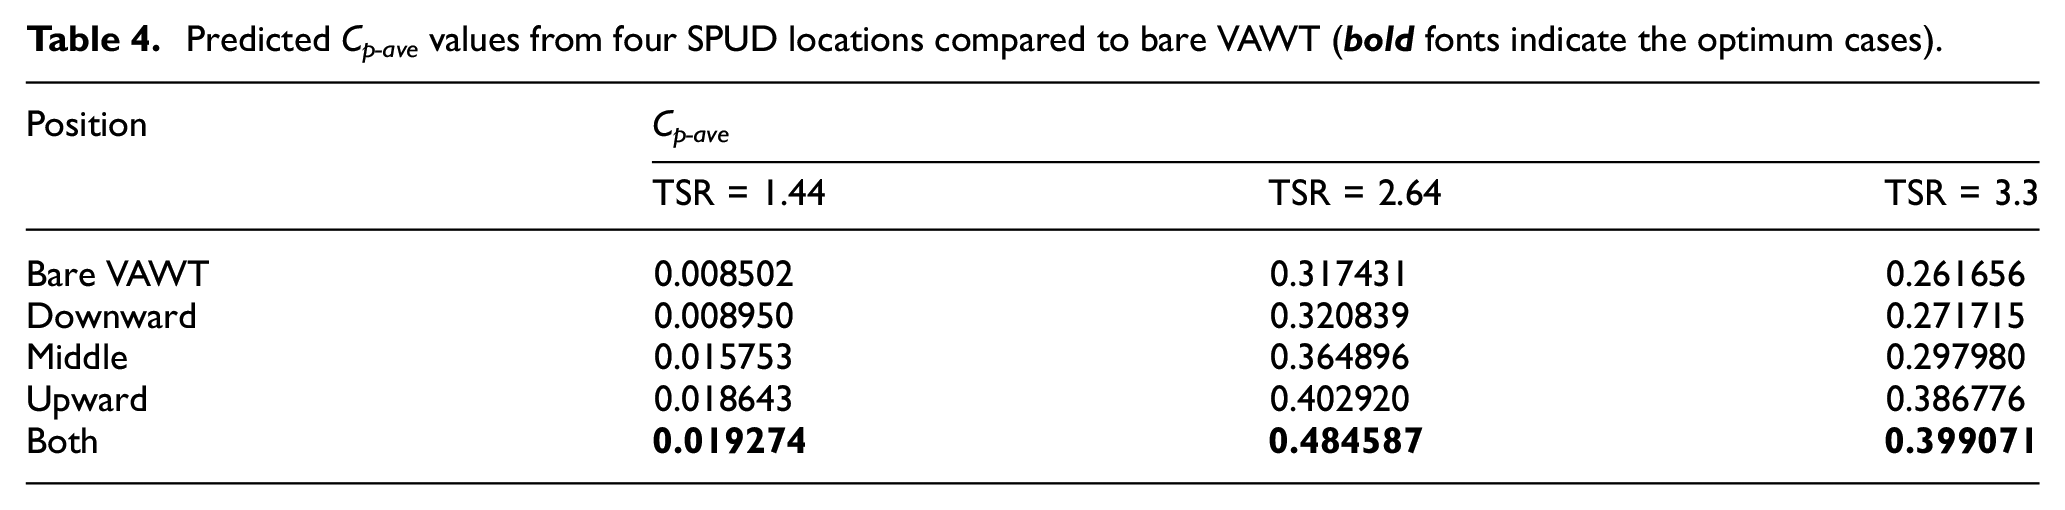
The effect of the SPUD location on the performance of VAWT is investigated considering four deflector locations in upstream of VAWT, that is, upward, downward, middle and both upward and downward (as shown in Figure 9). Table 4 gives the results showing that all four SPUD locations can improve the Cp-ave value compared to the bare VAWT at all regimes of TSRs. Moreover, the best Cp-ave improvement can be achieved by SPUD located at both upward and downward of the upstream of VAWT at all regimes of TSRs, followed by upward and middle configurations, respectively. The least Cp-ave improvement is generated by SPUD located at downward for all regimes of TSRs.
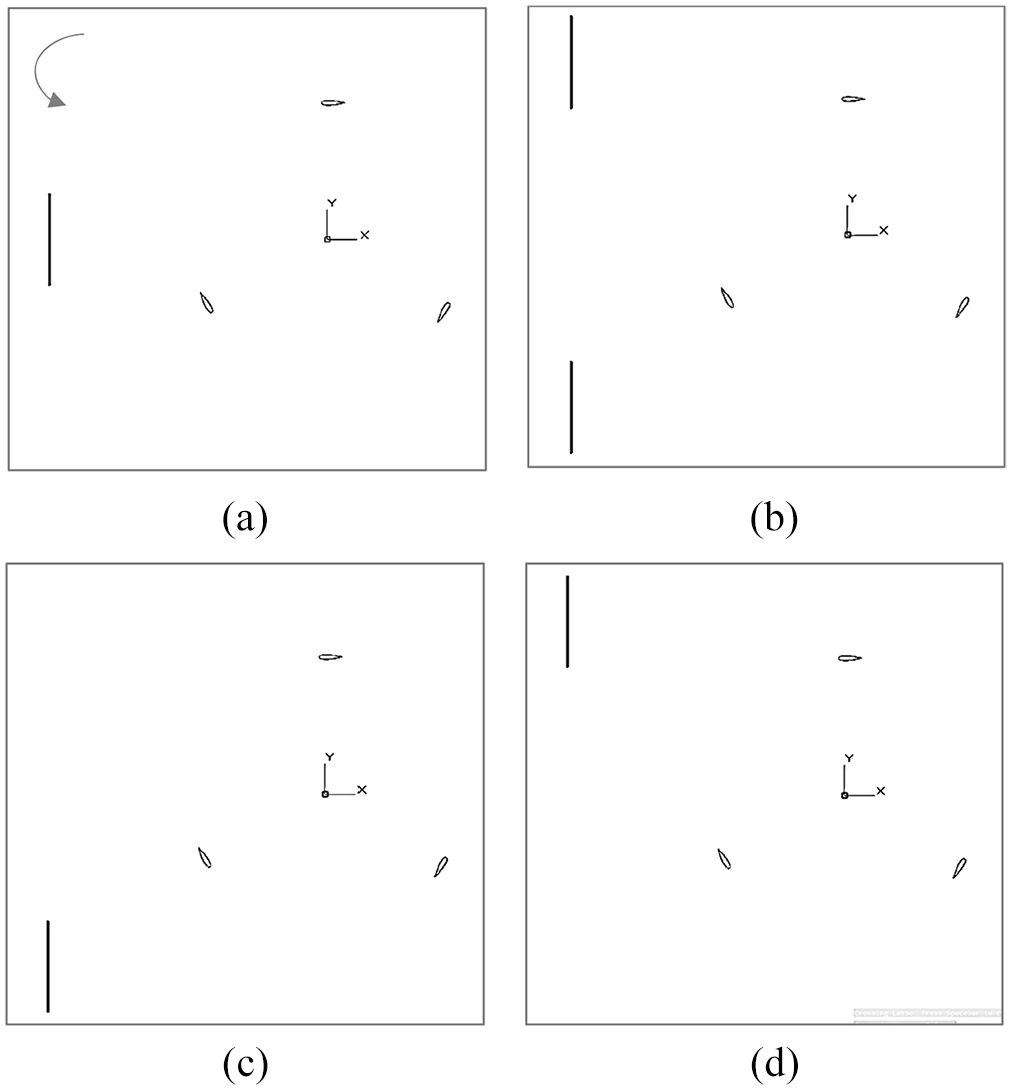
Sketches of four SPUD locations (the deflector geometry is not in scale), (a) middle, (b) both upward and downward,(c) downward and (d) upward.
Predicted Cp-ave values from four SPUD locations compared to bare VAWT (
Noting that, due to the similar performance of each SPUD at all regimes of TSRs (see elaborations on Table 4 results), only TSR = 2.64 results are further discussed here (i.e., TSR with optimum Cp-ave value). Figure 10 depicts the effect of SPUD location on the instantaneous moment coefficient (Cmi) distribution of VAWT at TSR = 2.64. It can be observed that only upward and both upward and downward configurations that can remove the negative moment production of VAWT. Meanwhile, for the middle and downward configurations, the negative moment is still generated by VAWT. It is also noticeable that all four configurations decrease the optimum moment coefficient of VAWT. Nevertheless, it is found that all four SPUD locations investigated can improve the averaged value of moment coefficient (Cm-ave) compared to bare VAWT. For example, VAWT with SPUD of both upward and downward configuration can improve Cm-ave of bare VAWT from 0.12024 to 0.18356 at TSRs = 2.64. Hence, VAWT with four SPUD locations studied can produce better Cp-ave values (up to max 52.7% at TSR = 2.64 in case of applying both upward and downward SUPD) to bare VAWT.
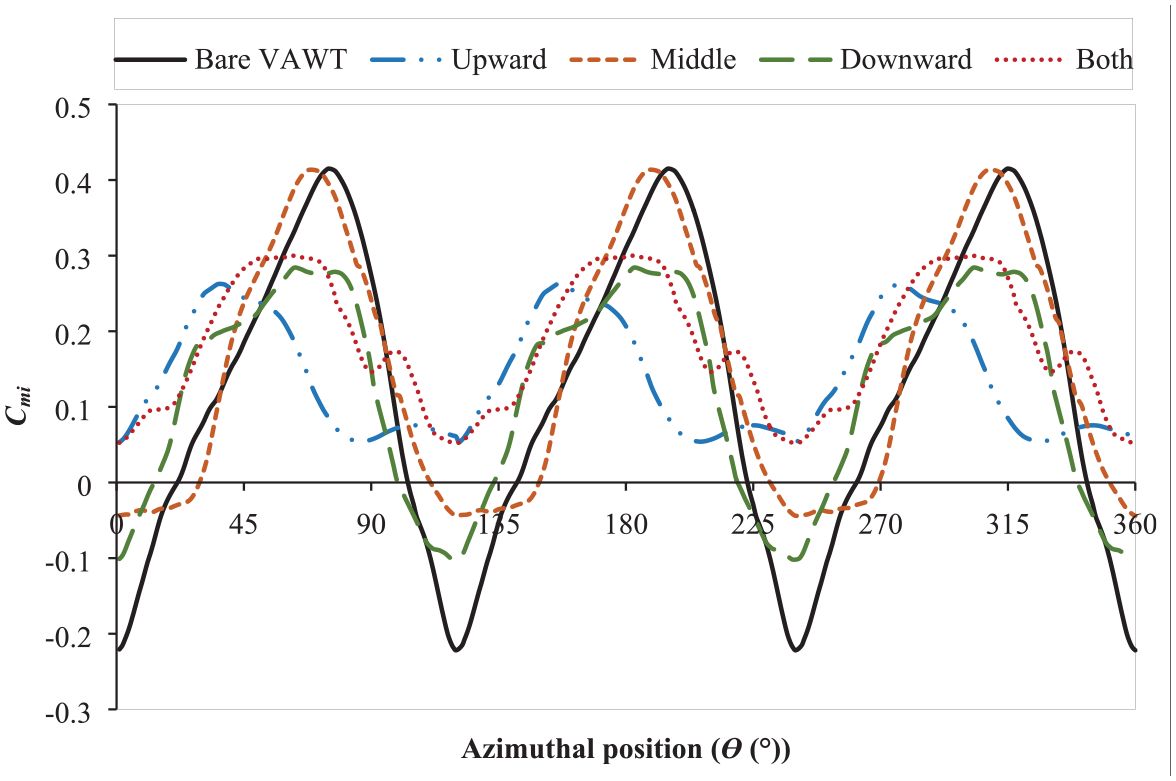
Comparison of instantaneous total moment coefficients (three blades) distributions of bare VAWT and VAWT with SPUD at four different locations (TSR = 2.64).
Further investigation of flow streamlines indicates that placing SPUD at both upward and downward of the upstream of VAWT has the ability to induce larger vortex in upstream of VAWT compared to other three configurations (i.e. upward, middle and downward arrangements) (see Figure 11). This leads to stronger wake flow, resulting in greater augmented wind speed and direction change in downstream of the deflector where VAWT is located. In both upward and downward configuration, the VAWT blades can avoid the near wake region of the deflector while they are rotating. Meanwhile, for other three configurations of upward, middle and downward configurations, at least one blade will enter the near wake region of the deflector while the blades are rotating. Therefore, both upward and downward configuration can generate better power coefficient than other three configurations. This finding is in good agreement with previous study (Kim and Gharib, 2013) by placing VAWT outside the near wake region of the deflector enabling to increase the power enhancement of VAWT. Moreover, both upward and downward configuration is observed better in directing the incoming wind towards the VAWT compared to upward, middle and downward configurations (see Figure 11). Since both upward and downward configuration introduce a nozzle-like effect in upstream of VAWTs, there is a decrease in the flow areas in the upstream of VAWT due to the gap between two deflectors. Apart from it can accelerate local wind speed, this effect can also help to re-direct the wind towards the turbines.
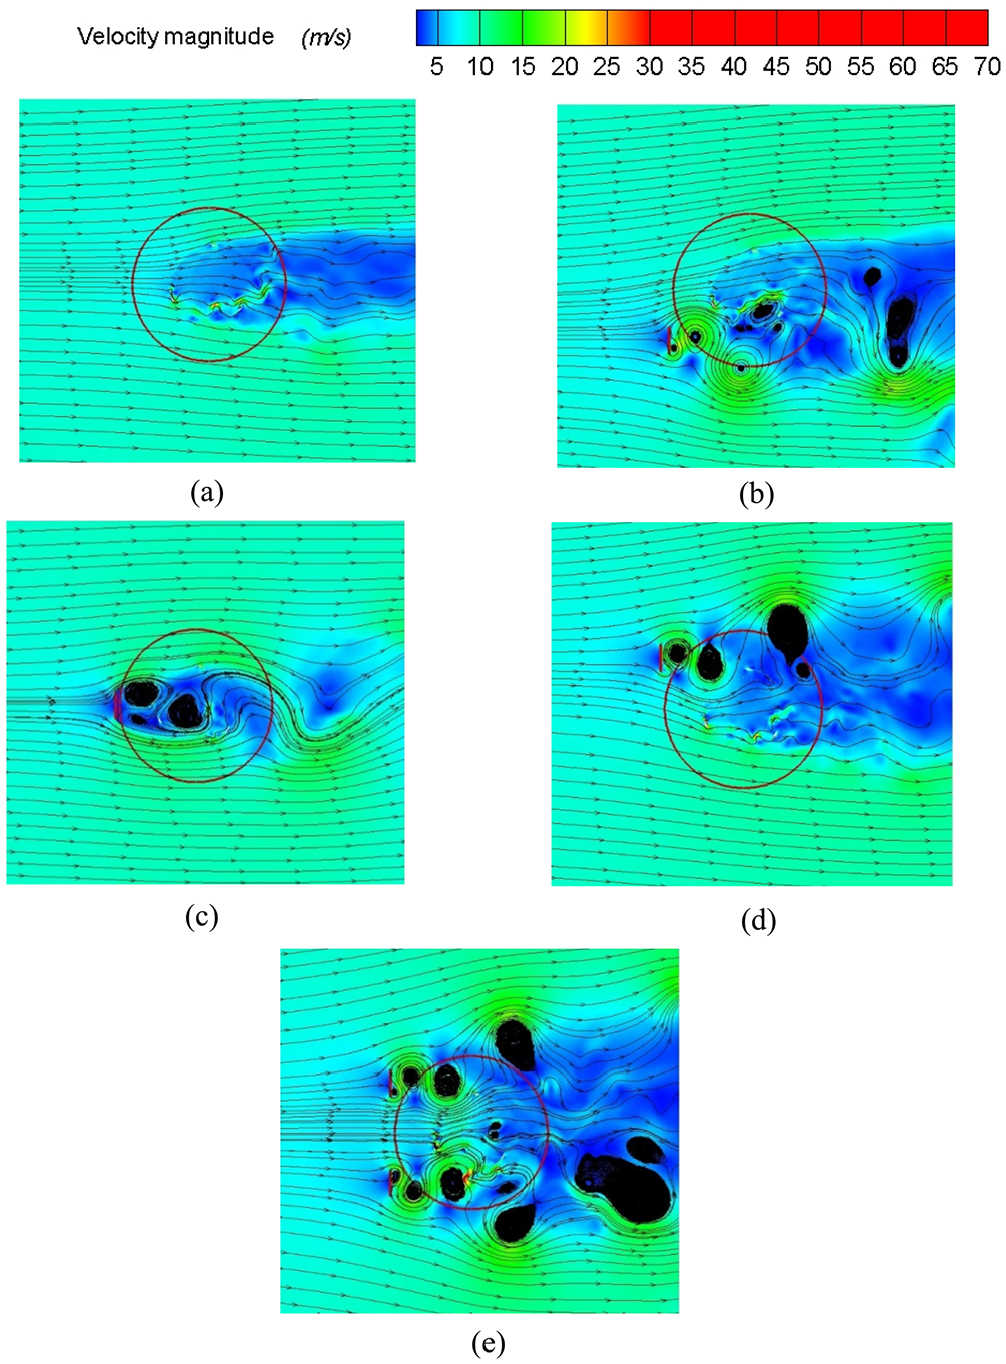
Comparison of streamline distributions coloured by velocity magnitude (m/s) of the flow around (a) bare VAWT and VAWT with SPUD at (b) downward, (c) middle, (d) upward and (e) both upward and downward (TSR = 2.64,
Moreover, based on Figures 11(b) and 11(c), both downward and middle configurations can induce strong vortex flow motions between the blades of VAWT, compared to the upward and both upward and downward configurations which do not generate this kind of vortex flow motions (see Figures 11(d) and 11(e), respectively). This is possibly the main reasons behind the less Cp-ave improvement from these two former configurations. Furthermore, based on mean pressure contours of Blade 2 depicted in Figures 12(b) and 12(c), the downward and middle configurations can only reduce the pressure on the pressure side but still maintain similar pressure around the leading edge of the blade compared to bare VAWT (see Figure 12(a)). Noting that, the blade 2 is chosen because it is located at a position most exposed by the augmented wind, therefore it has made the largest contribution to the pressure changes at the investigated azimuthal position (i.e.,
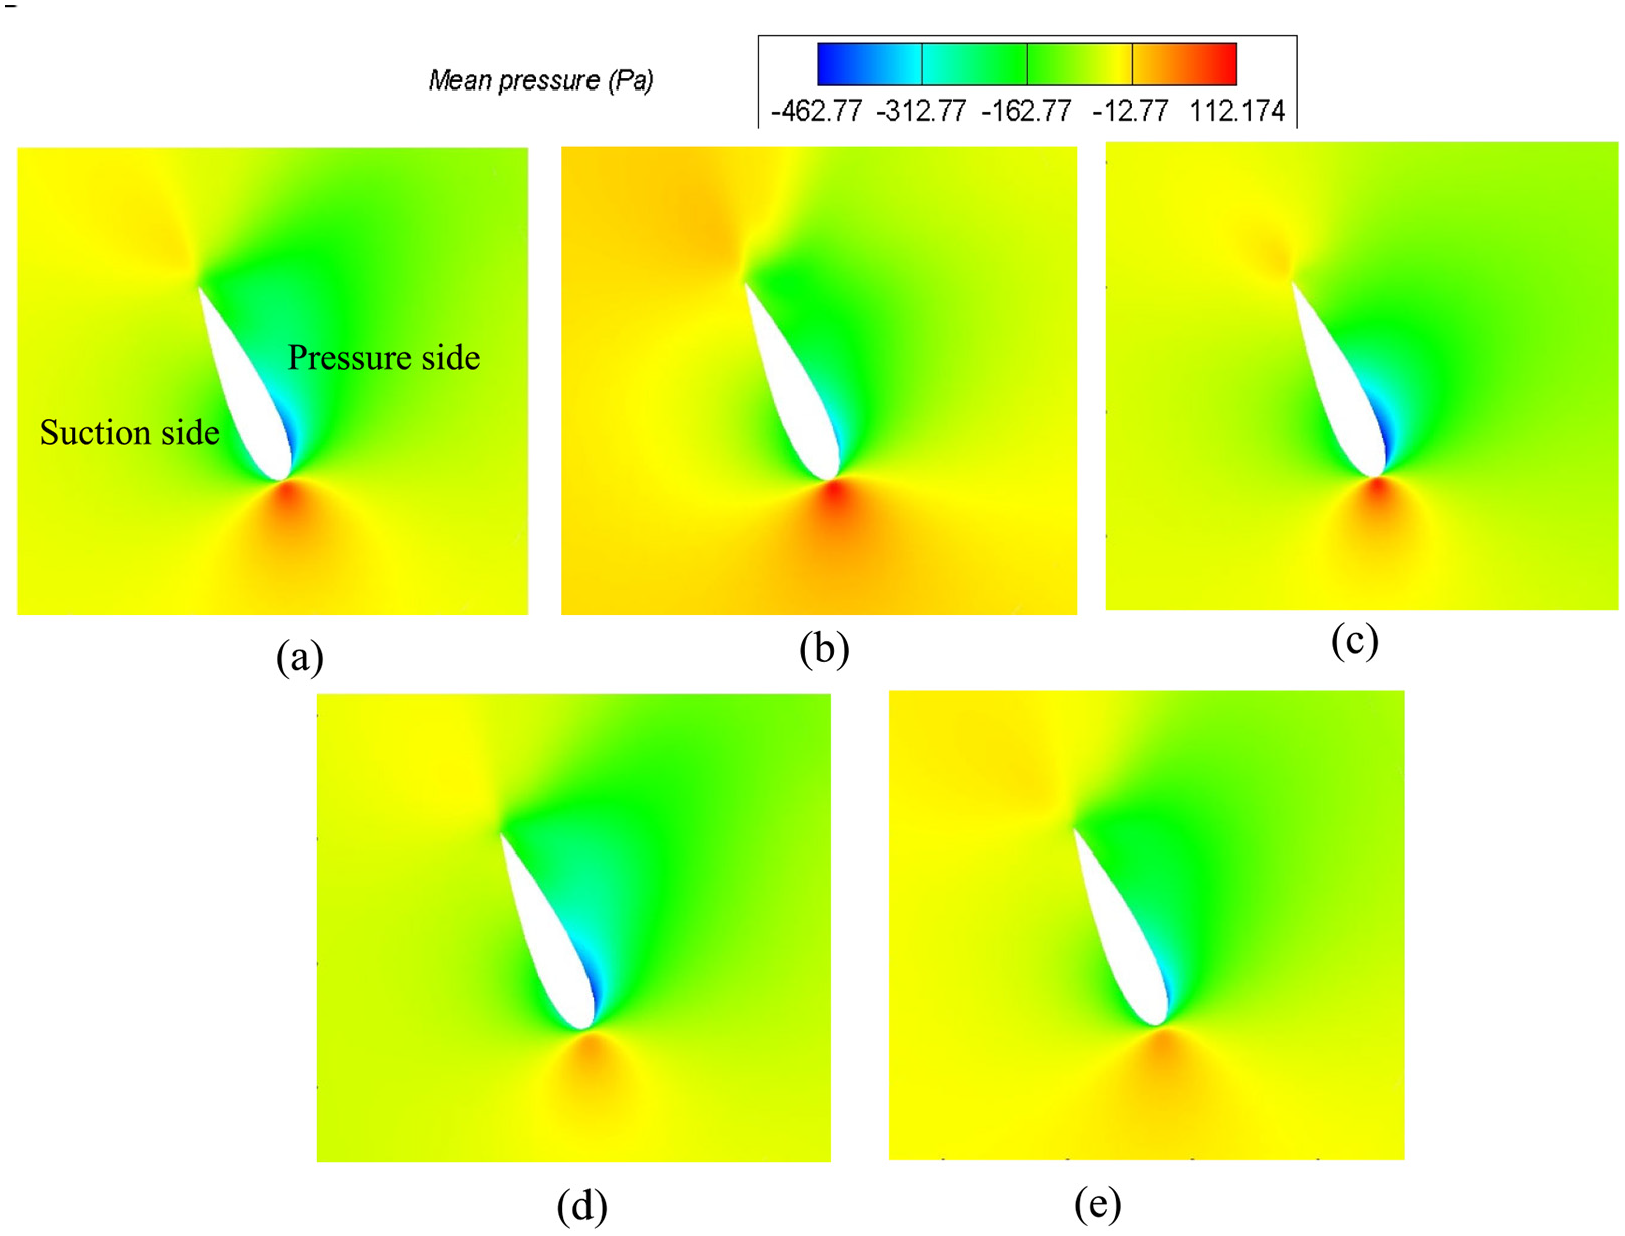
Comparison of mean pressure (Pa) contours of Blade 2 of (a) bare VAWT and VAWT with SPUD at (b) downward,(c) middle, (d) upward and (e) both upward and downward (TSR = 2.64,
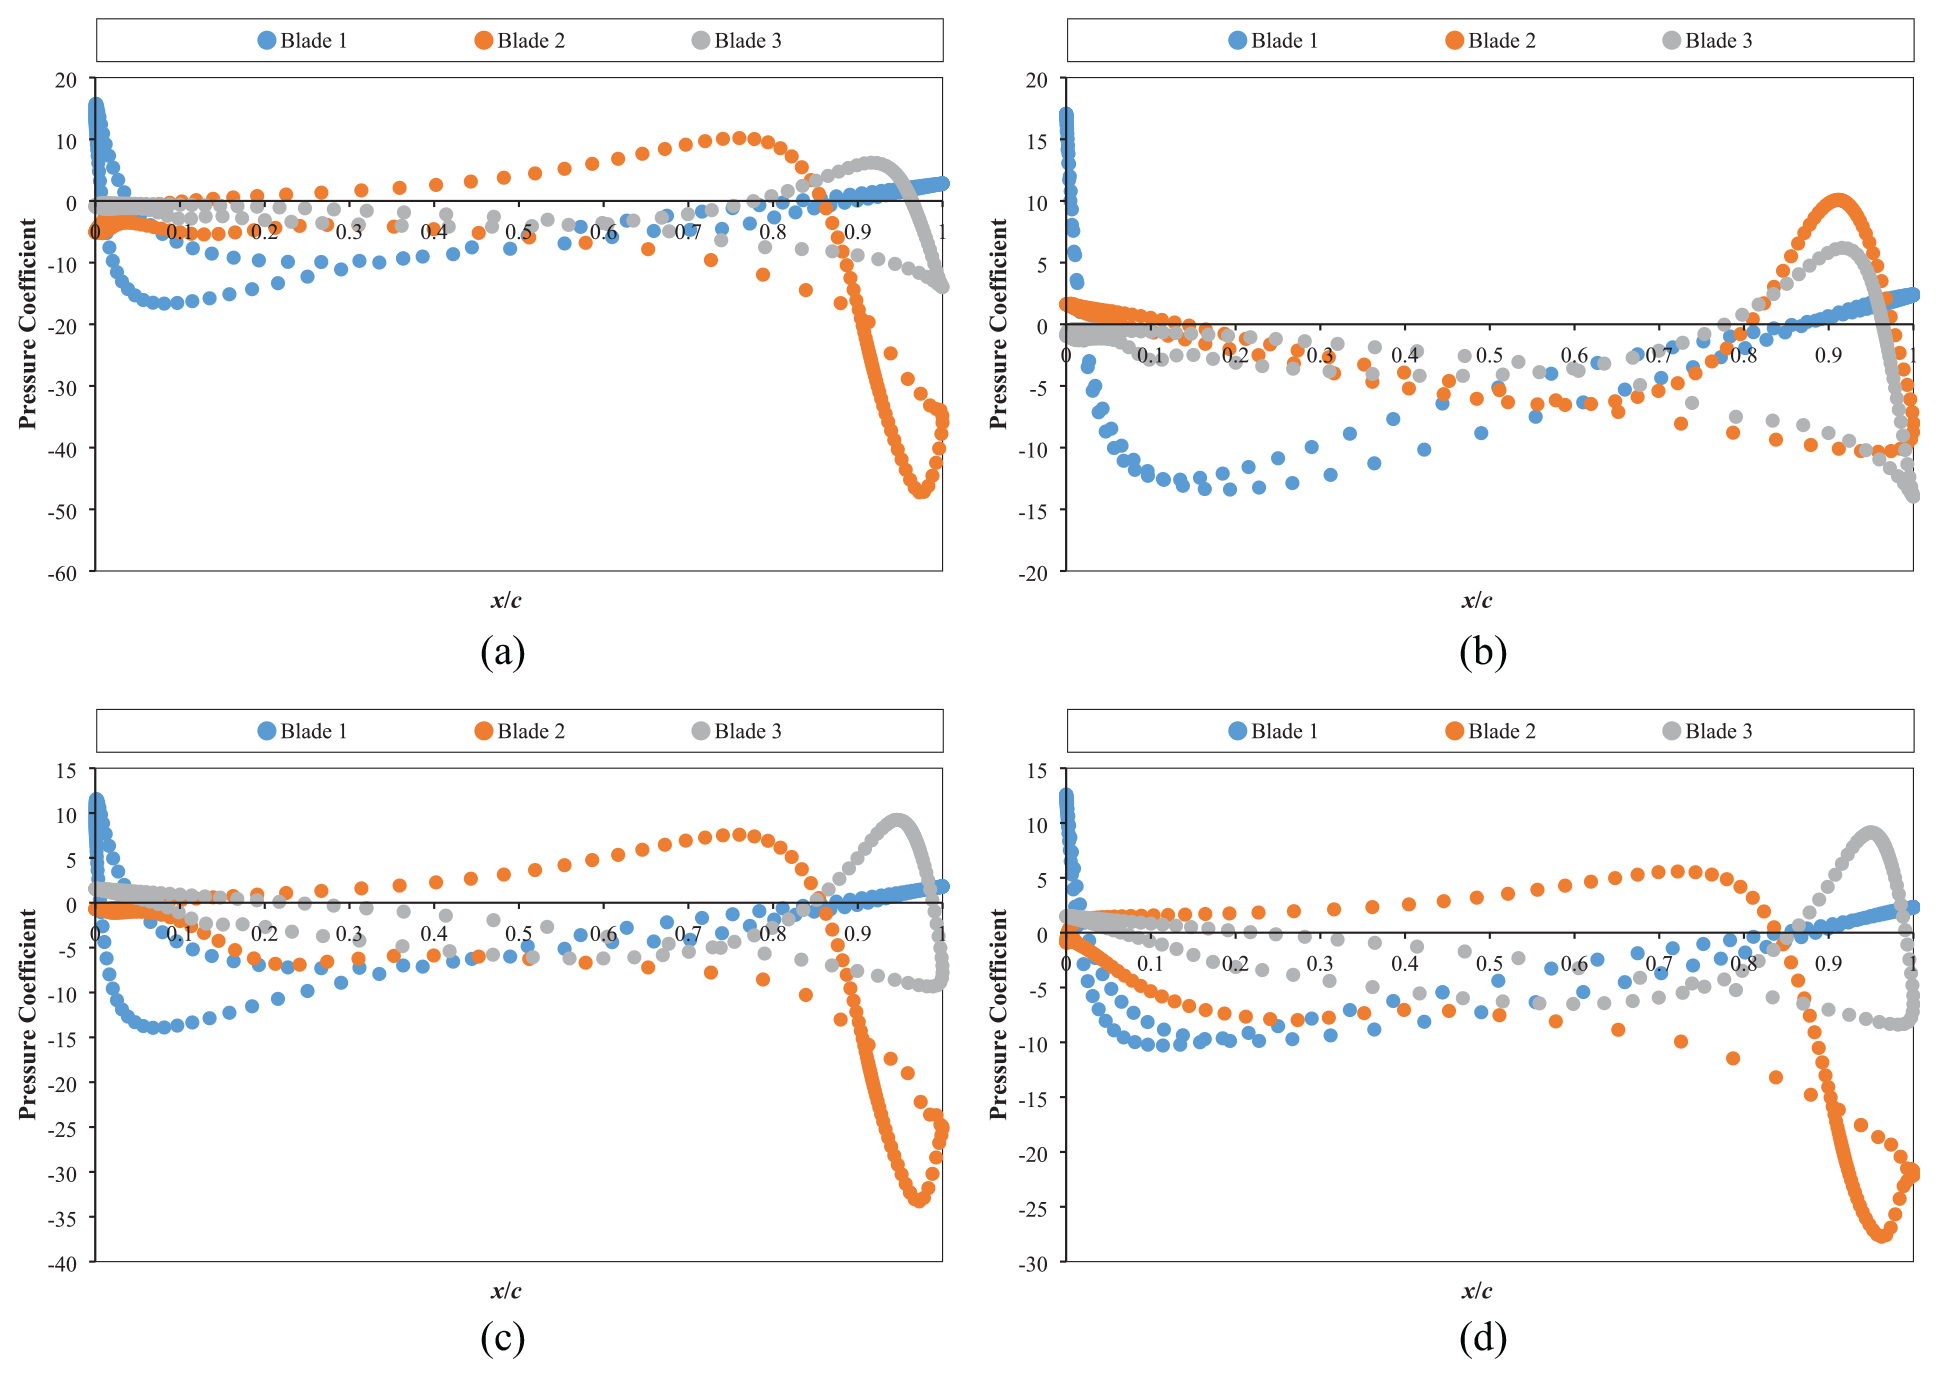
Comparison of pressure coefficient distributions of VAWT with SPUD at (a) downward, (b) middle, (c) upward and(d) both upward and downward (TSR = 2.64,
It is also found that the existence of SPUD in upstream of VAWT can improve the Cp-ave of VAWT at all regimes of TSRs. However, the level of Cp-ave improvement varies at each regime of TSRs. SPUD can generate better improvement at low regimes of TSRs compared to medium and high regimes of TSRs. For example, in case of both upward and downward configurations, SPUD can improve the Cp-ave value by around 126.7% at low regime of TSRs compared to bare VAWT, while at medium and high regimes of TSRs, Cp-ave value can only be enhanced by approximately 52.7% and 52.5%, respectively. Note that the level of Cp-ave improvement reduces significantly until TSR = 2.5 (see Table 5). After that, the Cp-ave improvement continues to decrease but only slightly less than 0.1%. Similar behaviour is also noticed for other three configurations studied. It is believed that this behaviour is mainly caused by the augmented wind speed that is more beneficial at low regime of TSRs compared to medium and high regimes of TSRs. At low regime of TSRs, the turbine rotation speed is quite slow so that the turbine usually needs external power to start the rotation until the turbine can self-rotate to produce positive power production. The higher incoming wind speed induced by the SPUD will help the turbine rotates faster after the rotation starting point. It is clear that SPUD can sometimes help the turbines to self-rotate without any external power and improve the power production significantly afterwards. However, at medium and high regimes of TSRs, the turbine rotation speed is already high. The higher rotation speed caused by higher incoming wind speed can induce the blockage effect to the flow with the addition of higher structure vibration and drag and tip losses in case of 3D VAWT configurations. Therefore, at these regimes of TSRs, the benefit of SPUD would be less significant in the start-up stage of VAWT.
Comparison of Cp-ave improvement due to SPUD of both upward and downward configuration at different TSRs.
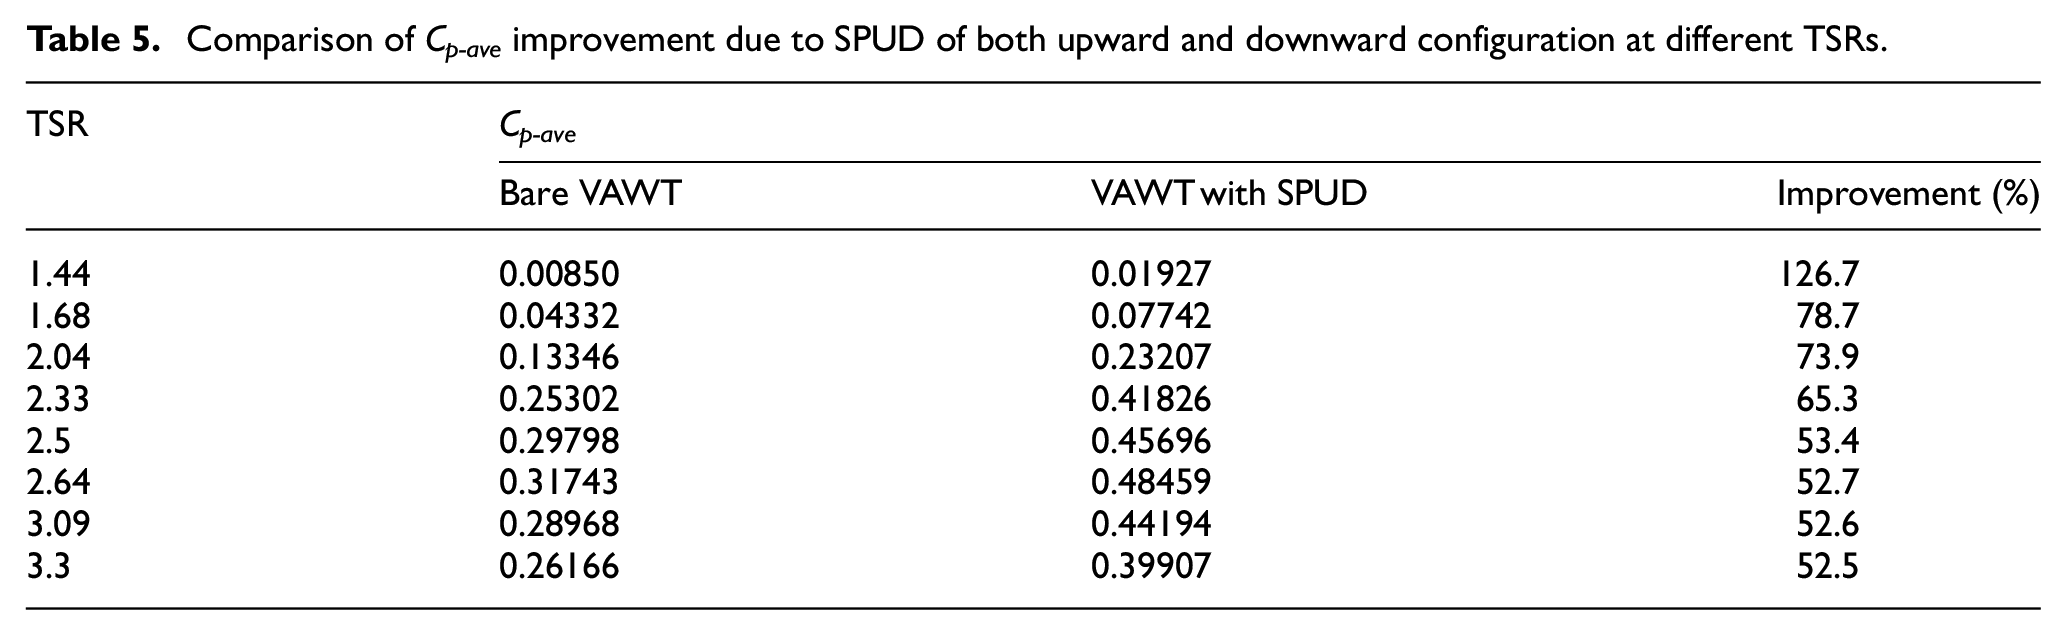
Figure 14 illustrates the Cmi distributions of a bare VAWT compared with a VAWT of SPUD (i.e. both upward and downward configuration) at different regimes of TSRs. The Cmi distributions at TSR = 1.44 indicate that adding a deflector in upstream of VAWT can reduce the negative moment production of VAWT while still maintaining the optimum value of the positive moment. However, at TSR = 2.64, even though SPUD can remove the negative moment production of VAWT, it also reduces the optimum moment value of VAWT. This means that at low regime of TSRs, the SPUD can help VAWT to produce higher moment increment compared to medium and high regimes of TSRs. Nevertheless, the SPUD at TSR = 1.44 can reduce the fluctuations of the moment production. While at TSR = 2.64, it increases the fluctuations of the moment production. This is possibly caused by the higher drag as the turbine rotation speed increases at higher regimes of TSRs. Therefore, upstream deflector (for all location configurations) is proved as a device to improve the power generation of VAWT at all regime of TSRs, regardless of its lower effectiveness at medium and high regimes of TSRs.
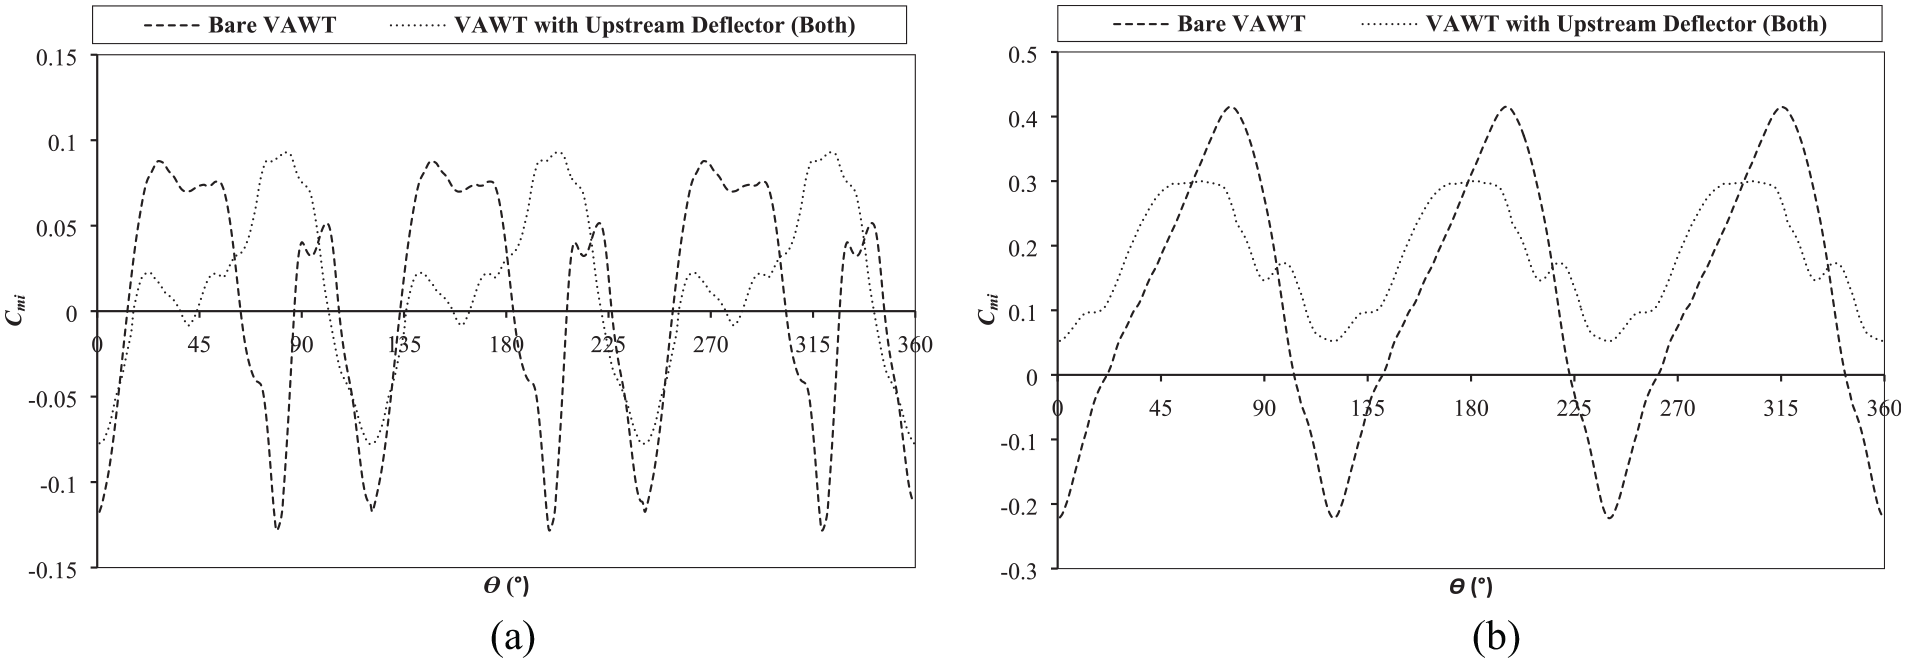
Comparison of Cmi distributions between bare VAWT and VAWT with SPUD (both upward and downward configuration) at (a) TSR = 1.44 and (b) TSR = 2.64.
The ability of SPUD to reduce negative moment production and ease its fluctuations at low regime of TSRs can help VAWT to improve its self-starting ability, which is very important at this regime of TSRs. In fact, SPUD can also reduce the cut-in wind speed at the lowest TSR operation (TSR = 1.44). The evaluation of Cp-ave value of bare VAWT at TSR = 1.44 shows that the bare VAWT starts to generate negative averaged moment (thus it cannot produce power) at incoming wind speed of
Effects of the width of upstream deflector
After obtaining the optimum location to place the deflector in upstream of VAWT, investigations are continued on the effect of the width of upstream deflector on the performance of VAWT. The width of upstream deflector increases from the base SPUD of both upward and downward configuration by increasing the width of deflector on both ends (i.e., upward and downward) simultaneously. Note that this width addition is extended from the top and bottom ends of the deflector so that the centre of the deflector remains unchanged (see Figure 15). As a result, the gap between the two deflectors in both upward and downward configuration decreases as the width of the deflectors increases.
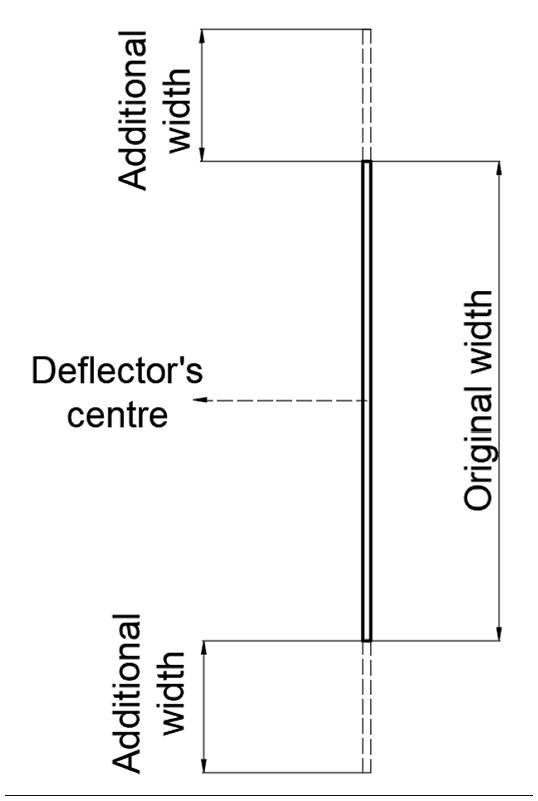
SPUD with width addition.
Simulations are carried out for three width variations (
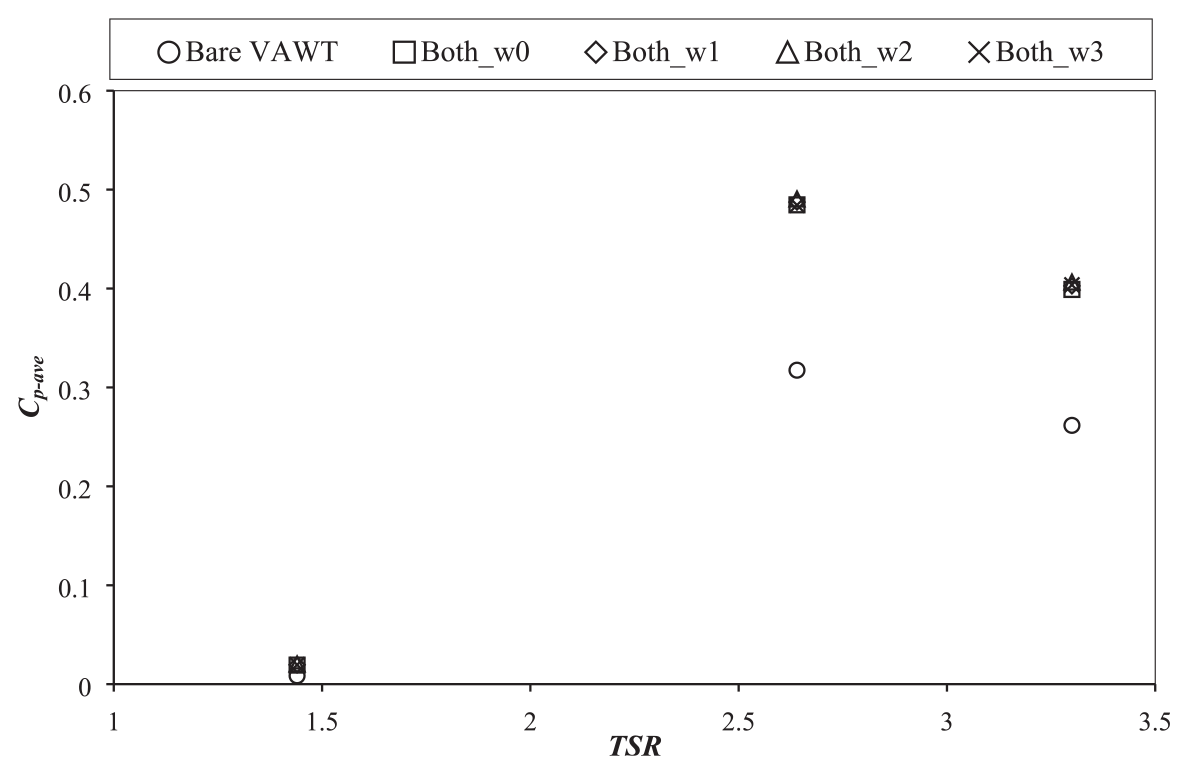
Comparison of Cp-ave between bare VAWT and VAWT with SPUD of both upward and downward configuration with four different width variations at different regimes of TSRs.
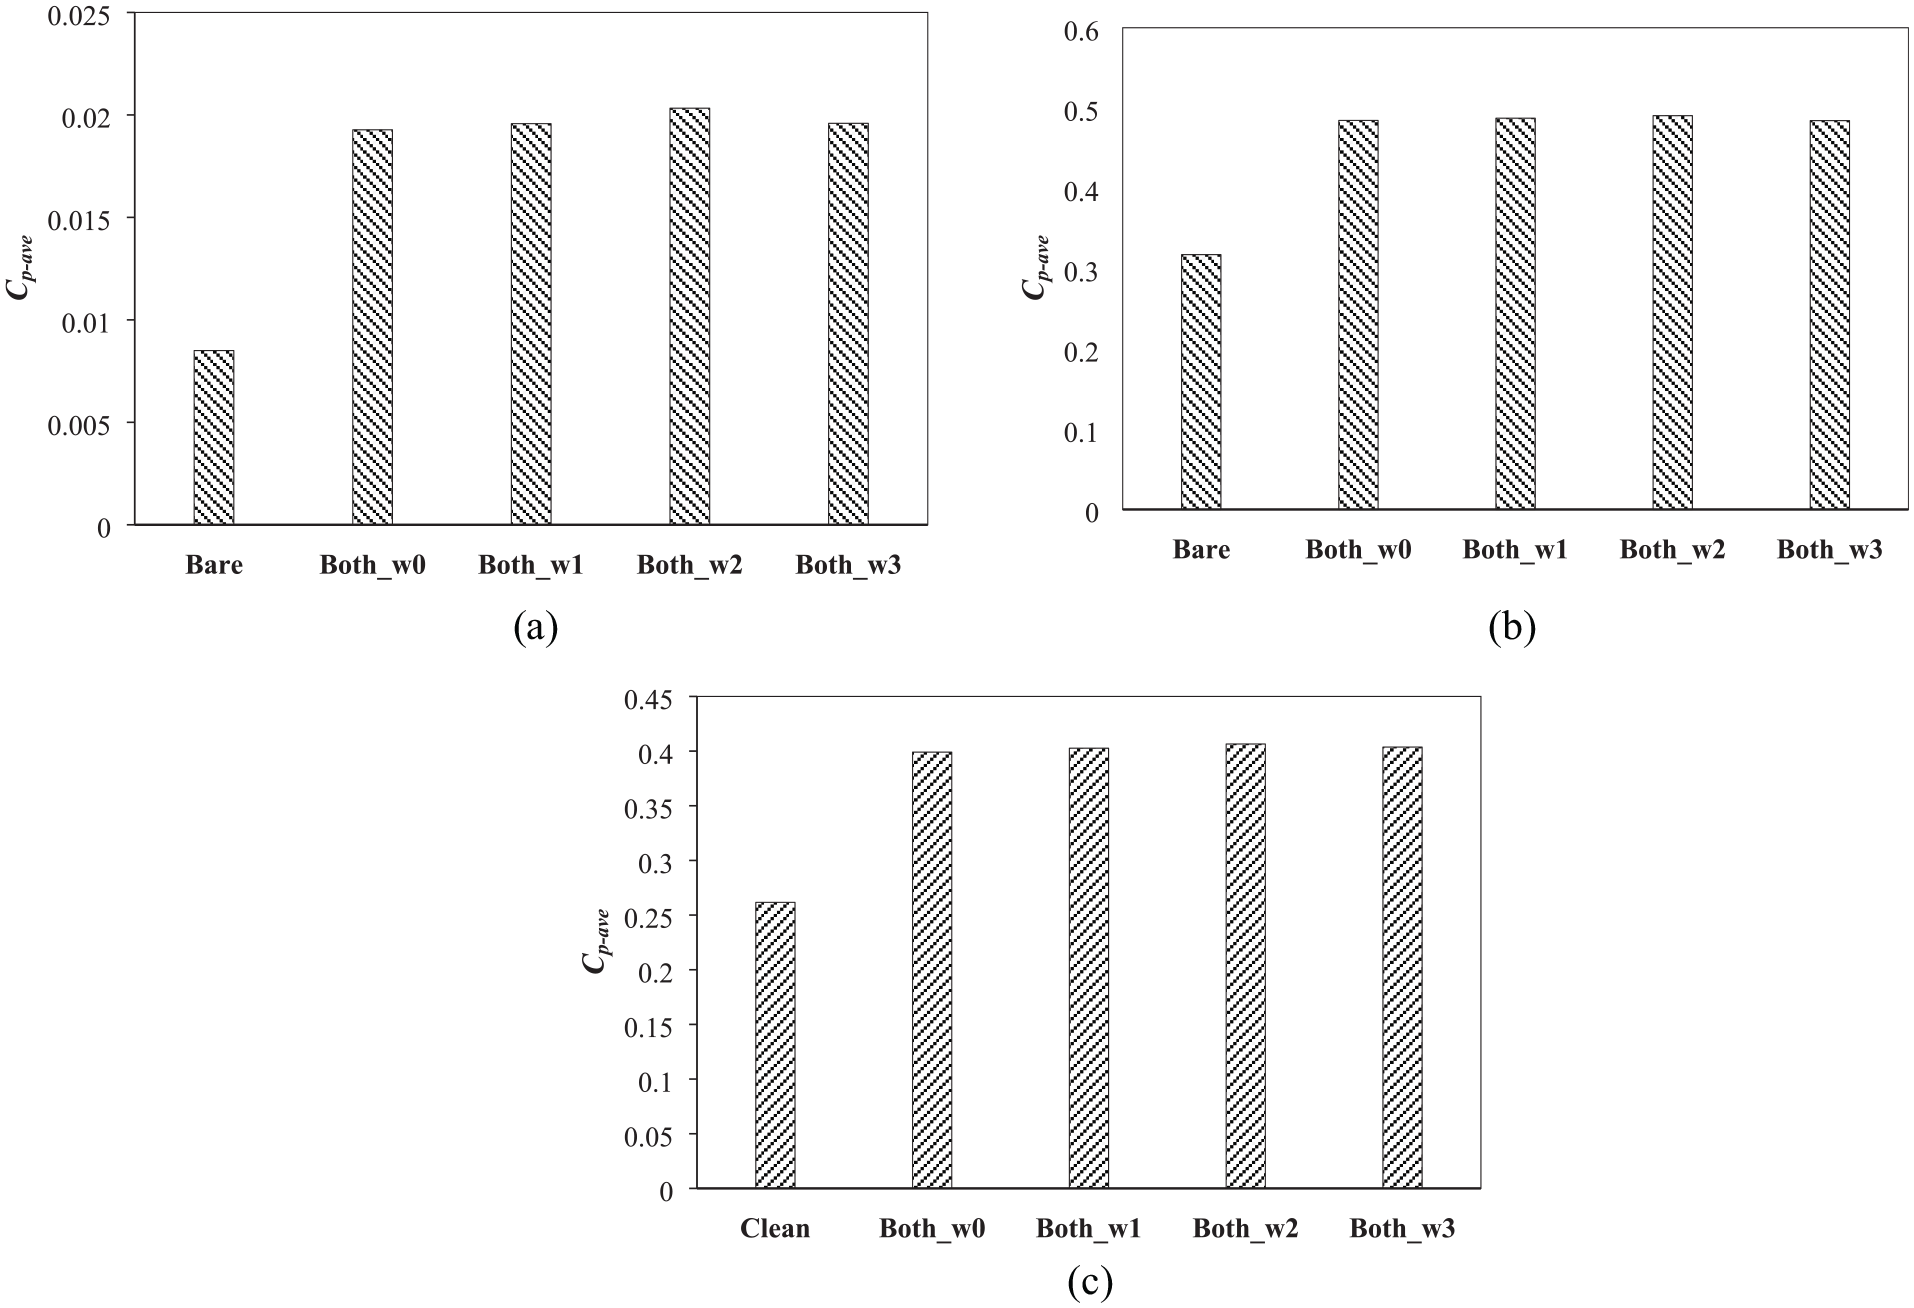
Comparison of Cp-ave between bare VAWT and VAWT with SPUD of both upward and downward configuration with four different width variations at (a) TSR = 1.44, (b) TSR = 2.64 and (c) TSR = 3.3.
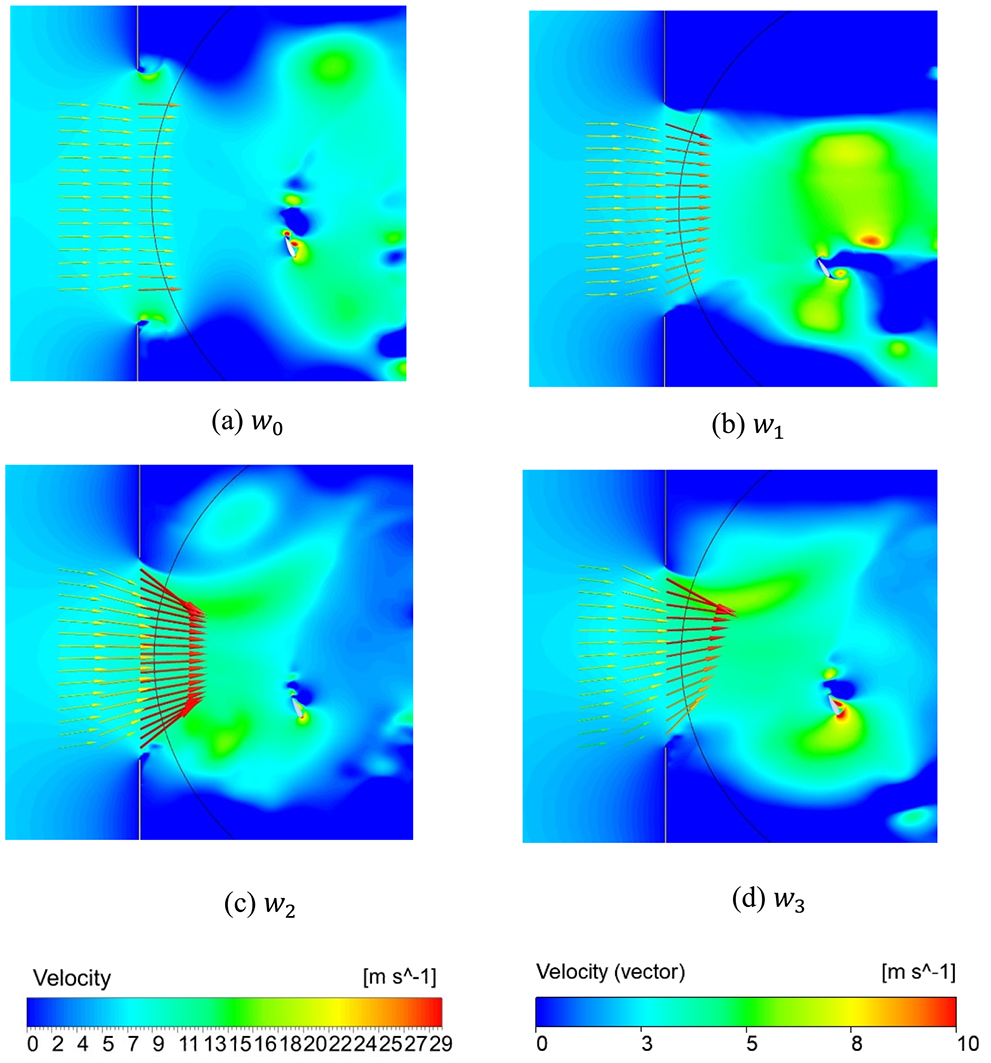
Comparison of velocity vectors, superimposed by contours coloured by velocity of VAWT with SPUD in different widths (TSR = 2.64,
However, once
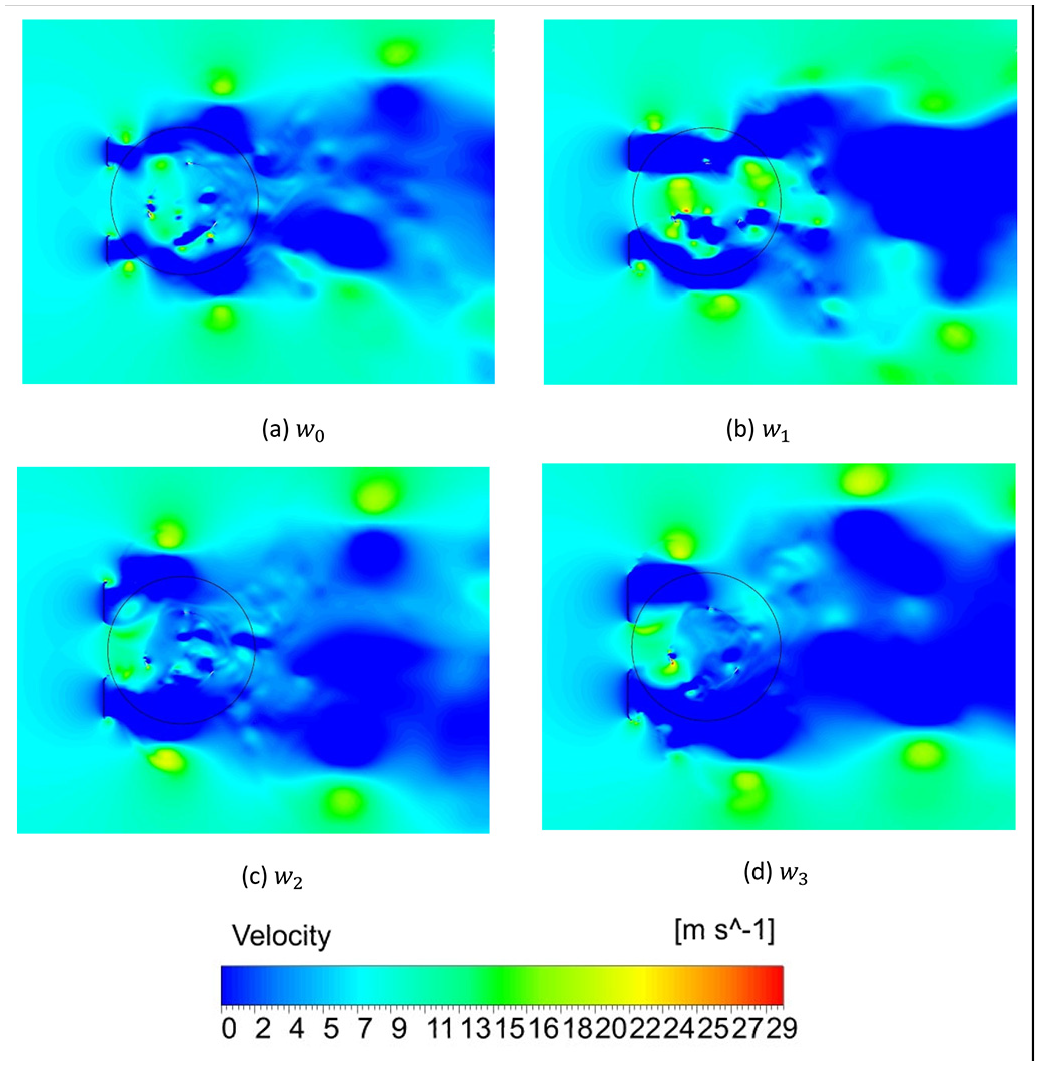
Comparison of velocity contours of VAWT with SPUD of four different widths (TSR = 2.64,
Furthermore, it is observed that the increment of deflector width has greater effect on the Cp-ave improvement at low regimes of TSRs compared to medium and high regimes of TSRs. The Cmi distributions shown in Figure 19 demonstrate that at low regime of TSRs, the change of width can improve the positive moment production and at same time reduce the negative moment production. However, at medium regime of TSRs, the change of width can enhance the positive moment production, but it also increases the negative moment production. Hence, the increment of width of SPUD cannot work effectively outside low regime of TSRs (Figure 20).
Comparison of Cmi distributions of VAWT with SPUD of four different widths (a) TSR = 1.44 and (b) TSR = 2.64.
Effects of inclination angle of upstream deflector
Following the investigation of the width variations of the deflector, simulation continues on investigating the effect of inclination angle (
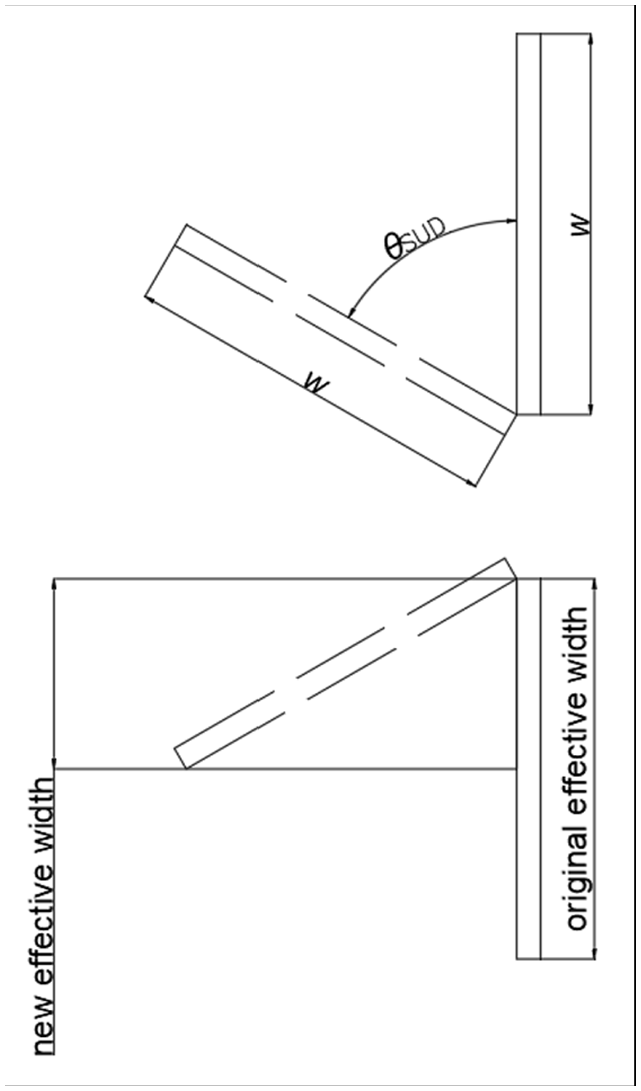
Inclination angle of SPUD (for both upward and downward configuration).
Variations of SPUD inclination angle.
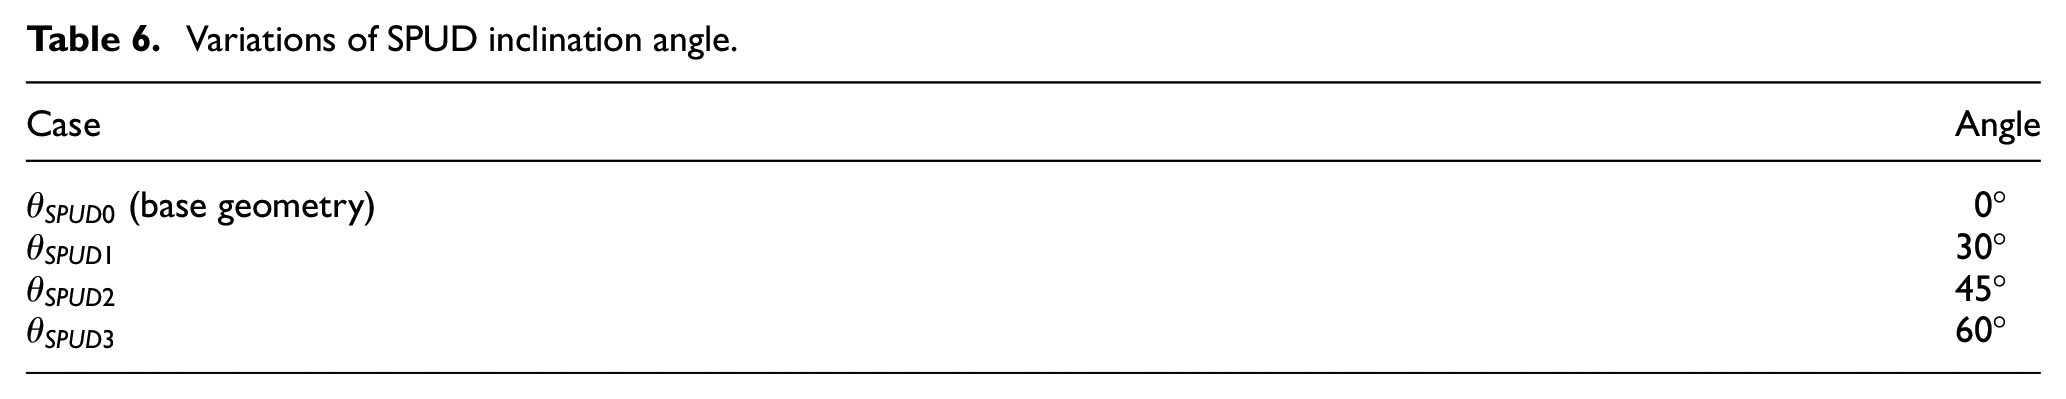
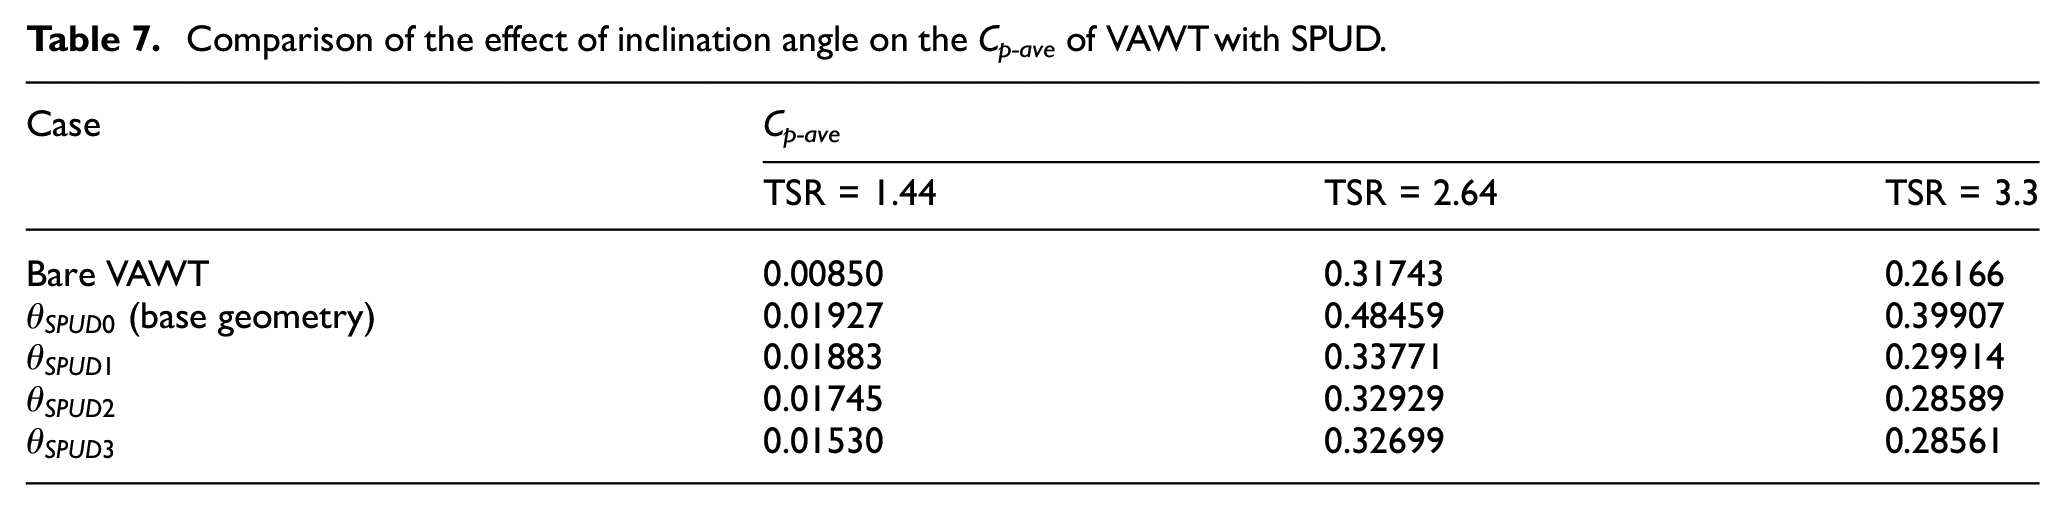
Table 7 gives the effect of
Comparison of the effect of inclination angle on the Cp-ave of VAWT with SPUD.
Further investigation shows that based on Cmi distributions at TSR = 2.64 (see Figure 22), tilting the deflectors can reintroduce the negative moment production of VAWT and decrease its positive moment generation. Hence, the average moment production reduces, resulting in lower power generation. Introducing inclination angle of the deflectors also decreases the ability of deflectors to guide the wind towards the rotor area of the turbine. Figure 23 shows that the wind starts to ‘be shifted’ away from the blades of the turbine, as the deflectors are tilted. The wake region behind the deflector is also found to be shifted away from the blades of the turbine (see Figure 24). This wake region can be drifted further away from the blades as the inclination angle increases. This means that the blades of the turbine is no longer fully located behind the wake region of the upstream deflectors. Hence, the effect of augmentation of SUPD to the wind speed reduces. As shown in Figure 24, the velocity of tilted deflectors is relatively lower compared to that of non-tilted deflectors around the blades of VAWT.
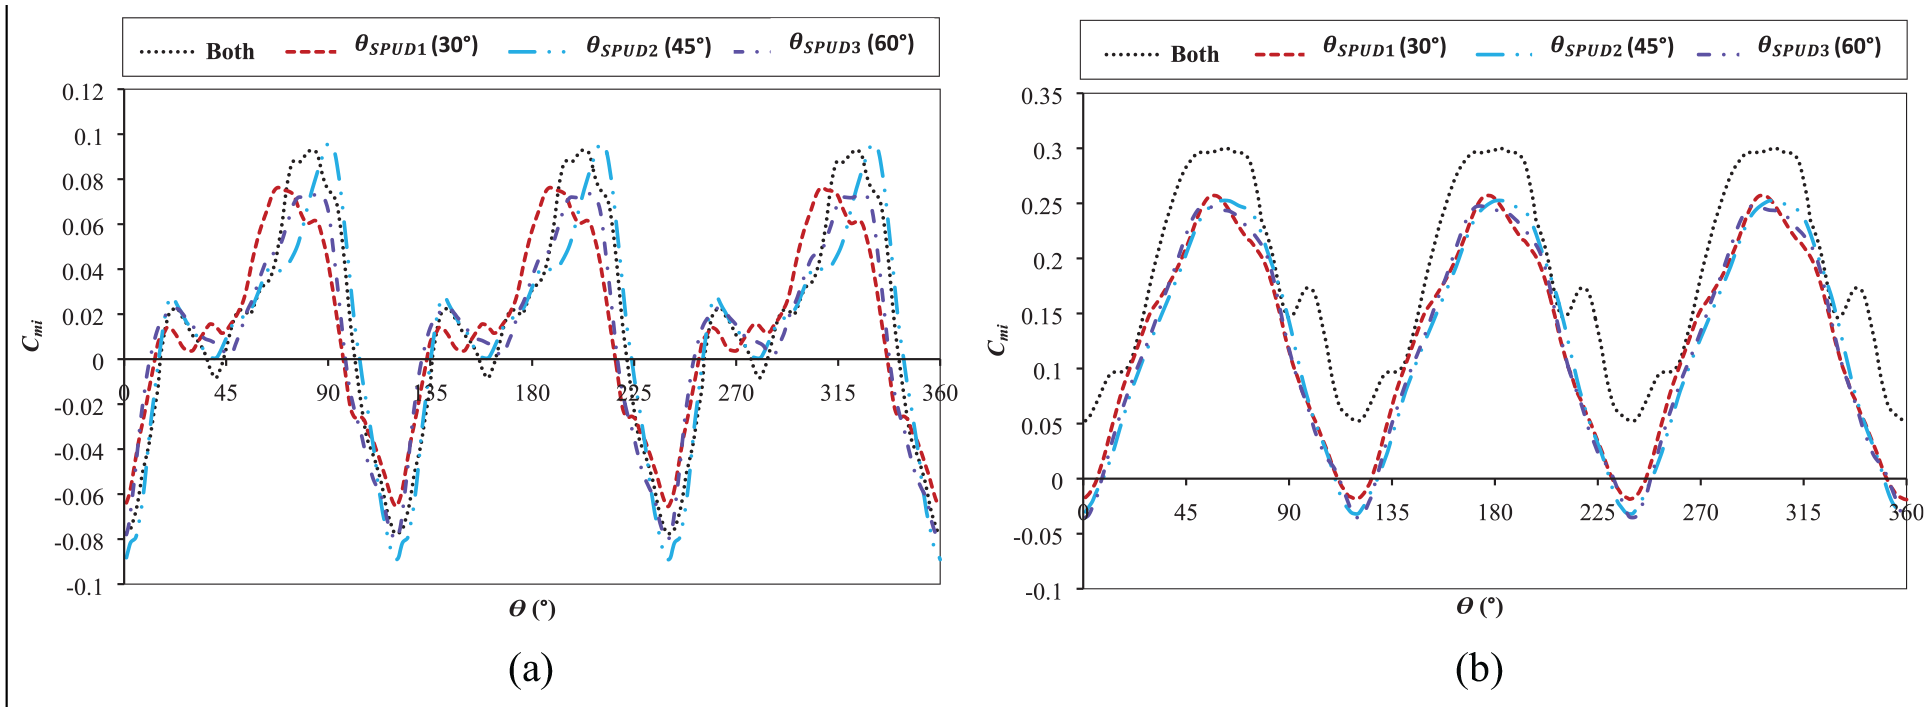
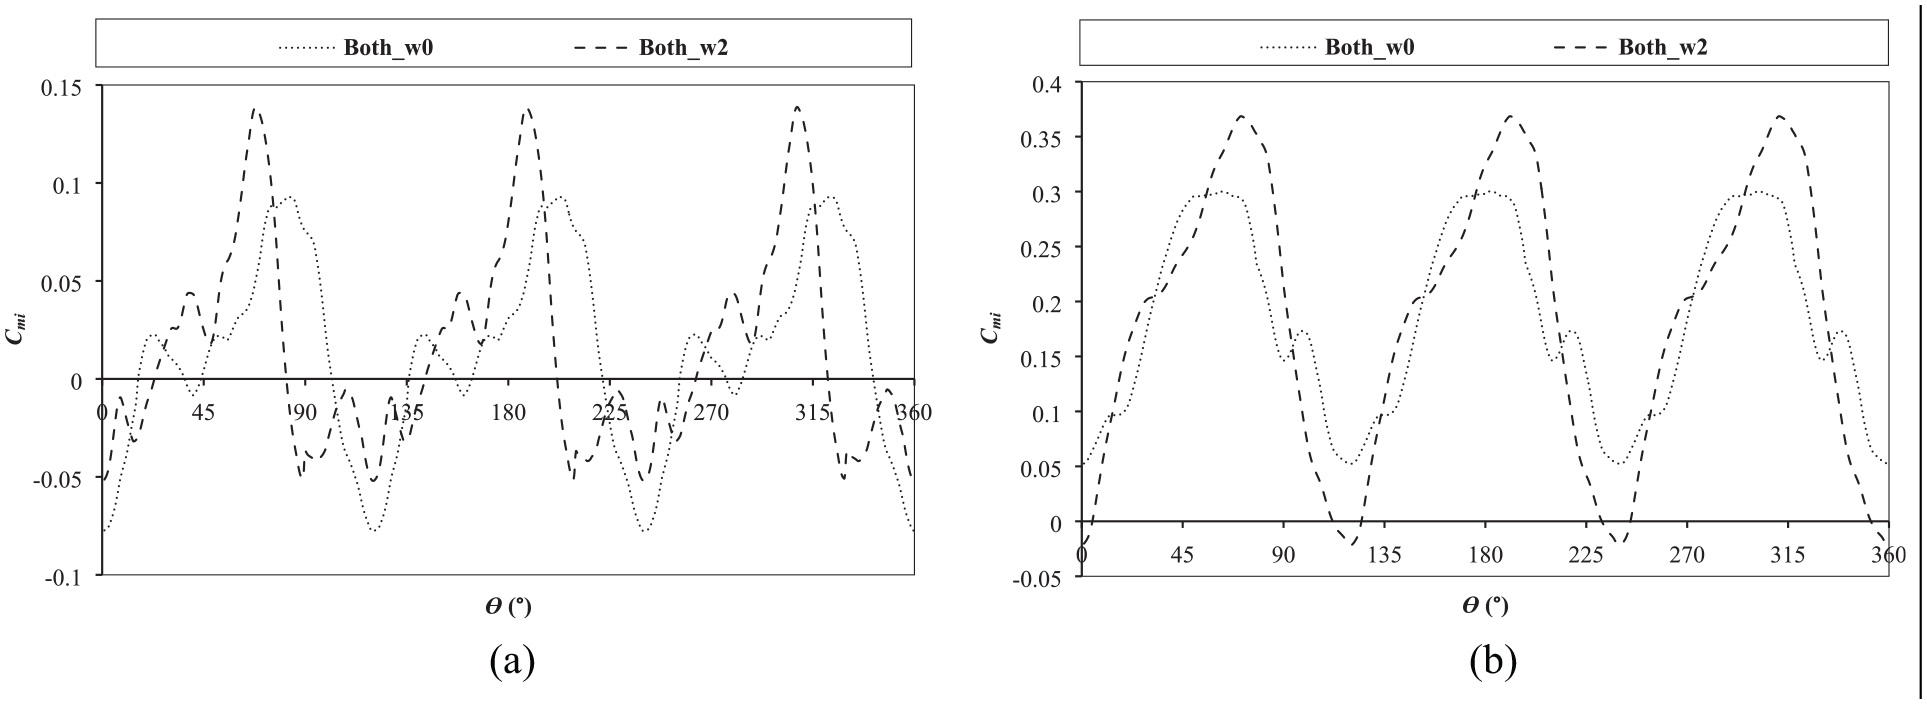
Comparison of the effect of inclination angle on the Cmi distribution of VAWT with SPUD at (a) TSR = 1.44 and(b) TSR = 2.64.
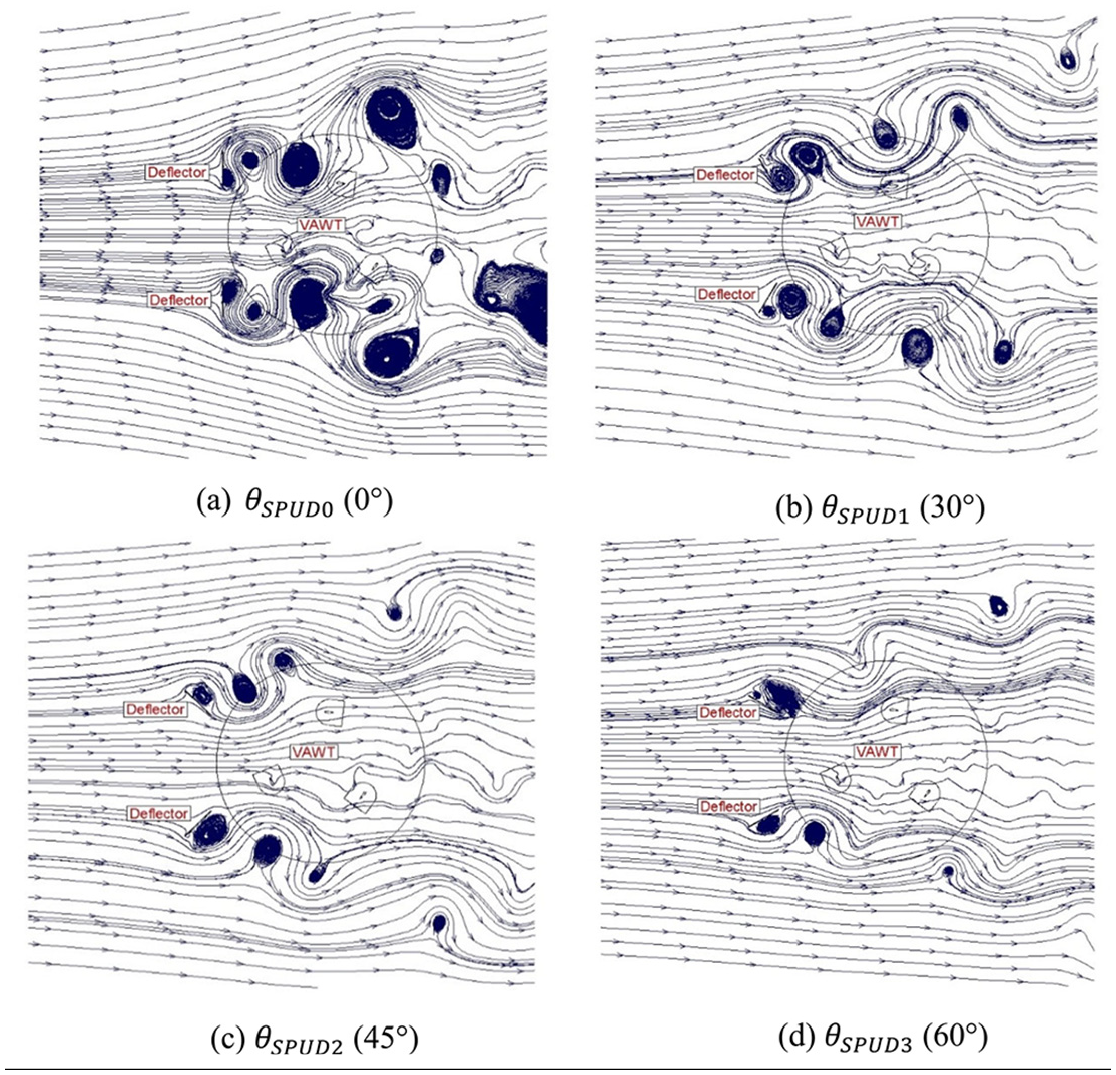
Comparison of streamlines of the flow around VAWT with SPUD at four different inclination angles (TSR = 2.64,
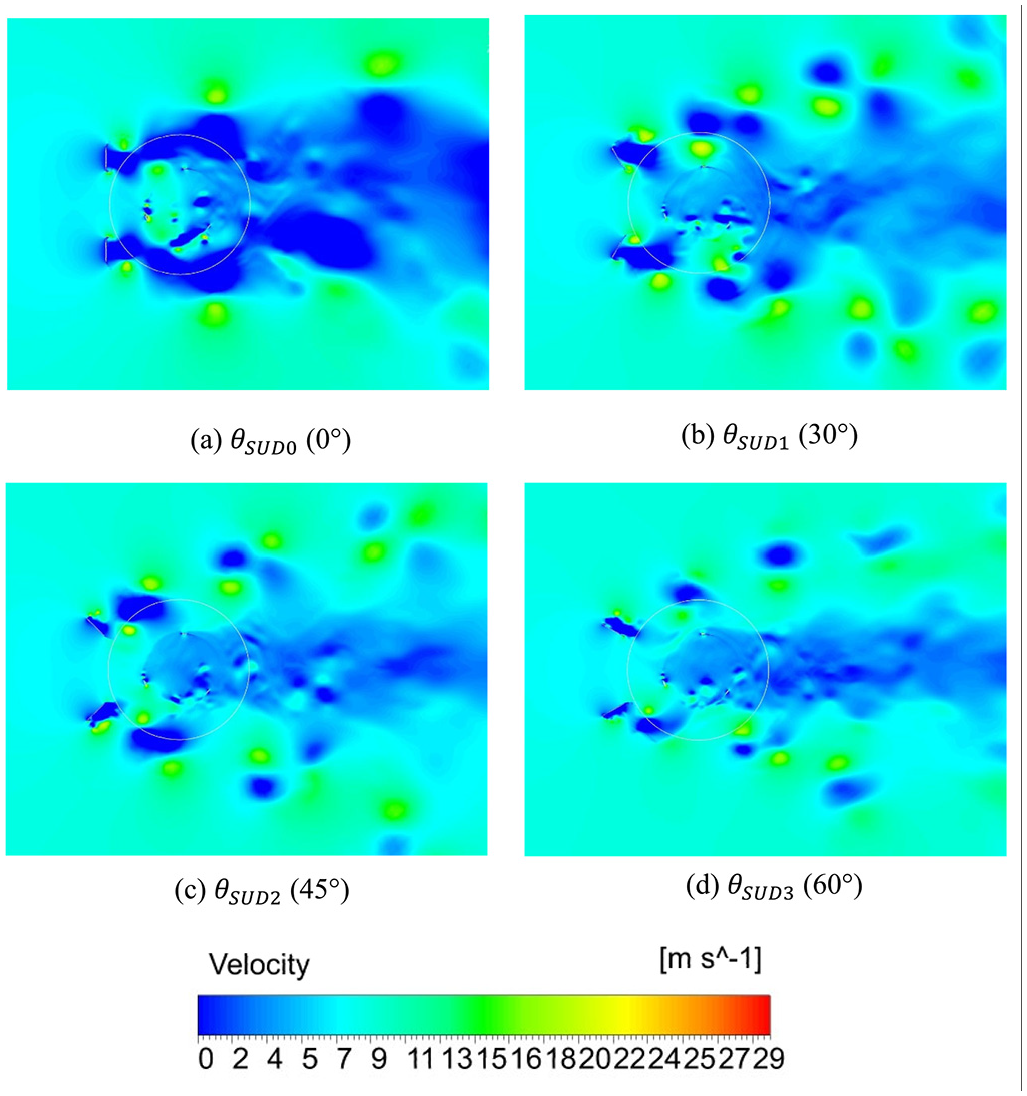
Comparison of velocity contours of VAWT with SPUD at four different inclination angles (TSR = 2.64,
However, it is noted that the inclination angle can re-generate smooth Cmi distributions following the reduction of its fluctuation distributions caused by the existence of the deflectors. The streamlines illustrated in Figure 23 demonstrate that the tilted deflectors can decrease the vortex generation behind the deflectors, which can reduce the flow unsteadiness. However, this benefit cannot assist the tilted deflectors to further improve the performance of VAWT as it changes the main purposes of adding a deflector in upstream of VAWT (i.e., to enhance the local wind speed and to re-direct the wind towards the blades of turbine).
From Table 7, it can be seen that at medium (TSR = 2.64) and high (TSR = 3.3) regimes of TSRs, tilting the deflectors has worse effect on the decrement of Cp-ave value than at low regime of TSRs (TSR = 1.44). In fact, at medium and high regimes of TSRs, a deflector with inclination angle can reduce the Cp-ave almost down to the value of bare VAWT. Compared to base geometry of SPUD, SPUD with optimum inclination angle can decrease Cp-ave improvement significantly by about 87.8% and 72.7% at medium and high regimes of TSRs, respectively. Meanwhile at low regime of TSRs, the decrement of Cp-ave value is not that significant (only around 4.1% compared to the base geometry of SPUD). The Cmi distribution suggests that tilting the deflectors can increase the negative moment production at all regimes of TSRs (see Figure 22). However, while it can weaken the positive moment production at other regimes of TSRs, although tilting the deflectors can generally improve the positive moment production at low regimes of TSRs. Therefore, the decrease of average moment production, which leads to reduction of VAWT’s power generation at low regimes of TSRs, is found not as strong as those at medium and high regimes of TSRs.
Conclusion
The effect of straight plate upstream deflector on the performance enhancement of VAWT is studied and based on results obtained it can be concluded that the addition of deflector in upstream of VAWT can improve the VAWT performance at all regimes of TSRs. This is mainly because the existence of upstream deflector can enhance the incoming wind speed and help to direct the wind towards the rotor area of the turbine. However, the ability of SPUD to improve the performance of VAWT varies at each regime of TSRs. At low regime of TSRs, the Cp-ave enhancement can be up to about 126.7% while at medium and high regimes of TSRs. This enhancement is around 52.7% and 52.5%, respectively. This is caused by the fact that at low regime of TSRs, the enhancement of rotational speed has greater benefit to help the turbine in reducing negative moment production, which can lead to the improvement of self-starting ability and increase of power generation. However, higher rotational speed can also introduce the blockage effect and higher drag at medium and high regimes of TSRs, resulting in less improvement in power generation of VAWT.
Furthermore, it is very important to place the SPUD at the right location in upstream of VAWT. Based on Cp-ave value evaluation, it is found that placing deflectors at both upward and downward of the upstream of VAWT can generate the best improvement of power generation at all regimes of TSRs compared to the other three studied configurations (i.e., upward, middle and downward). The gap between the two deflectors in both upward and downward configuration introduces a converged duct/nozzle flow effect, which can further enhance the incoming wind speed. Adding deflectors at both upward and downward locations can also direct the wind towards the turbines of VAWT, resulting in higher mass flow rate of wind directed to the rotor area of the turbine. Moreover, compared to the other three SPUD configurations (i.e., upward, middle and downward), the blades of VAWT in both upward and downward configuration can largely mitigate the upstream deflector wake by not directly impinging onto the downstream blades when they are rotating. Thus, this configuration is better to improve the Cp-ave value of VAWT.
After identifying the best configuration of SPUD, further parametric studies have been performed focussing on the width and inclination angle of SPUD. It is found that the increment of the deflector width has slightly positive effect on the increment of Cp-ave value of VAWT as long as the positive influence of narrower gap between the two deflectors can outstand the impact of larger wake region caused by a wider deflector. SPUD with optimum width (150% of
It is worth to note that this study has not investigated the effects of the thickness of SUPD and its position in the x-direction. This study adopted the findings from a previous study (Kim and Gharib, 2013) on the thickness of SUPD and its the x-direction position, because of same regime of Reynold number in these two studies. Hence, future study could be carry out on to understand the effects of these two parameters on the performance improvement of VAWT. Additionally, experimental study would be valuable to validate the findings from numerical studies. However they are outside the scope of this study.
Footnotes
Declaration of conflicting interests
The author(s) declared no potential conflicts of interest with respect to the research, authorship, and/or publication of this article.
Funding
The author(s) disclosed receipt of the following financial support for the research, authorship, and/or publication of this article: The first author would like to acknowledge the Ministry of Education, Culture, Research and Technology of Indonesia and Indonesian Endowment Fund for Education (LPDP) of the Ministry of Finance of Indonesia for the financial support through BUDI LPDP scholarship (Reference Letter Number: S-1166/LPDP.3/2017).