
Abstract
An experimental study is presented on the performance of a vertical axis wind turbine with variable blade geometry of the design developed by Austin Farrah. This is experimentally compared with the performance of a correspondingly sized Bach-type Savonius turbine using the same electrical generator and measurement instrumentation in a wind tunnel. Experiments were performed for Reynolds numbers, based on blade chord, in the range 5 × 10³ to 1 × 10⁵, and for blade settings between −40° and +40o. The study shows that for the tip speed ratios that have been investigated, the Farrah vertical axis wind turbine design can only marginally outperform a corresponding two-bladed Bach-type Savonius turbine and then only when its blades are set to 40° pitch angle. The presence of a small inner cylinder, which rotates with the turbine, does not enhance its performance due to the fact that it is immersed in an extensive column of relatively static air.
Introduction
This article presents the results of a study to assess the performance characteristics and relative merits of the vertical axis wind turbine (VAWT) design developed and patented by Austin Farrah (1996). This design comprised a number of pitchable rotor blades with aerofoil section positioned in a ring around a central circular sectioned inner cylinder, as illustrated in Figure 1 where the red line is the circumference of the undeployed blade array. The aim of the study was to develop a wind tunnel model of the Farrah turbine and a Bach-type Savonius turbine of corresponding dimensions and test the two designs using an identical vertical axis electrical generator under the same conditions in a low-speed wind tunnel. The data obtained were then compared to provide a detailed assessment of the performance merits of the Farrah turbine and in particular assess the effect of blade pitch setting and the size of the inner cylinder on its performance in comparison with the reference Savonius turbine.
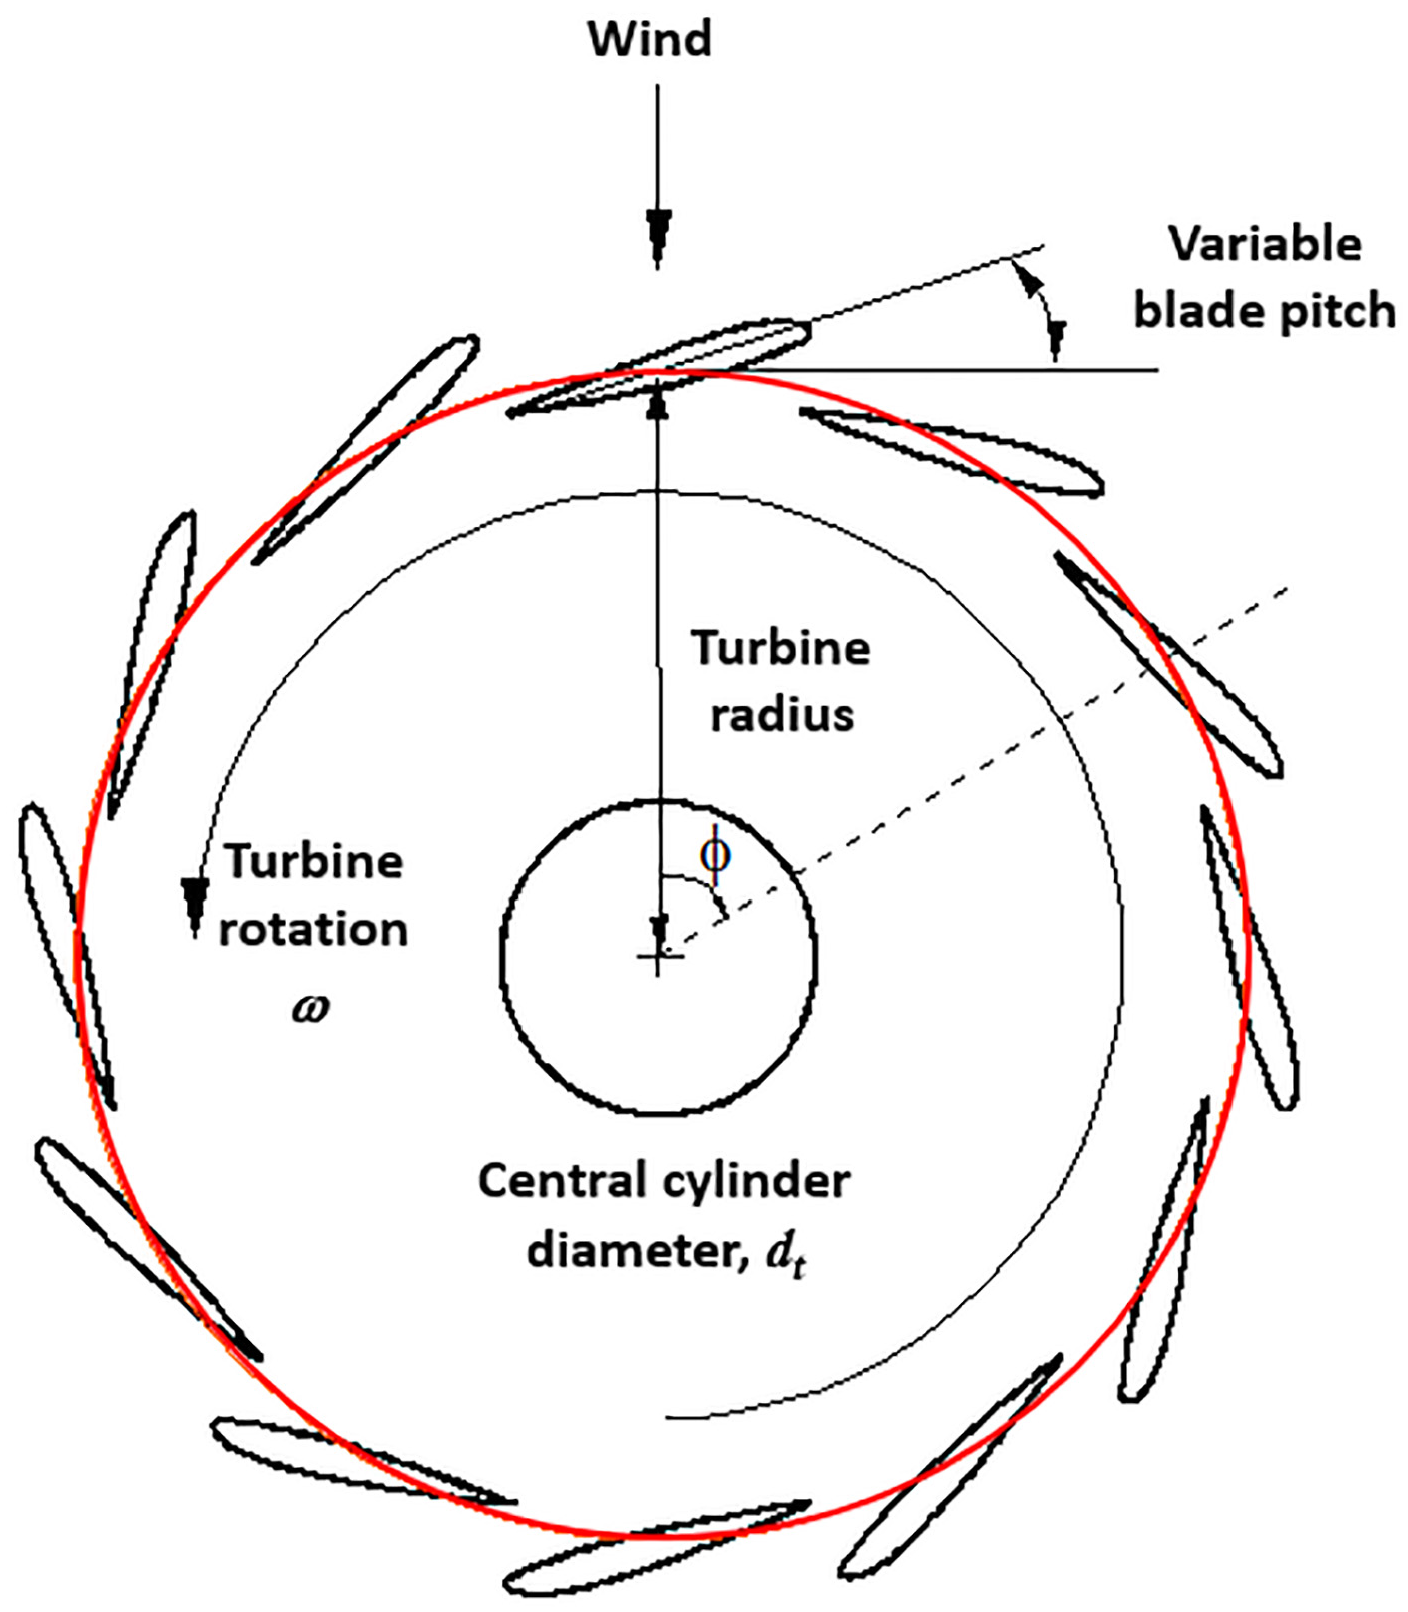
The vertical axis wind turbine concept of Austin Farrah.
VAWTs
Characteristics of VAWTs
A vertical axis wind turbine (VAWT) is one whose rotor shaft is vertical and its blades rotate through a horizontal plane. Most large industrial scale wind turbines are, however, horizontal axis wind turbines (HAWT). VAWTs are sometimes called cross-wind-axis turbines and can be both lift powered and drag powered. Spera (2009) and Patel (2011) state that roughly 90% of turbines today are HAWT machines and they are the dominant type for electricity generation. Figure 2 presents a comparative plot of the typical performance curves for the two most common VAWT configurations against the most common HAWT type. With their relatively high level of peak aerodynamic efficiency, HAWT designs are generally preferred for industrial scale wind energy extraction. For smaller scale energy generation and applications, such as water pumping, VAWTs can be considered and have the benefits of being cheaper to construct and maintain, produce less noise due to their lower tip speeds, are less sensitive to wind direction and do not suffer gyroscopic effects on the rotor.
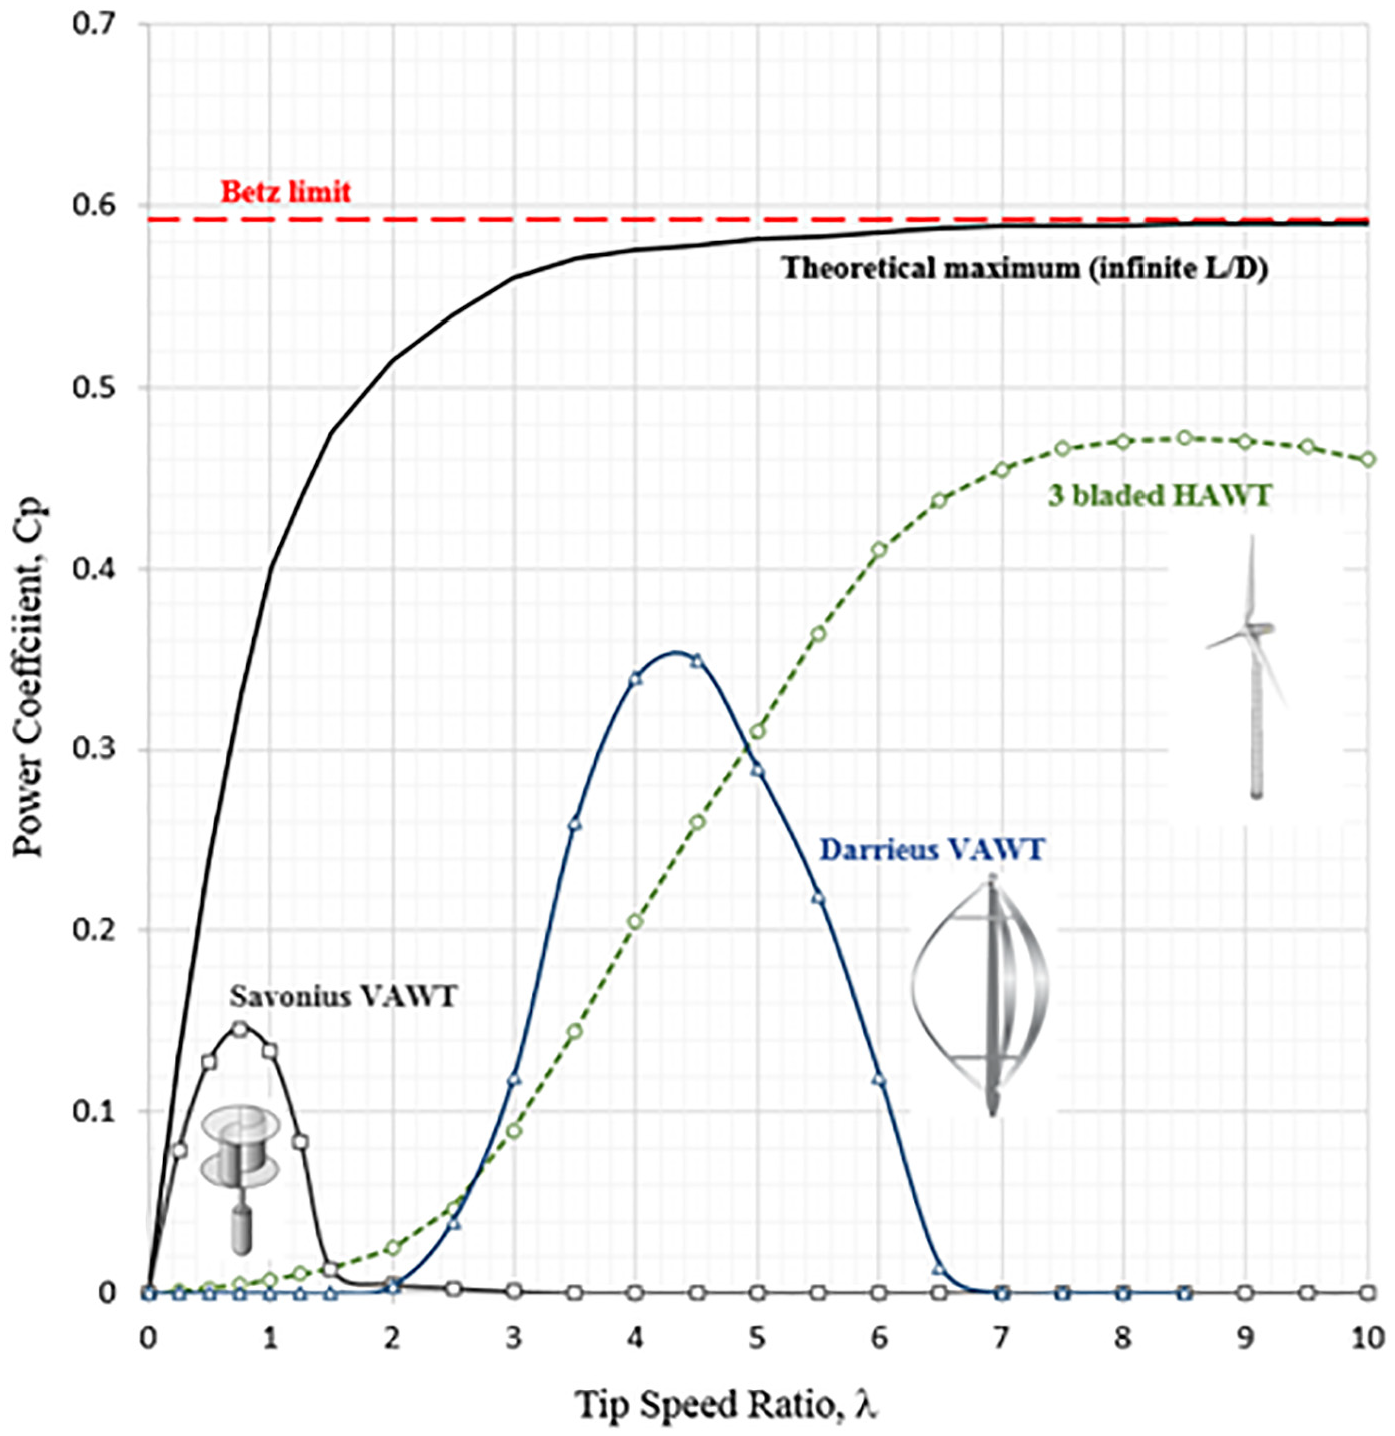
Typical performance characteristics for three common wind turbine designs (Wood, 2011).
The Savonius wind turbine design
Perhaps the simplest form of VAWT is that attributed to the Finnish engineer Savonius (1928, 1931). The concept makes use of a system of simple blades, with cross-section usually resembling the letter ‘S’, as illustrated in Figure 3. The Savonius turbine is generally considered a drag-powered device, whereby it derives its power from the difference in drag between the concave advancing blade and the convex retreating blade. There is a larger drag force on the advancing blade which creates torque about the axis of rotation. Gipe (2004) mentions that Savonius improved the turbine by creating an overlap gap between the advancing and retreating blade. This allows the incoming air flow to recirculate and creates a component of lift. Therefore, the Savonius rotor with such a configuration is not a pure drag-powered turbine and the additional lift force improves its performance. Kentfield (1996) showed that when the rotor is orientated as shown in the three configurations at the top of Figure 3, then the driving force is the torque from the drag difference on the blades. When the orientation is as shown at the bottom of the figure, the gap allows a beneficial diversion of the flow and creates a component of lift on the blades. Fujisawa (1992) further explained the lift at such angles as deriving from a Coanda effect from the jet-like flow around the convex side of the advancing blade flowing into the concave side of the returning blade. This improves the rotor efficiency and potentially allows the blade tips to rotate at speeds slightly higher than the freestream speed. The configuration depicted in Figure 3 is known as the Bach-type Savonius turbine, named after its German inventer, Bach (1931). The camber of the blades was designed to be more like an aerofoil and therefore create more lift. Many other studies, including Alexander and Holownia (1978), Mojola (1985), Fujisawa (1992, 1996), Fujisawa and Gotoh (1992), Dobrev and Massouha (2001), Saha and Rajkumar (2006), Komatinovic (2006), Sargolzaei and Kianifar (2007), Saha et al. (2008), McWilliam and Johnson (2008), Can et al. (2010) and Kumbernuss et al. (2012), have confirmed these findings, and most recently, the Particle Imaging Velocimetry technique has been employed to visualise these flows including Fujisawa and Gotoh (1992), Fujisawa (1996), Dobrev and Massouha (2001) and McWilliam and Johnson (2008). Computational fluid dynamics (CFD) has also been employed to verify these findings as well as to attempt to identify the optimum design characteristics for the Savonius turbine by Fujisawa (1996) and Dobrev and Massouha (2001).
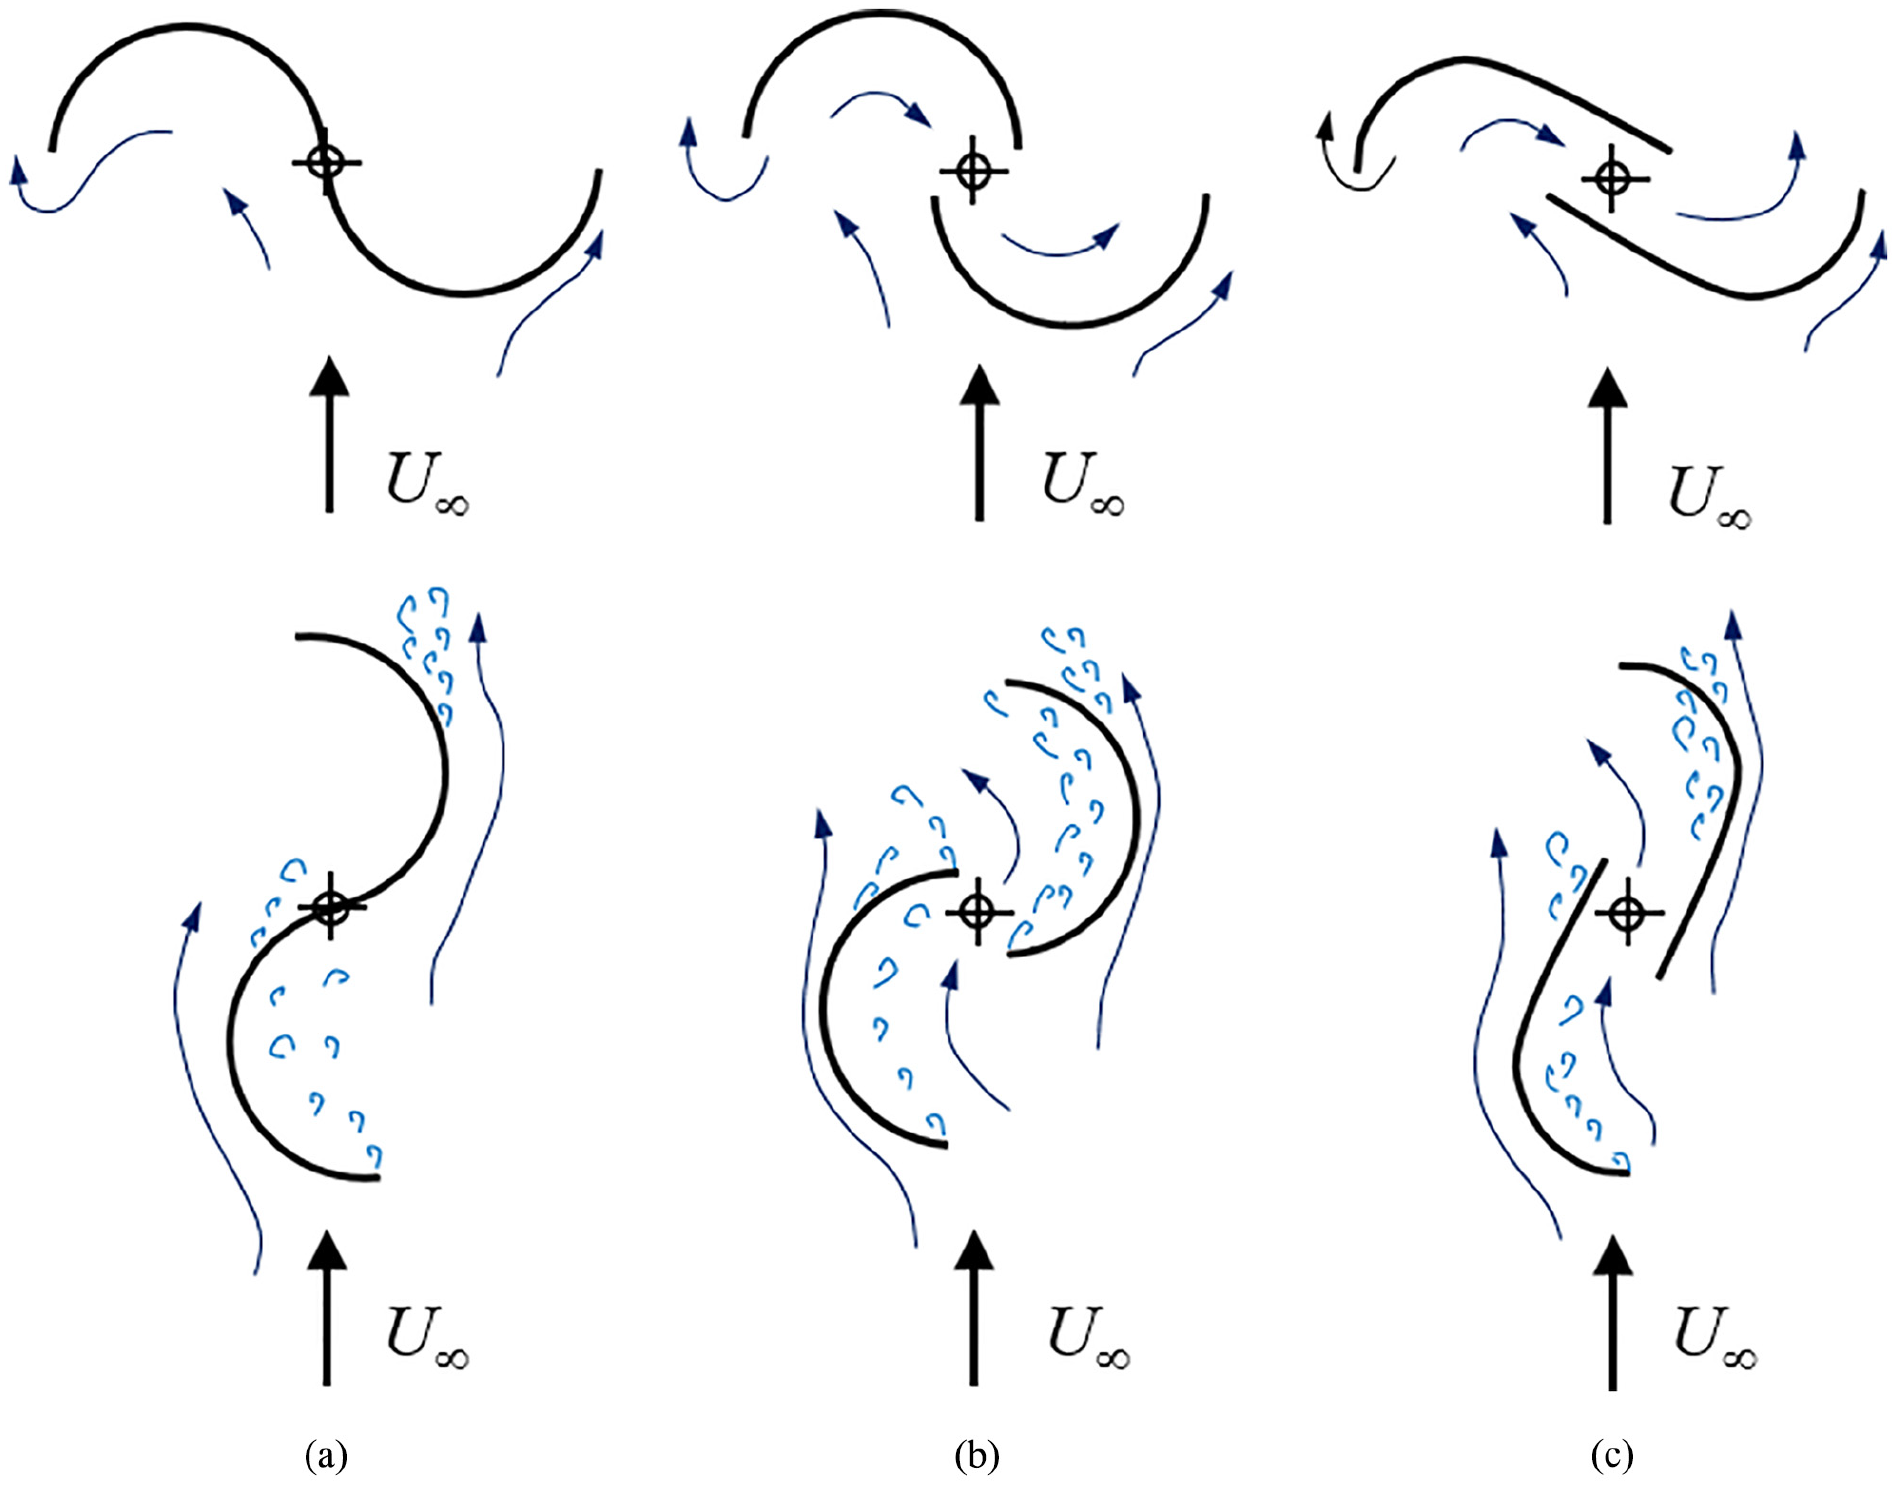
Flow recirculation around a Savonius turbine with and without blade overlap gap (clockwise turbine rotation; Gipe, 2004).
The Farrah wind turbine design
A further development of the VAWT was that proposed and assessed by Austin Farrah in the early 1990s, illustrated in Figure 1. The idea was to develop a vertical axis machine that would utilise the blade drag force, as conventional vertical axis machines have done, but also employ the effect of leading edge suction from the profiled blades to augment the turbine torque. He built a device in the early 1990s to support his patent application, which used 12 blades on a mechanism that allowed them to be pitched and at a fixed pitch setting relative to the tangent to the circumference of the undeployed blade array, as shown in Figure 1. Mounted to an electric generator attached to a frame on the back of a pickup truck, he obtained power output data by driving the truck at a constant road speed while measuring the electrical current and voltage across the generator resistor. None of the data from these primitive experimental tests have survived. While Farrah tested his device with each blade set at a fixed pitch angle, he did recognise that there may be some benefit from a mechanism that would impart a cyclic pitch motion to the blades as they rotated around the central axis. No information is left to explain Farrah’s choice of 12 blades, but this is a compromise between aerodynamic considerations (Reynolds number based on blade chord, gap size to trailing edge boundary layer thickness, etc.) and structural and manufacturing complexity and cost. This article aims to provide detailed data on the performance of this concept by a carefully designed comparative wind tunnel test.
Models and experimental arrangements
Two models were manufactured for testing in the T7 low-speed wind tunnel at City University London. The first was of the Farrah design with 12 blades, while the second was a Savonius turbine, of the Bach type, which was designed to have the same swept diameter as the Farrah turbine model with blades undeployed, the same effective span, or height, and the same endplate diameter. A series of experiments were undertaken to assess (1) the performance characteristics of both types of turbine design, (2) the effect of blade pitch setting on the Farrah turbine performance and (3) the effect of the inner cylinder on Farrah turbine performance.
The Farrah turbine model
For the present experiments, a full-scale model of a Farrah wind turbine was developed from the original designs, obtained from Austin Farrah’s estate and illustrated in the 1996 patent application by Farrah (1996). The current model (see Figure 4) was based around 12 wooden rotor blades of span b = 460.5 mm, chord c = 72 mm and with an aspect ratio of 6.4. Each blade had an NACA 23012 aerofoil profile, a simple, rectangular planform, with no sweep or taper, and two thin aluminium flanges, one at either end, that were fitted with guide pins that enabled the blade to pivot about the mid-chord axis.
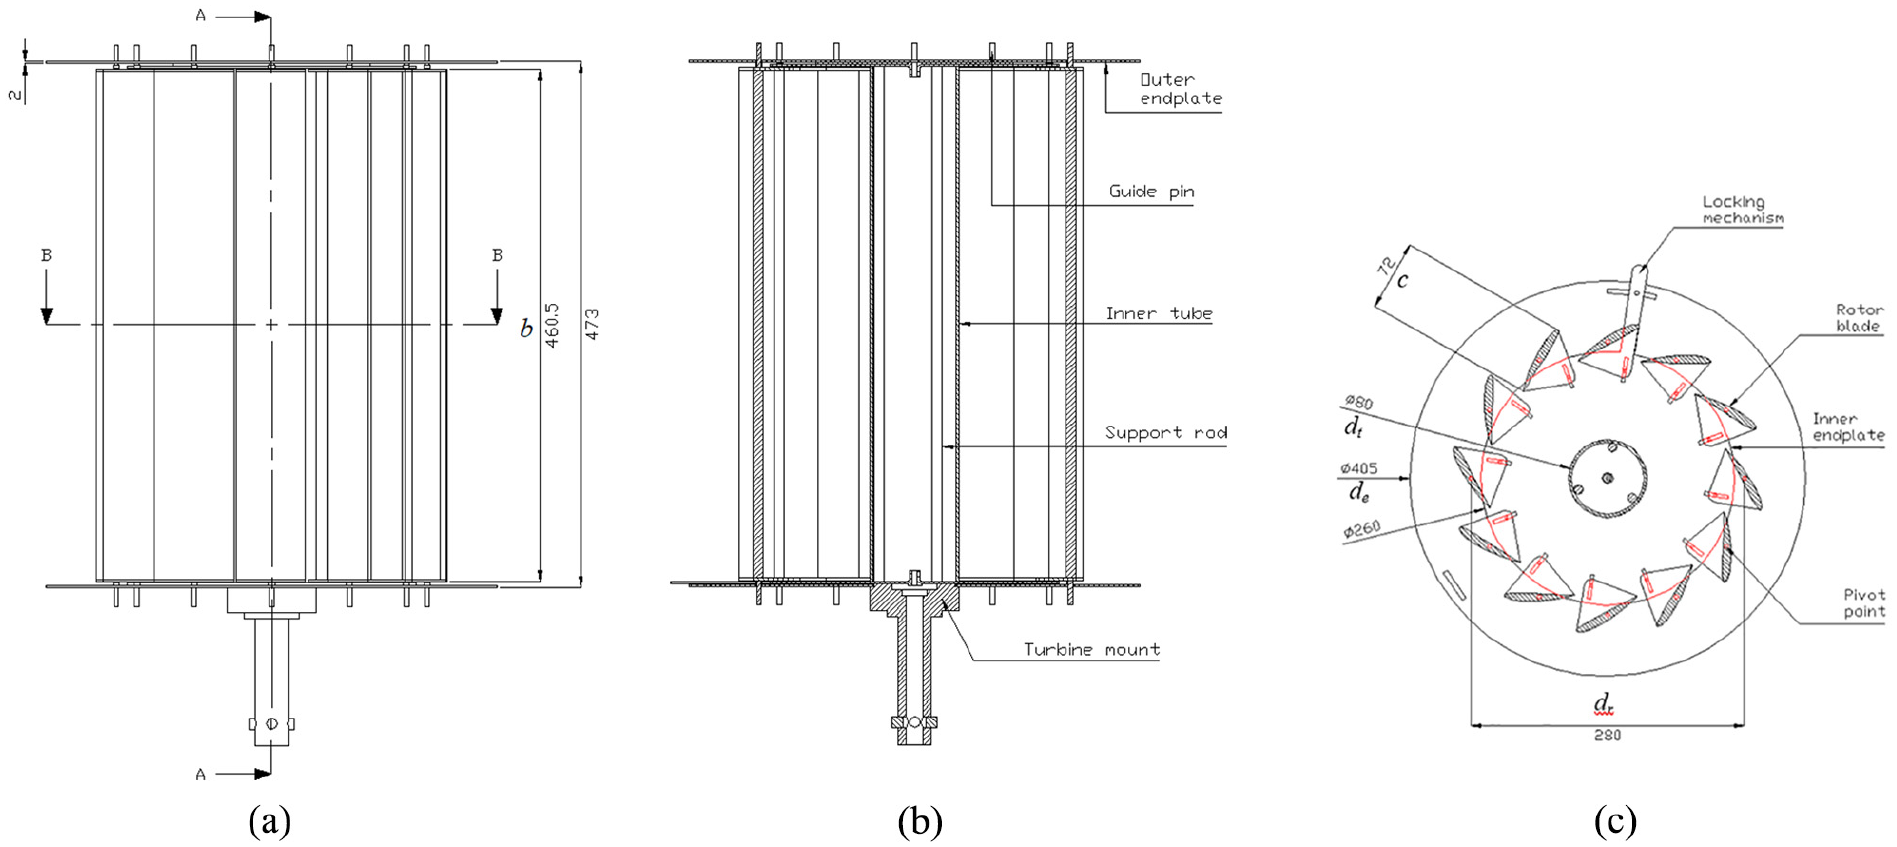
Geometry of the Farrah turbine model tested in the wind tunnel (dimensions in mm): (a) Side view, (b) section A-A and (c) section B-B.
The rotor blades were positioned vertically within a frame formed by the turbine’s inner tubular cylinder and a set of inner endplates and were oriented in a circular nose-to-tail pattern, such that the upper surface of the blades formed the outer surface of the cylinder of rotation. The diameter of the cylinder of rotation was taken to be the distance between the pivot points of diametrically opposed blades, this being dr = 280 mm. Two different inner cylinder members, which rotated with the turbine, were examined during testing. The first was made from a section of hollow plastic tubing that had a span of 462.5 mm, a wall thickness of 3 mm and an outer diameter of dt = 80 mm. The second, also a section of hollow plastic tubing, was slightly larger, with an outer diameter of dt = 110 mm, a shell thickness of 3.5 mm, but the same span. For both tube sizes, structural rigidity for the turbine was primarily provided by three 9.5-mm-diameter solid aluminium rods that were wholly enclosed within the inner cylinder and which were used to connect the upper and lower inner endplates. A pair of 2-mm-thick aluminium outer endplates, each of diameter de = 405 mm, completed the turbine.
Different rotor blade angle settings of the Farrar rotor could be implemented by moving the lower inner and outer endplates relative to each other. A locking mechanism was used to ensure that the blade angle remained fixed during testing. Specific blade angles were set using a pre-inscribed scale that was etched on to the lower endplate of the turbine. The zero datum for this scale, that is, α = 0°, was taken to be the orientation of the blade chord line when the rotor blades were fully closed, such that the turbine resembled a smooth cylindrical drum.
The Savonius turbine reference model
The reference Savonius turbine was designed to have the same basic dimensions (swept area, diameter, end plate diameter and blade height between the end plates) as the Farrah turbine model. The turbine design encompassed two blades, as shown in Figure 5, comprising a quarter circle vane connected to a straight section. The two blades were separated by a gap of 42 mm, twice the radius of the end vanes. Previous experiments and analysis have shown that this is the optimum setting for this class of Savonius design, for example, in Fujisawa (1992) and Saha et al. (2008). The model was manufactured out of clear Perspex and carefully assembled using alcohol-based glue in a specially constructed jig to ensure that the mass distribution of the model was centred about the axis passing through the centre of both end plates. The same turbine mount as used for the Farrah turbine tests was re-employed for this test. The mass of the Savonius model was made equivalent to the Farrah turbine model by the addition of a small steel plate centred on the central axis on the lower end plate, in between the end plate and the turbine mount. This was done in an attempt to ensure that the inertia of both models was equivalent (though the mass distribution will evidently be different).
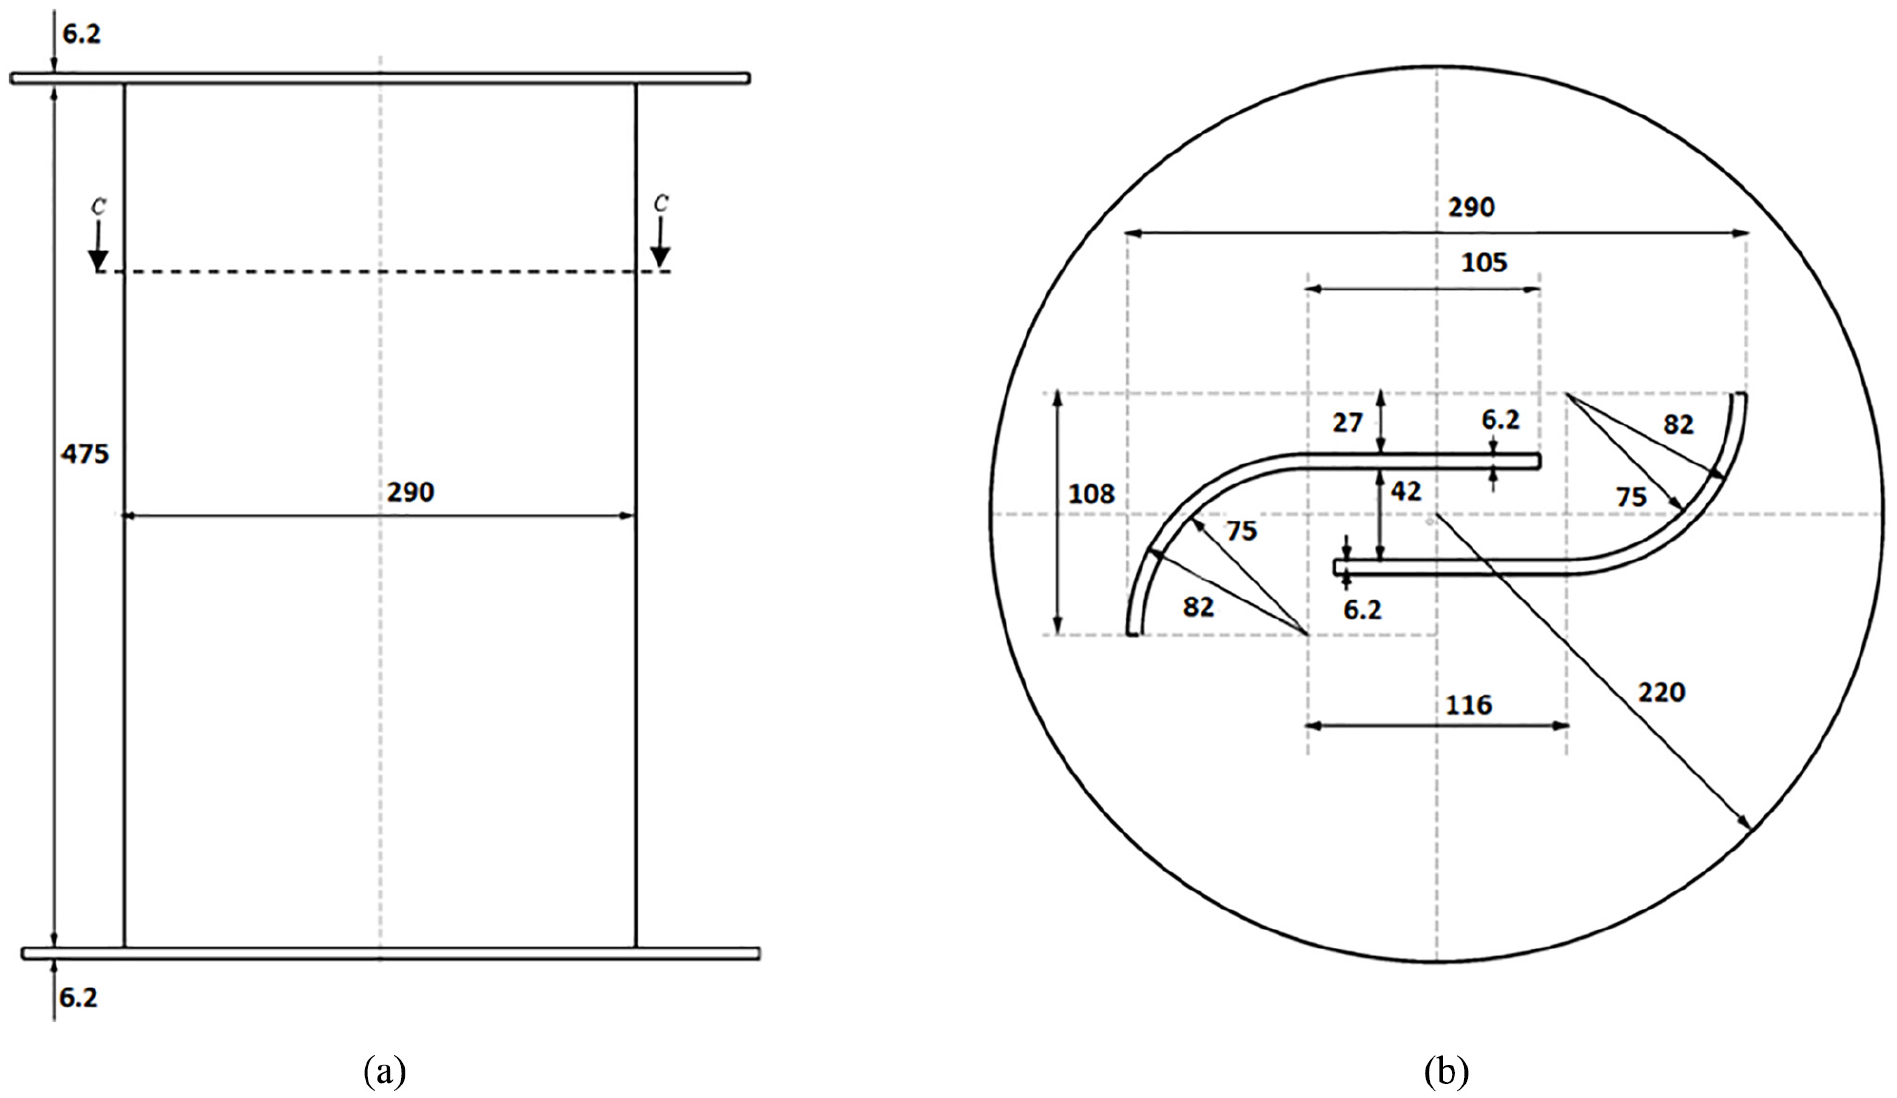
Geometry of the reference Savonius turbine model tested in the wind tunnel (dimensions in mm): (a) side view and (b) section C-C.
The wind tunnel, turbine generator and the measurement instrumentation
The T7 wind tunnel at City University London is of the closed-circuit return type and has a rectangular working section of dimensions 3 m × 1.5 m × 8 m. The facility can be operated at speeds between 4 and 25 m/s, with wind speed, U, measured by using a pitot-static tube, positioned upstream of the model, and a Furness Controls Ltd. FCO318 differential pressure transmitter (with range ±500 Pa) to measure the dynamic pressure, q, in the working section. From this, and the air density inferred from the perfect gas equation of state and the measured ambient temperature and pressure, tunnel freestream wind speed was calculated.
For the present experiments, a 4–20 mA current loop was used to transmit the output of the FCO318 to a PC running a purpose-designed data acquisition (DAQ) and analysis system developed using the National Instruments (NI) LabVIEW software programme and based around an NI M-series PCI-6259 data acquisition device. Connection between the FCO318 and the DAQ was through an NI E-series SCB-68 shielded I/O connector block.
In order to assess the power developed by the turbine of interest, the turbine model was attached to a 12-V LVM412F generator that was harvested from the commercially available LVM Ltd. Aero4gen-F wind turbine. Connection between the turbine and the generator was through a mount attached to the turbine’s lower outer endplate. A direct-drive method was used so as to avoid the complication of a gearbox, as shown in Figure 6. The voltage output from the generator, V, was passed to the DAQ system through the same means as for the FCO318 pressure transmitter output. Two Ohmite wire-wound, vitreous enamel tube-type resistors, each rated at 2 Ω and 300 W, were placed in series with the generator to act as the load (see Figure 6(c)). The specific choice of load resistance R = 4Ω was made with the intention to restrain the rotational rate of the turbine at high wind speeds to levels that did not result in unacceptable structural vibration.
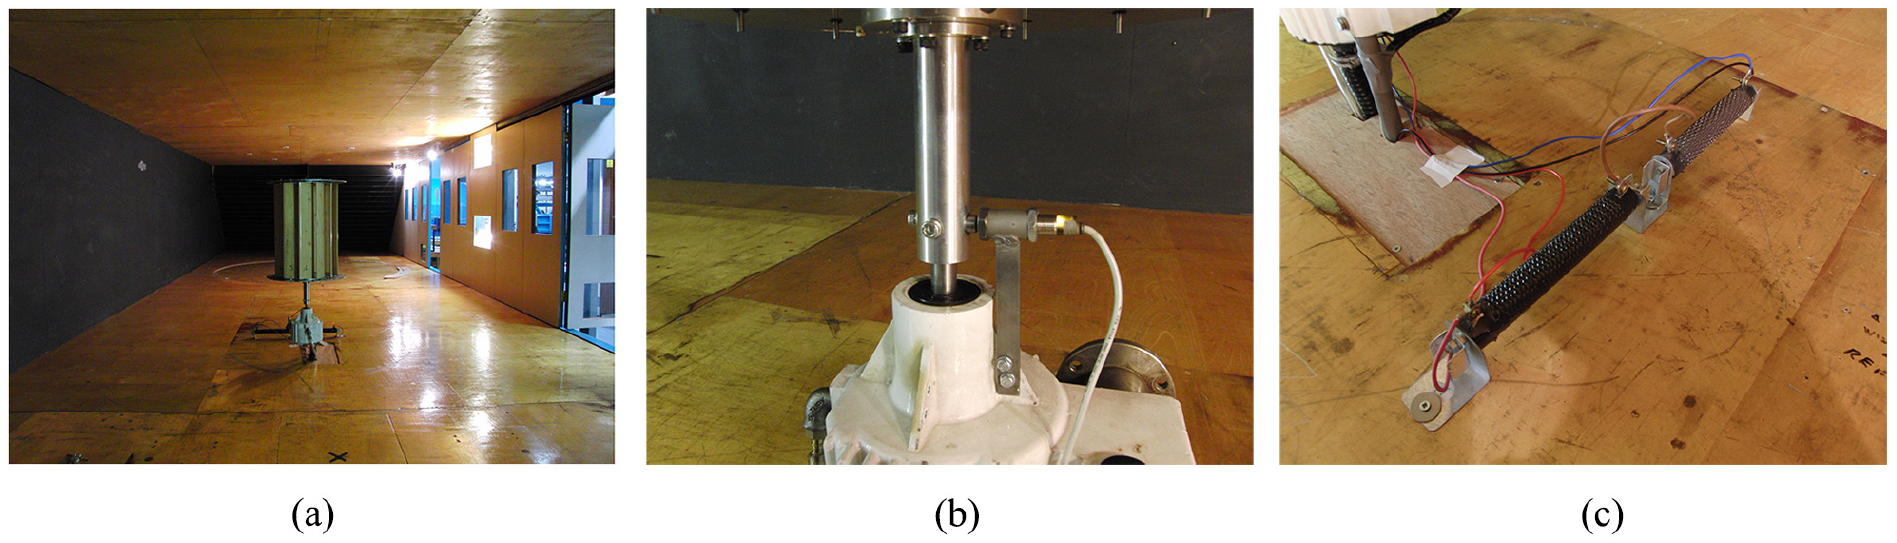
The Farrah turbine and generator set-up in the wind tunnel: (a) Farrah turbine assembly view, (b) proximity switch and (c) resistor load.
An air cooling system, delivering pressurised air to the interior cavity of the generator, was incorporated into the generator so as to mitigate the known effects of increasing temperature on the output voltage. However, this system was not generally employed during testing as investigation revealed that at the low rpm at which the present experiments were performed, air cooling had no impact on the results.
The speed of rotation of the turbine during the experiments was determined by employing four steel screws that were used to fix the turbine to the generator’s shaft as inputs to an IMO M12 PNP 3-wire inductive proximity switch that was mounted on the generator’s outer shell (see Figure 6(b)). With rotation of the turbine, the passing of the mounting screws by the location of the proximity switch caused it to produce a series of pulses, the rising edges of which were counted using the DAQ system software to determine the frequency of rotation, f. Power for the proximity switch was supplied by an EZ GP4303D DC variable power supply set to provide 10 V. The pulses generated by the proximity switch were passed to the DAQ through the same means as for the FCO318 pressure transmitter and LVM412F generator voltage outputs.
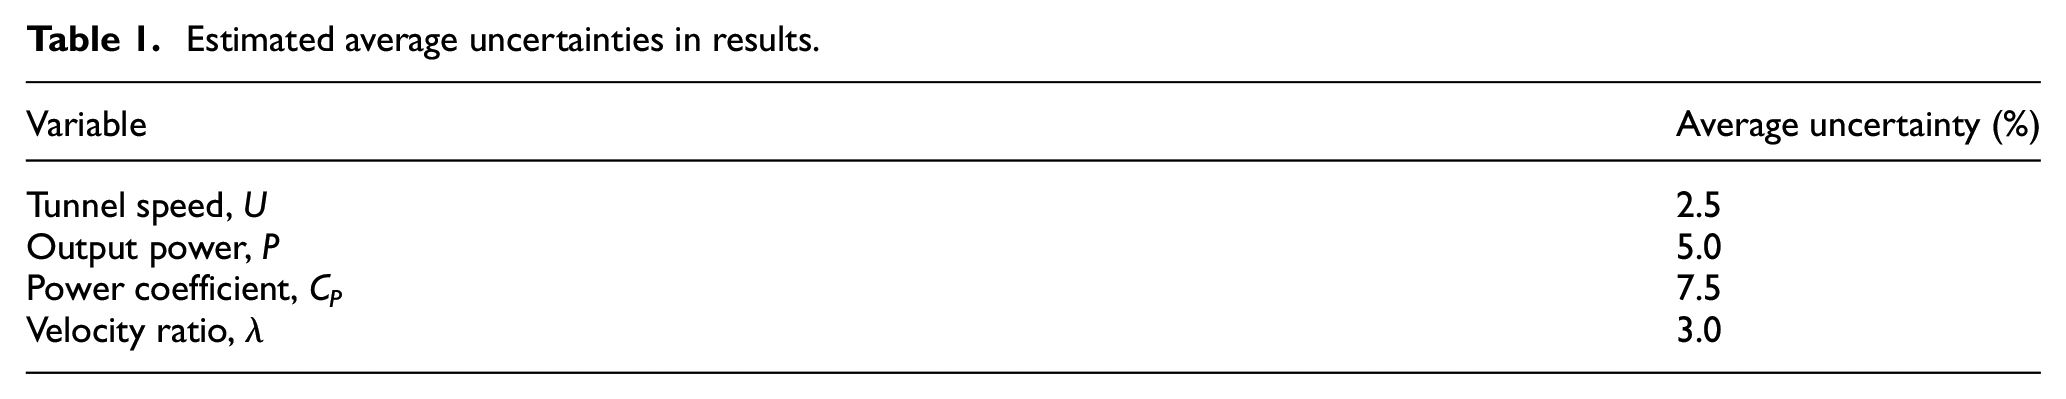
Note that with this arrangement, a single rotation of the turbine generated four pulses, so that the actual frequency of rotation f was one quarter of the frequency measured by the data acquisition system, fm. Based on the quoted accuracy of the instrumentation used in the study and the repeatability of data, the estimated average uncertainties in the measured data are presented in Table 1.
Estimated average uncertainties in results.
Experimental testing procedure and data analysis
Experimental testing of the Farrar rotor examined a total of 12 different blade angle settings: α = ±7°, ±10°, ±15°, ±20°, ±30° and ±40°. The turbine could not be made to rotate in a reliable manner when|α| < 7°. Each test run comprised three phases: start-up, velocity increasing and velocity decreasing phases that were always performed in the same specific manner so as to ensure consistency between results for different configurations.
For phase 1, the T7 tunnel was switched on at its minimum operating velocity and the wind speed was then increased in steps of ΔU≈ 0.25 m/s until autorotation of the turbine was initiated (cut-in). The turbine was then allowed to idle at this starting wind speed, Ucut-in, for a period of 10 min so as to allow the generator’s output to stabilise. Such an approach was based on a series of preliminary tests with the generator that indicated its voltage output varied slightly with time due to increasing temperature, but that this effect generally reached a plateau after approximately 7 min.
During the stabilising period, multiple readings of the output voltage, rotational frequency and tunnel speed were taken over a period of 30 s at intervals of 1 min. Throughout each of these 30 s data logging periods, continuous readings of the voltage output and tunnel speed were sampled at a rate of 250 Hz. A buffer size of 1 s was used in measuring f, so that readings of the rotational frequency were effectively made only once every second. The root-mean-square voltage, Vrms, and hence the output power, were also assessed at 1 s intervals.
At the end of the initial stabilising period, the tunnel speed was then increased in steps of approximately 0.5 ≤ΔU≤ 1.0 m/s until the maximum velocity, Umax, for that particular rotor configuration was reached. At each new wind speed for which measurements were to be made during the second phase of the test, the turbine was allowed to stabilise for a period of 1 min before readings were taken for a period of 30 s, in the same manner as detailed above for phase 1. It is important to note that the value of Umax for each rotor configuration was set by the limits of the tunnel and the effects of structural vibration of the model. For rotor blade settings of|α| < 20°, the maximum speed tested was typically Umax≈ 20 m/s. For larger blade angle settings, this fell to Umax≈ 15 m/s, as higher speeds were found to induce unacceptable vibrations. In all cases, the maximum rpm that could safely be achieved was N≈ 200 rpm. Once Umax was reached, the tunnel speed was then reduced in steps of 1.0 ≤ΔU≤ 1.5 m/s until the point at which the turbine stopped aurorotating and Ucut-off was reached. At each velocity of interest during this final phase of testing, measurements were taken in the same manner as before.
The experiments were performed, as described above, for both the Farrah and the reference Savonius turbines. For the Farrah turbine, three different configurations of the turbine’s inner tubular member were examined: dt/dr = 0 (achieved by completely removing the inner tubular member so that the three support rods were exposed to the airflow), dt/dr = 0.29 (achieved using the small inner cylinder) and dt/dr = 0.39 (achieved with the larger inner cylinder). For each of these configurations, the turbine’s performance was measured at each of the 12 blade angle settings, giving a total of 36 different arrangements of the Farrah turbine. Repeat measurements for each such arrangement were taken to ensure accuracy and consistency in the results.
The testing of the reference Savonius turbine, which of course has no moving components, was carried out using exactly the same procedure as with the Farrah turbine, being mounted using the same brackets onto the same cooled generator. In this way, the performance data of the two designs could be directly comparable.
The measured data were processed to provide measurements of the generator power, the rotor speed and velocity ratio. The power developed by the turbine was determined from measurements of the root-mean-square voltage output from the generator, Vrms, and the total resistance in series with the generator, R, as follows

The root-mean-square voltage was calculated in the usual manner from the continuous readings of the output voltage over a period of 1 s. Calculated power values were non-dimensionalised to obtain the associated power coefficient, CP, such that

where ρ is the local density of air, U is the tunnel wind speed and As is the turbine’s swept area. Note that since the term ½ρU3As represents the maximum wind energy available to the rotor, the power coefficient is thus essentially a measure of Pout/Pin and so indicates the efficiency of the turbine. In calculating the power coefficient, the density of air was taken as the measured ambient density in the laboratory since it was assumed that the tunnel airflow could be regarded as incompressible. The swept area was taken to be the projected area defined by the distance between the model’s endplates (b = 473 mm) and the diameter of the cylinder of rotation (dr = 280 mm), giving As = 0.13244 m2.
Analysis of the results was also performed with regard to the rotor blade rotational speed, Ur, to freestream wind speed, U, velocity ratio, λ, which is akin to, and will therefore henceforth be referred to as, tip–speed ratio. This is an important parameter for the performance of wind turbines in that the main rotor properties of force and torque vary directly with it. The angular velocity, ω, is determined from the frequency of rotation f such that
Results and comparisons
Comparison of the measured performance of the Farrah turbine versus the reference Savonius turbine
Observations made during testing indicated that the Farrah turbine underwent rotation in two different directions, depending on the sign of the blade angle, as shown in Figure 7. These directions were found to be repeatable and unaffected by inner cylinder diameter. The results of the experiments also showed that the performance of the generator remained constant throughout the testing period, that is, the curves for P versus N (rpm) were equivalent for both configurations of the turbine, and were independent of blade α and inner cylinder diameter, dt. It can therefore be said that the observed changes in turbine performance are solely due to the impact on turbine spin rate from changes to the aerodynamic forces and torques acting on the turbine and are not associated with fluctuations in generator output over time.
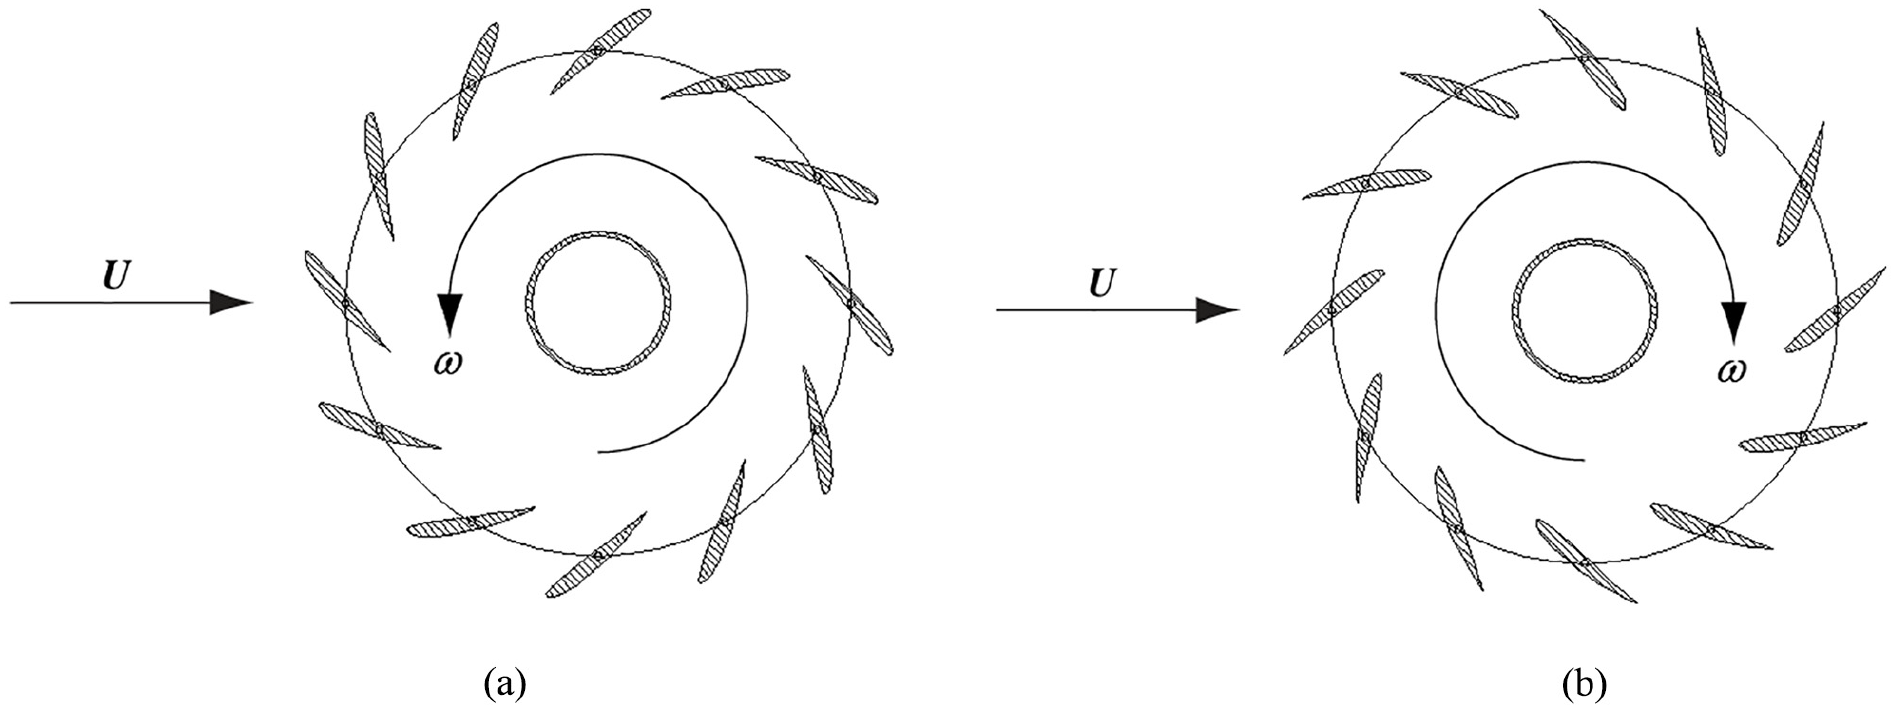
Sense of direction of turbine rotation for positive and negative blade angles: (a) positive α and (b) negative α.
Figures 8 to 10 present the comparisons of the performance of the two types of turbine, showing the effect of blade setting angle for the case of the Farrah design. Figure 8 presents the comparisons for the case of the Farrah turbine with no inner cylinder. The variation of the observed cut-in and cut-out wind speeds with blade setting angle for the Farrah turbine with no inner cylinder is plotted in Figure 8(g)), together with the figures for the Savonius turbine. This chart shows that the cut-in wind speed is always higher than the cut-out wind speed. That is, a VAWT will continue to turn and generate power at wind speeds lower that those required to initiate rotation during start up. This is the same effect as seen with HAWTs, which can be explained with reference to the local blade aerodynamic angle of attack as in Wood (2011). When the blade experiences a decreasing wind speed, it is generally rotating at a high rate and the blade angles are therefore already close to those giving best aerodynamic efficiency. When the turbine is starting, the rotation speeds are generally very low at first, with the result that the relative blade angles start off very large, where there is very little lift generated and decrease slowly towards optimum performance. In addition, the relative effect of the resistive force in the drive train and generator is greater at the lower rotational speeds/wind speeds.
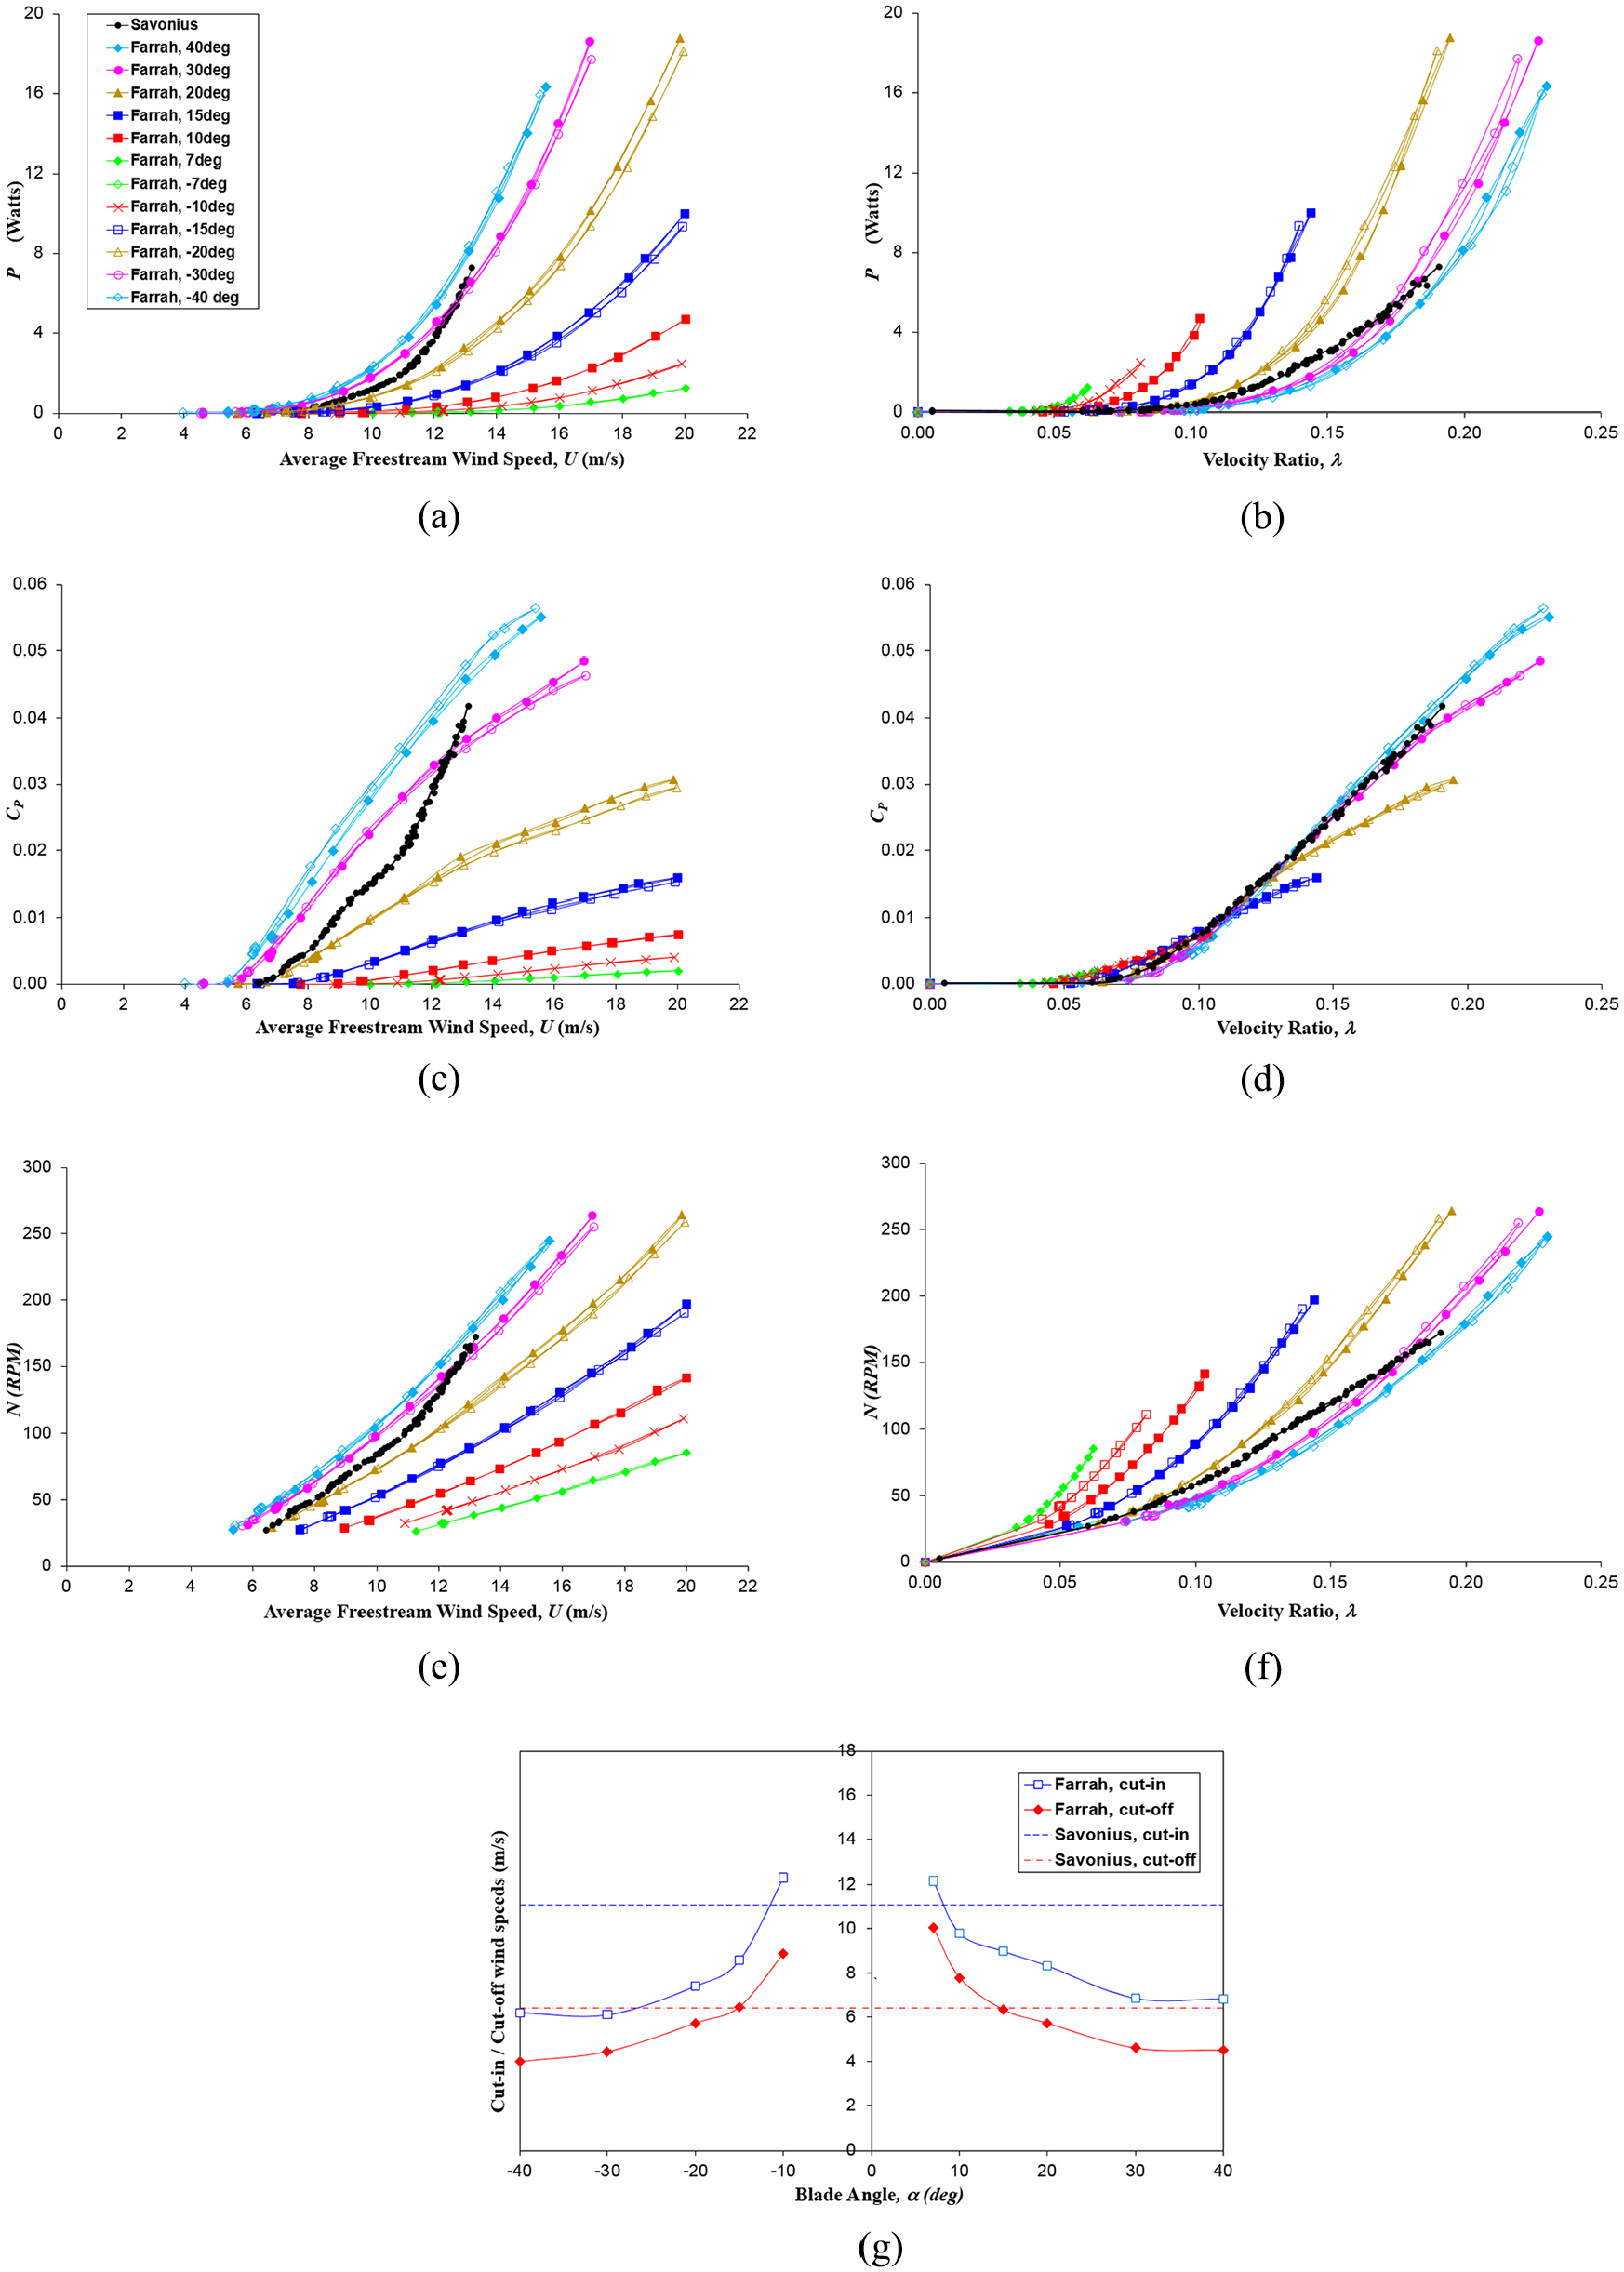
Performance comparison for the Savonius turbine and the Farrah turbine with no inner cylinder (dt/dr = 0): (a) power plotted against wind speed. (b) Power plotted against velocity ratio. (c) Power coefficient plotted against wind speed. (d) Power coefficient plotted against velocity ratio. (e) Rotational speed plotted against wind speed. (f) Rotational speed plotted against velocity ratio. (g) Cut-in and cut-off wind speeds.
The circulation around the turbine will generate a lateral ‘Magnus force’, acting sideways out from the turbine, which leads to the observed model vibration at the higher wind speeds. Also the cut-in and cut-out wind speeds reduce with increasing blade setting angle, for both positive and negative settings. Interestingly, the Farrah turbine was found to begin turning earlier than the reference Savonius turbine for α≥+ 10o and −12o, and it continued to turn at lower wind speeds when|α| >∼15°. This is one practical benefit in favour of the Farrah turbine.
The variation of the measured rms power output with average freestream wind speed is plotted in Figure 8(a), which also includes the corresponding curve for the theoretical maximum power output. The results show continuous improvements in averaged turbine power output as blade angle is increased all the way up to the maximum angle tested of α = ± 40°. It is unclear how much further the blade angle can be increased with such improvements continuing or whether a peak angle may be reached. It was not possible to investigate blade angles of|α| > 40° due to the design of the turbine, which made this physically impossible, and the levels of model vibration at the higher wind speeds. For all blade angles tested (i.e. |α| ≤ 40°), the power generated by the rotor was seen to be insensitive to whether the tunnel speed was increased or decreased. The problem of model vibration prevented the acquisition of data at high enough λ to capture CPmax. The authors attempted to increase the achievable RPM by changing the resistor load but this did not alleviate the vibration problem and an assessment of the relative levels of CPmax for these two designs could therefore not be made.
The results suggest the existence of two different performance regimes for the turbine. The first, for α≤ 15°, is where the performance exhibits considerable sensitivity to blade angle setting (specifically whether the angle is positive or negative). The second, for α > 15°, is where the performance shows somewhat less sensitivity to the sign of the blade setting angle. Since the stall angle for the NACA 23012 aerofoil at the relevant Reynolds numbers is known to be typically around α≈ 16°, these changes may be associated to some extent with blade stall. From these data, it can be seen that the reference Savonius turbine has superior power generation performance if the Farrah turbine blade setting is below about ±30°. For|α| = 30°, the Farrah turbine has superior performance from cut-in wind speed up to about 13 m/s. For the case of the higher setting of|α| = 40°, the Farrah turbine outperforms the reference Savonius design up to 13 m/s, this being the maximum wind speed at which the Savonius model could be tested. If the power curve for the Savonius model was projected to higher wind speeds, assuming no stall effects, then this design would begin to outperform the Farrah turbine at, perhaps, about 14 m/s wind speed.
When the averaged power output is plotted against tip speed ratio, λ, as shown in Figure 8(b), the data show no evidence of a peak power coefficient, which must exist for each case at a value of λ beyond the maximum attainable during testing (the peak may be around λ≈ 0.3-0.6, as is the case for other, similar VAWT turbine designs). A larger rotor diameter or wind speeds beyond the upper limit achievable in the T7 wind tunnel would be needed to investigate this further.
Results for CP against λ (Figure 8(d)) also show that low blade angles (α≤± 15°) are actually more efficient at lower velocity ratios (λ≤ 0.1) than higher blade angles. The performance of the reference Savonius turbine seems to correspond with that of the Farrah turbine with a 20o blade setting angle for low λ. With blade angles less than this, the Farrah turbine was found to be more efficient for λ < 0.11. Above this velocity ratio, the higher the blade setting angle, the higher the output power coefficient, such that the Farrah turbine with 40o blade angle marginally outperformed the reference Savonius turbine. An explanation for these trends might be that at low blade angles, the Farrah turbine derives much of its torque from aerodynamic suction from attached boundary layers over the blade surfaces. In such circumstances, the turbine would be driven more by lifting forces. At the higher blade angles, the boundary layers will separate, such that in the stalled flow state, it is the drag force which contributes the most to driving the turbine, which will consequently behave much more like a Savonius turbine and will be much less aerodynamically efficient. If correct, however, the basic Farrah turbine design could be improved with the incorporation of a device that varied the blade angle according to the average wind speed condition in order to optimise the turbine performance.
Figures 9 and 10 plot the same comparisons for the Farrah turbine with inner cylinders of dt/dr = 0.29 and dt/dr = 0.39, respectively. The data show that the Farrah turbine performance trends were exactly the same as those seen with no inner cylinders, with only some minor changes in the magnitudes of the output power characteristics for a given averaged wind speed or velocity ratio condition. The behaviour of the cut-in and cut-out wind speeds for the two inner tube cases is seen to be very much similar to that without an inner tube. As the inner tube diameter is increased, the sensitivity to the direction of blade pitch increases. For the largest inner tube, a negative blade setting is seen to generate higher output power (and CP) values for a given wind speed for all blade angles. Only when power coefficient is plotted against velocity ratio does this sensitivity appear to reduce. The next section analyses these changes by comparing in detail the performance curves for the three inner cylinder configurations of the Farrah design.
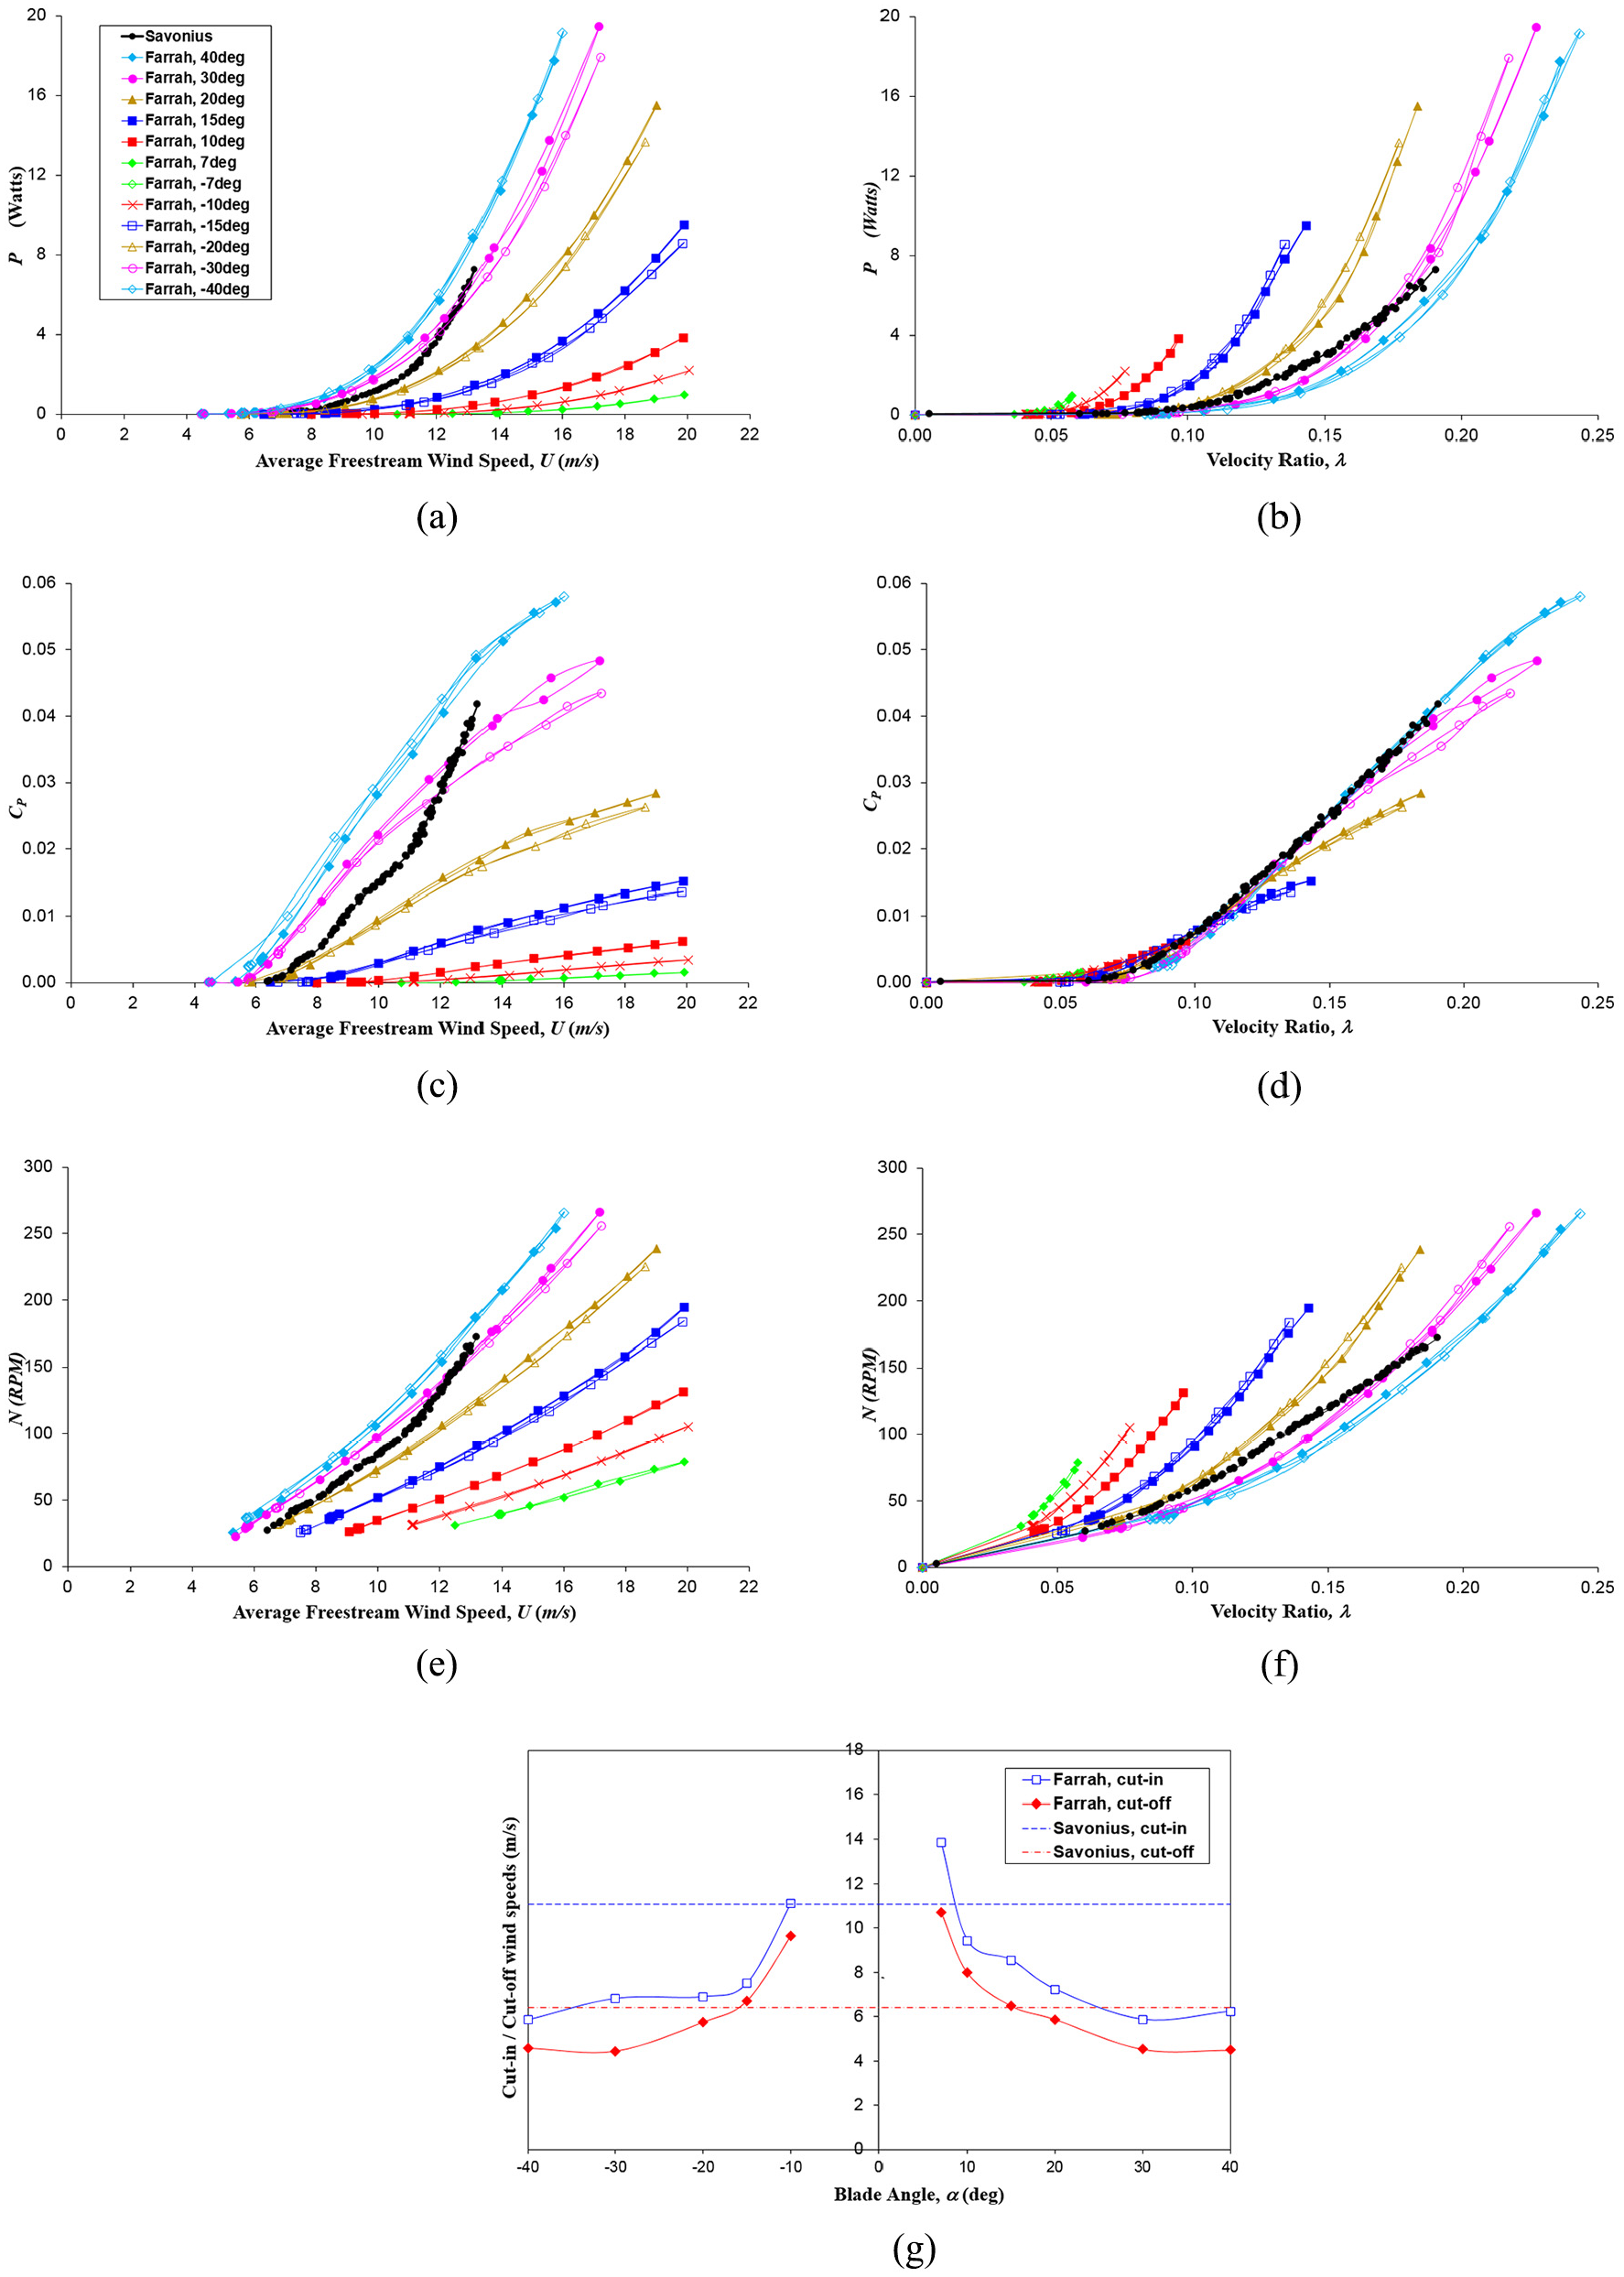
Performance comparison for the Savonius turbine and the Farrah turbine with small inner cylinder (dt/dr = 0.29): (a) power plotted against wind speed. (b) Power plotted against velocity ratio. (c) Power coefficient plotted against wind speed. (d) Power coefficient plotted against velocity ratio. (e) Rotational speed plotted against wind speed. (f) Rotational speed plotted against velocity ratio. (g) Cut-in and cut-off wind speeds.
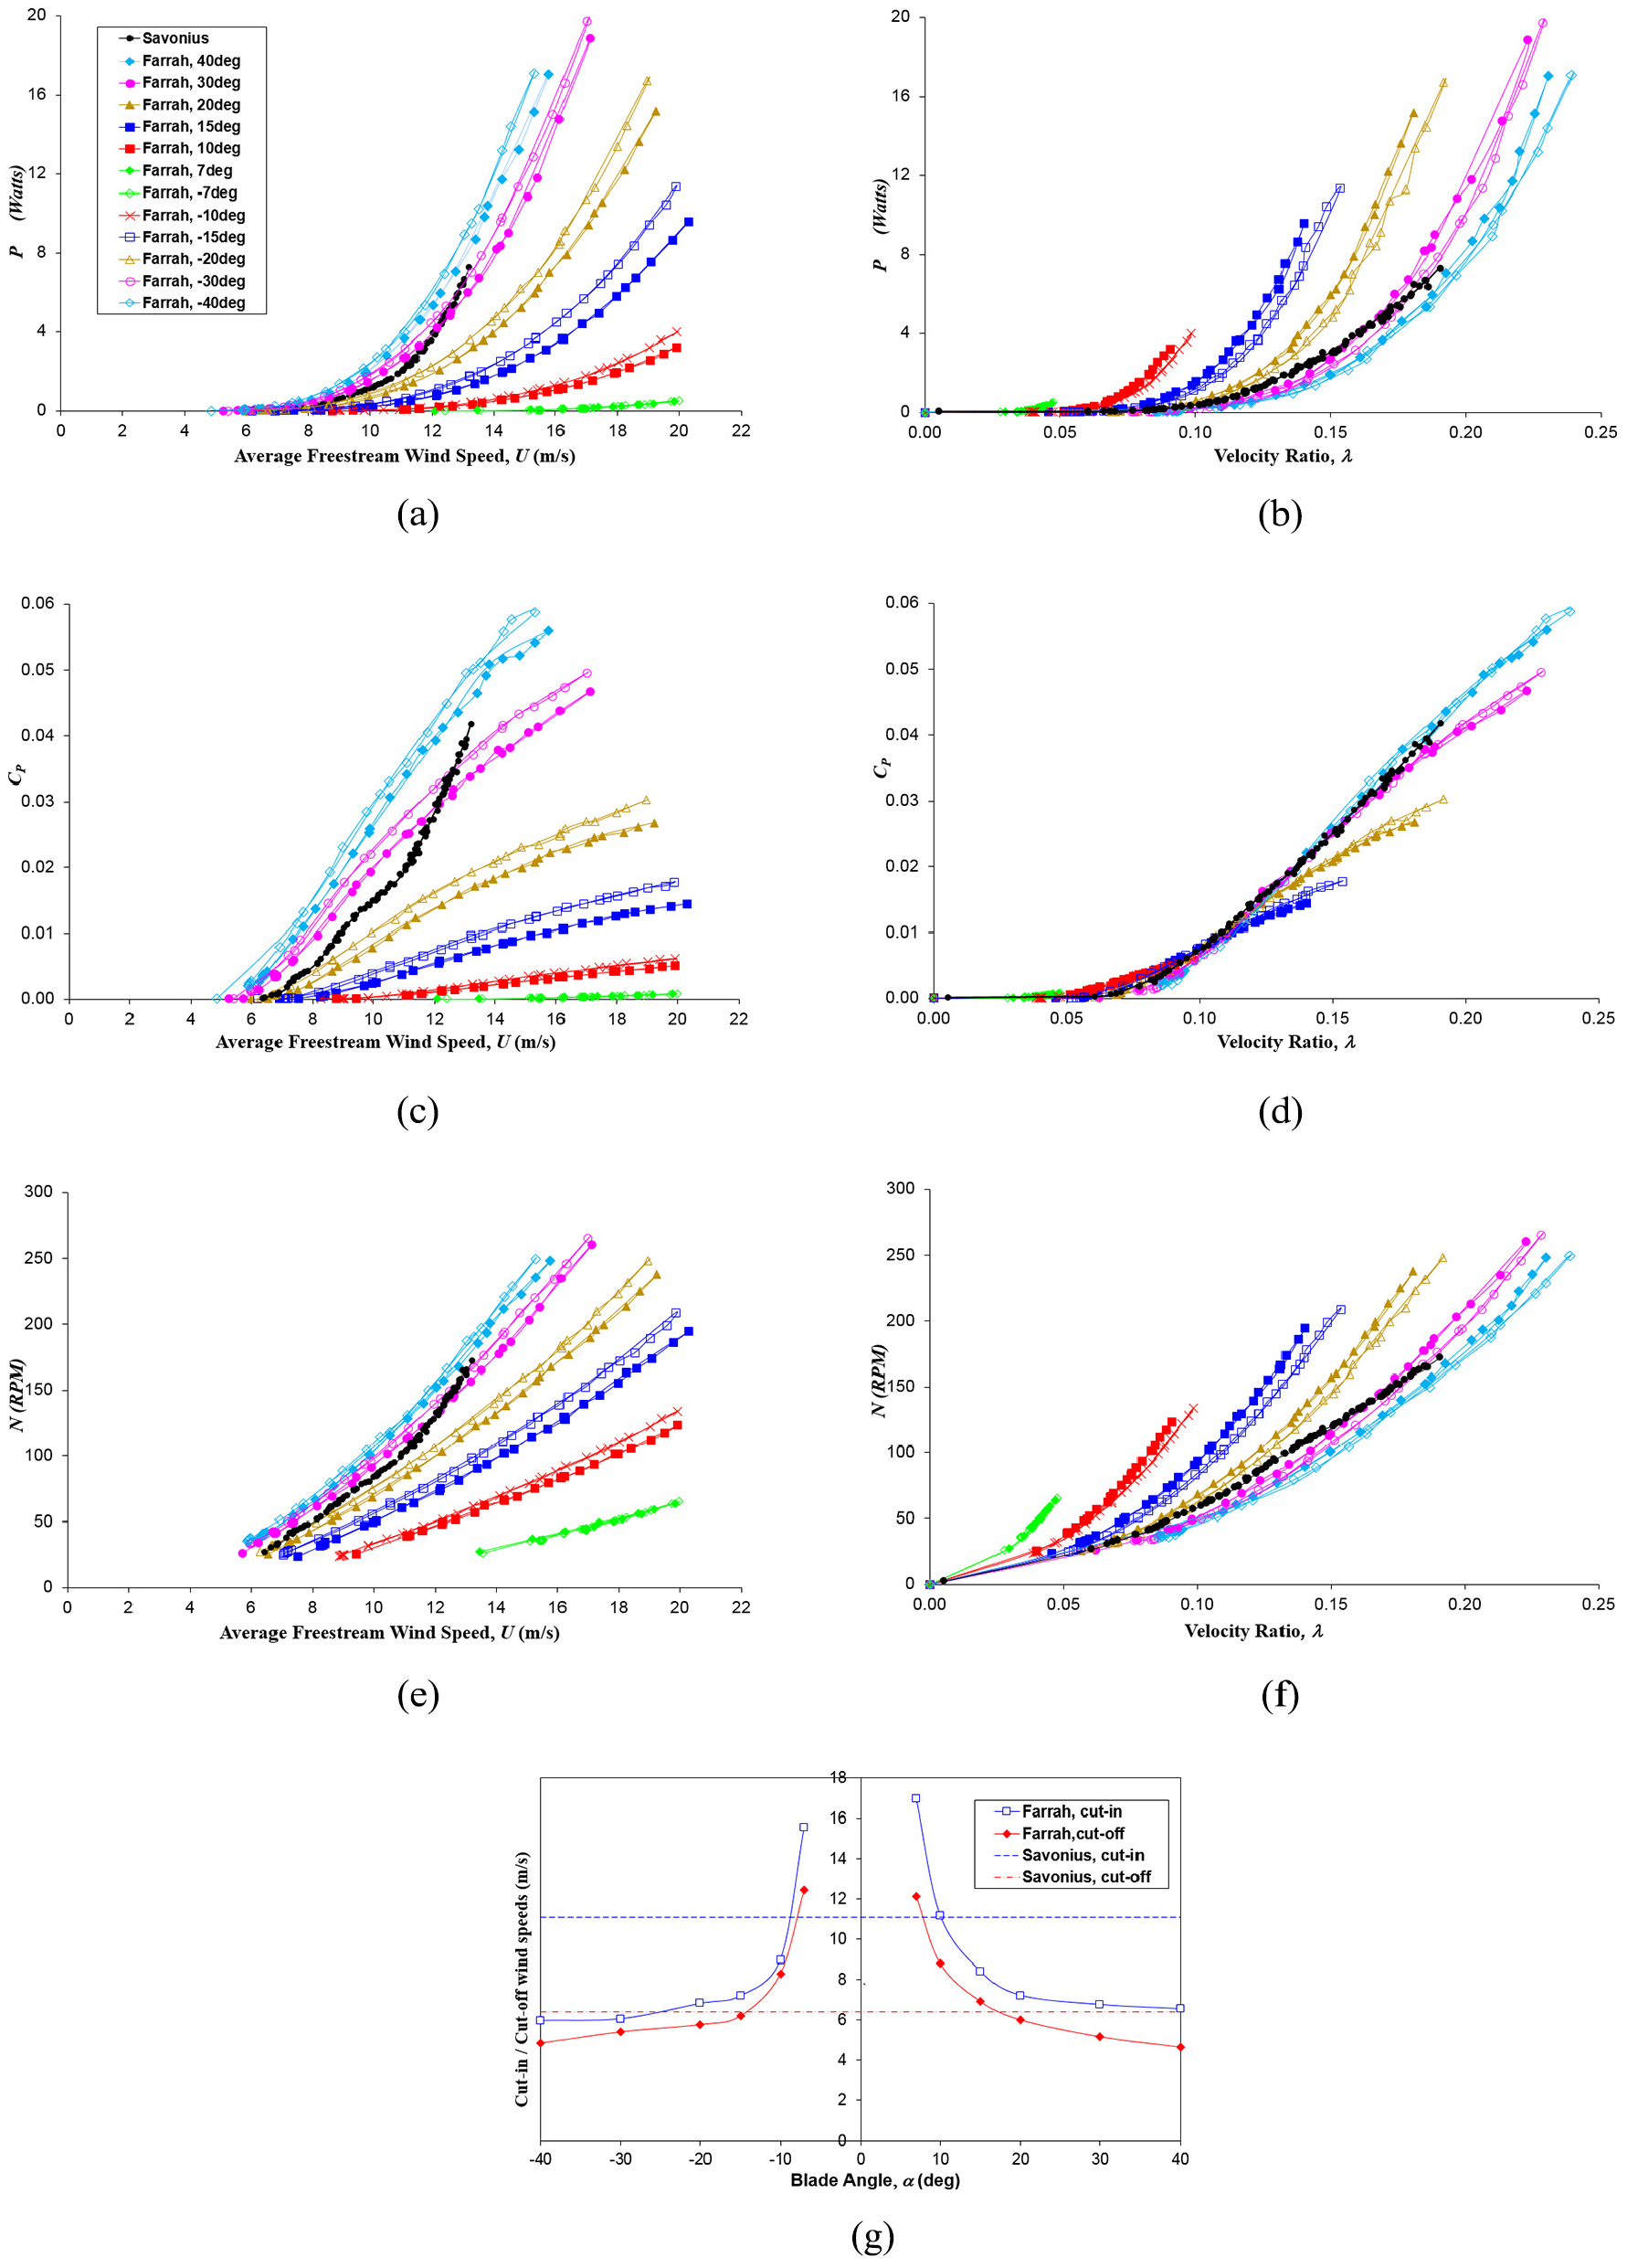
Performance comparison for the Savonius turbine and the Farrah turbine with large inner cylinder (dt/dr = 0.39): (a) power plotted against wind speed. (b) Power plotted against velocity ratio. (c) Power coefficient plotted against wind speed. (d) Power coefficient plotted against velocity ratio. (e) Rotational speed plotted against wind speed. (f) Rotational speed plotted against velocity ratio. (g) Cut-in and cut-off wind speeds.
The effect of blade pitch setting and inner cylinder size on Farrah turbine performance
Figure 11 presents, for each blade pitch setting, the variation of the turbine power coefficient with average wind speed for the three inner cylinder configurations. With no inner cylinder the positive blade setting case is seen to give a higher CP than the corresponding negative blade setting for a given wind speed. When the smaller inner cylinder is fitted, the positive pitch angle setting also gives the highest CP value for a given average wind speed. However, the opposite appears to be true when the larger inner cylinder is installed, in which case the negative pitch angle case gives the highest CP output for a given average wind speed. This configuration, as shown in Figure 7(b), sees the blade leading edge angled inwards towards, and closest to, the inner cylinder surface.
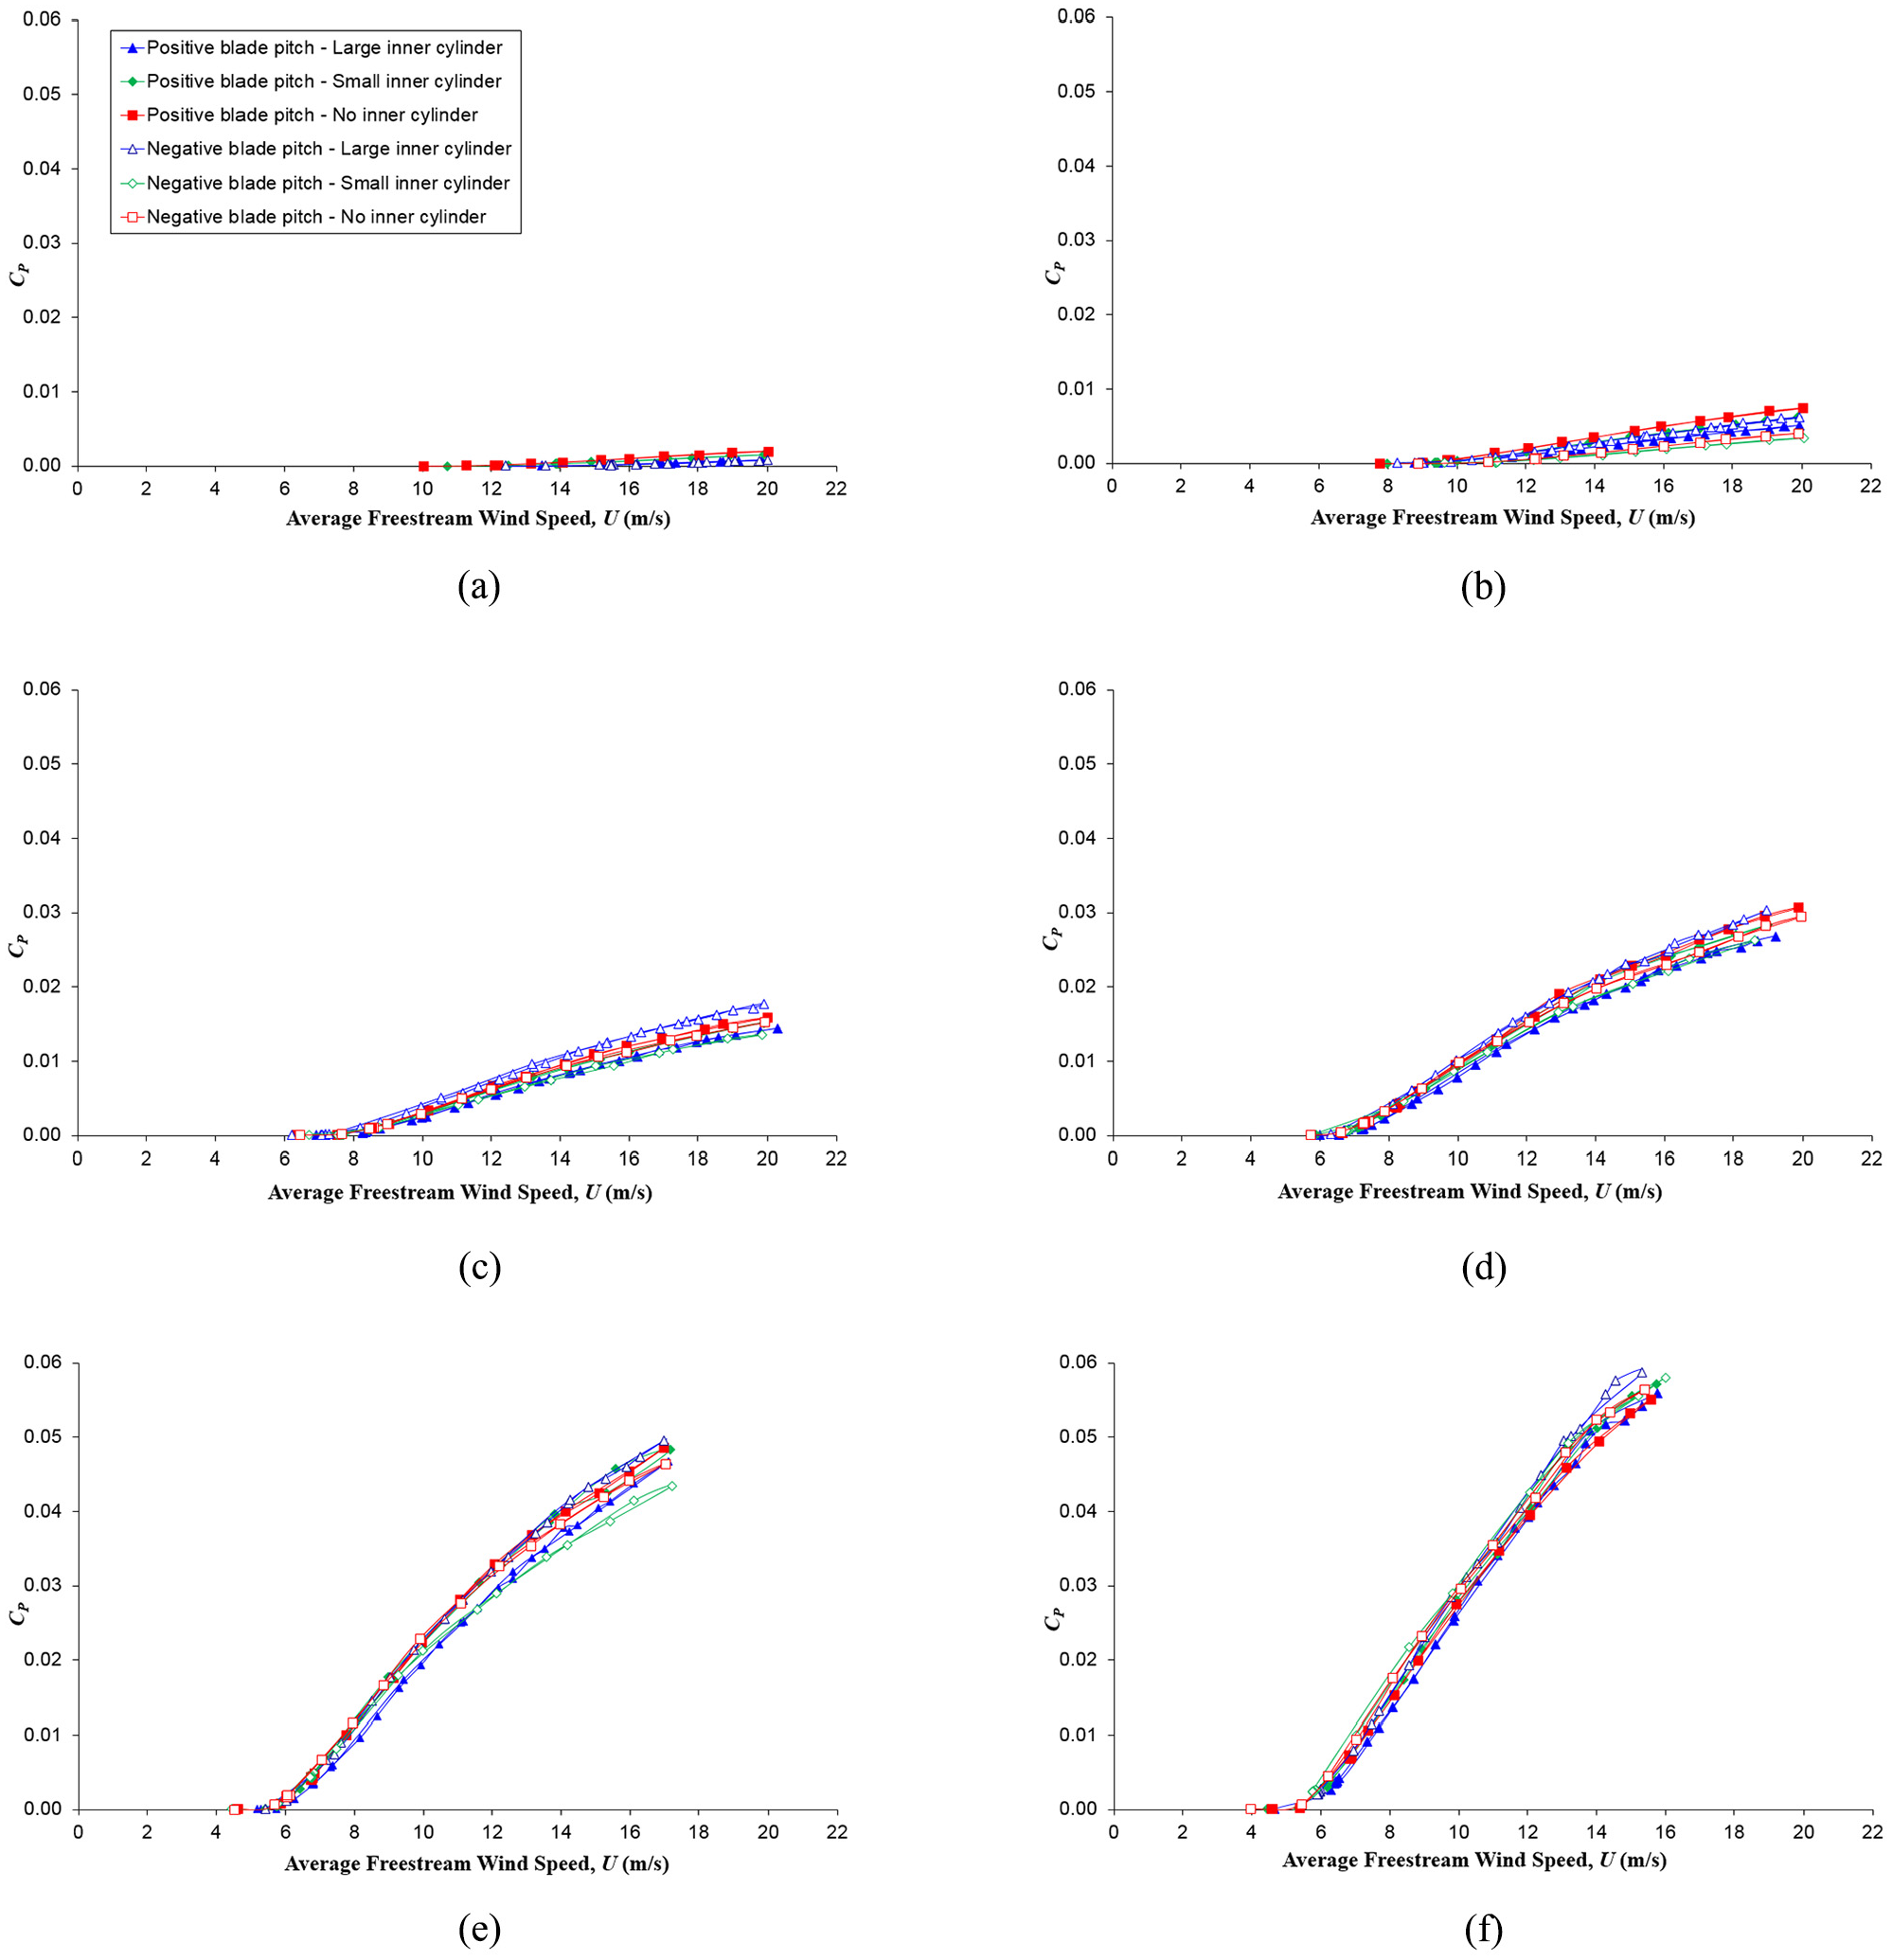
Effect of inner cylinder size on power coefficient variation with wind speed at a given blade angle setting: (a) α=± 7°, (b) α=± 10°, (c) α=± 15°, (d) α=± 20°, (e) α=± 30° and (f) α=± 40°.
When plotting the power coefficient against velocity ratio, as presented in Figure 12, the data are seen to collapse onto a common curve for each blade setting angle with almost no sensitivity to whether or not an inner cylinder is present, or its size, or whether the blade is pitched at the negative or positive setting.
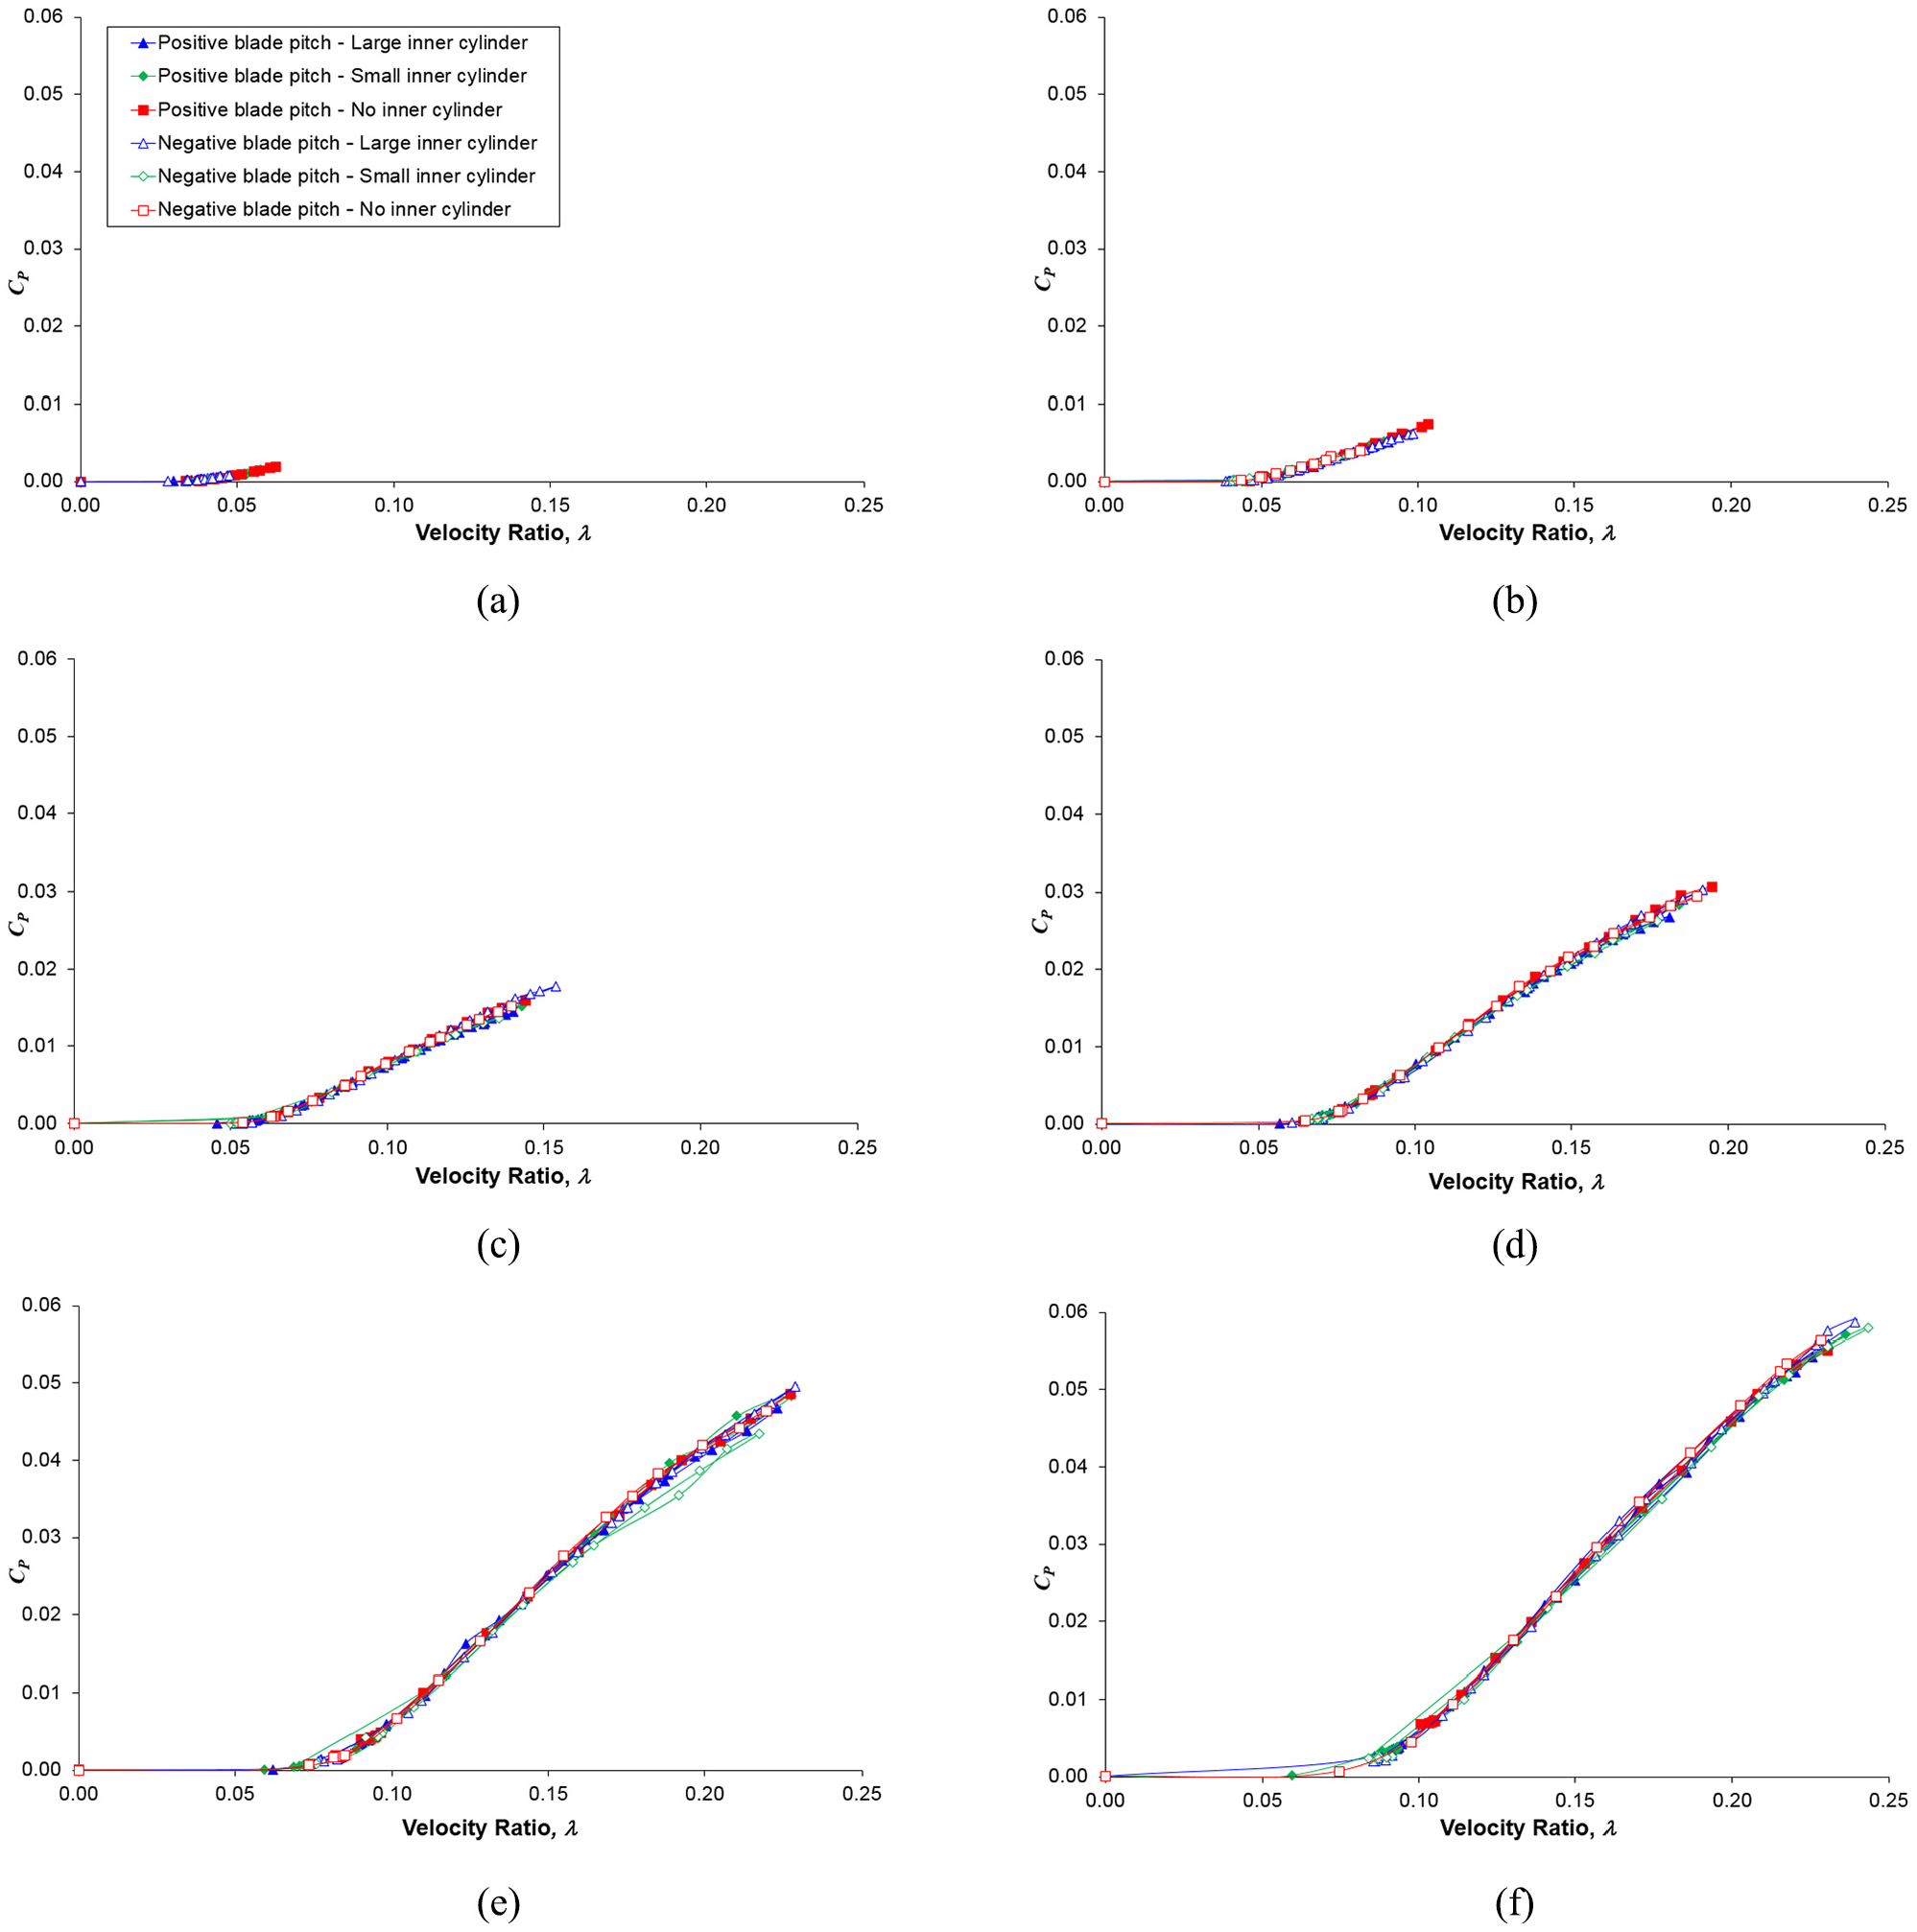
Effect of inner cylinder size on power coefficient variation with velocity ratio at a given blade angle setting: (a) α=±7°, (b) α=± 10°, (c) α=± 15°, (d) α=± 20°, (e) α=± 30° and (f) α=± 40°.
In summary, the performance of the Farrah design VAWT is only on a par with that of a similar scaled two-bladed Bach-type Savonius turbine when its blades are set to 40° pitch. Further enhancements in power output could potentially be gained by the use of differential blade pitch setting with the blades on the retreating side set at different angles to those on the advancing side, perhaps with a sine profile, and it is suggested that an unsteady Navier–Stokes CFD study would be capable of assessing this concept.
Conclusion
The conclusions derived from this study are as follows:
For the tip speed ratios (velocity ratios) that have been investigated in this study, it has been shown that the Farrah VAWT design can only marginally outperform a corresponding two-bladed Bach-type Savonius turbine, and then, only when the blades are set to 40° pitch angle.
The presence of a small inner cylinder, which rotates with the turbine, does not enhance its performance due to the fact that it is immersed in an extensive column of relatively static air.
Footnotes
Appendix 1
Declaration of conflicting interests
The author(s) declared no potential conflicts of interest with respect to the research, authorship and/or publication of this article.
Funding
The author(s) disclosed receipt of the following financial support for the research, authorship and/or publication of this article: This work was partly funded by Renewables East (Contract No: 45/2009 FAM 388). The authors acknowledge the contributions to this work of Bob Preston and his team and Barry Prince and Tim Barnes.