
Abstract
Current global commitments to reduce the emissions of greenhouse gases encourage national targets for renewable generation. Due to its small land mass, offshore wind could help Bahrain to fulfil its obligations. However, no scoping study has been carried out yet. The methodology presented here addresses this research need. It employs analytical hierarchy process and pairwise comparison methods in a geographical information systems environment. Publicly available land use, infrastructure and transport data are used to exclude areas unsuitable for development due to physical and safety constraints. Meteorological and oceanic opportunities are ranked and then competing uses are analyzed to deliver optimal sites for wind farms. The potential annual wind energy yield is calculated by dividing the sum of optimal areas by a suitable turbine footprint to deliver maximum turbine number. In total, 10 favourable wind farm areas were identified in Bahrain’s territorial waters, representing about 4% of the total maritime area, and capable of supplying 2.68 TWh/year of wind energy or almost 10% of the Kingdom’s annual electricity consumption. Detailed maps of potential sites for offshore wind construction are provided in the article, giving an initial plan for installation in these locations.
Keywords
Introduction
The Kingdom of Bahrain, in common with the majority of the countries of the Gulf Cooperation Council, has committed to the Paris Agreement of the United Nations Framework Convention on Climate Change 2015. This requires initiatives to reduce the emissions of greenhouse gases. To fulfil its obligation, Bahrain has set a target for generating 5% of capacity from renewable sources by 2025 and 10% by 2035, as detailed in the National Renewable Energy Action Plan (NREAP 2019). Currently, only 0.15% of generation is renewable energy (RE), including 0.03% of wind (International Renewable Energy Agency (IRENA), 2018). The proposed RE mix comprises solar, wind and energy-from-waste technologies. Offshore RE development could constitute a significant proportion of this mix. Bahrain has limited land mass (location shown in Figure 1) of 765 km2 or half the size of Greater London, so offshore wind installation would enable large-scale generation. The territorial waters of Bahrain are comparatively extensive and shallow, with 0.01 km2 of sea area per person. This is the same as its neighbour, Saudi Arabia, which is almost 3000 times larger. Theoretically, then, offshore wind appears to be a feasible option for installation of renewables. This research investigates in detail whether in fact this is the case.
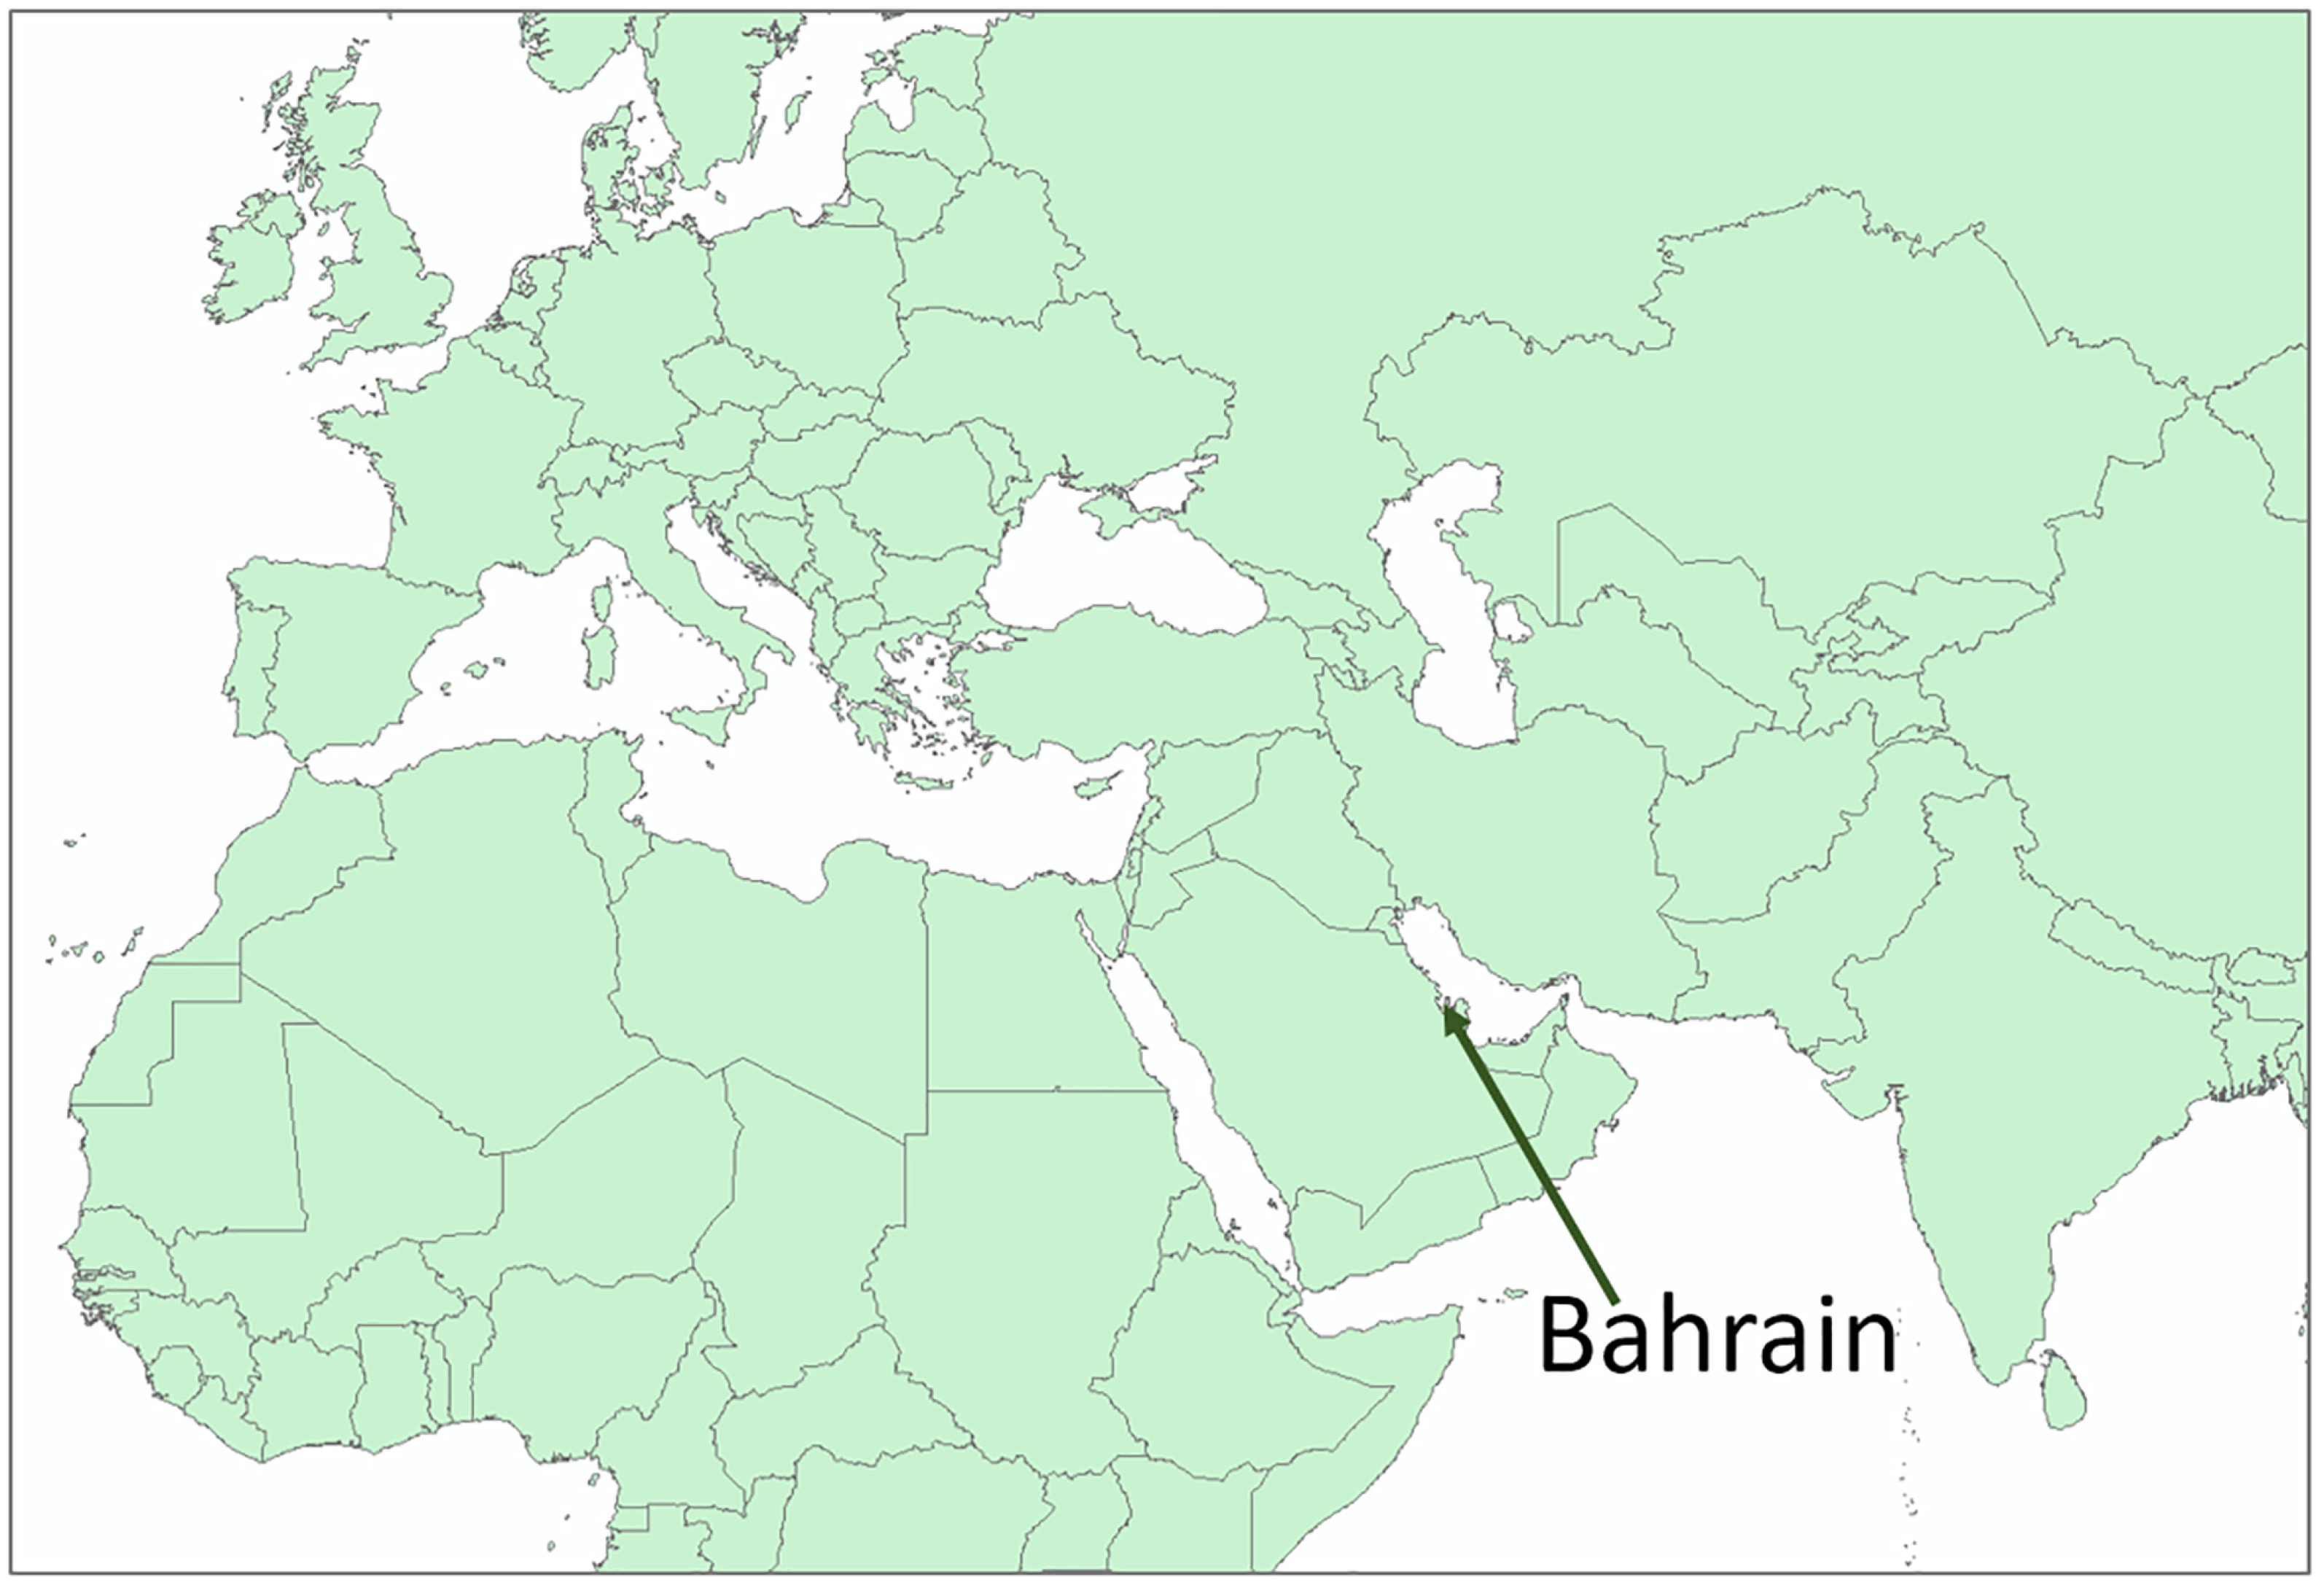
Map illustrating the location of Bahrain.
Methods for assessing the potential of both onshore and offshore sites for wind farms have been the subject of research for many years in various countries. Comprehensive reviews are provided by Panagiotidou et al. (2016); Vagiona and Kamilakis (2018) and Mahdy and Bahaj (2018). Geographical information systems (GIS), which organize, store and link together real-world data through its spatial reference, have been extensively employed for this purpose. Their simple application is described in a well-cited UK example of land-based wind site targeting by Serwan and Parry (2001). Here the authors first consider all criteria (map layers) to be equally important, before grading them by apparent significance. More complex methods of applying multi-criteria decision-making (MCDM) methods based on GIS to wind farm prospecting are tested by Villacreses et al. (2017) in continental Ecuador. The researchers initially used the analytic hierarchy process (AHP), which involves pairwise comparisons of ranked criteria, to rank input criteria. Four MCDM methods were then appraised; little difference was found between the MCDM methods.
Focusing on offshore wind studies only, the AHP approach to multi-criteria selection has been applied in the Baltic (Chaouachi et al., 2017) and China (Wu et al., 2018). The most important techno-economic cost-related factors (wind speed, distance and water depth), have been modelled using genetic algorithms, taking the United Kingdom as a case study (Mytilinou and Kolios, 2017). However, it has been found that failure to incorporate other factors, such as conservation, overinflates the number of feasible sites (Kim et al., 2016). The biological effects of offshore wind are investigated by Bray et al. (2016). This group of researchers locate potential offshore wind farm ‘hotspots’ in the Mediterranean by applying the following thresholds: 20–50 m depth and an annual wind speed > 5 m/s at a turbine height of 80 m. Sensitive species which may be impacted are then identified. AHP and GIS are used by Loukogeorgaki et al. (2018) to hierarchically score a dozen factors for hybrid wind and wave systems in the Greek marine area, one factor being environmental impact.
The current article differs from previous research in that it applies accurate local data to the problem of offshore wind farm site targeting in Bahrain. Bahaj et al. (2020) investigated offshore wind energy for the whole Arabian Peninsula, using Egyptian wind data and geoschematic undersea cable locations. Further afield, Mahdy et al. (2017) assessed potential wind farm sites on Saudi Arabia’s Red Sea coast using a simple Boolean Mask technique (map layers suitable/unsuitable for installation) in a GIS environment. Moving to the Persian Gulf, Fetanat and Khorasaninejad (2015) employ fuzzy set theory to create matrices for six criteria (depth, height, environment, proximity to land, economic implications, wind resource and acceptance) to aid decision-making in coastal Iran. A slightly different set of criteria are analyzed by Saleous et al. (2016) in United Arab Emirates (UAE) waters. These are studied in a two-stage process. First, areas where wind farm construction is impossible are combined into a single map layer (marine protected areas, oil extraction platforms and oil pipelines). Then remaining areas are ranked according to average wind speed and water depth.
In this article, a sequence of methods for identifying the optimal sea areas for offshore wind deployment in Bahrain’s territorial waters is planned and executed. The methodology developed is adapted from Vagiona and Kamilakis (2018) and Mahdy and Bahaj (2018). That is, GIS and AHP are allied in a five-stage process for offshore wind farm site targeting. The stages comprise data collection, exclusion, ranking, analysis of competing seabed uses and calculation of offshore wind power potential. The exclusion stage identifies all constrained areas where wind farms cannot be built based on nautical hazards, shipping, environmental and development criteria. These areas are combined using GIS and excluded from subsequent processing. The ranking stage considers additional factors, that is, average wind speed, water depth and distance from Bahrain Island. These map layers offer varying degrees of opportunity for wind farm installation, depending on their value. They are standardized, weighted through AHP pairwise comparison and overlaid in a GIS grid so that the relative importance of each layer is reflected. In the competing uses phase, the collective excluded constraints are subtracted from the weighted amalgamated factors. Next, rival uses of the nearshore seabed are investigated: sand extraction, oil drilling, fishing and conservation. Finally, in the last (fifth) stage, the number of wind turbines in available space is estimated, followed by nameplate capacity and potential output. It should be emphasized that this is the first time the offshore wind potential for Bahrain has been studied and the first time AHP and GIS together have been applied to RE siting issues in Bahrain.
The rest of this article is organized as follows: section ‘Methods’ describes the several stages in the method. It details the types and sources of data used and its standardization, as well as the software employed. Next, exclusion of constraint data layers is described, followed by a comprehensive explanation of weighting of possibilities using the AHP. After a study of the needs of other seabed users, a final suitability map layer is produced. Calculations of the offshore wind energy potential based on this suitability layer are described. Section ‘Results’ illustrates the results obtained, that is, the size of each potential wind farm, number of turbines, nameplate capacity and total possible annual wind energy yield. Section ‘Sensitivity analysis’ conducts a sensitivity analysis. Section ‘Discussion’ makes international comparisons of the previously derived wind potential in Bahrain. It investigates the extent to which it could contribute to the Kingdom’s energy needs and explores how future turbine developments may change the situation. Finally, section ‘Conclusion’ draws conclusions, restates the research objectives and evaluates the success of this study.
Methods
The sequence of methods expounded in this journal article is summarized in Figure 2. The succeeding subsections of this article itemize each stage of the methodology.
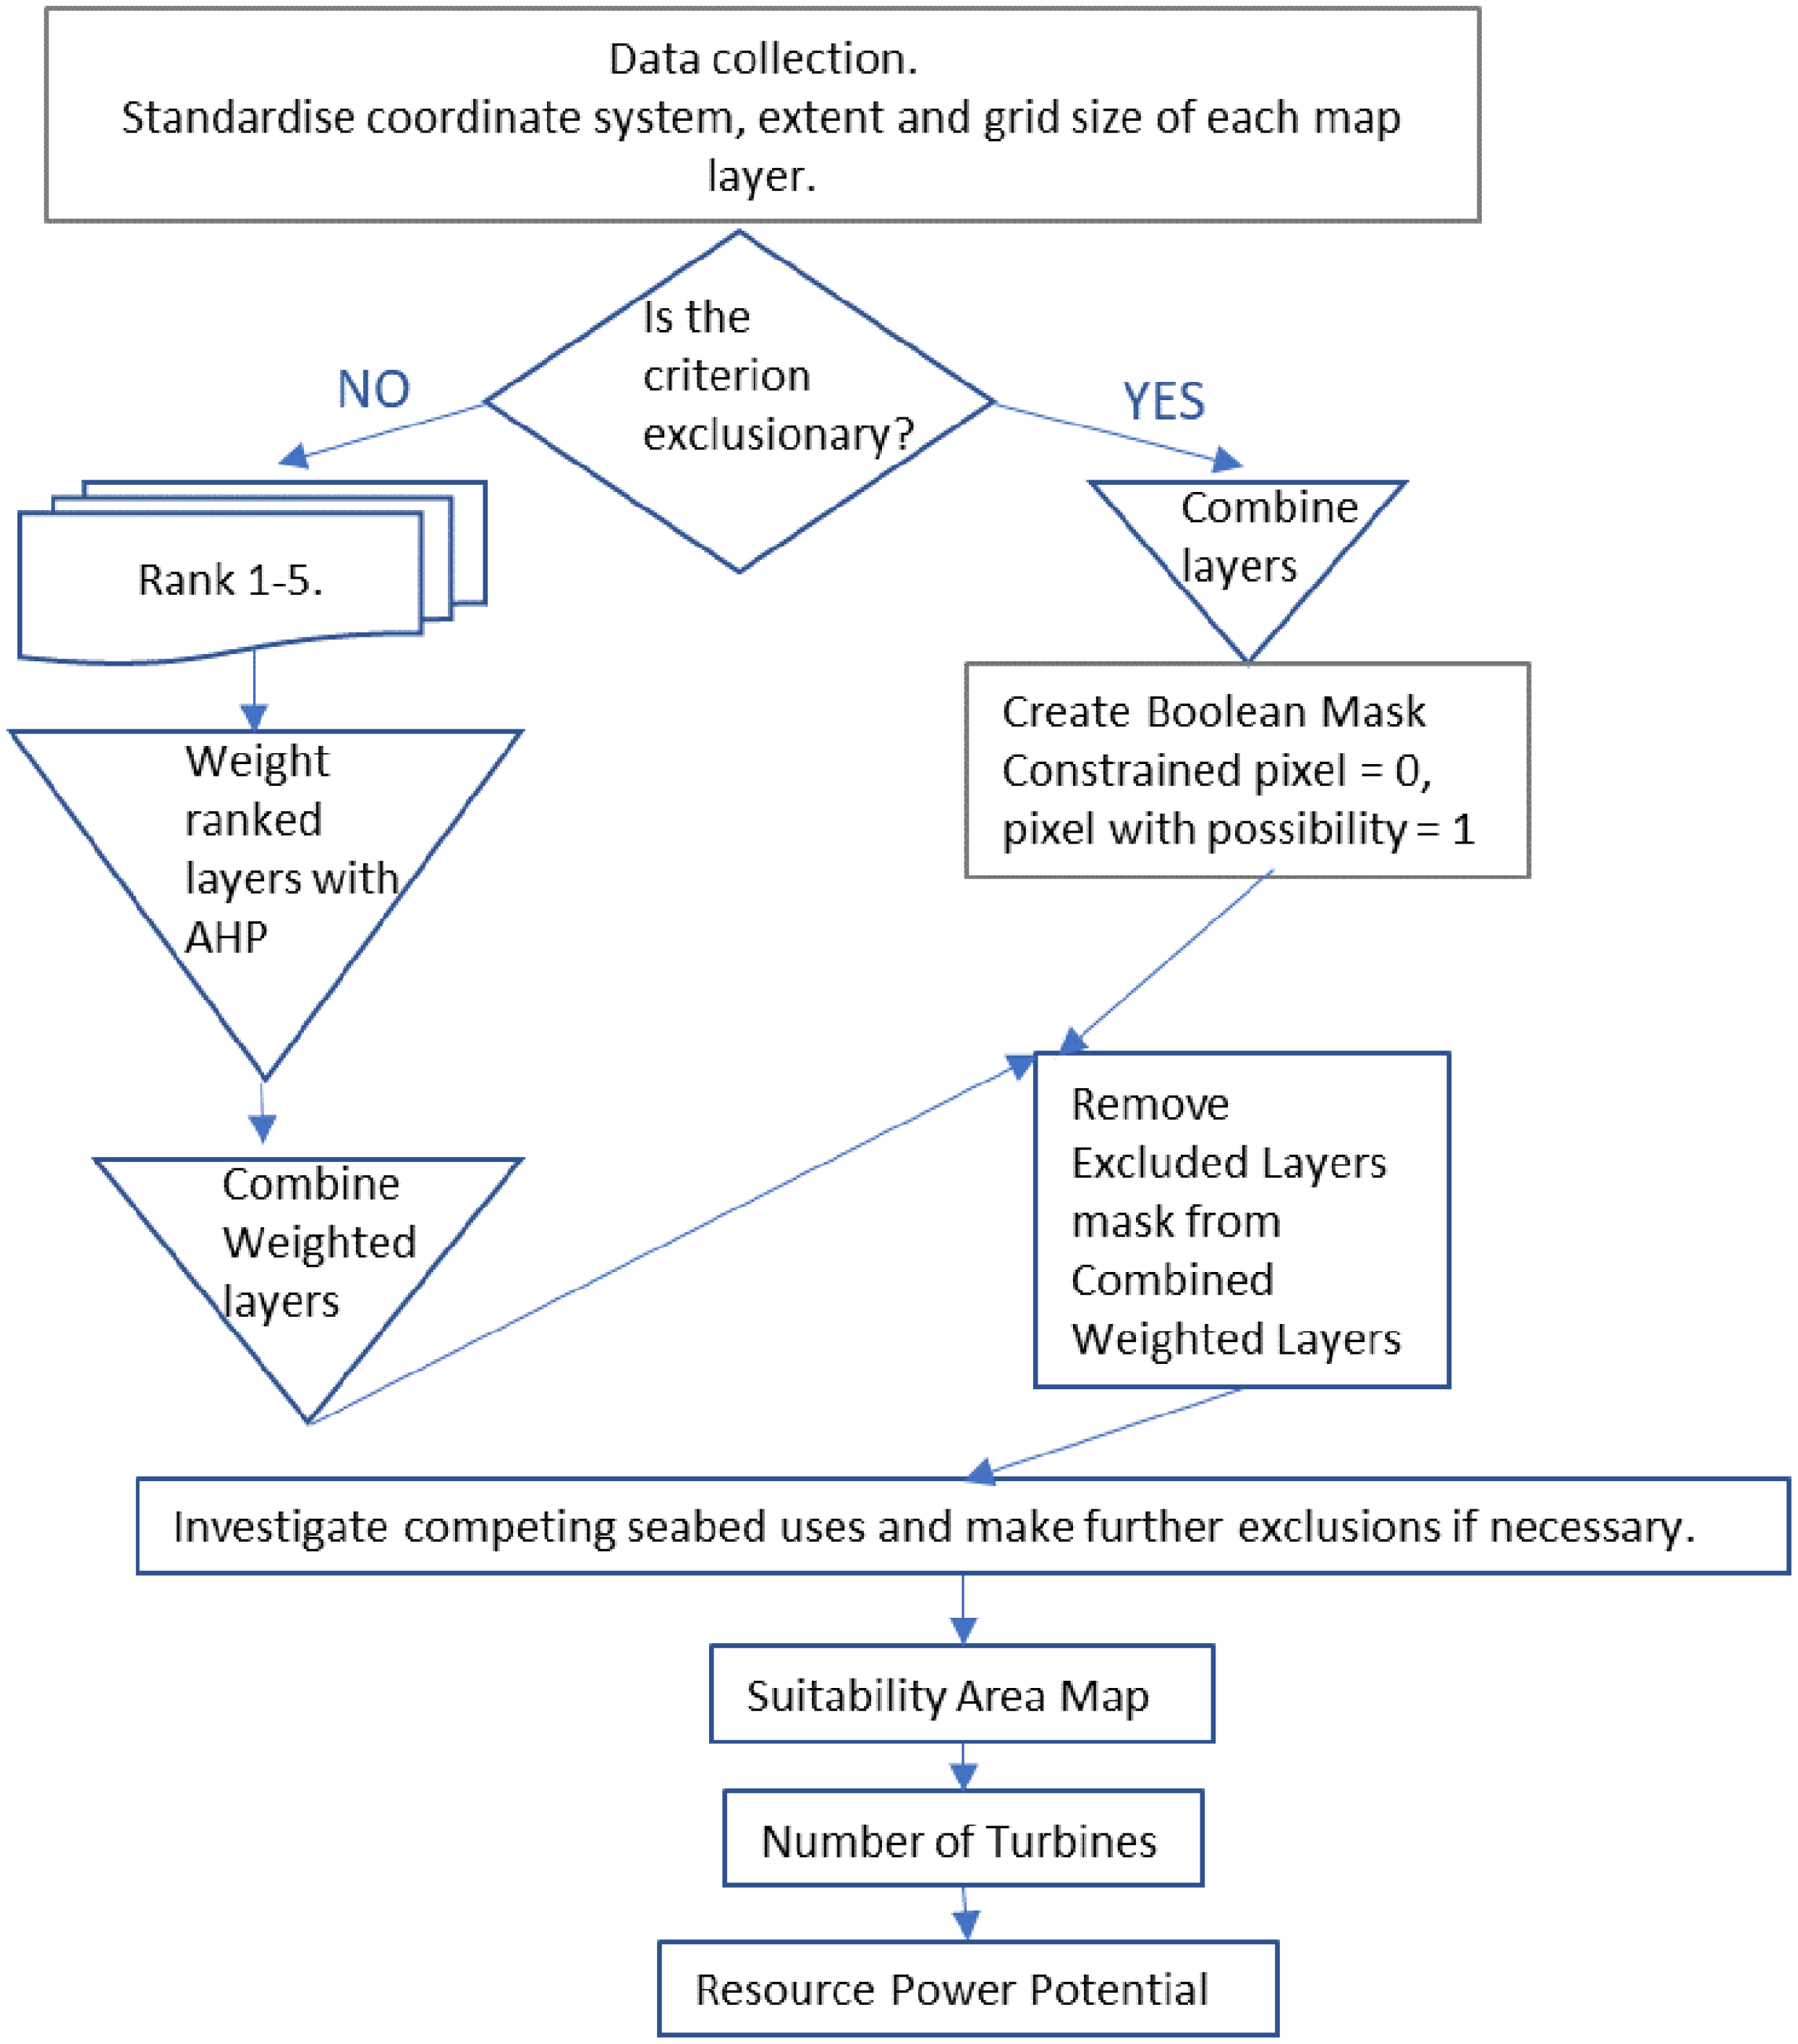
Diagrammatic representation of the sequence of methods.
Data collection stage
An extensive literature review was undertaken, including the above cited references. From the criteria utilized by these authors, a number of constraints (exclusions) were identified as relevant to offshore wind site selection in Bahrain. These are land and planned land fill, transport (roads, airport exclusion zones and shipping), submarine cables and pipelines, and protected areas (conservation, military and restricted). Land reclamation is not normally a consideration for offshore generation. However, Bahrain’s small size means that there is a shortage of land for residential needs and this is being created by coastal infill. The factors (opportunities) are wind speed, sea depth (bathymetry) and distance from Bahrain Island. Further details of the various constraints and factors used in this methodology, as well as reasons for their selection and ranges of values chosen, are given in subsections ‘Exclusion stage’ and ‘Ranking stage’.
Exclusion stage
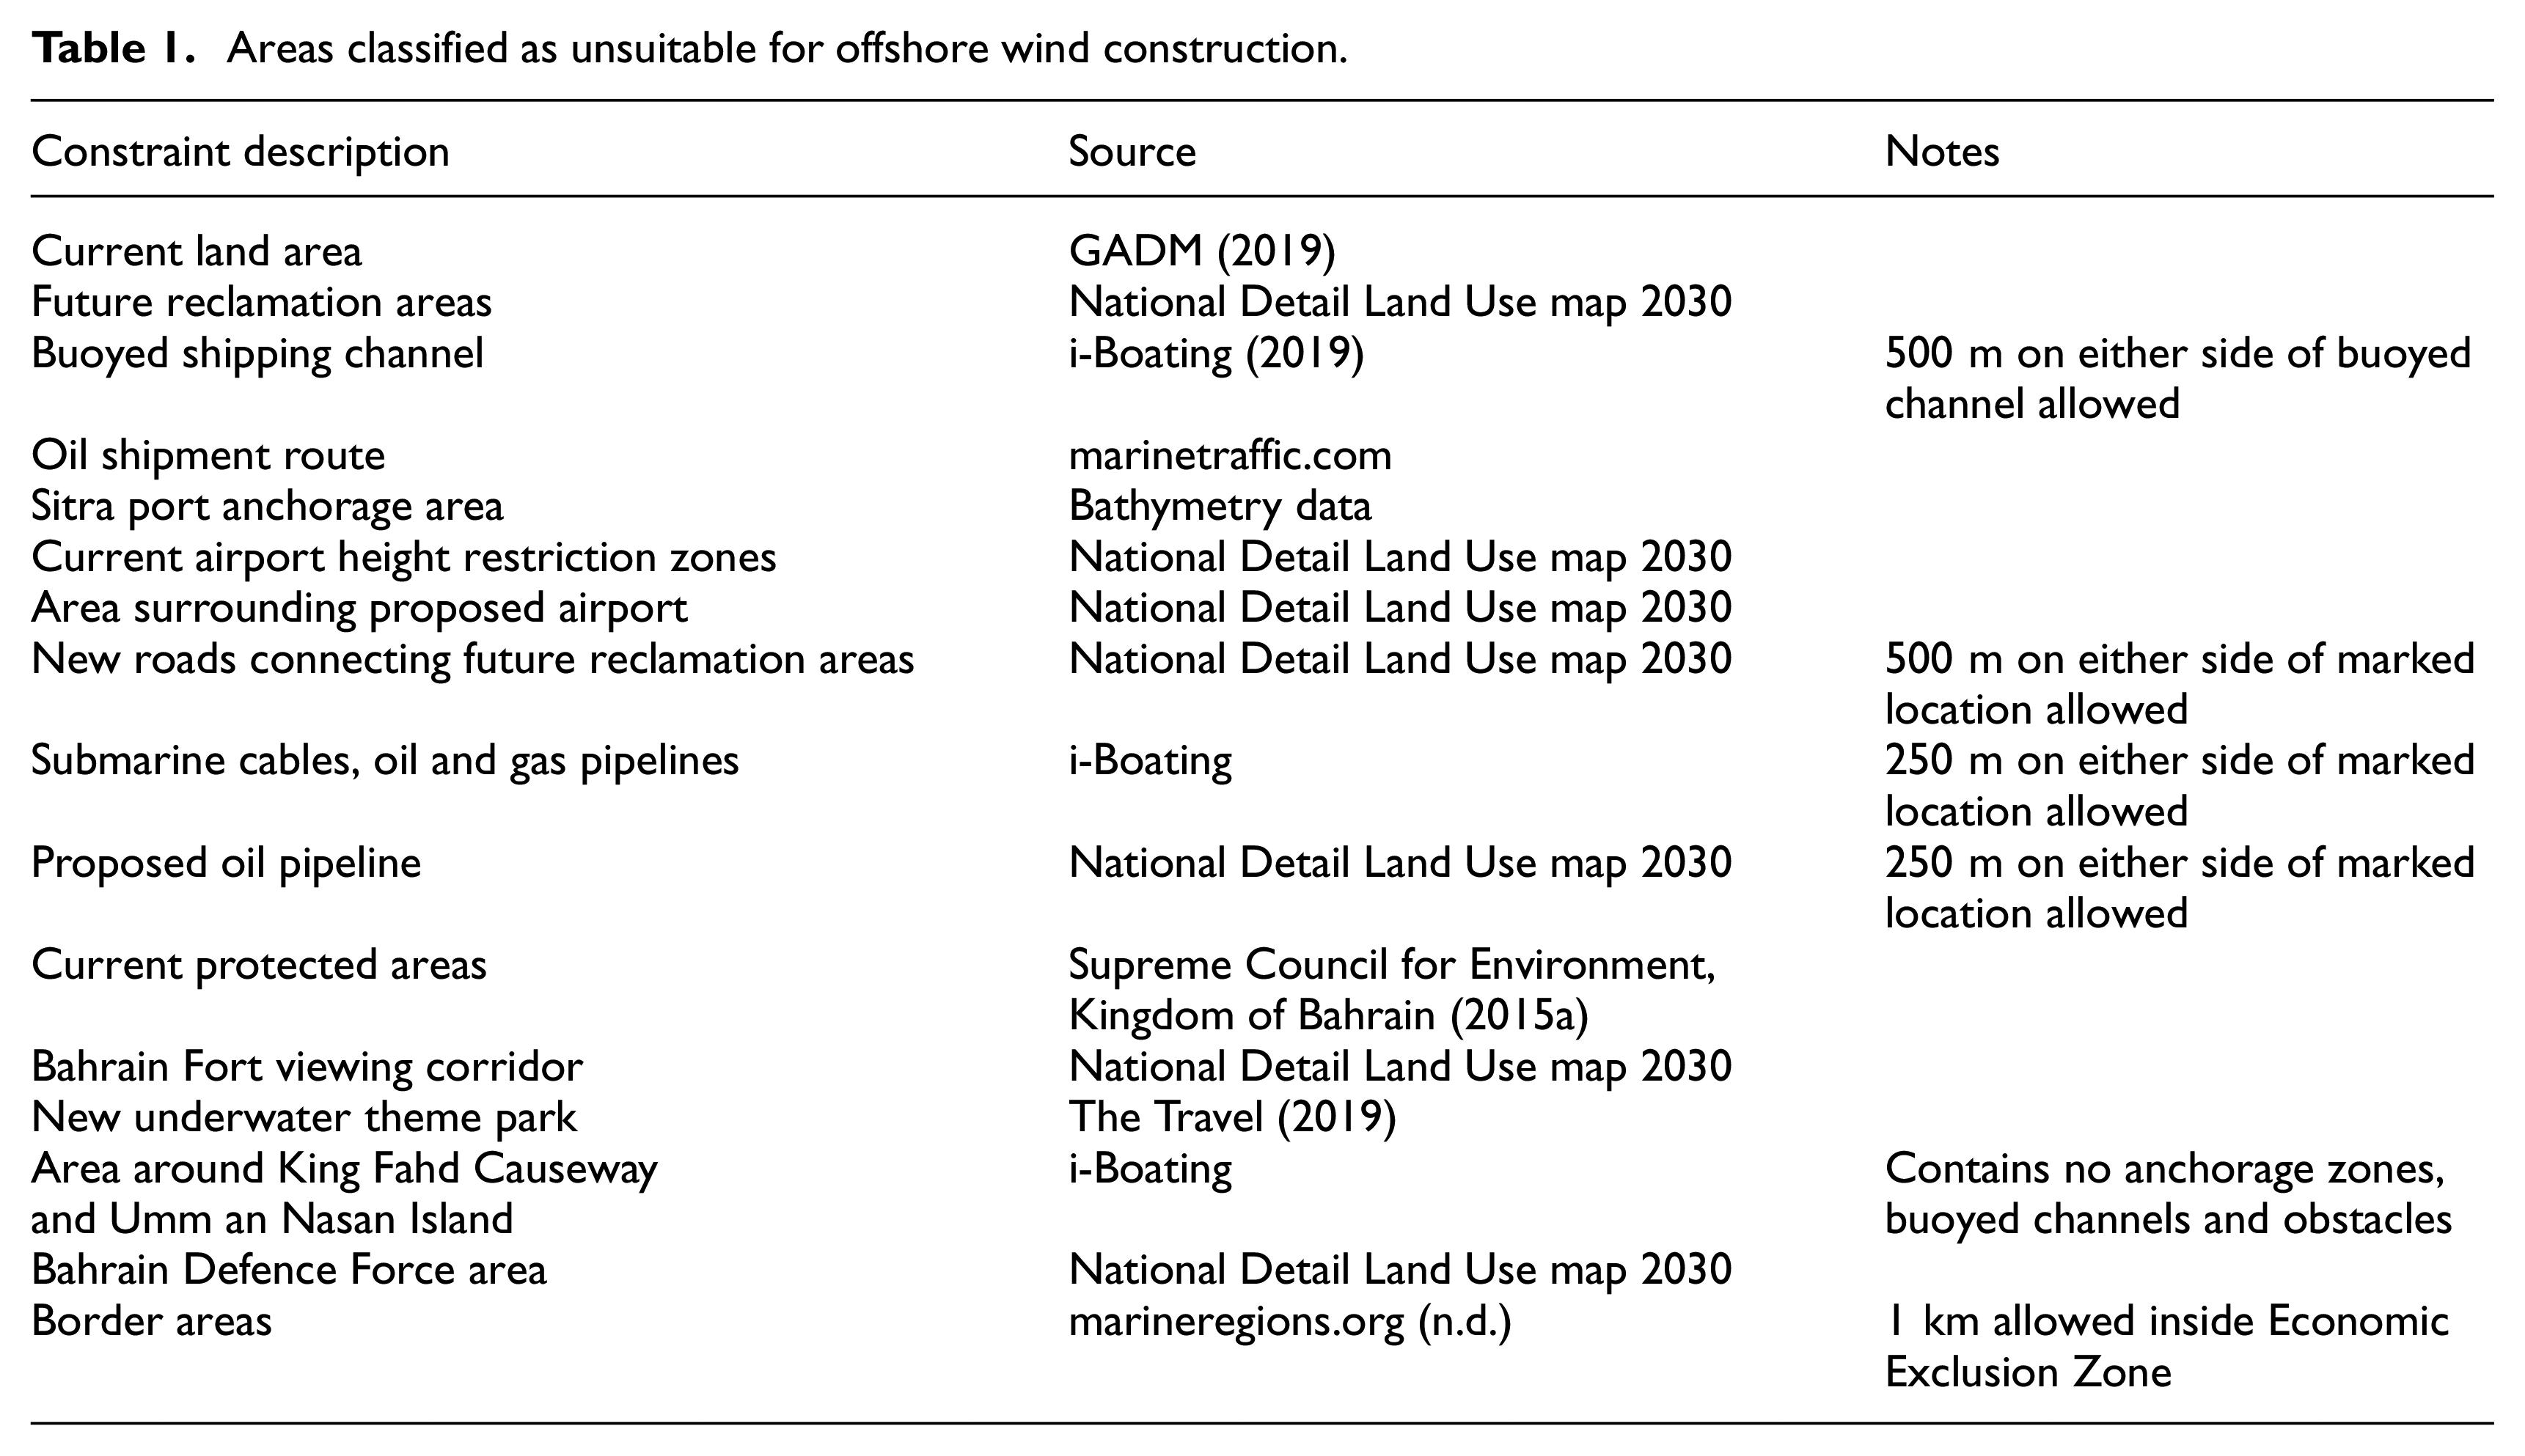
The process of locating prospective areas for siting wind farms was begun by excluding areas deemed incompatible for offshore wind. That is, the spatial footprint of unsuitable areas was blocked out of the map to avoid considering impractical locations for installation. The areas classified as unsuitable for offshore wind construction are summarized in Table 1 and detailed below.
Current land area. This was obtained from GADM (2019). Since 1965, Bahrain has had an ongoing programme of reclaiming land from the sea. Approximately 70 km2 of land for housing, commerce and industry has been added to the country, the majority of it in the last 10 years (Al-Nabi, 2012). Therefore, the country outline was updated with recent satellite imagery from World Imagery (2019) to capture its most up-to-date extent.
Future reclamation areas. These are part of Bahrain’s Economic Vision 2030 (Our Vision 2030, n.d.). Planned land fill was digitized from the National Detail Land Use map 2030 (Bahrain Ministry of Works, Municipalities Affairs and Urban Planning, 2016).
Buoyed shipping channel. The seas around Bahrain are very busy, so an area around the main dredged shipping channel only was excluded from wind turbine installation, otherwise little sea space would remain for wind development. Vessels may be rerouted where wind farms are constructed, as in the case of the Thames Estuary (Rawson and Rogers (2015). The location of the channel was obtained from nautical charts (i-Boating, 2019). A buffer zone of 500 m on either side of the buoyed channel, to comply with the United Nations Convention on the Law of the Sea and to avoid navigation interference (Erftemeijer and Boot, 2004), was added to the channel exclusion area.
Oil shipment route. This was recognized and digitized from the marine density maps of marinetraffic.com, a website which provides information about the real-time geographical position of ships from radio signals.
Sitra port anchorage area. Highlighted by a researcher carrying out site selection for artificial reefs in Bahrain (Erftemeijer and Boot, 2004), this was noticed as an artificially deep (due to being dredged) region in bathymetry data (Becker et al., 2009). This feature was captured by digital tracing.
Current airport height restriction zones. These were digitized from the National Detail Land Use map 2030 (Bahrain Ministry of Works, Municipalities Affairs and Urban Planning, 2016).
Area surrounding proposed airport again were digitized from the National Detail Land Use map 2030.
New roads connecting future reclamation areas. The routes of these were copied from the National Detail Land Use map 2030. An exclusion zone of 500 m either size was added, as used by the artificial reefs researchers (Erftemeijer and Boot, 2004) for the King Fahd Causeway between Saudi Arabia and Bahrain.
Submarine cables, oil and gas pipelines. These were digitized from i-Boating. A zone of 250 m on each side of this infrastructure network was additionally excluded, the same as applied for wind site selection in UAE (Saleous et al., 2016).
Proposed oil pipeline. This was traced from the National Detail Land Use map 2030 and buffered as for the existing pipelines.
Current protected areas. Areas protected for environmental reasons (they contain fish nurseries, oyster beds, mangroves or species, including rare seabirds, flamingos, sea cows and turtles) were excluded (Supreme Council for Environment, Kingdom of Bahrain, 2015a).
Bahrain Fort viewing corridor. This historic entrance channel is obvious on the National Detail Land Use map 2030. It is a development exclusion zone, particularly as regards height (UNESCO, 2014).
Approximate location of new underwater theme park. Details of position were difficult to ascertain. It was estimated from a travel website (The Travel, 2019).
Area around King Fahd Causeway and Umm an Nasan Island. Nautical charts (i-Boating) show that this area contains no anchorage zones, buoyed and marked channels, piles, obstacles, fish traps and pipelines.
Bahrain Defence Force area, obtained from the National Detail Land Use map 2030.
Border areas. Following Erftemeijer and Boot (2004), a 1-km buffer was added to the inside of the territorial waters of Bahrain (the Economic Exclusion Zone, EEZ) to avoid any potential problems with border patrols. The EEZ GIS layer was obtained from marineregions.org (n.d.).
Areas classified as unsuitable for offshore wind construction.
A GIS database was created initially in QGIS Development Team (2015) and transferred to ArcGIS for its advanced mapping functionality (Esri, 2014). The exclusion layers are illustrated in Figure 3.
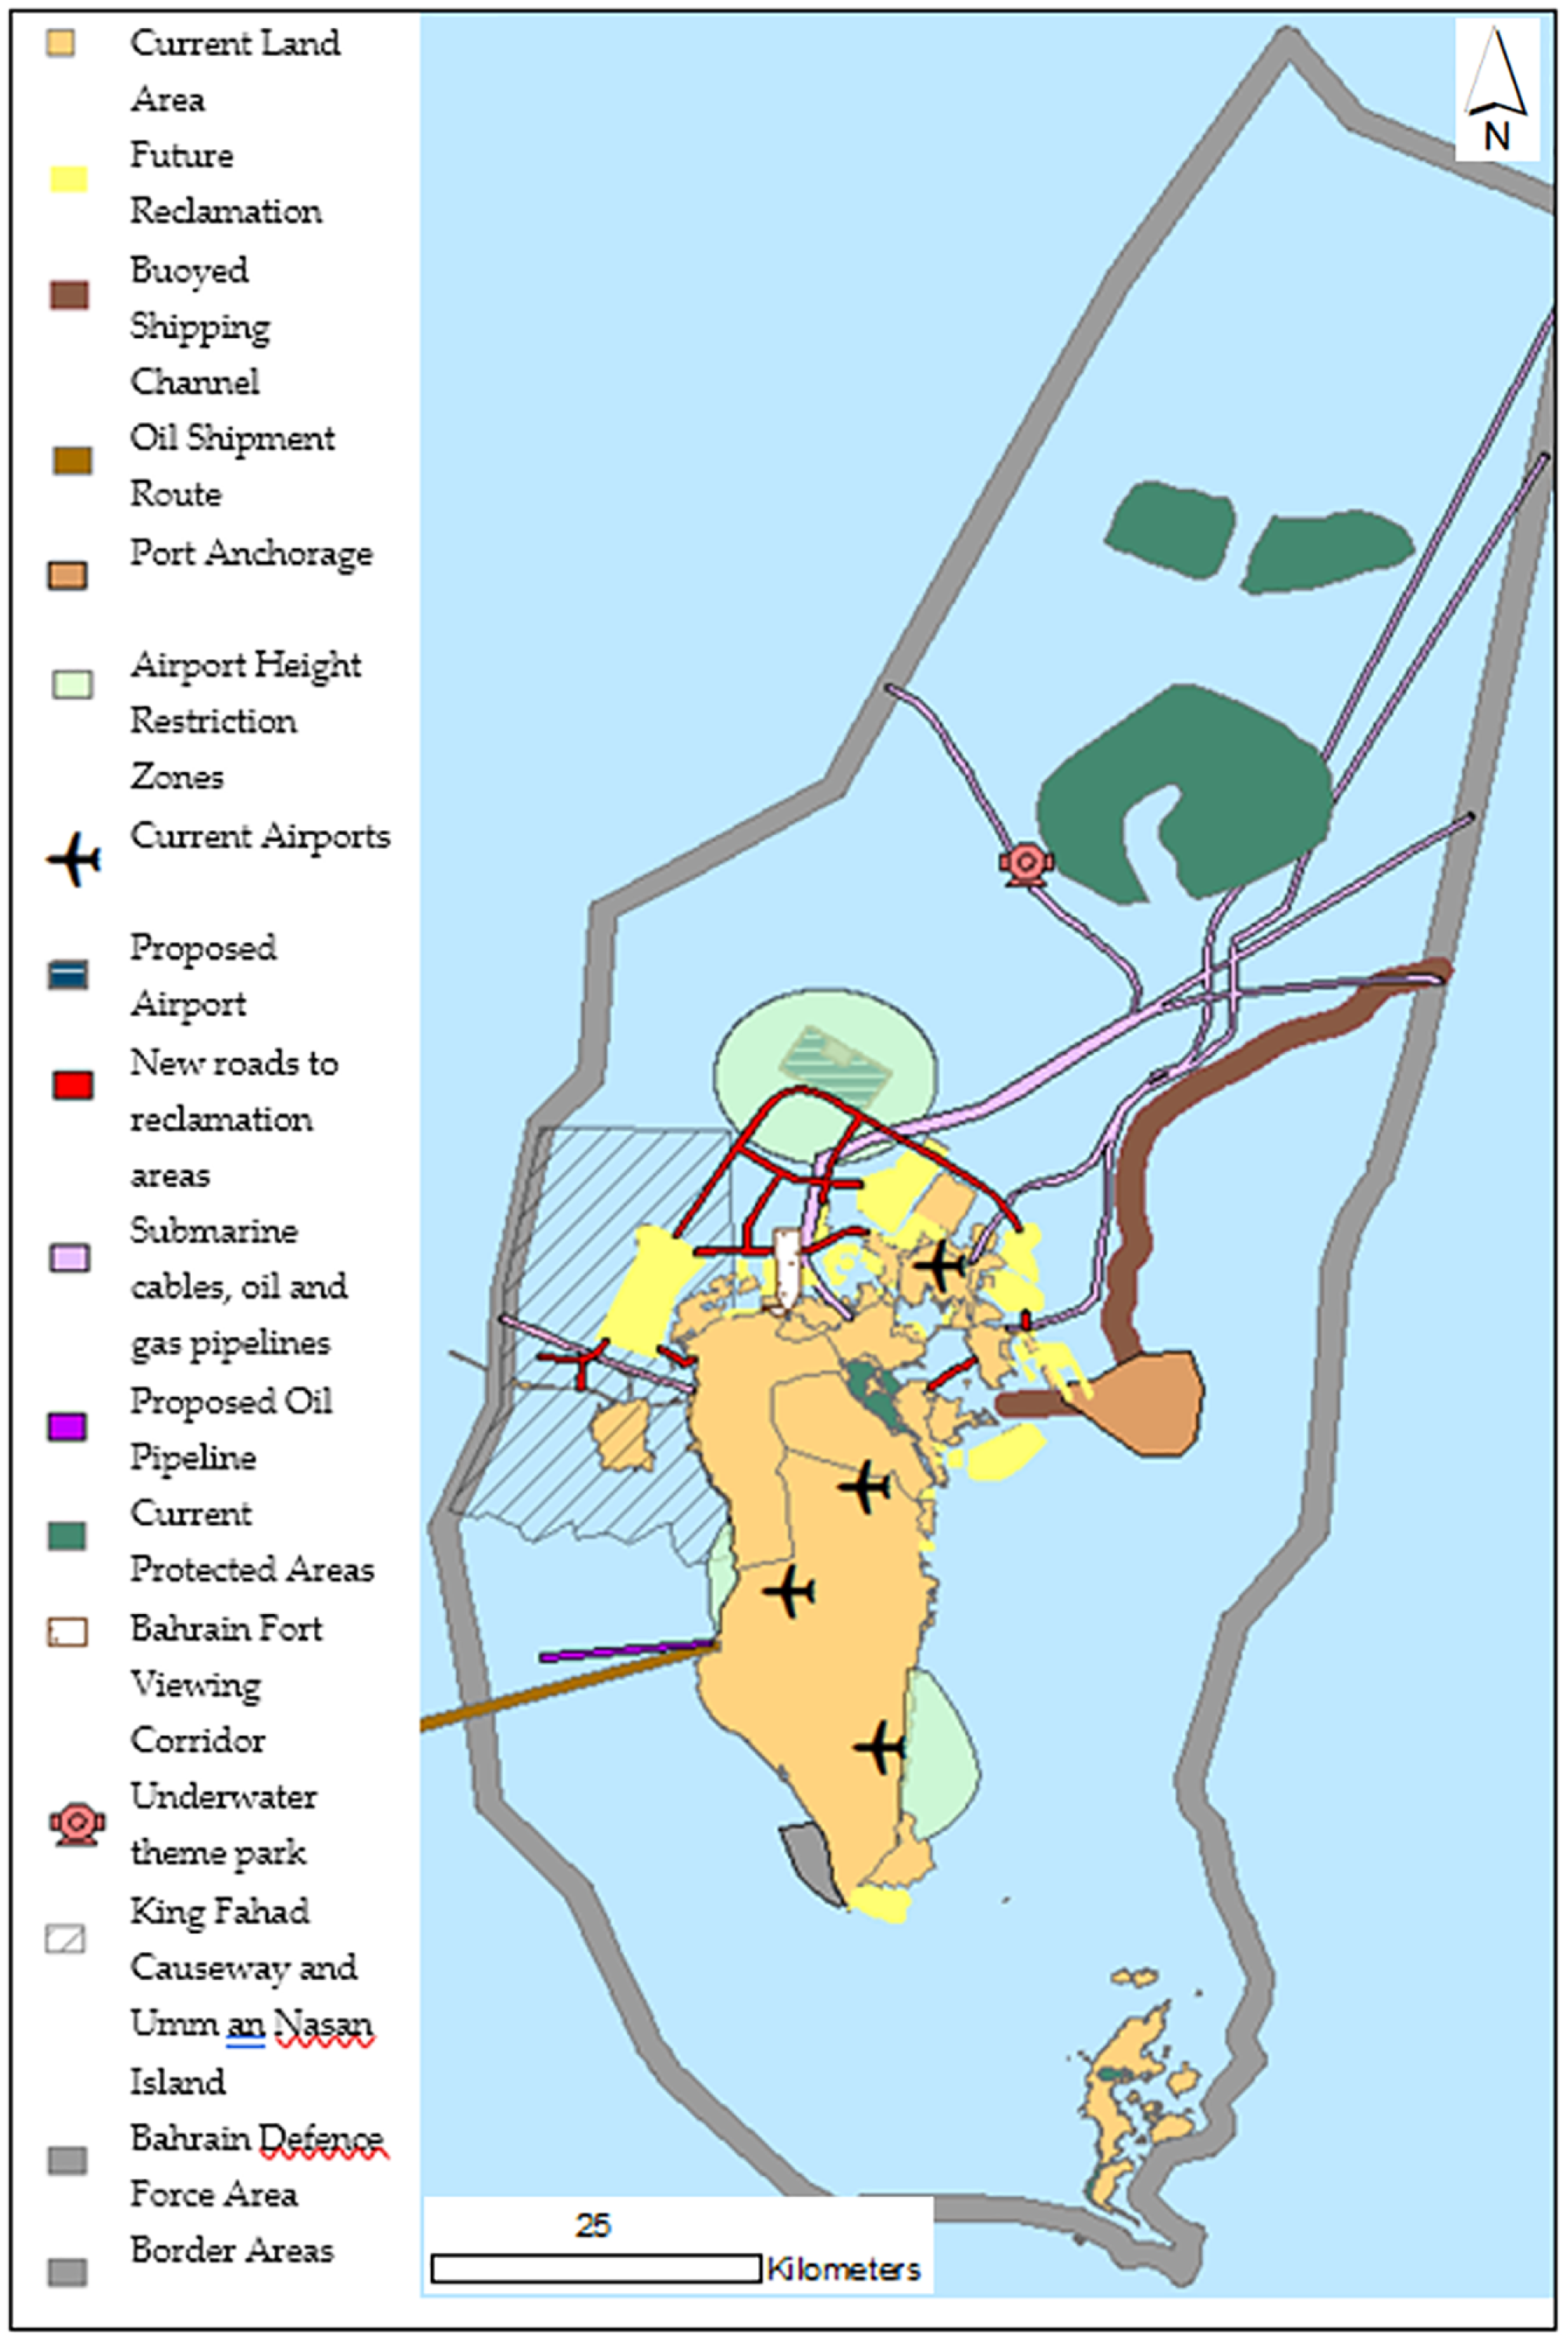
Constraints for selection of sea areas suitable for wind farm construction.
All datasets were converted from their original format (grid coordinates, pdf or GIS polygon shapefile) into GIS raster (grid) format. The map layers were standardized in geographic coordinate system, extent and spatial resolution as follows:
The well-known WGS84 coordinate system (used by the Global Positioning System (GPS)) was chosen to ensure identical features in the layers correctly coincide.
The spatial extent of all maps was limited to the Bahrain EEZ.
The raster grid square (pixel) size for all was set to 1.0 × 1.0 km which is the resolution of the bathymetry layer (Becker et al., 2009) (see section ‘Ranking stage’).
All the areas (listed above) identified as exclusions were combined into a total exclusion mask. This is in the form of a Boolean mask, where constrained pixels have value 0 and pixels where wind installation is possible have value 1. This was achieved by reclassifying each layer (0 or 1) and unifying them into a single exclusion area using ArcGIS Raster Calculator. The resultant exclusion mask covers about 60% of Bahrain’s territorial waters (Figure 7).
Ranking stage
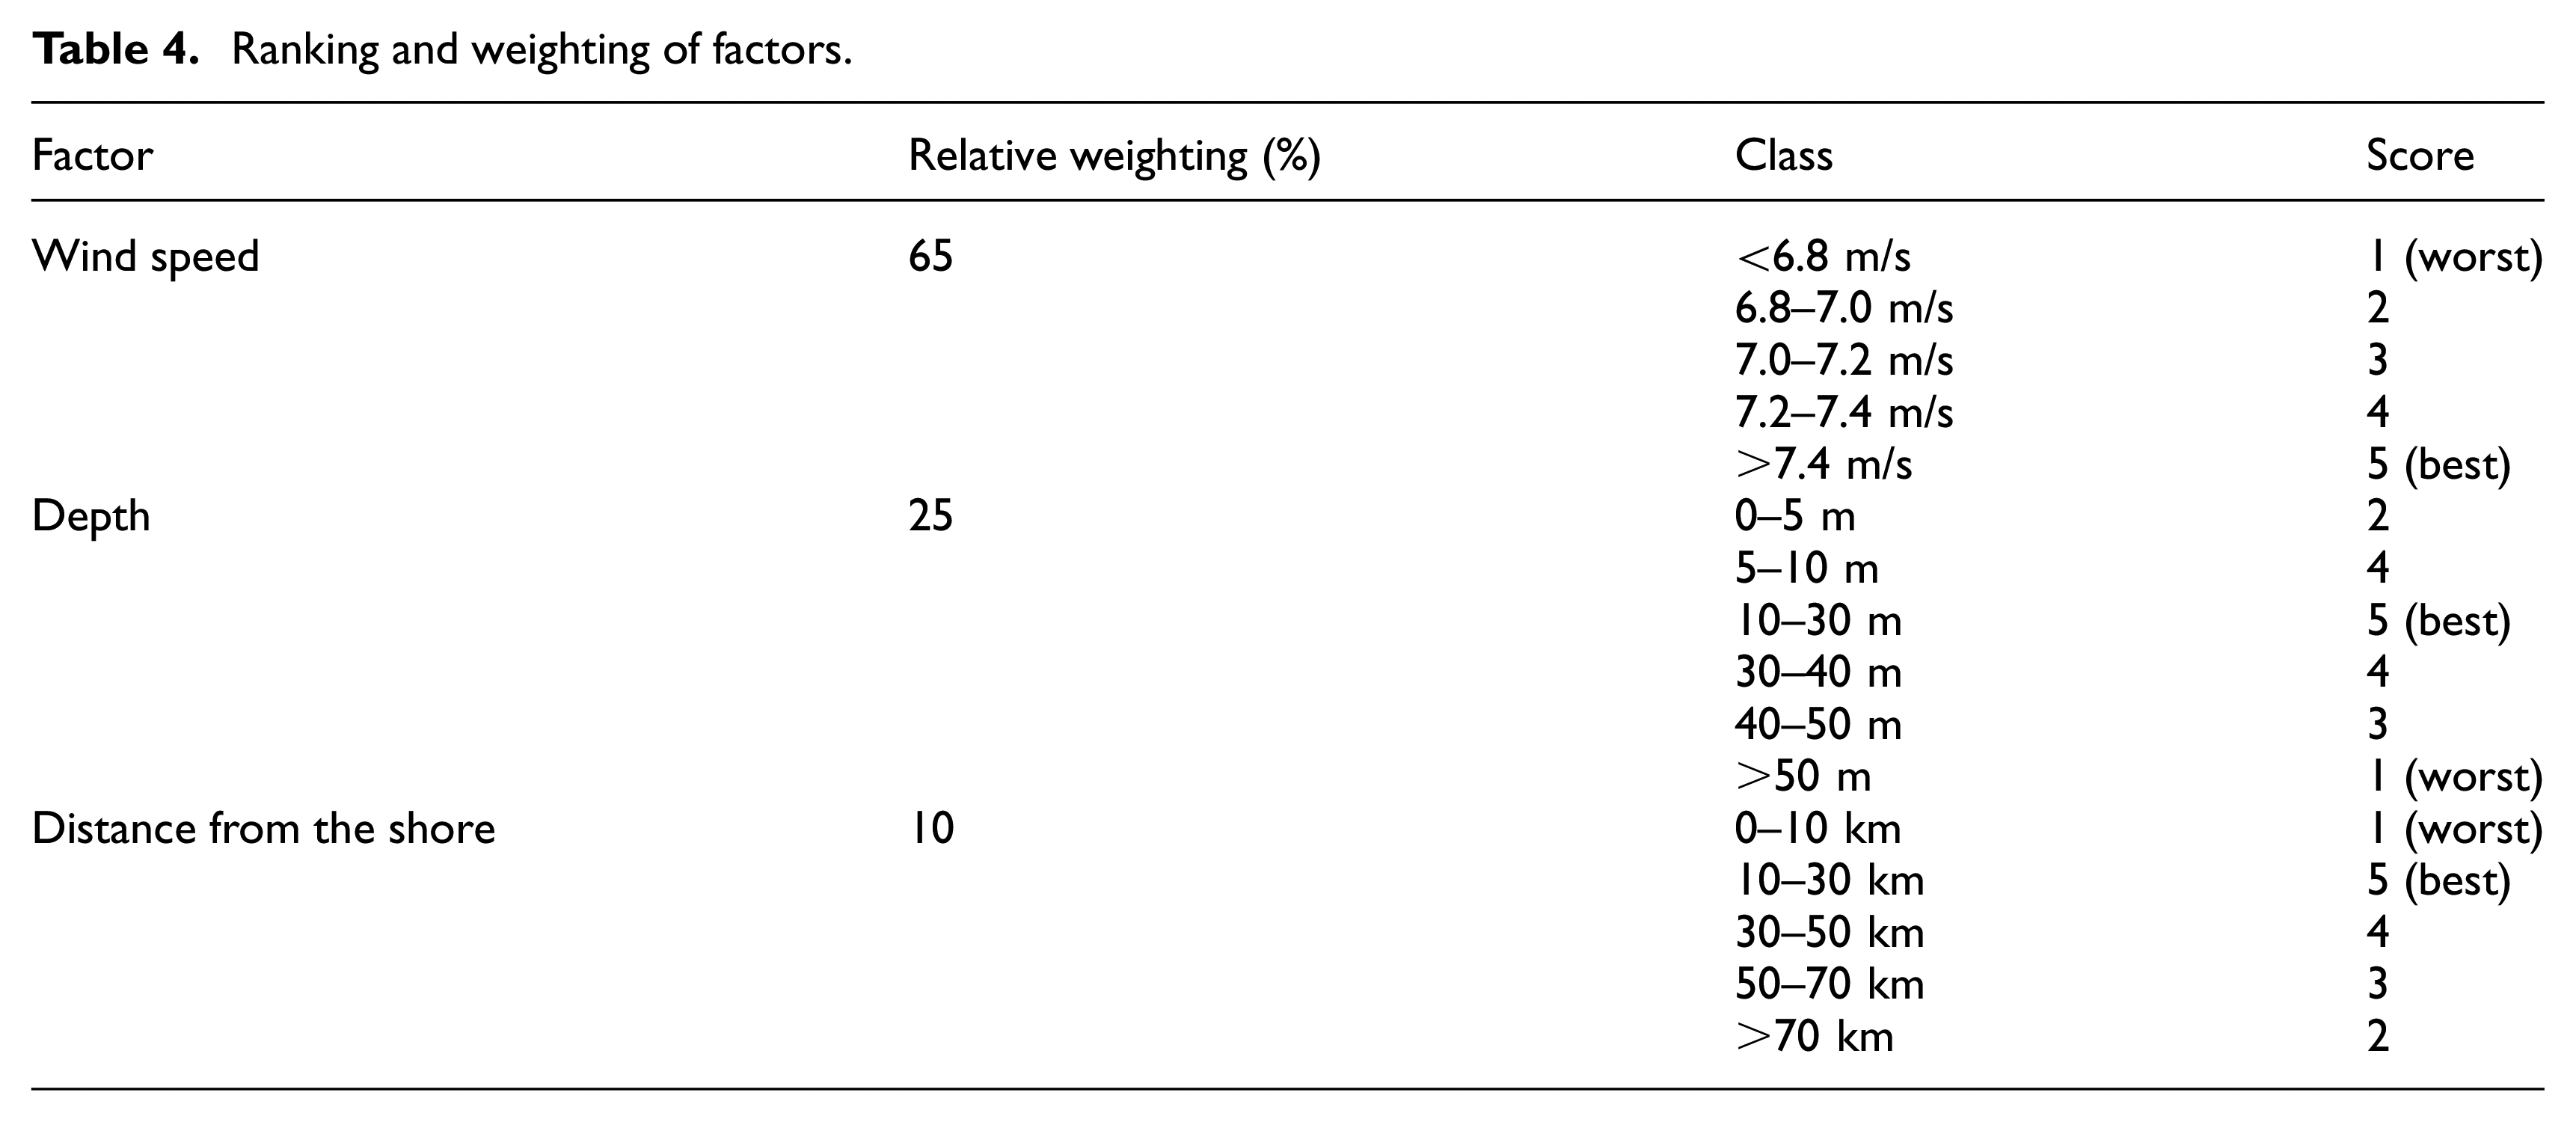
The factors identified in the literature review and employed in this research were converted to GIS raster (where necessary) and changed to a coordinate system, extent and grid size which conformed with that of the constraints (see section ‘Exclusion stage’). The following paragraphs particularize the factors and describe their ranking according to the level of opportunity they offer for offshore wind installation. The various factors have different values and scales; so to make them directly comparable, they are reclassified to a common linear scale of 1–5, with 5 being the most preferred.
Wind speed
GIS polygon shapefiles of wind speed for Bahrain were downloaded from the Wind Atlas (EMD International A/S, 2017). This was prepared using mesoscale and microscale modelling by a consultancy commissioned by the Sustainable Energy Unit of the Kingdom of Bahrain. The input data are ECMWF ERA-Interim data 1997–2016 (satellite reanalysis data). This dataset agrees well with the Global Wind Atlas (n.d.) which is also generated by downscaling atmospheric reanalysis data. It is also consistent with the Coastal Information System Database at Kuwait Institute for Scientific Research (Al-Salem et al., 2018). This database is mathematically modelled and validated with instrumental records from Kuwait International Airport. However, lower values are obtained by Khonkar (2009). This author based his results on sparse voluntary ship observations. Thus, the wind data utilized in this research should be used as a guide only. Measurements at potential sites using masts or vertical LiDAR should be undertaken before the commencement of any construction.
The wind speed was selected for 150 m height. This is the closest to the present average wind turbine hub height of 133 m in 2018 (Fraunhofer, 2018a). The wind speed at 150 m in Bahrain’s maritime area ranges from 6.3 to 7.5 m/s (Figure 4). By European standards, this is considered insufficient for profitable energy production (minimum of 8 m/s at 100 m, BVG Associates, Wind Europe, 2017). Yet wind turbines commence electricity generation at wind speeds of 3 m/s and achieve full capacity at 12 m/s (Rampion Offshore Wind Farm, 2019). Researchers have employed minimum offshore wind speeds of 5 m/s in India (Murali et al., 2014) and 4.5 m/s in UAE (Saleous et al., 2016). In Vietnam, the Khai Long I (intertidal) wind farm (40 MW, 50 turbines) (https://www.4coffshore.com/offshorewind/) is currently under construction in a 5 m/s wind speed area (https://globalwindatlas.info/). Further along this coast, the Truong Long Hoa (intertidal) wind park (48 MW, 12 turbines) is being installed with anticipated wind speed of 6.5 m/s, with many more projects planned adjacent to these. Taking India as an example, the Ministry of New and Renewable Energy is leasing offshore blocks for development in the Gulf of KhamBhat, Gujarat, where wind has been assessed at 6.5–7.5 m/s. Hence, in this article, the whole of Bahrain EEZ is designated as possessing adequate winds. Wind speed is divided into five equal classes, the stronger the better (Table 4).
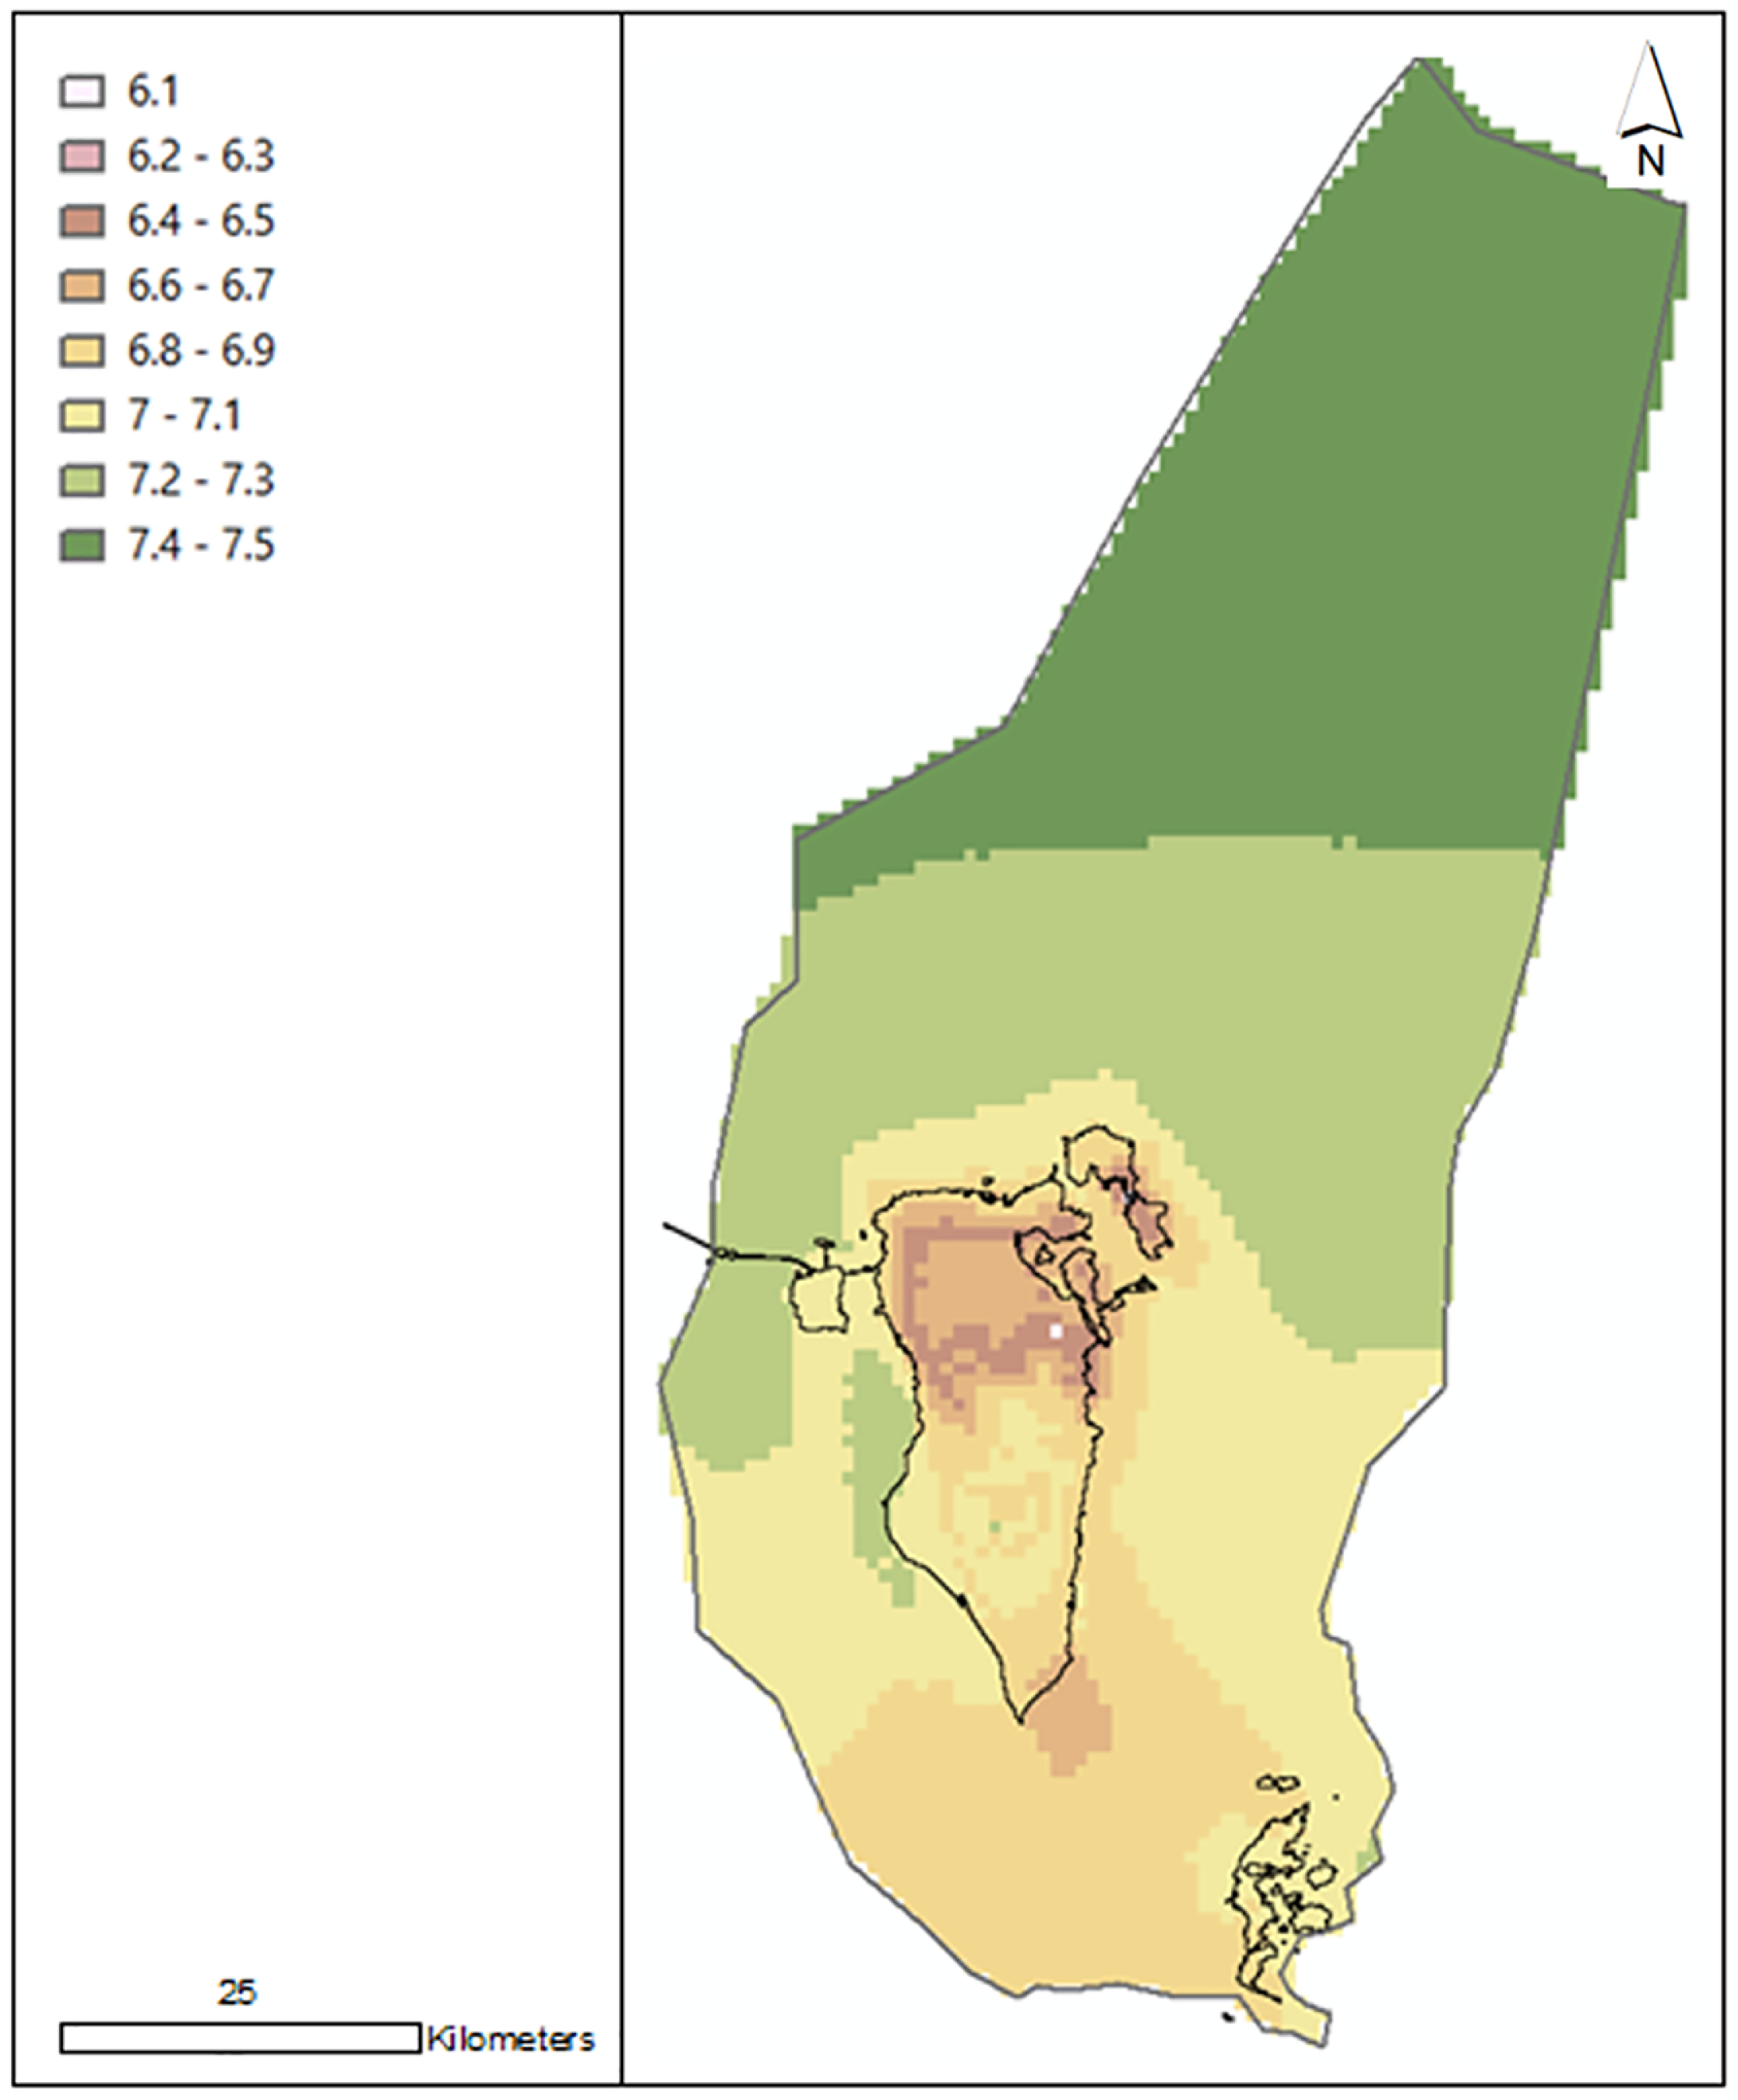
Bahrain wind speed at 150 m in m/s from Wind Atlas (EMD International A/S, 2017).
Sea depth
The bathymetry layer was obtained from Becker et al., 2009. It comprises satellite data calibrated by soundings and is the most detailed and accurate publicly available for the region. The seas surrounding Bahrain are generally very shallow, reaching a maximum depth of 70 m at the northern extremity of the territorial waters (Figure 5). Following a survey of reports and scientific articles, the depth layer was divided into the classes itemized next and summarized in Table 4. Waters between 30 and 50 m are the most favourable. These allow installation of fixed monopile turbines which are a mature technology (Scottish Government, 2018). Second in order of preference are 5–10 m and 30–40 m. In less than 5-m water depth, wind turbine construction is possible but requires dredging or a specialist vessel (for instance, as described by Mammoet, 2018). Therefore, 0–5 m takes the next lowest ranking. Fewer turbines are installed in depths greater than 40 m (Fraunhofer, 2018b). When the seabed exceeds 50 m below the surface, it becomes necessary to deploy floating structures. Currently, this is associated with a step up in costs, but as the technology evolves, expenses are expected to fall. However, as of today (June 2019), just one floating wind farm is actually operational (OffshoreWind.biz, 2019). Therefore, depths greater than 50 m were categorized as least preferable.
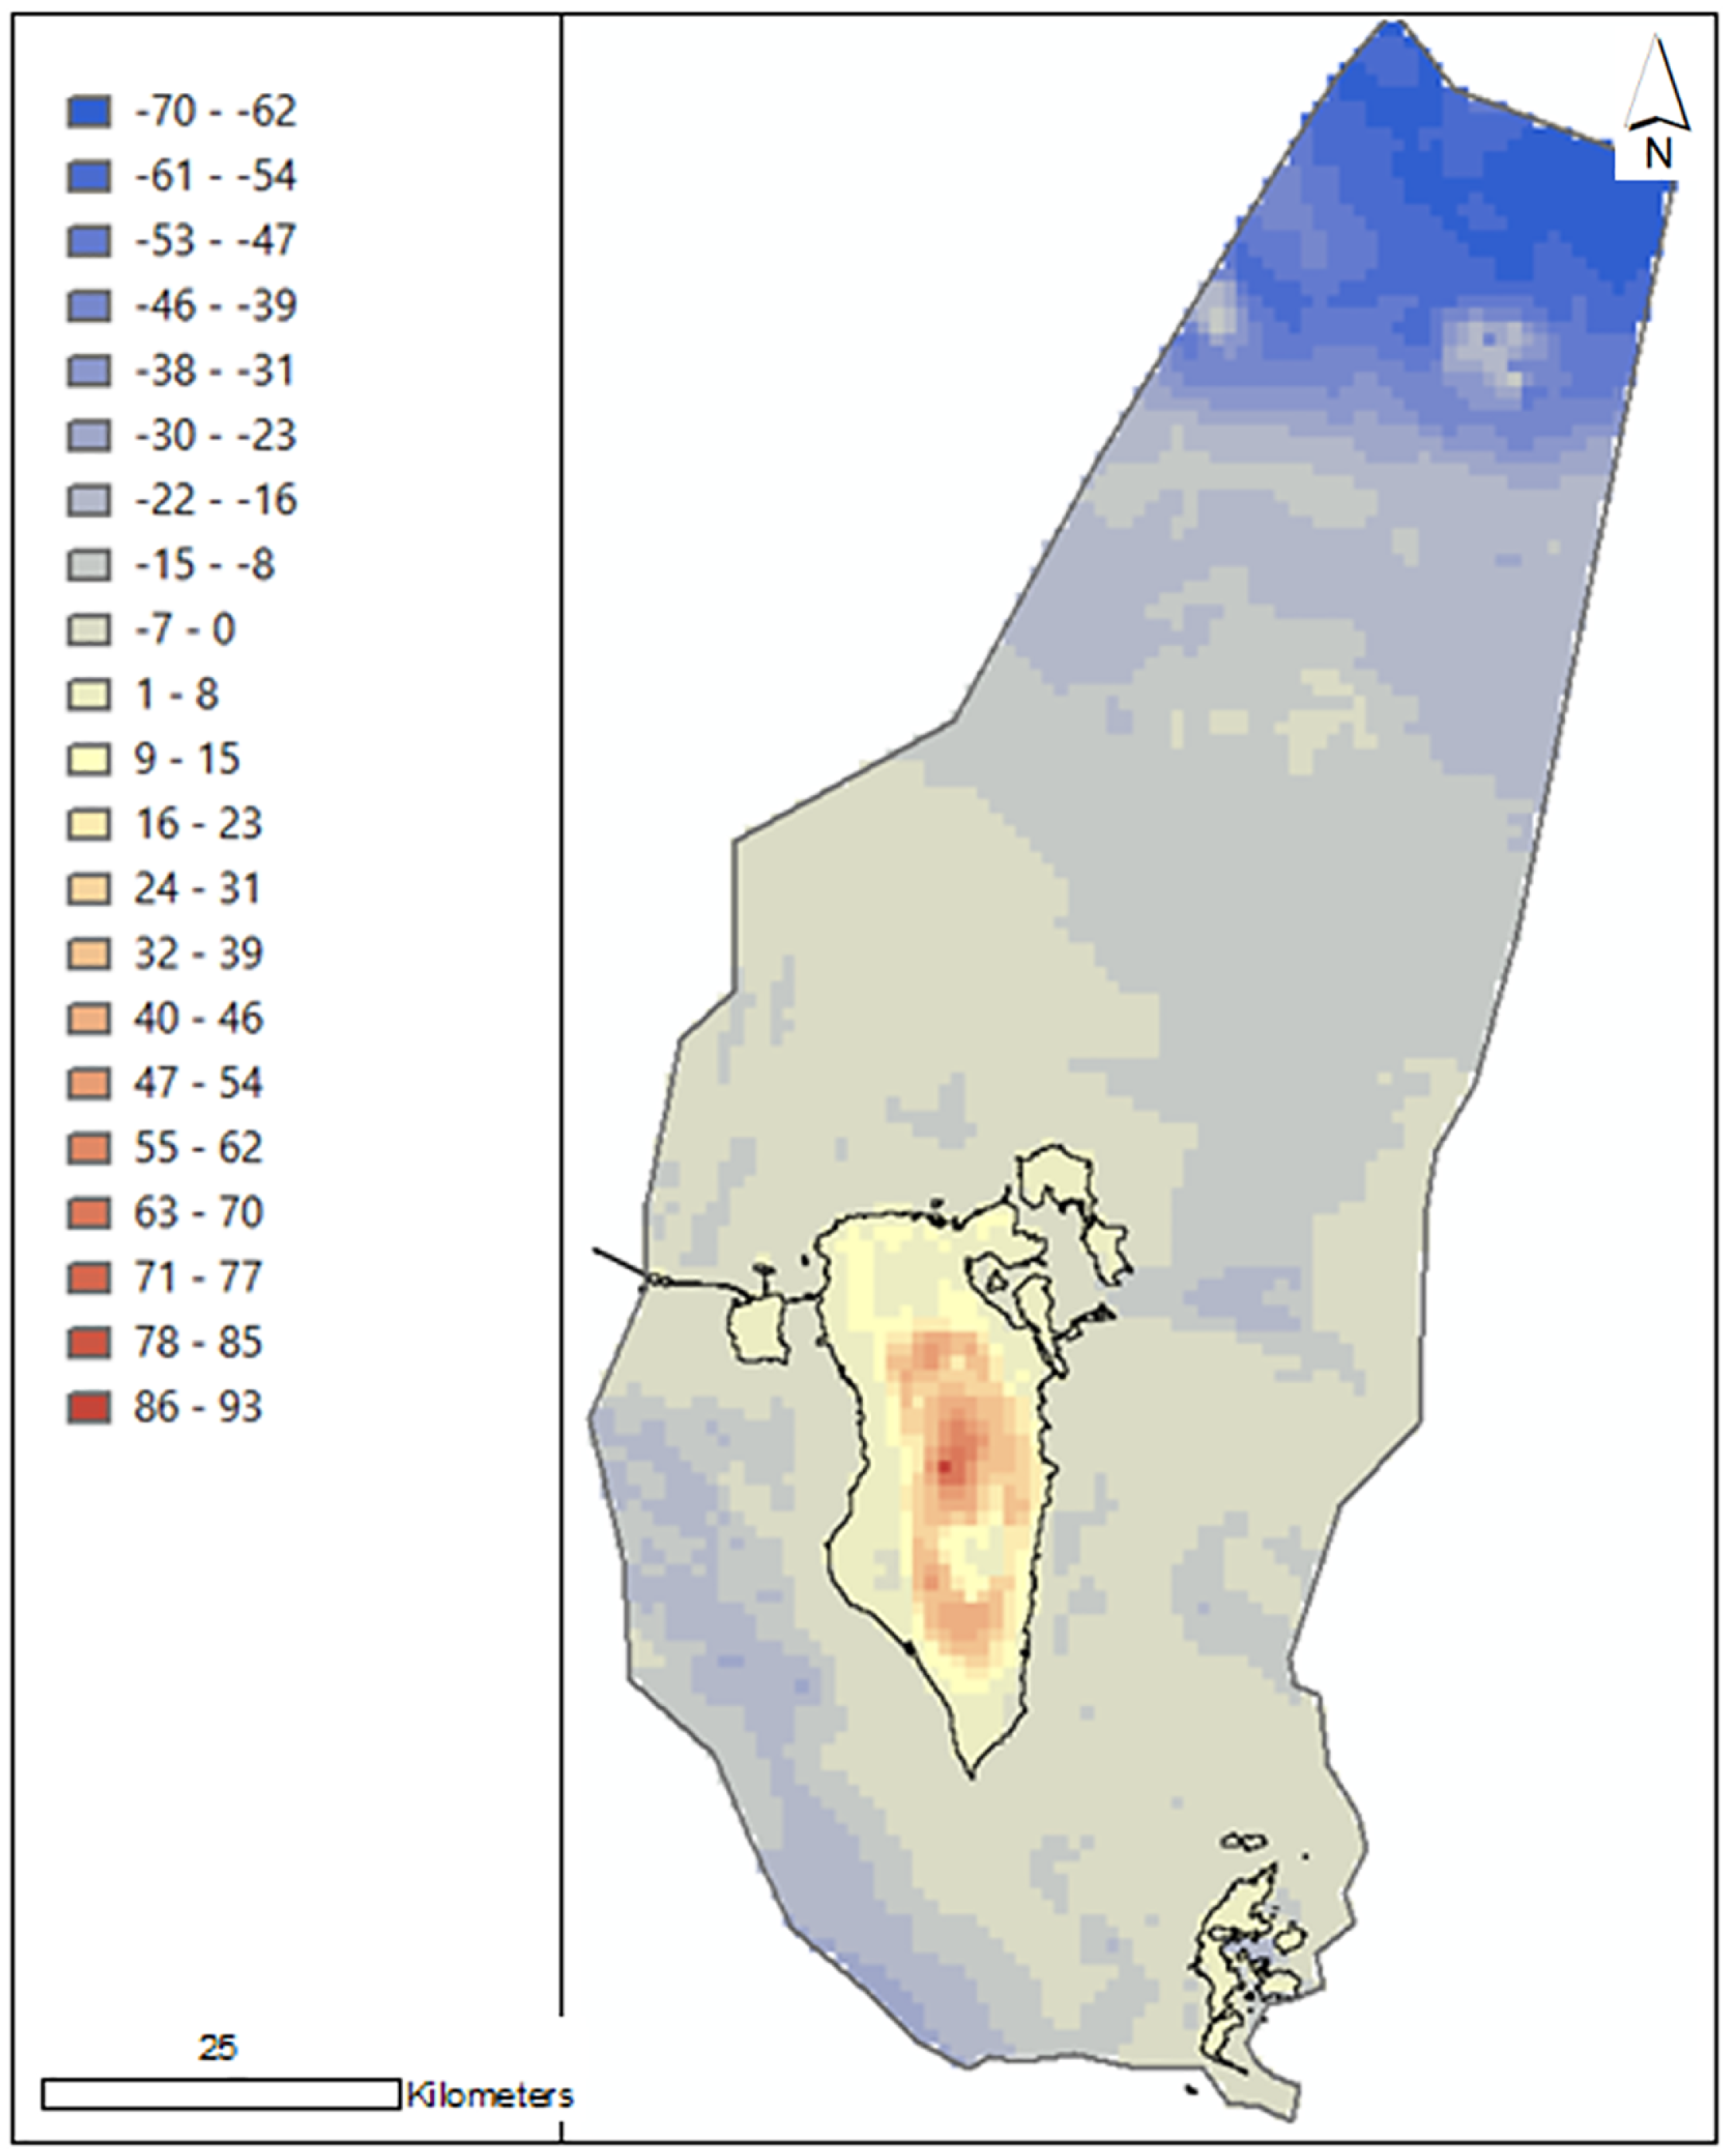
Bahrain land elevation and sea depth in metres SRTM30_PLUS (Becker et al., 2009).
Distance from Bahrain’s main island
The Euclidean Distance tool of ArcGIS Spatial Analyst (Esri, 2014) was used to create a raster where each grid cell contains the measurement of straight-line distance from the cell itself to Bahrain’s main island (Figure 6). That is, to the mainland where main infrastructure is located. The cell distances were then reclassified 1–5 (Table 4). Cells within 10 km of the main coastline were allocated a low score because many are visible from tourist beaches and urban areas. Average visibility is 10 km in Bahrain (Manama Monthly Climate Averages, 2019). The remaining distances were divided into four equal classes with rank decreasing as distance increases. It has been found that levelized cost of wind energy production rises in an almost linear fashion, as distance to land increases (Myhr et al., 2014).
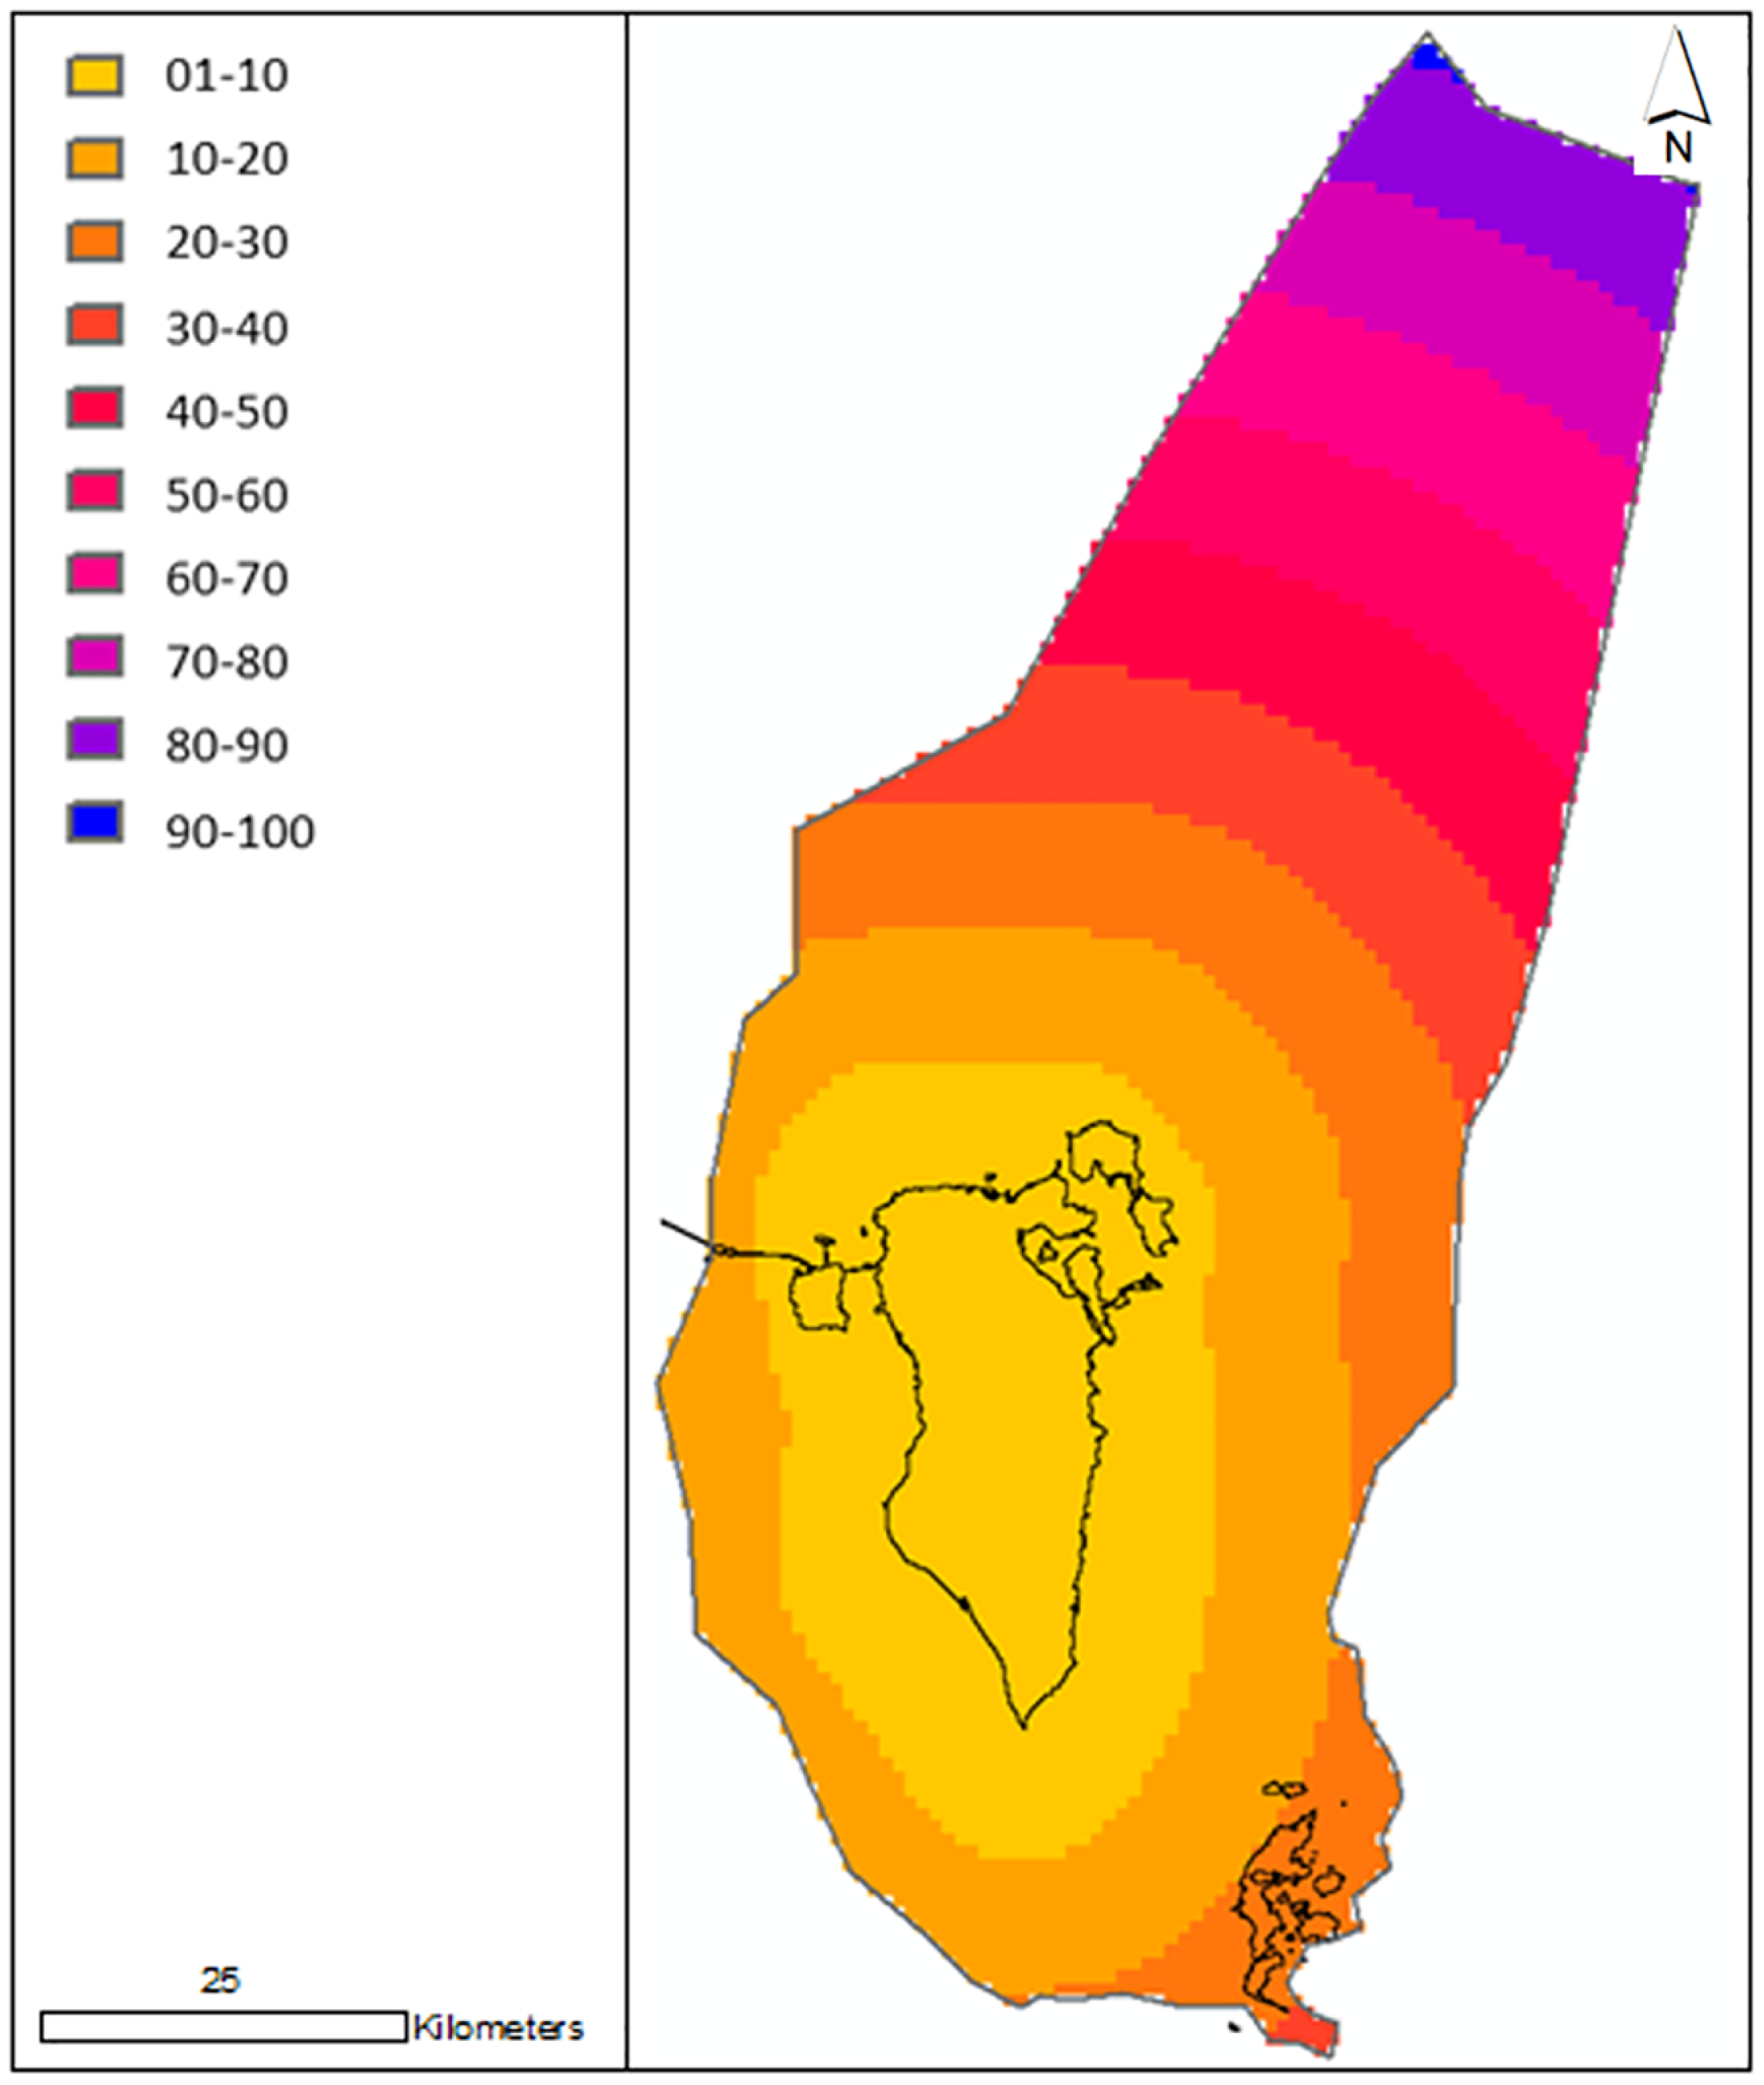
Distance in km to Bahrain’s main island.
Additional factors
Further factors identified in the literature review as important for offshore wind construction are seabed conditions and tide. Regarding the seabed type, renewable developers choose sites with dense marine sand to facilitate burying cables and laying foundations (Mahdy and Bahaj, 2018). No detailed data about the subsea soils surrounding Bahrain exist. Sand dredging is carried out to the north of Bahrain’s main island (National Detail Land Use map 2030). A textbook on coral reefs describes the southern Gulf as mostly hard ground (from echo sounder), topped by fine wind-blown material (Riegl and Purkis, 2012), which is very suitable for turbine construction. It is acknowledged that seabed type is significant for offshore wind, but due to the lack of spatially resolved data, this factor will be not be examined by this article. Any construction activity should be preceded by a geotechnical site investigation.
Tidal range dictates accessibility of turbines by maintenance boat crews (Fraunhofer, 2018c). It also impacts on wind shear profile (Khan et al., 2003). However, Bahrain has a low variation in the tide (Riegl and Purkis, 2012) because of the proximity of coral reefs, sand banks and the gulf amphidromic point. Thus, tide is not included as a factor in this analysis.
Weighting of factors
So far, all the factors have been standardized. For example, if a location for the wind layer is allocated a rank of 5, then this factor will have the same influence as cells in the depth and distance layers with values of 5. However, this is not the real situation. Some factors are more important than others. It remains to assign a relative importance to each of the ranked factors so as to form a weighted ranking. Each layer is multiplied by its weight before all the factor layers are combined. At the end of this process, the grid cells in the combination layer with the highest rank represent the optimal locations for offshore wind. This weighted overlay combination goes by various names in the statistical literature. It is known as ‘weighted sum’ in ArcGIS (Esri, 2014).
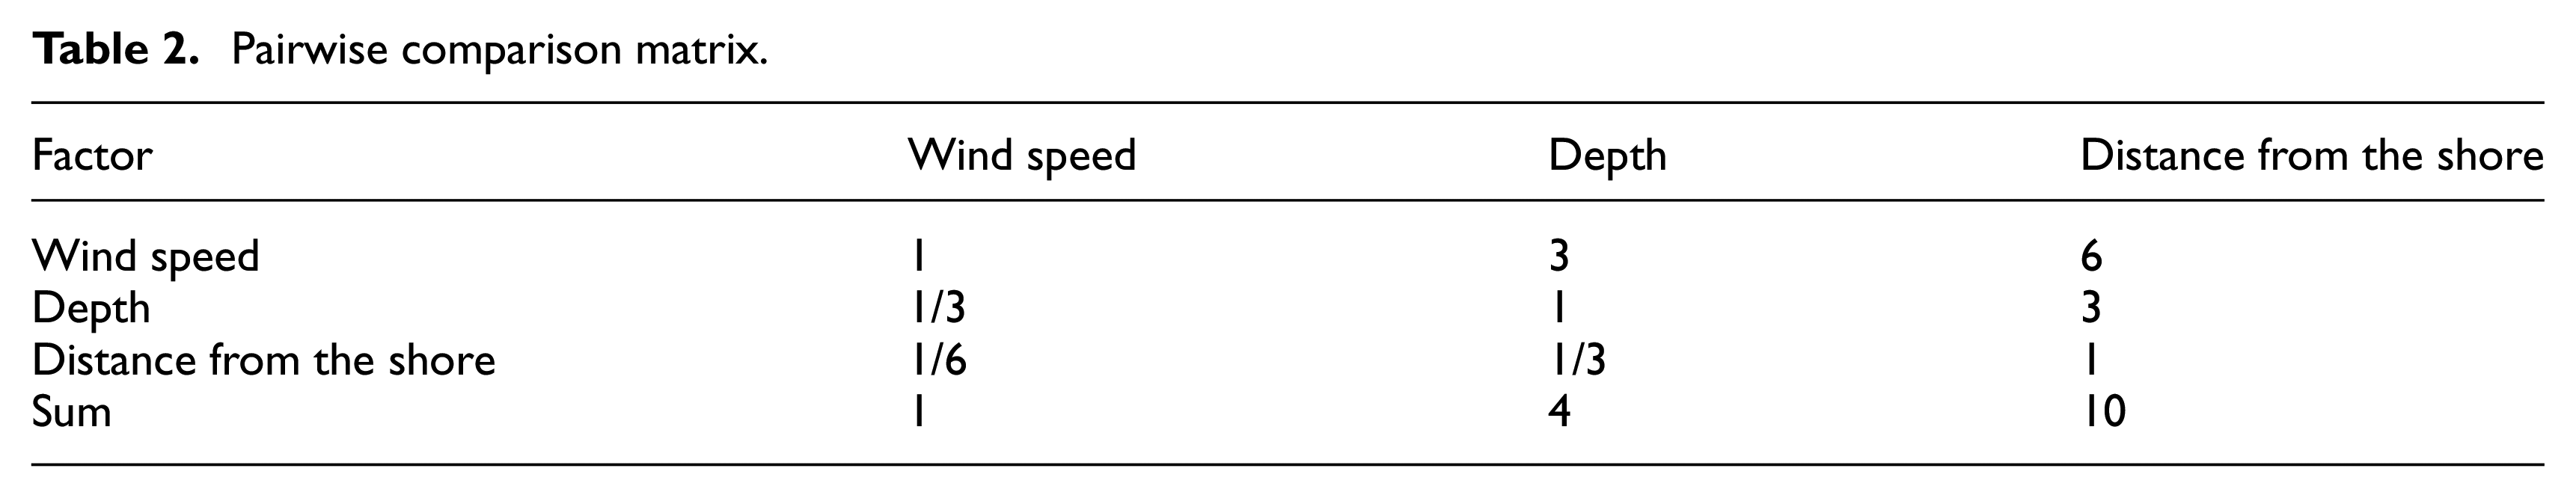
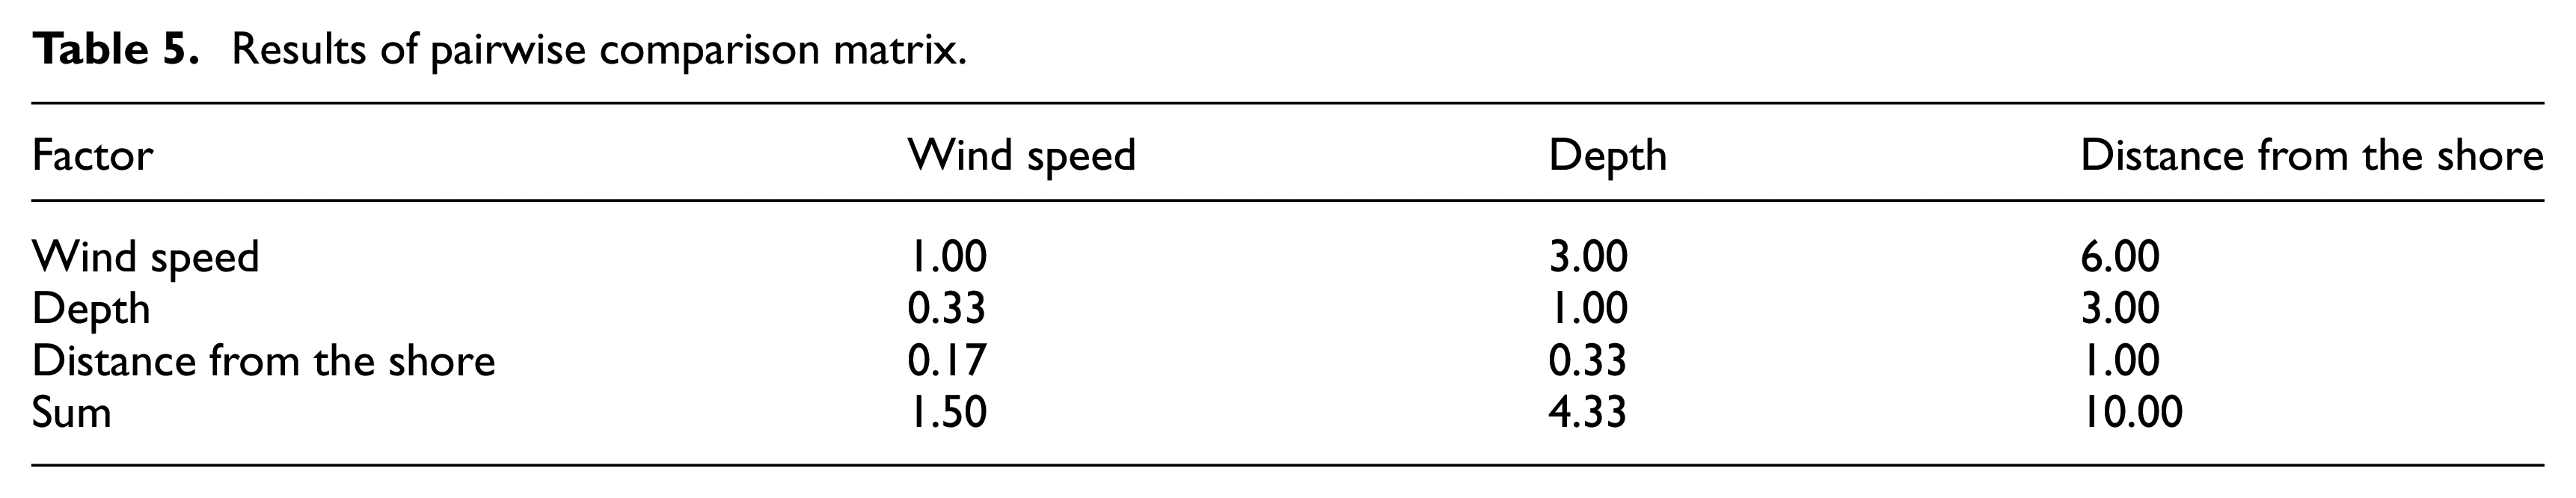
The question arises as to what weight to give each factor. The most widely used and pragmatic solution is the AHP (Mahdy and Bahaj, 2018) developed by Saaty (1980). AHP commences by placing the three factors (wind speed, depth and distance from the shore) in a three-by-three matrix (Tables 2 and 3). The matrix is completed by initially assigning a score of one where both factors are equally important. That is, where each factor is compared to itself, resulting a left-to-right diagonal of ones across the matrix. To the right of this diagonal, a judgement value is allocated. This ranges from 1 for a pair of factors of equal importance to 9, where the first factor is extremely important in comparison to the second. The score of 1 to 9 may be selected according to own judgement, seeking expert opinion or knowledge. Here, the score is based on the cost. Wind speed is designated three times as important as depth, using projects costs obtained from Cavazzi and Dutton (2016). Distance from the shore is treated as half as important as depth, following Mahdy and Bahaj (2018) and Cavazzi and Dutton (2016). The lower left of the matrix is filled with the reciprocal of the judgement value in the pairwise comparison.
Pairwise comparison matrix.
Normalized matrix and weight determination.
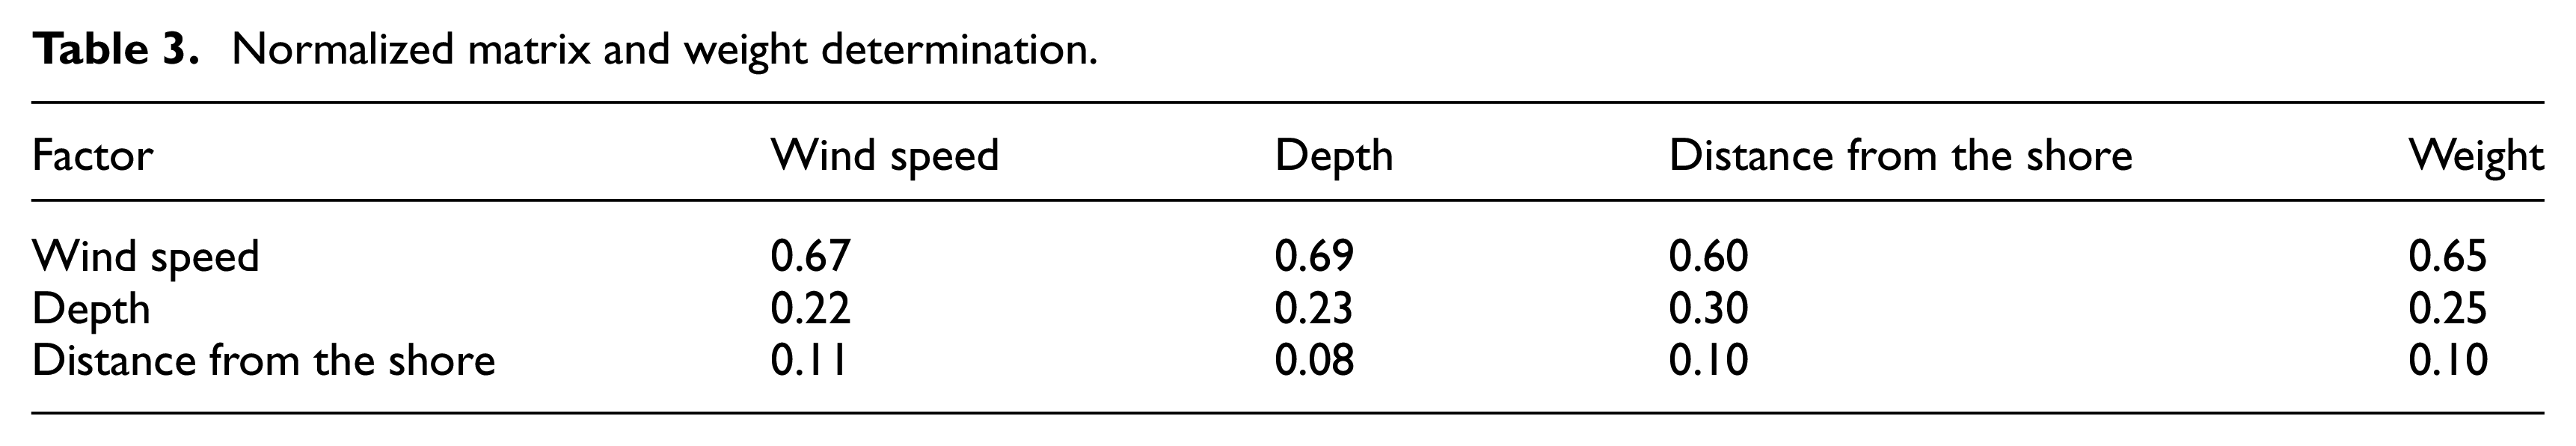
The next step in AHP is to normalize the matrix by totaling the columns. Each matrix cell in the column is divided by the column total to yield its normalized score. Finally, the weight of each factor is obtained by summing each row in the new normalized matrix (Table 3) and dividing the sum by the number of columns, that is, factors in the matrix (three in this case.) The sum of the rightmost factor weights columns is one. A summary of the ranks assigned and weights calculated for all factors is given in Table 4.
Ranking and weighting of factors.
To ensure the pairwise comparisons are consistent and to validate them, the consistency ratio (CR) is calculated. The consistency vector is calculated by multiplying each row in the original pairwise matrix (Table 5) by the weights column in Table 3 (matrix multiplication) and dividing by the weight. The average of these values is λmax. The consistency index (CI) is calculated as CI = (λmax−n)/(n−1). The CR is then calculated as CR = CI/RI, where RI is the random consistency index, that is, the CI of a randomly generated pairwise comparison matrix obtained from Saaty (1980). The CR should be less than 10%, if judgements are consistent and assumptions are valid. In this instance, it was found to be 1.9%. This justifies the AHP just performed. The method also agrees with those employed by FOWIND (2019) and Scottish Government (2018), who also treat distance as half as important as depth.
Results of pairwise comparison matrix.
The last step in AHP is to multiply the standardized factors by their weights using the weighted sum tool in ArcGIS. The resultant single combined map layer of reclassified standardized weighted factors is illustrated in Figure 7.
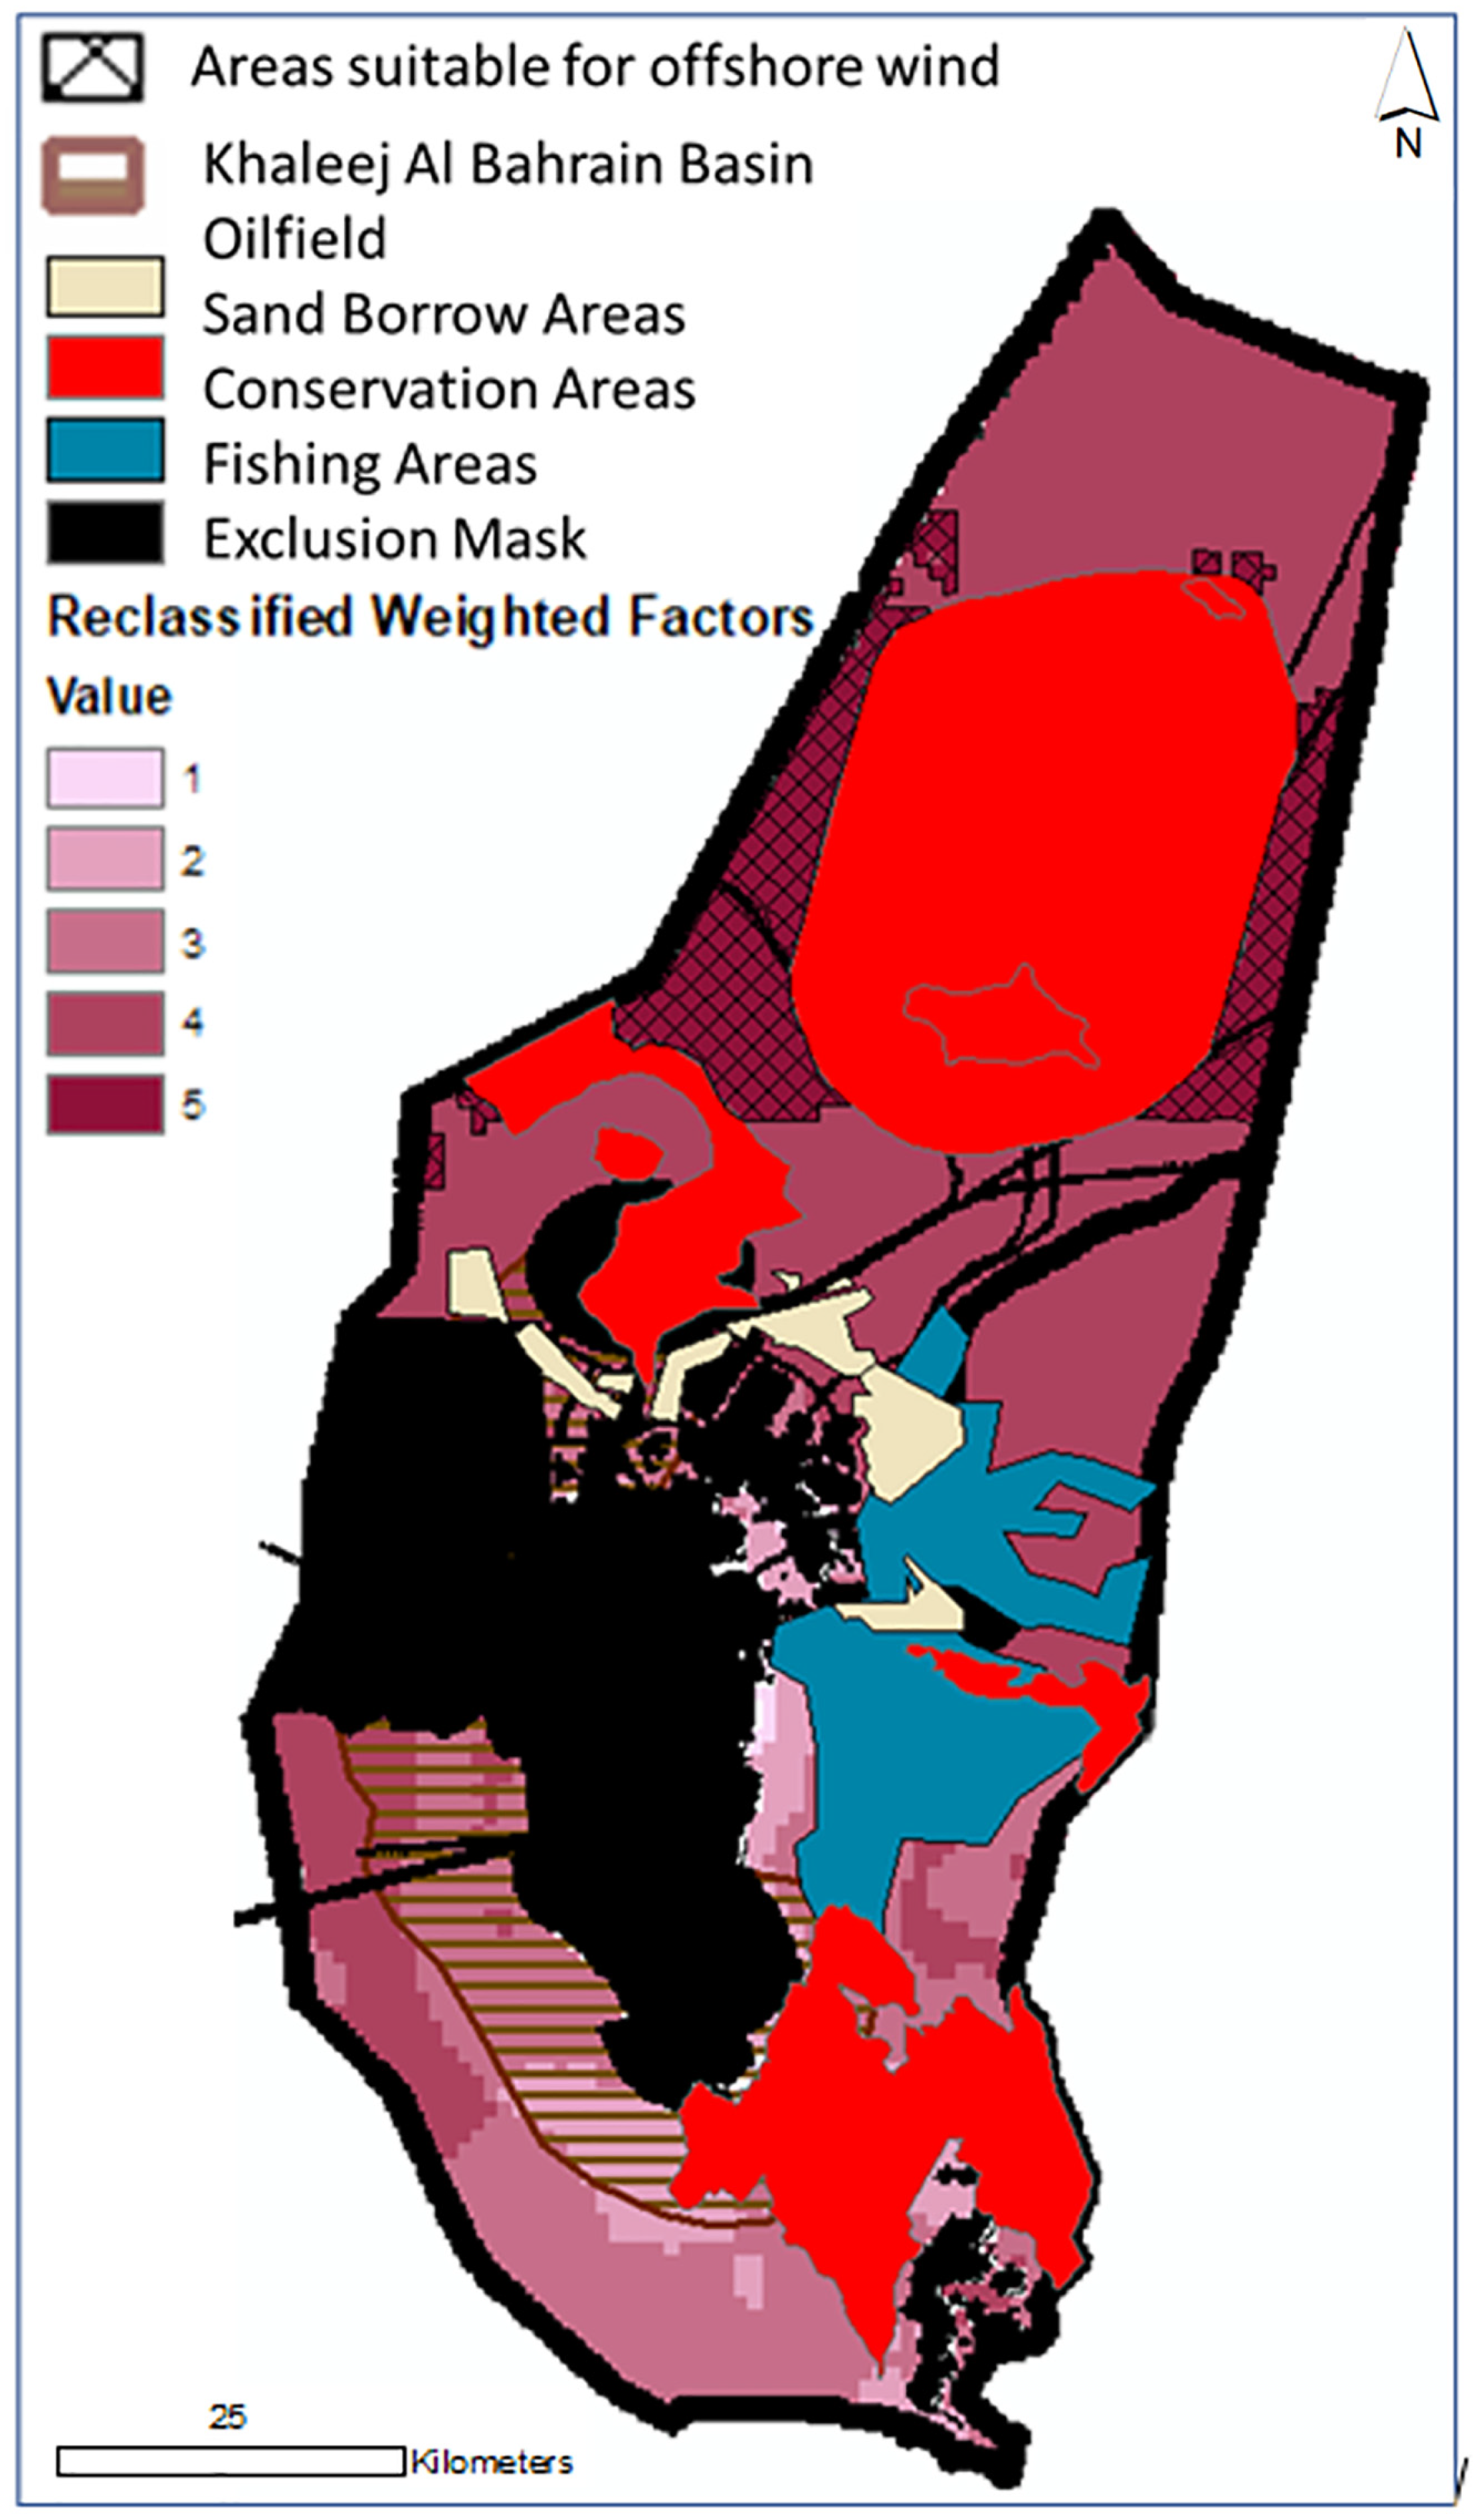
Map of exclusion mask, reclassified weighted factors, competing seabed uses and areas selected as suitable for offshore wind.
Competing seabed uses stage
In this stage, the Weighted Sum layer was multiplied by the Boolean exclusion mask layer, using the Raster Calculator tool in ArcGIS. The needs of other users of Bahrain’s territorial waters were then investigated. Sand extraction activities, oil drilling, the fishing industry and conservation areas were examined.
Sand extraction is valuable to Bahrain’s development. It is necessary to support the high urbanization rate because it is used in building construction and land reclamation (Trade Arabia, 2013). In the United Kingdom, the Crown Estate recommends that sand extraction takes precedence over wind energy areas to supply elevation of land levels. There are no similar guidelines for Bahrain. Sand extraction areas (also known as sand mining or borrow areas because sand will eventually flow back) were digitized from the National Detail Land Use map 2030. In practice, they were found to be close inshore, in lower wind speed regions and in shallow water. Therefore, there is no conflict with potential wind farm locations (Figure 7).
There are currently no offshore oil fields in Bahrain’s territorial waters. (The Abu Safah field just beyond the maritime border is joint with Saudi Arabia.) However, in April 2018, Bahrain’s Higher Committee for Natural Resources and Economic Security revealed that a reserve of shale oil and deep gas had been discovered in the Khaleej Al Bahrain Basin, which curves around the west and south-west coast of the main island (Figure 7). The deposits are estimated to comprise 80 billion barrels of oil and 10–20 trillion cubic feet of natural gas. Compared to Bahrain’s onshore oil reserve of 125 million barrels, this is potentially of great economic importance (Ellyatt, 2018). The technology for exploiting these unconventional resources has yet to be established. The exact locations of the deposits are not public. The entire Basin does not coincide with areas identified as best for wind, so the new oil field is not treated as a competitor for maritime area by this research. However, exploratory drilling has recently been permitted (13 January 2019) in the northern EEZ, until now unexplored as far as hydrocarbon capacity is concerned (Eni, 2019). This could be in the same position as potential wind farms but since the location of any future oil fields is as yet unknown, the possibility is not taken into account.
Legislation pertaining to the co-existence of fishing activities and offshore wind varies from country to country. In Belgium, fishing vessels must remain at least 500 m from wind parks, but in the United Kingdom, access is permitted. Although even in the United Kingdom, offshore wind is not popular with fishermen due to the risk of fishing gear becoming trapped on underwater cables and potential collisions with turbines. A map layer of Bahrain’s current fishing grounds was created by capturing the density map of fishing vessel signals from Global Fishing Watch (n.d.). Fishing grounds were in shallow water close to the port of Sitra, so problems with wind installation are unlikely.
The Kingdom of Bahrain is a signatory to the UN Convention on Biological Diversity (CBD) and as such is dedicated to promoting sustainability. Expansion of the existing network of protection areas is proposed. A strategy to identify new protection areas based on four possible scenarios which meet different objectives (biodiversity, fishing, habitat type and cumulative) has been developed by the Supreme Council for Environment, Kingdom of Bahrain (2015b). This research captures the very high conservation priority areas from the cumulative scenario, in addition to the Hayrat Buffer (protection zone around conserved oyster beds with coral reefs), and rules them out for wind installation. Thus, in addition to the range of habitats and fish feeding/nursery grounds, key bird species, including one of the world’s biggest Socotra Cormorant colonies, Greater Flamingo and Black-headed Gulls are protected, as well as sea turtles and dugongs (sea cows). Most of the areas reserved for conservation are in shallow water, but inclusion of the Hayrat Buffer does reduce sea area for potential offshore wind. Nevertheless, the national commitment to the environment is honoured.
The final suitability map layer is shown in Figure 7 (cross-hatching). It may be seen that this is the area weighted ‘5’ of the reclassified factors (dark pink), with the Hayrat Buffer removed. Weight 5 represents sea area that is of sufficient depth but not too deep, far enough offshore to avoid visibility issues and not so far as to increase transport/cable costs. To meet these requirements, a compromise on wind strength is employed. The areas selected as suitable have 7.2–7.4 m/s wind speed and not the highest speed available (>7.4 m/s).
Offshore wind potential stage
In this last stage of the sequence of methods, the number of wind turbines which will fit into the areas identified as suitable is calculated, as well as their nameplate capacity and potential output.
Bahrain has a prevailing wind, the Shamal, which blows from the northwest. Therefore, Sheridan et al.’s (2012) method of calculating turbine placement which utilizes the benefit of directional wind patterns is employed. Total energy output is optimized by placing turbines in rows, with 5 rotor diameters between each turbine crosswind and 10 rotor diameters between downwind. The following equations (1 and 2) are used to obtain the footprint per turbine and total number of turbines in the suitable areas. (Size of the suitable areas computed using ArcGIS).


The turbine Vesta V150 (Vestas Wind Systems A/S, 2018) is used for power calculations in this research. In low-wind sites, it is better to choose a turbine with a large rotor diameter and a smaller generator which even in low speeds allows enough torque to be produced by the rotor to drive the generator (Schaarup and Krogh, 2001). The Vesta V150 has a rated power of 4.2 MW, a rotor diameter of 150 m and a specific rotor power of 237.68 W/m2. Thus, it is appropriate for the low (by European standards) offshore wind conditions surrounding Bahrain.
The nameplate capacity of each suitable wind farm area is calculated by multiplying the number of turbines by the rated power (4.2 MW). Annual energy production per turbine is obtained from the manufacturers’ manual (Vestas Wind Systems A/S, 2018), assuming 100% availability, 0% losses, standard air density and yearly average wind speed of 7.3 m/s. (All the potential Bahrain wind farm areas have the same average wind speed.) This is an idealized situation where the capacity factor (CF; average power generated divided by peak-rated power) is equal to one. For this reason, two more CFs were employed to estimate the annual energy production. First, the capacity factor was calculated from the manufacturers’ annual energy yield for the Vesta V150 divided by the rated energy yield (4.2 MW × 365 × 24). Second, because the answer returned seems rather optimistic (CF = 0.448 matches the best European conditions), a bias-corrected simulated CF of 0.3 was obtained from Renewables.ninja (n.d.). This is nearly the same as that estimated by Jowder (2009) who takes Bahrain’s specific air density into the equation.
The outcomes of the number of offshore turbines and energy yield calculations are portrayed in the ‘Results’ section.
Results
In total, 10 marine areas were found to be suitable for the construction of offshore wind farms in Bahrain’s EEZ. The size of each area, number of turbines and nameplate capacity of the wind farm is illustrated in Figure 8.
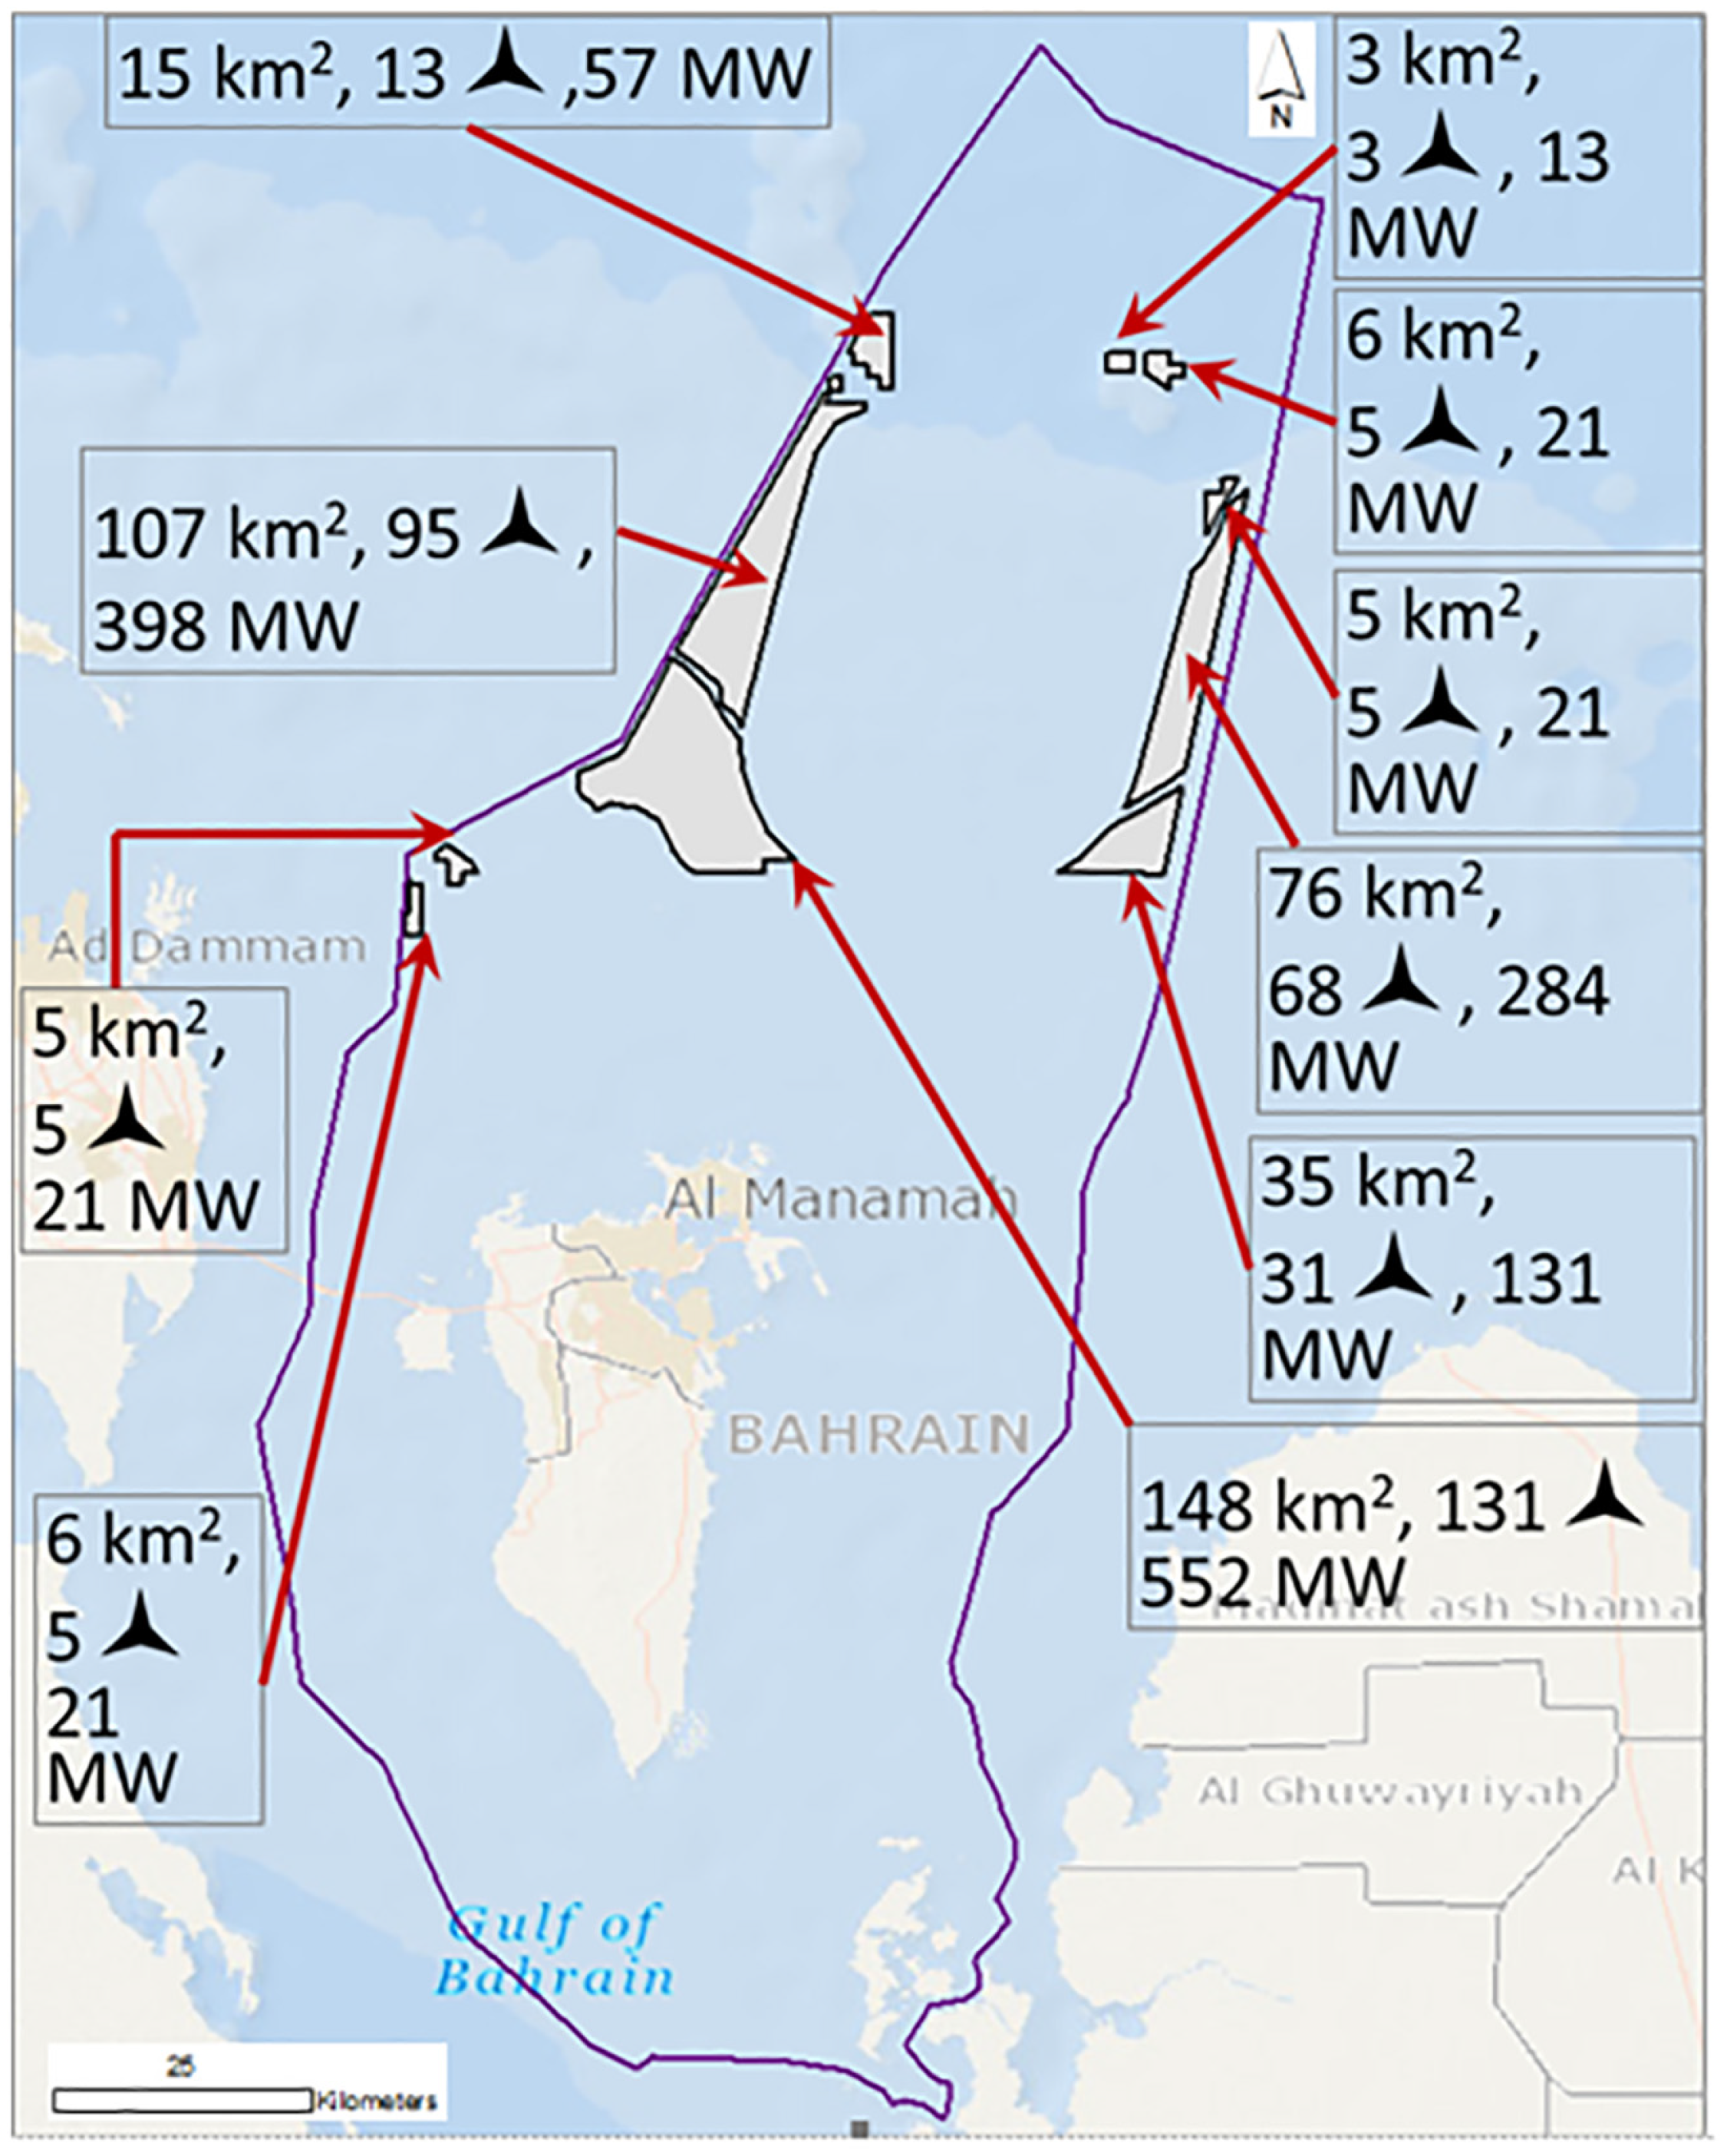
Map of potential offshore wind farms for Bahrain, showing sea area, number of turbines and nameplate capacity.
At first glance, it appears that only a small amount of Bahrain’s maritime area is suitable for offshore wind. However, this quantity actually totals 407 km2 which provides sufficient space for the installation of hundreds of turbines and 1.52 GW of wind capacity.
Estimated number of turbines and annual energy yield under three CFs are shown in Table 6. Naturally, the CF has a significant influence on eventual energy production.
Energy production under three capacity factors.
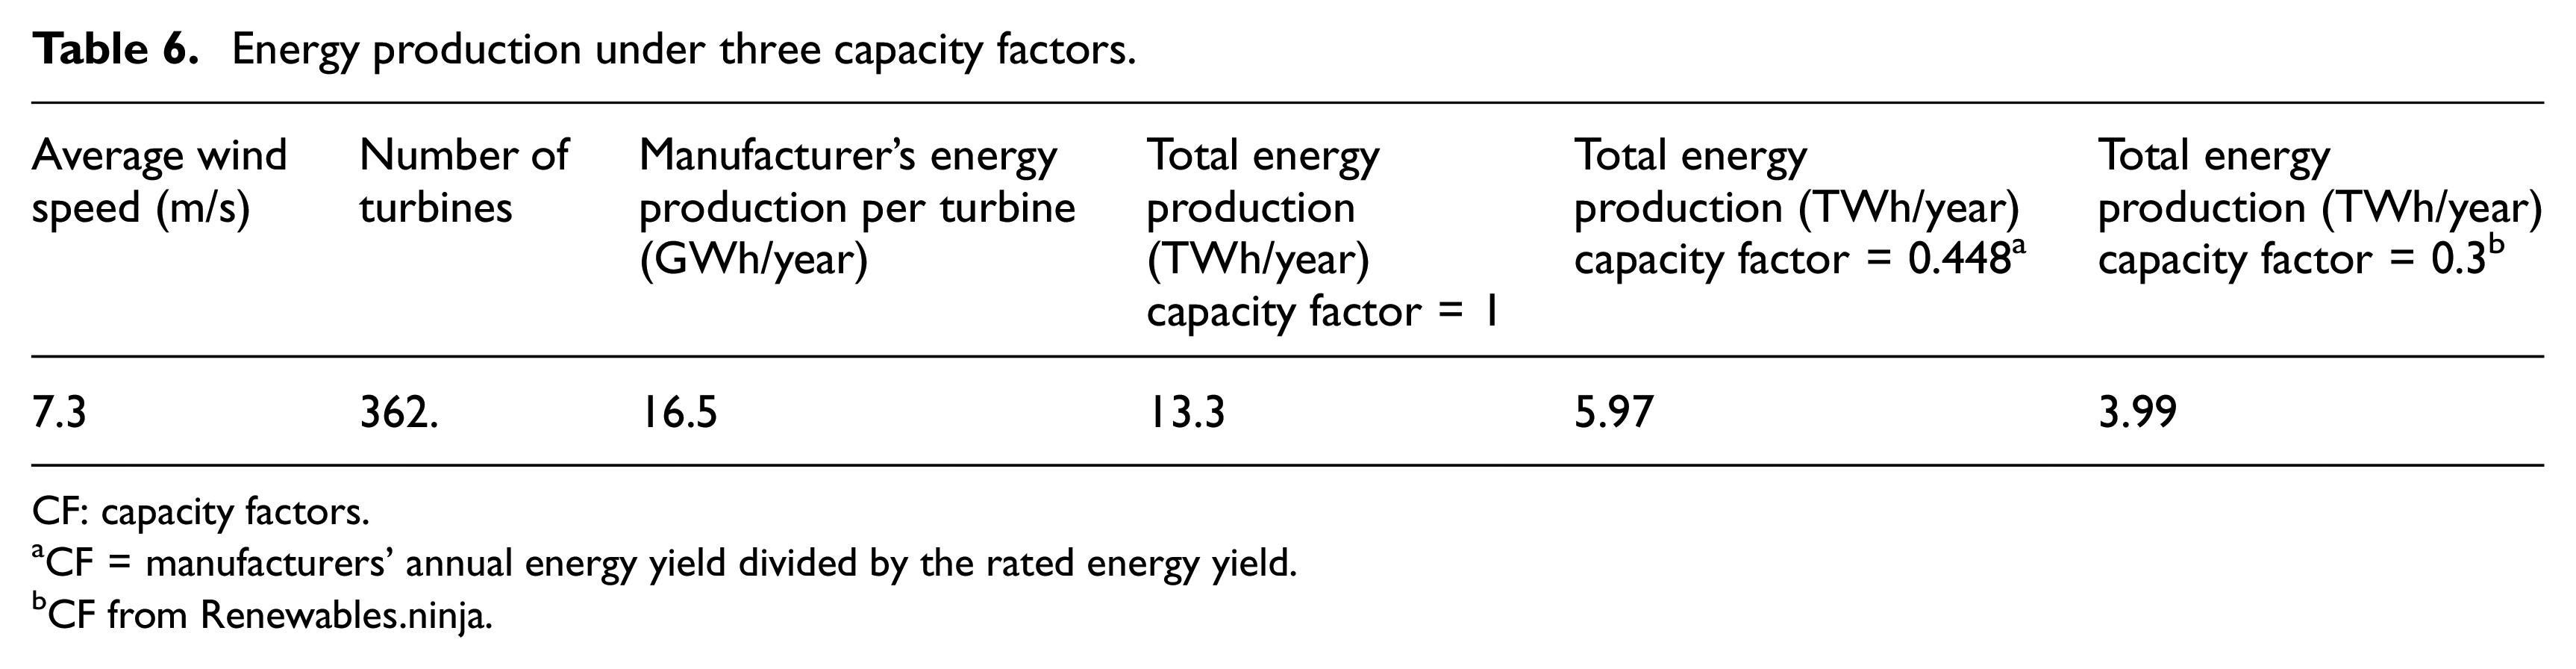
CF: capacity factors.
CF = manufacturers’ annual energy yield divided by the rated energy yield.
CF from Renewables.ninja.
Sensitivity analysis
Each factor (wind speed, sea depth and distance from the shore) was examined to establish its influence on the results. In fact, these factors are inseparable because depth and wind strength increase with distance from the shore. However, the cut-off of 50 m seabed depth for fixed foundation turbines is currently shifting optimal installation areas further inshore than would otherwise be the case. This will change with the development of floating structures (see ‘Discussion’ section).
Looking at exclusion constraints and competing seabed uses, it is the conservation areas which remove a major part of what in other respects would be prime wind farm location. Such prioritization decisions are beyond the scope of this research.
A further sensitivity analysis was carried out to investigate the sensitivity of the weights assigned to the factors (wind speed, sea depth and distance from the shore), rather than the factors themselves. Following Höfer et al. (2014), equal weights were allocated to each factor. The results were very similar.
Discussion
However, 1.52 GW of installed capacity would place Bahrain in a similar position to Norway (installed capacity 1.68 GW in 2018). Norway is 29th by capacity out of 61 world countries with installed wind power capacity. Put another way, this capacity would be similar to what the United Kingdom had in 2005 (1.35 GW) (Wikipedia, n.d.).
As can be seen from Figure 8, potential wind farm size in Bahrain ranges from 21 to 552 MW. To place some of the sizes in context, Hornsea One is the world’s biggest offshore wind farm at present with 1218 MW (1.2 GW), London Array (phase 1) is 630 MW and London Array (phase 2) 270 MW (RenewableUK, n.d.). The Hywind Scotland Pilot Park has a total installed capacity of 30 MW comprised five 6 MV floating turbines (OffshoreWind.biz, 2019), while the 1-year-old Nissum Bredning near shore wind farm in Denmark has 4 × 7 MW turbines placed in 3 m deep water by submersible barge (Mammoet, 2018).
Bahrain used 27.81 TWh of energy in 2016 (IEA, 2016). This represents the 67th largest energy consumption out of 254 world countries, despite being 188th in terms of size. Causes of this high energy consumption rate include rapid population expansion, growing urbanization, industrialization, commercialization, energy subsidies and the increasing visitor rate. There is also more need of air conditioning due to warming (Ahmad, 2018). However, if all the sea area identified as suitable was allocated to offshore wind production, half the consumption could be supplied by this single renewable resource. The NREAP target for generating 5% of capacity from renewable sources by 2025 appears to be achievable.
Wind is an intermittent resource. Assuming a CF of 0.448, the potential 5.97 TWh annual wind energy yield could theoretically satisfy one-fifth of consumption. However, peak production and demand times may seldom match. Future research should investigate storage or solar-wind combination to meet Bahrain’s energy needs.
Anticipated developments in floating turbines mean that this research will soon need to be repeated because this possibility will significantly change the optimal areas and locations for offshore wind farms. Floating foundations will enable construction in deep water sites, further from land and with higher wind strength. As costs come down, they may also be introduced into mid-depth (30–50 m) areas, where they have less environmental impact than fixed foundation structures. Floating wind farms are expected to become commercially viable between 2020 and 2025 (IRENA, 2016).
Despite a portion (8%) of Bahrain’s EEZ having a water depth of over 50 m and many restrictions existing in the maritime area, offshore wind may still make a substantial contribution to the Kingdom’s energy requirements.
The results of site location models are affected by data quality. All layers were restricted to the same cell size (1 km resolution) as the bathymetry file because the maximum accuracy possible is that of the largest cell size of the input data.
This analysis weighted layers by cost-related scores.
The final map of the locations suitable for offshore wind produced by the AHP methodology provides developers and government ministries with an indication of potential. Installation will require detailed onsite surveys.
Conclusion
The potential of the wind energy resource in Bahraini waters has been analyzed. It was found that a substantial contribution to the supply of the Kingdom’s energy requirements from offshore wind is feasible. The objectives of this study were to investigate whether construction of wind farms offshore of Bahrain is an achievable RE option, to pinpoint optimal sites for these installations through mapping of constrained areas and identification of opportunities and to estimate potential power production from offshore wind.
GIS was used as an efficient means to prepare and assess map layers of spatial variables. This was the first step in a five-stage multi-criteria model. The consecutive steps were area exclusion, area suitability ranking with AHP, investigation of competing uses of Bahrain’s territorial waters and finally calculation of potential wind energy yield. The process presented was successful in providing a suitability map for offshore wind farms in Bahrain. Sensitivity analysis demonstrated that the results are robust because they are not influenced by decisions taken in the methodology.
This research fills a gap in knowledge. No detailed studies of potential energy production from offshore renewables have previously been conducted for Bahrain. The model sequence employed in this study enables the scientific and objective selection of 407 km2 (∼4% of territorial waters) as optimal locations for offshore wind farms in Bahrain. This work evinces the capability of offshore wind to contribute to Bahrain’s future RE mix.
Footnotes
Author contributions
The funders had no role in the design of the study; in the collection, analyses or interpretation of data; in the writing of the article or in the decision to publish the results.
Declaration of conflicting interests
The author(s) declared no potential conflicts of interest with respect to the research, authorship, and/or publication of this article.
Funding
The author(s) disclosed receipt of the following financial support for the research, authorship, and/or publication of this article: This work was conducted within ‘Technical Integration of Sustainable Energy and Water (TISEW)’, a collaboration between Loughborough University and the University of Bahrain, and supported by the grant 279332548, under the UK-Gulf Institutional Links Programme. The grant is funded by the UK Department for Business, Energy and Industrial Strategy and delivered by the British Council. The projects funders were not directly involved in the writing of this article.