
Abstract
Background:
Non-contact scanners may have potential for measurement of residual limb volume. Different non-contact scanners have been introduced during the last decades. Reliability and usability (practicality and user friendliness) should be assessed before introducing these systems in clinical practice.
Objectives:
The aim of this study was to analyze the measurement properties and usability of four non-contact scanners (TT Design, Omega Scanner, BioSculptor Bioscanner, and Rodin4D Scanner).
Study design:
Quasi experimental.
Methods:
Nine (geometric and residual limb) models were measured on two occasions, each consisting of two sessions, thus in total 4 sessions. In each session, four observers used the four systems for volume measurement. Mean for each model, repeatability coefficients for each system, variance components, and their two-way interactions of measurement conditions were calculated. User satisfaction was evaluated with the Post-Study System Usability Questionnaire.
Results:
Systematic differences between the systems were found in volume measurements. Most of the variances were explained by the model (97%), while error variance was 3%. Measurement system and the interaction between system and model explained 44% of the error variance. Repeatability coefficient of the systems ranged from 0.101 (Omega Scanner) to 0.131 L (Rodin4D). Differences in Post-Study System Usability Questionnaire scores between the systems were small and not significant.
Conclusion:
The systems were reliable in determining residual limb volume. Measurement systems and the interaction between system and residual limb model explained most of the error variances. The differences in repeatability coefficient and usability between the four CAD/CAM systems were small.
Clinical relevance
If accurate measurements of residual limb volume are required (in case of research), modern non-contact scanners should be taken in consideration nowadays.
Keywords
Background
The residual limb of adults with transtibial amputation changes substantially in shape and volume during the postoperative recovery period. Even when the residual limb is “mature,” daily fluctuations in volume occur.1,2 Clinically these fluctuations are relevant because volume and shape influence prosthetic fitting. Residual limb volume should therefore be stable or leveled off sufficiently before definitive prosthetic fitting. However, accurate measurement of residual limb volume remains challenging, due to patient and measurement related factors such as subject movement, post doffing volume change, distortion of limb shape, accuracy, and resolution of the system.3,4
Several methods for residual limb volume measurement have been used, such as the water immersion method,5–8 mathematical methods,7–9 ultrasound measurement, 10 (spiral) computed tomography scans,11,12 magnetic resonance imaging, 13 bio impedance measurements, 14 and computer-aided design/computer-aided manufacturing (CAD/CAM) systems, including non-contact scanners.7,8,15,16 Non-contact scanners have been developed to collect data about residual limb shape for prosthetic socket design. In two recent studies, the measurement properties of various methods for measuring residual limb volume were analyzed, including two non-contact scanners.7,8 Both studies reported that the reliability, expressed as a repeatability coefficient, of a non-contact, handheld laser scanner (Omega Tracer) was best.7,8 This suggests that non-contact scanners have good potential for the measurement of residual limb volume. In addition, they can be easily implemented in clinical practice.
In the last decades, a number of non-contact scanners have been introduced, such as the Omega (structured light) Scanner (Ohio Willow Wood, Mt. Sterling, OH, USA), TT Design system (Otto Bock, Duderstadt, Germany), Biosculptor Bioscanner (Biosculptor, Hialeah, FL, USA) and Rodin4D O&P Scanner (Rodin4D, Pessac, France). These systems differ in the way they provide three-dimensional (3D) models of scanned surfaces, the software they use to process the data, and in how the systems are influenced by environmental conditions, such as ambient light and the presence of metal objects. These conditions could influence measurement properties of each system. Good measurement properties and usability are essential, especially when using these systems in clinical practice. Until now, however, the specifications for the measurement properties of volume of residual limb models and of patients with a transtibial amputation have been published only for the Omega Tracer laser scanner and TT Design.7,8 The measurement properties of the Omega (structured light) Scanner, Biosculptor Bioscanner, and Rodin4D O&P Scanner have not been published. To compare the clinical relevance of these systems, the technical measurement errors and usability (practicality and user friendliness) of all systems should be assessed.
The aim of this study was to analyze the reliability and usability of four different CAD/CAM systems (TT Design, Omega (structured light) Scanner, BioSculptor Bioscanner, and Rodin4D O&P Scanner).
Methods
This study used a repeated measures experimental design to assess repeatability (intra-observer and test–retest reliability), validity, and usability (a safe, affordable, fast, and easy to use system) of four CAD/CAM systems. 17 To be able to analyze the system and observer measuring error, models were used to exclude variation in residual limb volume as a source of error. Geometric models were used to determine criterion validity of the CAD/CAM systems because the genuine volume can be derived from the geometric models mathematically.
Residual limb and geometric models
Six residual limb models (number 1–6), fabricated by OIM Orthopedie (Orthopedische Instrument Makerij; Zwolle, The Netherlands) using prosthetic casts of six patients who underwent amputation, and three geometric models were used. These models consisted of one cylindrical (number 7) and two conical models (numbers 8 and 9). Residual limb models were chosen randomly. The models were made of Pedilen Rigid Foam 300 and differed in size and shape. Three of the prosthetic casts of patients had a more conical shape, while the other three had a more voluminous shape. During measurement sessions, the models were attached to a metal-free standard (Figure 1).
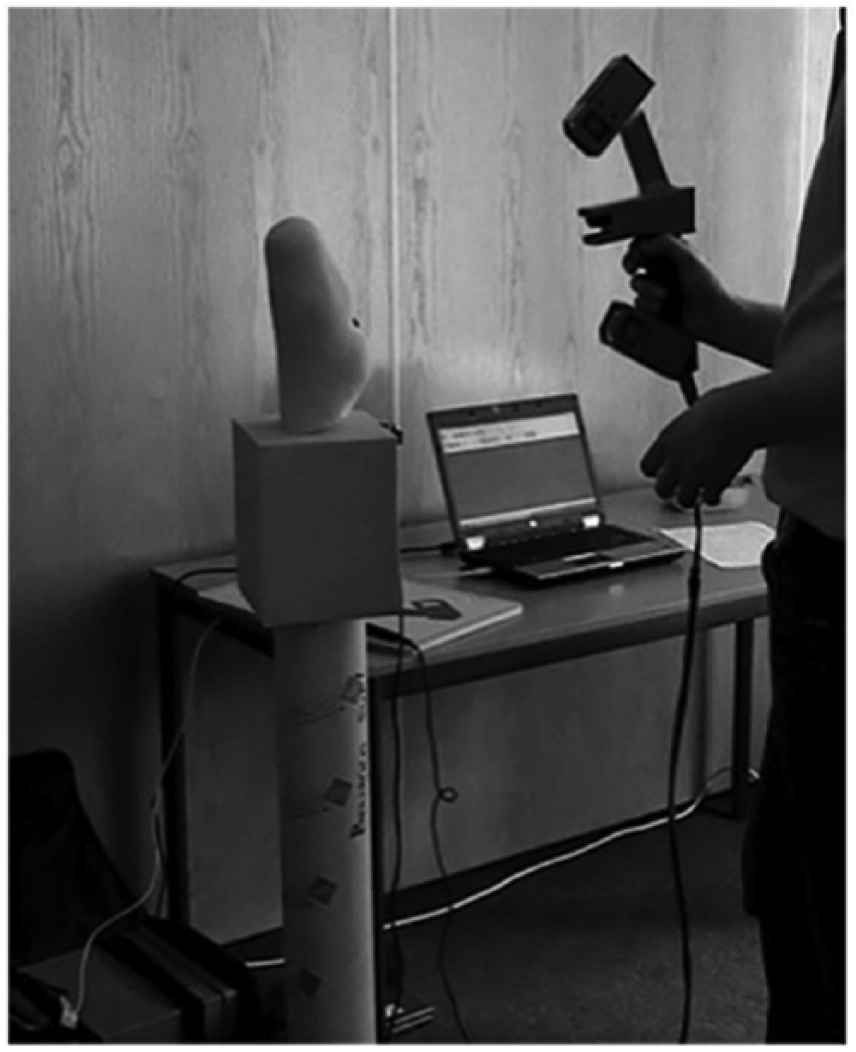
An example of the metal-free standard.
Observers
Four observers performed the measurements: a resident in rehabilitation medicine, a resident in neurology (with intention to become a rehabilitation medicine resident), a physical therapist, and a certified prosthetist and orthotist at OIM Orthopedie. Only the certified prosthetist and orthotist had previous experience with one of the CAD/CAM systems (the TT Design).
Design
The observers needed two training sessions of 1 h to familiarize themselves with the CAD/CAM system. Each model was measured on two occasions in between February and July 2014 by all four observers. On each occasion two sessions were performed, with a total of four sessions per model. During each session, each observer measured all models using all four of the CAD/CAM systems. In total, 64 measurements (four systems × four observers × four sessions) were performed per residual limb model. However, the Omega (structured light) Scanner could not measure the geometric figures due to scanning difficulties on smooth surfaces and was therefore only used to measure the residual limb models. As a result, 48 measurements were performed on each geometric model.
The observer sequence for each session was determined through randomization, using multiple sets of sealed envelopes. Observers were blinded to the measurement results of the other observers and to the measurement results of previous sessions.
Measurement systems
To minimize differences in measurement procedures between the sessions, three dots were placed on each residual limb model to determine the mid-patellar tendon point, tibial crest, and supracondylar level. A removable (elevated and pointed) marker was placed on top of the mid-patellar tendon dot in order to identify it on the 3D view.
To standardize environmental conditions (i.e. ambient light, temperature, and presence of metal objects) for each measurement, all CAD/CAM systems were placed in the same room. All systems were positioned at least 2 m from each other. The volume of the model was calculated from the distal end of the model to the mid-patellar tendon point. The removable marker was replaced between the two occasions to mimic the clinical situation more closely.
BioSculptor Bioscanner
The BioSculptor Bioscanner uses a dual-camera laser-line scanner. The model is scanned via a handheld scanning wand, which uses a motion-tracking device embedded in the scanner. The data are imported into the BioSculptor Shape Software to create a 3D view of the model.
TT Design
The TT Design system uses two digital photographs of the model: anterior side and lateral side, both against a black background. Distances and volumes are calculated using a calibration device, which is placed on the model, directly under a marked dot indicating the mid-patellar tendon point. The photographs are loaded into the software program to create a 3D view of the model.
Omega Scanner
The Omega Scanner is a handheld 3D structured light scanner. The scanner picks up distortion in the pattern to determine the shape of the model. The captured images are imported in the Omega Tracer Software to create a 3D view of the model.
Rodin4D O&P Scanner
The Rodin4D O&P Scanner is similar to the BioSculptor Bioscanner, but consists of one camera instead of two. Data are imported into the Rodin4D Software to create a 3D view of the model.
After creating the 3D view of the model, each observer aligned the model in the software program and selected the correct cut-off points (distal end of the model, mid-patellar tendon point) in the software program. The software programs then calculated the volume.
Clinical usability
Clinical usability of the different CAD/CAM systems was evaluated using the Post-Study System Usability Questionnaire (PSSUQ), 18 a 19-item instrument designed to measure user satisfaction with system usability. It includes the subscales overall satisfaction, system usefulness, information quality, and interface quality (reliability ranging from 0.83 to 0.96). Each construct is measured with a 7-point scale. Lower scores indicate a better usability. The questionnaire was completed after the training session and at the end of the study. Each observer completed a questionnaire for each CAD/CAM system twice, resulting in 32 completed questionnaires (four observers × four systems ×two occasions). Finally, as part of the clinical usability component, each observer registered the total time investment using a stopwatch. This included the time needed to work up each system to be ready to use, the time necessary to complete a session with each system, and the time needed to break down the system.
Statistical analysis
All statistical analyses were performed in the Statistical Package for the Social Sciences (IBM SPSS statistics 22).
For reliability testing, variance components and their two-way interactions were calculated for the measurement conditions (occasions, sessions, observers, systems, and models), using analysis of variance (ANOVA, type III sum of squares). Negative variance components were set to zero. Error variance was calculated as the sum of all variance components minus model variance. The contribution of the different measurement conditions to the error variance was expressed as a percentage. The repeatability coefficients were additionally calculated for each system using one-way ANOVA with model as factor. The repeatability coefficient was calculated as 1.96 × √2 × √residual variance (standard deviation (SD)). A small repeatability coefficient indicates a more reliable system.
To analyze criterion validity, the volume of the geometric models was calculated mathematically (volume cylinder = π × r2 × h, volume cone = 1/3 × π × r2 × h, where h is the height and r is the radius) and compared with the volume measured with the CAD/CAM systems, using paired sample t-test.
To assess usability, means and SD of each subscale of the PSSUQ were calculated. Missing data were imputed by averaging the remaining domain scores. Total mean scores between the two questionnaires (before occasion one and after occasion two) of each system were compared, using the Wilcoxon signed rank test. Total time investment between observers and the different CAD/CAM systems was analyzed using a mixed model analysis. Significance level was set at p < 0.05.
The Medical Ethical Committee (METC) of the Isala Clinics, Zwolle, has approved this study (reference number 170421).
Results
The mean and SD per model and system are shown in Table 1. Overall, the Biosculptor Bioscanner measured larger volumes (mean 1.319 L) and the TT Design smaller volumes (mean 1.173 L). The differences between volume measurements as measured with the systems and the mean volume per model are shown in Figure 2. The differences were normally distributed. The range of distribution was large for the cylindrical model (number 7). There were two outliers, one measured with the Omega Scanner and one measured with the Rodin4D. The outlier of the Omega Scanner initially appeared to be related to a recording error. When the measurement result was divided by 10, it was similar to the other measurements. However, after questioning the corresponding observer, the data appeared to be well recorded. Model number 9, the conic model, shrank between the two occasions. The shrinkage could be observed visually and was probably due to a hole within the material or incorrect use of drying of the foam. After questioning the certified prosthetist and orthotist, no other factors could explain this shrinkage.
Mean (SD) per model and system in liters based on all measurements performed per model or per system.
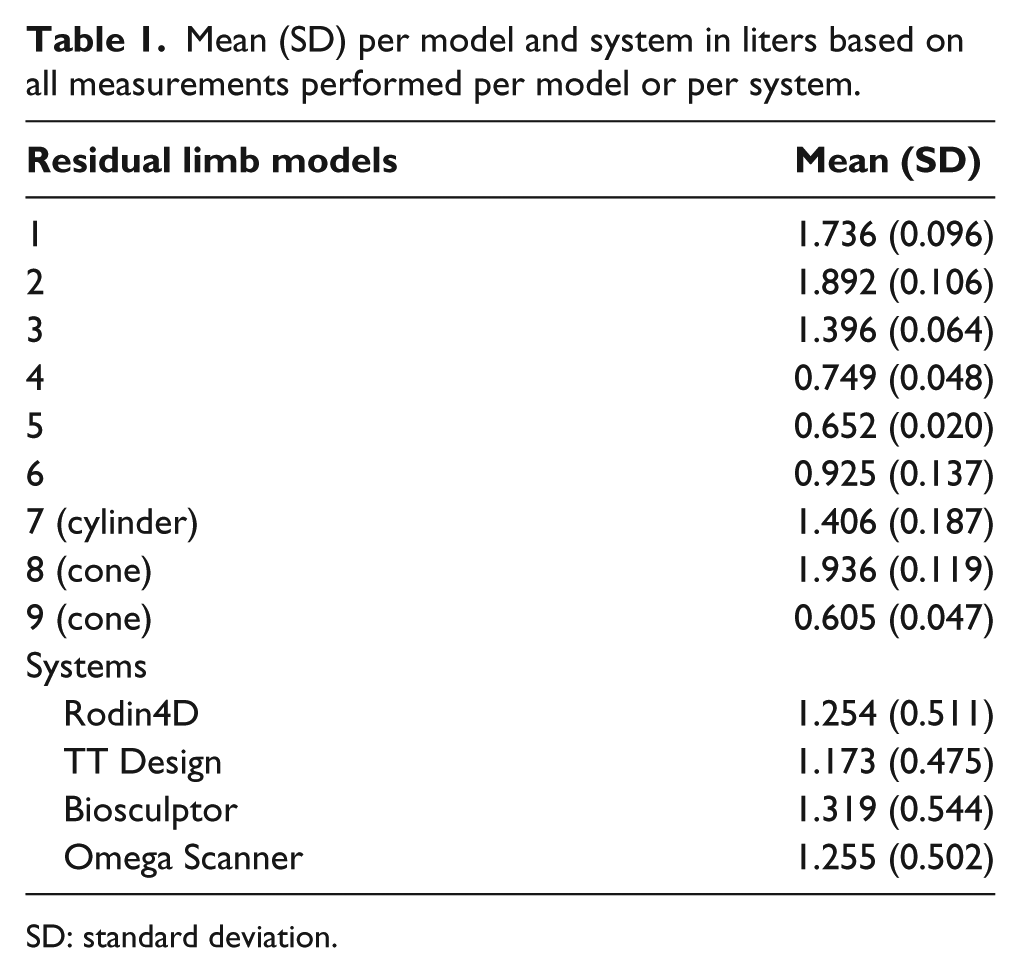
SD: standard deviation.
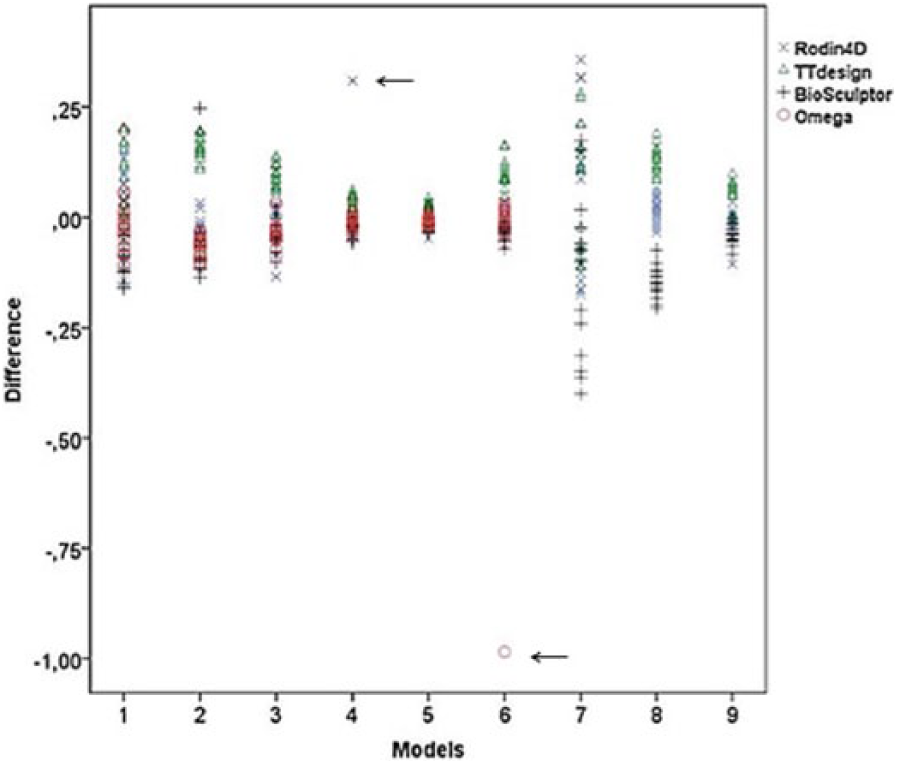
A scatterplot showing the differences per model between the mean and the volume as measured with the different systems (in L). There were two outliers (arrows) (Omega Scanner (model 6) and Rodin4D (model 4)).
Reliability
Most of the variances were explained by the model (96.9% for the residual limb models and 94.5% for the geometric models) (Table 2). The error variance was 3.1% of the total variance for the residual limb models and 5.5% for the geometric models. A substantial part of the error variance (44.3% and 42.3%, respectively) was explained by the measurement system and the interaction between system and model. For the residual limb models, a small part of the variance was explained by the interaction between observer and system (1.4%) and between observer and occasion (3.3%). For the geometric models, a substantial part of the variance was explained by the interaction between model and occasion (32.8%) and a small part was explained by observer (1.3%) and interaction between occasion and session (3.4%). The residual error (unexplained) was 49.0% and 20.2%, respectively, of the error variance.
Estimated variance components of the measurement conditions of the models, including two-way interactions, and their contribution, in percentages (%), to the error variance.
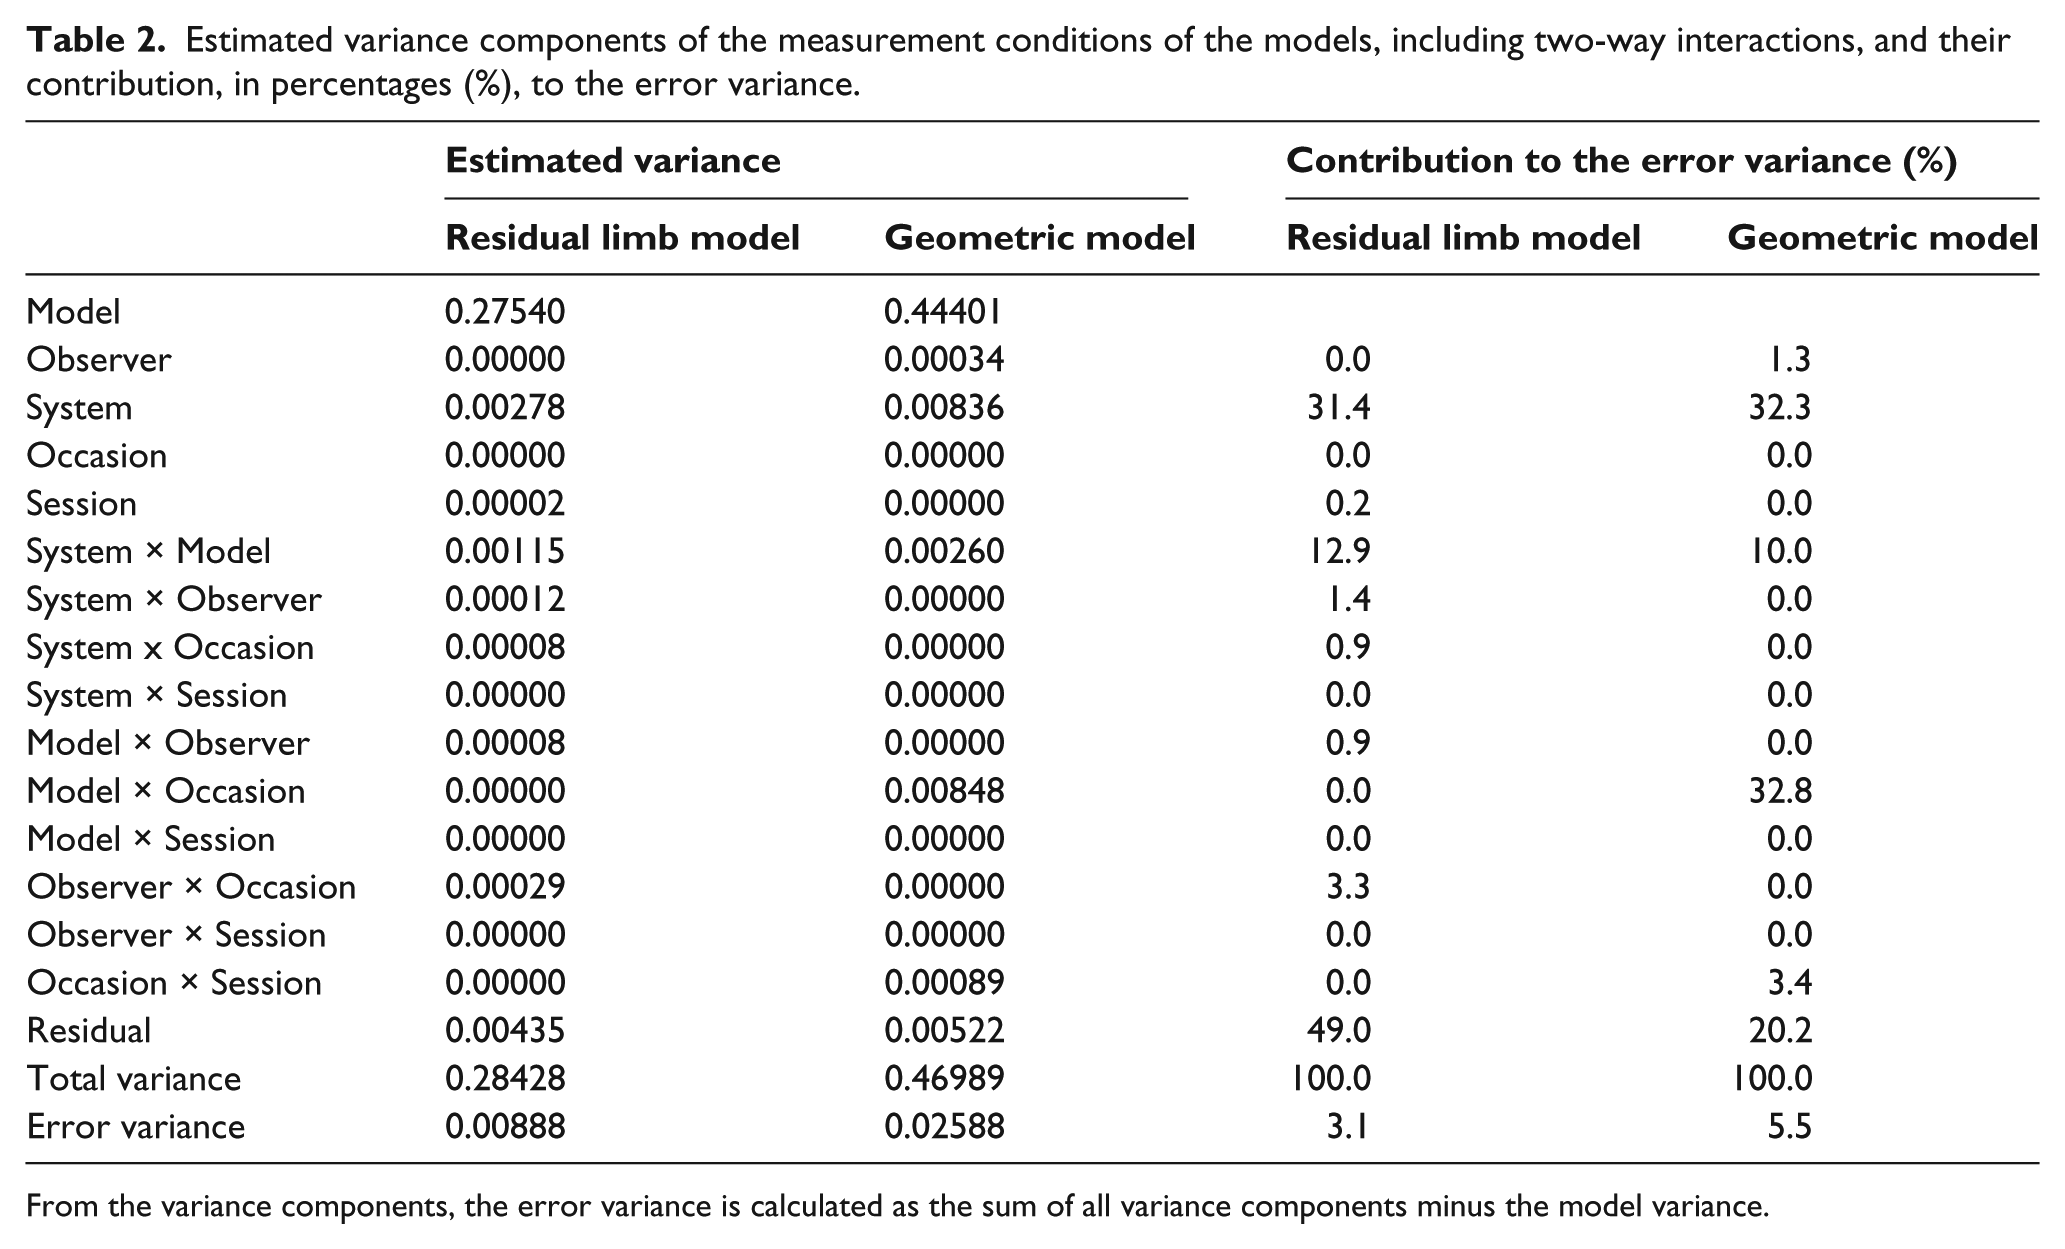
From the variance components, the error variance is calculated as the sum of all variance components minus the model variance.
For the residual limb models, the TT Design showed the lowest repeatability coefficient (0.112 L) and the Omega Scanner the highest (0.296 L) (Table 3). After excluding the outliers from the analyses, the Omega Scanner showed the lowest repeatability coefficient (0.101 L) and the Rodin4D the highest (0.131 L). The repeatability coefficient of the systems for geometric models ranged between 0.230 (TT Design) and 0.303 L (Rodin4D).
Repeatability coefficient for different models measured with each system and by different observers.
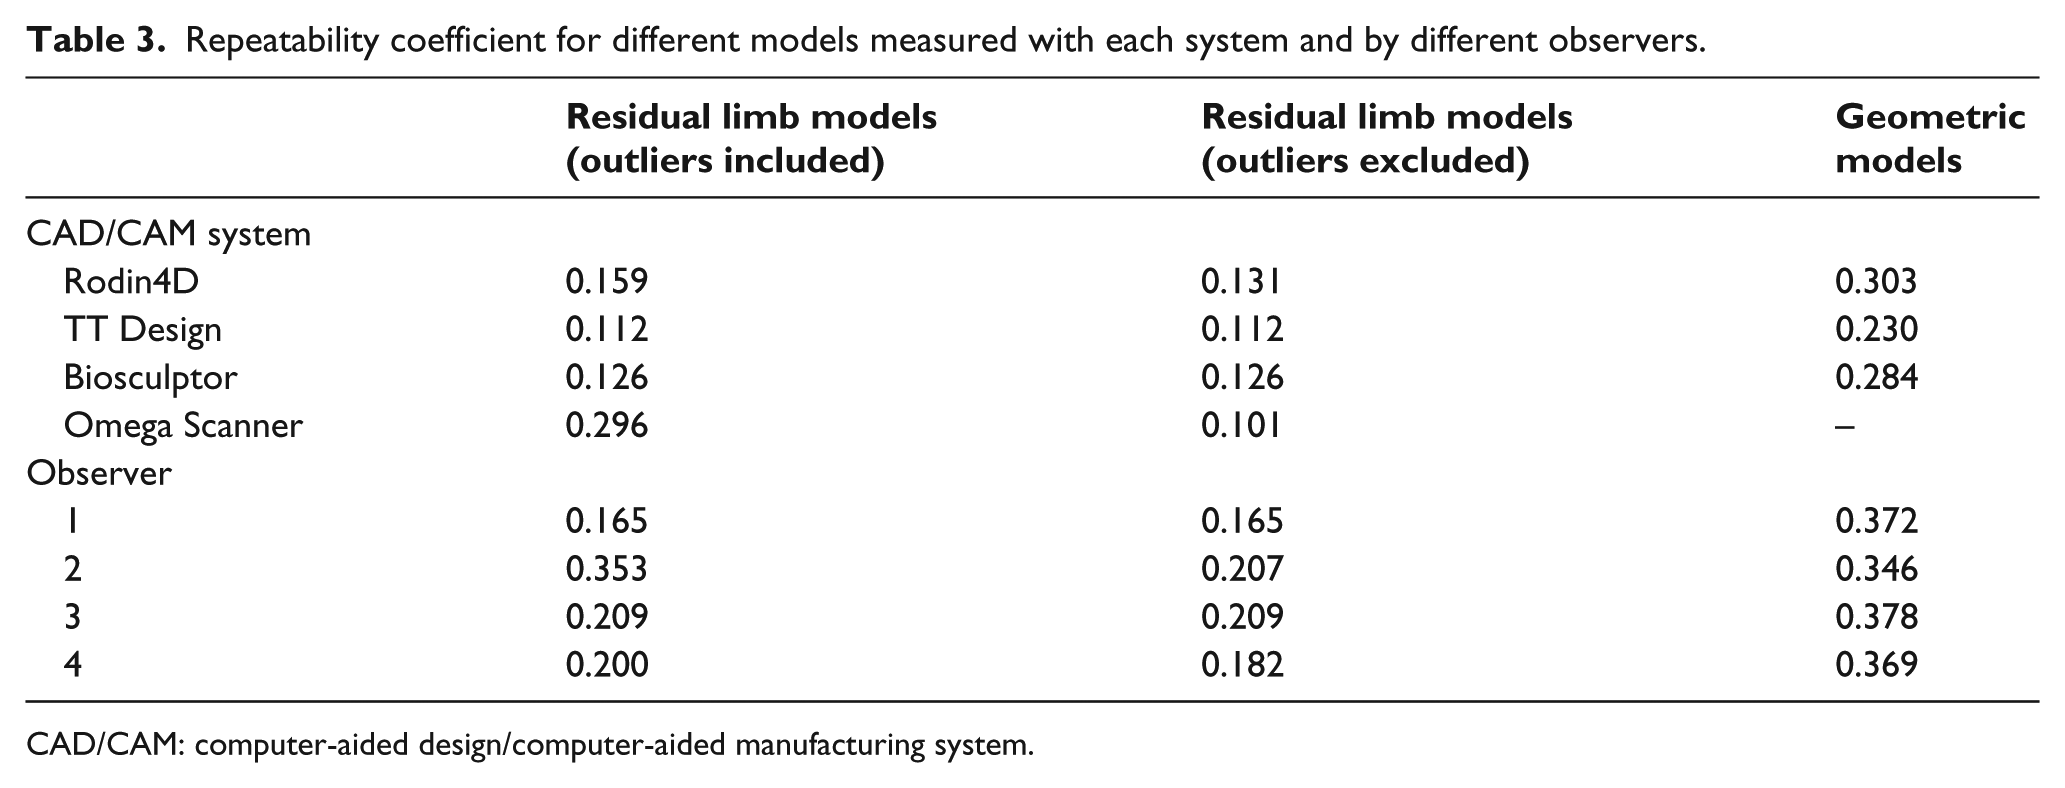
CAD/CAM: computer-aided design/computer-aided manufacturing system.
Criterion validity
The measurement results of the Rodin4D and the TT Design differed significantly from the mathematical calculated volumes and the volume measured with the systems. SDs were substantial ranging from 0.124 to 0.155 L (Table 4).
Comparison of the mathematically determined volume of the geometric models and mean volume as measured with the Rodin4D, TT Design, and Biosculptor.
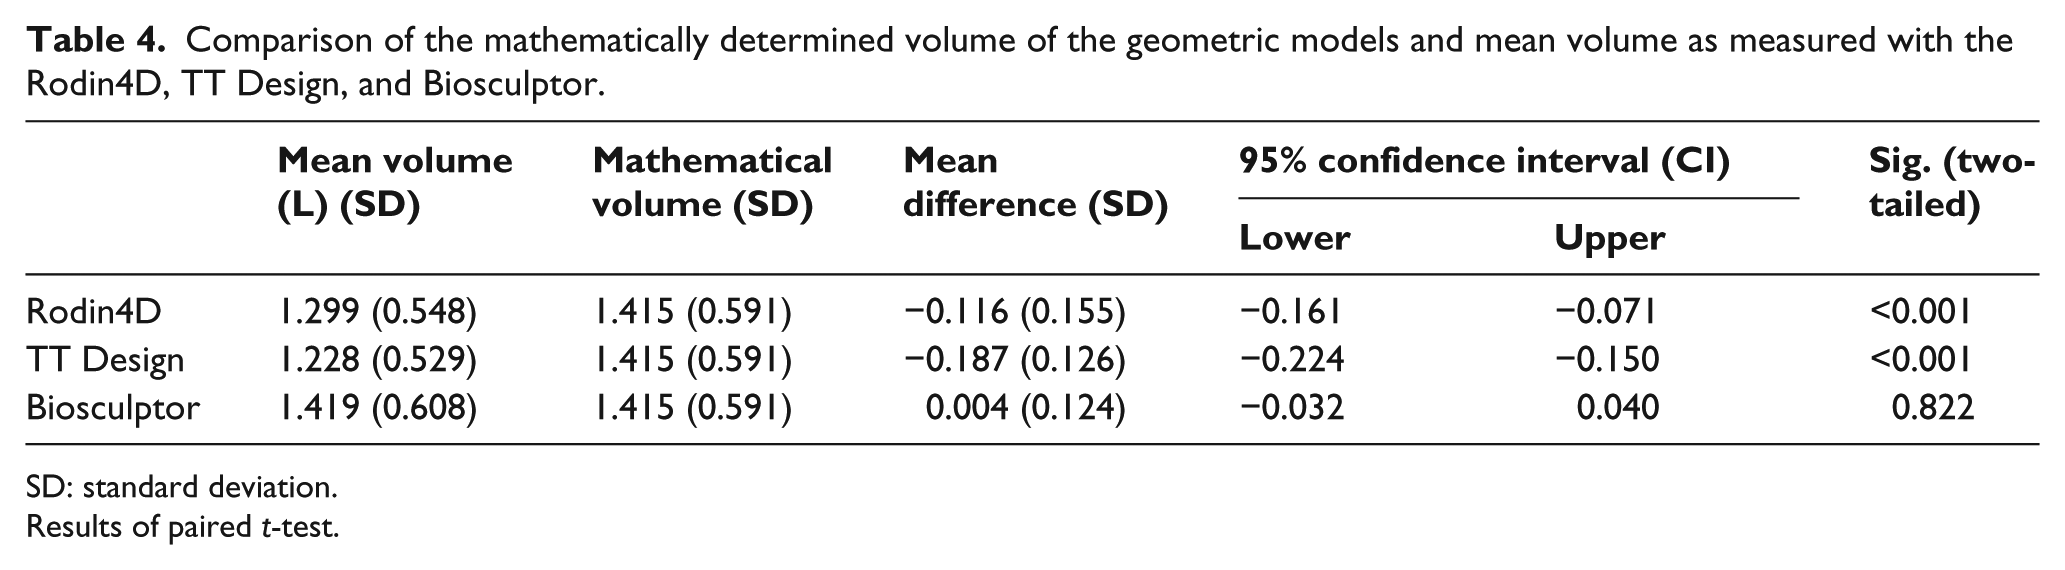
SD: standard deviation.
Results of paired t-test.
Usability
For the PSSUQ scores overall, the total mean scores of the Rodin4D were high (3.60). The total mean scores of the TT Design, Omega Scanner, and Biosculptor Bioscanner were 2.21, 2.55, and 2.76, respectively. At the second occasion, the mean scores of all systems, except for the Omega Scanner, were higher than the mean scores at the first occasion, but not significantly higher (details not shown). At the second occasion, the Omega Scanner showed lower scores for the subscale “System Usefulness,” indicating a better usability.
There was no significant difference in total time investment between the systems (ranging between 3.42 and 4.26 min for each measurement).
Discussion
Our study assessed measurement properties and usability of four different CAD/CAM systems. The error variance was small compared to the total variance (3.1% for the residual limb models and 5.5% for the geometric models), indicating a satisfactory reliability. Measurement system explained, respectively, 31.4% and 32.3% of the error variance. This means that systems differ structurally in their measurement results. An explanation for these findings might be that the formula used in the software to calculate the volume has a structural error.
The interaction between system and model contributed, respectively, 12.9% and 10.0% to the error variance. This means that one system gives larger volumes for certain models and smaller volumes for other models and vice versa for other systems. This finding is in agreement with the results of previous studies demonstrating that volume measurement can be influenced by the shape of a residual limb model.8,19 For the geometric models, a substantial part of the error variance was explained by the interaction of model and occasion (32.8%). This indicates that on the first occasion, larger volumes for certain models and smaller volumes for other models were measured and vice versa. This could be explained by the fact that one of the geometric models (model 9) changed in shape between the two occasions. Overall, it should be kept in mind that the error variance was very small compared to the variance explained by the models.
Although the reliability is satisfactory (error variance of 3%), the repeatability coefficients for the different systems and (residual limb and geometric) models seem large. There were two outliers with the Omega Scanner and Rodin4D scanner. A possible explanation for these outliers could be hardware (technical) problems, such as distortion of the pattern due to direct sunlight or disturbance of the calibration device. Another explanation could be observer-related problems due to excessive speed or fatigue, such as skipping some crucial steps in the software program or recording wrong numbers. The outliers could also be due to the different clinical backgrounds and experience of the observers using the CAD/CAM systems. But due to these different backgrounds and experiences, differences in usability of the systems could be studied. When the outliers were excluded, the repeatability coefficient fell from 0.101 (for the Omega Scanner) to 0.131 L (for the Rodin4D) in residual limb models. A repeatability coefficient of 0.101 indicates that, independent of the measurement conditions, 95% of the subsequent measurements with this system will fall within 0.101 from the initial measurement. So, to measure an actual change of residual limb volume with this system, the change in volume must exceed 0.101 L. Overall, the differences in repeatability coefficients between the four systems were small (maximum of 0.030 L). This small difference may suggest that other factors (such as the number of observers, the experience of observers in using the system, the alignment of the 3D view of the models in the different software programs, choosing the correct cut-off point in the software program, using fixed markers) might contribute to the large repeatability coefficients, more than the CAD/CAM system itself. Choosing the correct cut-off points is especially important, since the systems calculate volume in the same way each time using that cut-off point. Hence, choosing the point with support of the markers is probably a source of variation in measurement results.
Our repeatability coefficients were substantially larger than those found previously: 0.045 (Omega Tracer laser scanner) and 0.087 L (Design TT). 8 In that same study, two observers performed the assessments. Our study included four different observers, which might have contributed to the error variance (Table 2). Additionally, in this study, the removable (elevated and pointed) marker was replaced between the two occasions, which could also explain the larger repeatability coefficient. Table 2 shows that 4.2% of the error variance is related to occasion (System × Occasion: 0.9% and Observer × Occasion: 3.3%). The marker was replaced between the occasions because it mimics the clinical situation better. To minimize variation in measurement procedures, fixed markers (such as a water resistant marker) are advised in future research and clinical practice.
The foam used for the models manufacturing might also have influenced error variance. The systems were developed to measure a skin residual limb or liner surface, which was not used in this study. Because the CAD/CAM systems did not always capture the image of the foam model correctly, it is likely this particular error would decrease when the systems are used for actual amputee patients.
Our repeatability coefficients are smaller than those found previously in patients with a transtibial amputation. 7 In that study, however, the repeatability coefficients were expected to be larger due to actual volume change between sessions, muscle contraction, or movement of the residual limb by the patients. 3
Currently, no guidelines are available on how reliable a measurement system should be. The clinical impact of the different repeatability coefficient depends on the size (length and diameter) of the residual limb. For various hypothetical cylindrical models (radius: 5, 6, and 7 cm and length: 8, 13, and 15 cm), the influence of the repeatability coefficient on the diameter was calculated (Table 5). The repeatability coefficient was added to the volume of the hypothetical cylindrical models and used to calculate the diameter of the new cylinder.
Change in diameter (in cm) of hypothetical cylindrical models with different sizes, when applying the different repeatability coefficients.
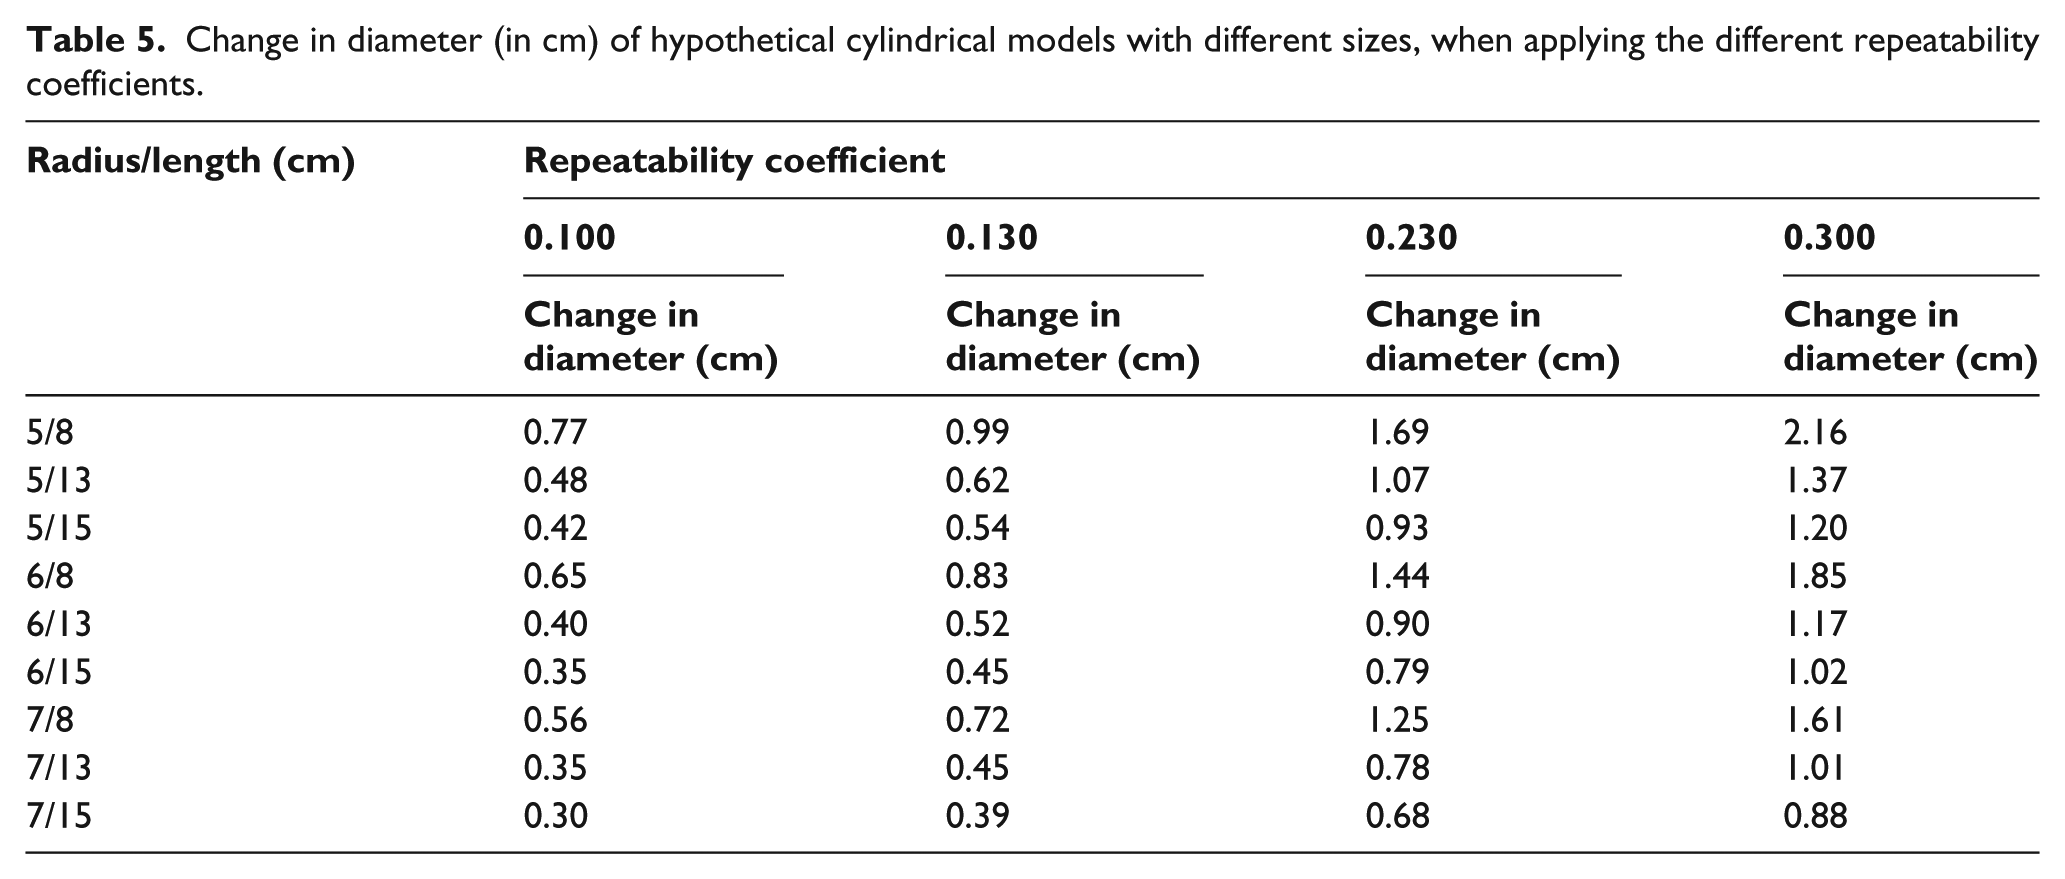
The change in diameter ranged from 0.30 to 2.16 cm (Table 5). This means that the change in radius is 0.15 to 1.08 cm, which corresponds to the use of a double sock thickness in clinical practice.
The criterion validity was analyzed using geometric residual limb models. Only the Biosculptor Bioscanner appeared to be valid (p = 0.822), but the SD varied substantially. In addition, there was a wide distribution of differences in measurements for the cylindrical model (as shown in Figure 2) and the repeatability coefficients of the geometric models were substantial larger than for the residual limb models (Table 3). In addition, we excluded the Omega Scanner from the validity assessment. This exclusion suggests that these systems have difficulties measuring volumes of geometric models. Therefore these results cannot be generalized to a patient setting. The measuring validity of residual limbs is still limited by the absence of a golden standard.
The TT Design showed the lowest total mean PSSUQ score (2.21), indicating better user satisfaction characteristics. At the second occasion, however, the total mean PSSUQ score of all systems, except for the Omega Scanner, was higher. When focusing on the subscales, the Omega Scanner showed lower scores at the second occasion at the subscale “System Usefulness,” while the other systems showed higher scores on this subscale. In addition, the Omega Scanner showed a relatively small increase in the scores at the subscale “Information Quality,” compared to the other systems. In summary, this suggests that during measurements, software and/or hardware problems were encountered during measurements, except for the Omega Scanner, which may have influenced user satisfaction. However, one should keep in mind that the Omega Scanner was excluded for measurements of geometric models, which may have positively influenced the results of the PSSUQ.
In future research, it is important to improve general measurement procedures (alignment, reference point for cut-off, permanent markers). The marker for the tibial crest was removed in between two occasions, which could have contributed to volume differences. In future research, it is also important to repeat this research with amputee patients, so the clinical usability and patient-observer-system interaction can be assessed.
Conclusion
The systems were reliable in determining residual limb volume. Measurement systems and the interaction between system and residual limb model explained most of the error variances. The differences in repeatability coefficient and usability between the four CAD/CAM systems were small.
Footnotes
Author contribution
All authors contributed equally in the preparation of this manuscript.
Declaration of conflicting interests
The author(s) declared no potential conflicts of interest with respect to the research, authorship, and/or publication of this article.
Funding
The author(s) received no financial support for the research, authorship, and/or publication of this article.