
Abstract
Background:
Active individuals with transfemoral amputations are provided a microprocessor-controlled knee with the belief that the prosthesis reduces their risk of falling. However, these prostheses are expensive and the cost-effectiveness is unknown with regard to falls in the transfemoral amputation population. The direct medical costs of falls in adults with transfemoral amputations need to be determined in order to assess the incremental costs and benefits of microprocessor-controlled prosthetic knees.
Objective:
We describe the direct medical costs of falls in adults with a transfemoral amputation.
Study design:
This is a retrospective, population-based, cohort study of adults who underwent transfemoral amputations between 2000 and 2014.
Methods:
A Bayesian structural time series approach was used to estimate cost differences between fallers and non-fallers.
Results:
The mean 6-month direct medical costs of falls for six hospitalized adults with transfemoral amputations was US$25,652 (US$10,468, US$38,872). The mean costs for the 10 adults admitted to the emergency department was US$18,091 (US$-7,820, US$57,368).
Conclusion:
Falls are expensive in adults with transfemoral amputations. The 6-month costs of falls resulting in hospitalization are similar to those reported in the elderly population who are also at an increased risk of falling.
Clinical relevance
Estimates of fall costs in adults with transfemoral amputations can provide policy makers with additional insight when determining whether or not to cover a prescription for microprocessor-controlled prosthetic knees.
Background
It is well-known that individuals with lower limb loss are at a higher risk of falling than those of the same age in the general population. About half of the individuals without a lower limb report falling in a 12-month period. Increased fall risk is accompanied with lower mobility, an increased fear of falling, and a reduced quality of life for those with lower limb amputations.1–3 These experiences are not dissimilar from those seen within the elderly population, where over 30% of adults over age 65 years experience a fall in a given year. 4 Falls within the elderly population are expensive, with one study estimating that the 6-month cost of a fall resulting in an admission to the hospital is US$27,745. 5 Geriatrics research is focused on low-cost interventions such as exercise programs to reduce falls, thereby reducing costs associated with these falls.4,6
Much of the progress in mitigating fall risks for individuals with transfemoral amputation (TFA) is focused on technological advances in the area of prosthetic design. Prosthetic knees have improved over the last two decades, namely with the advent of microprocessor-controlled knees (MPKs) which are thought to increase the ability of individuals with a TFA to ambulate more easily and reduce fall risk compared to previous prosthetic knees.7,8 Yet one study estimates that a MPK costs six to seven times as much as a mechanical knee; improvements in prosthetics do not come without an increased cost. 9 By 2050, the number of individuals in the United States with amputations is projected to double from 2005, creating a larger pool of individuals living with TFAs requiring prosthetic devices. 10
Providing more expensive prostheses in an era that demands high-value healthcare will only be justifiable if improved medical solutions for individuals living with TFAs can help avoid other healthcare encounters especially high cost events like falls. 11 To date, there are no estimates of the cost of falls in the TFA population; past research has looked at the Quality-Adjusted Life Years (QALY) associated with the provision of improved prostheses.9,12,13 Because there is some debate around the validity of QALYs, we seek to estimate the direct cost of falls within TFAs in hopes that this cost can be used to evaluate future care advancements for individuals with TFA. 14
Methods
Study population and cost data
The Rochester Epidemiology Project (REP; NIH AG034676) was used to identify all individuals with TFA, that is, knee disarticulation and TFA, residing in Olmsted County, MN, between 1987 and 2014. Briefly, the REP capitalizes on Olmsted County’s unique healthcare delivery structure where all residents receive their healthcare from two multidisciplinary medical groups and a few independent providers that have all agreed to share medical records for those patients who consent to their medical records being used for research. The REP not only links medical records across the healthcare providers in Olmsted County, MN, but also has associated cost data that are contained within the REP Cost Data Warehouse. 15 These unique circumstances in Olmsted County allowed us to capture nearly all costs associated with a fall that resulted in a visit to the emergency department or admission to the hospital dating back to 2000. The REP Cost Data Warehouse contains registration and billing data from the two major healthcare providers in Olmsted County: Mayo Clinic Rochester and Olmsted Medical Center along with their affiliated hospitals. The data contain unique patient identifiers that allow linkage across both institutions and to their medical records. The administrative data include ICD-9 procedure, Healthcare Common Procedure Coding System (HCPCS), and internal charge master codes for every service provided and billed as well as corresponding ICD-9 diagnosis codes. The REP Cost Data Warehouse also contains standardized inflation-adjusted estimates of the costs of billed services and procedures using micro-costing methodologies widely accepted in health services research. 16 Standardized facility costs for hospital inpatient and outpatient services were calculated by multiplying Medicare cost report department level cost-to-charge ratios by the services’ charges. Professional standardized costs were estimated using Medicare physician fee, lab, drug average sales price, and durable medical equipment fee schedules plus “gap code” fees from Optum’s “The Complete Resource-Based Relative Value Scale Data File.” All standardized costs were adjusted to 2014 dollars with the Gross Domestic Product as the implicit price deflator.17,18
The study cohort was identified using ICD-9-CM diagnosis, status, and procedures codes associated with TFA. After reviewing the medical records of the 217 individuals in Olmsted County identified as having a potential TFA, 163 individuals were confirmed as having a TFA between 1987 and 2014. Due to the fact that cost data were not available prior to 2000, 77 individuals were included in our cost analysis from 2000 to 2014 (Figure 1).
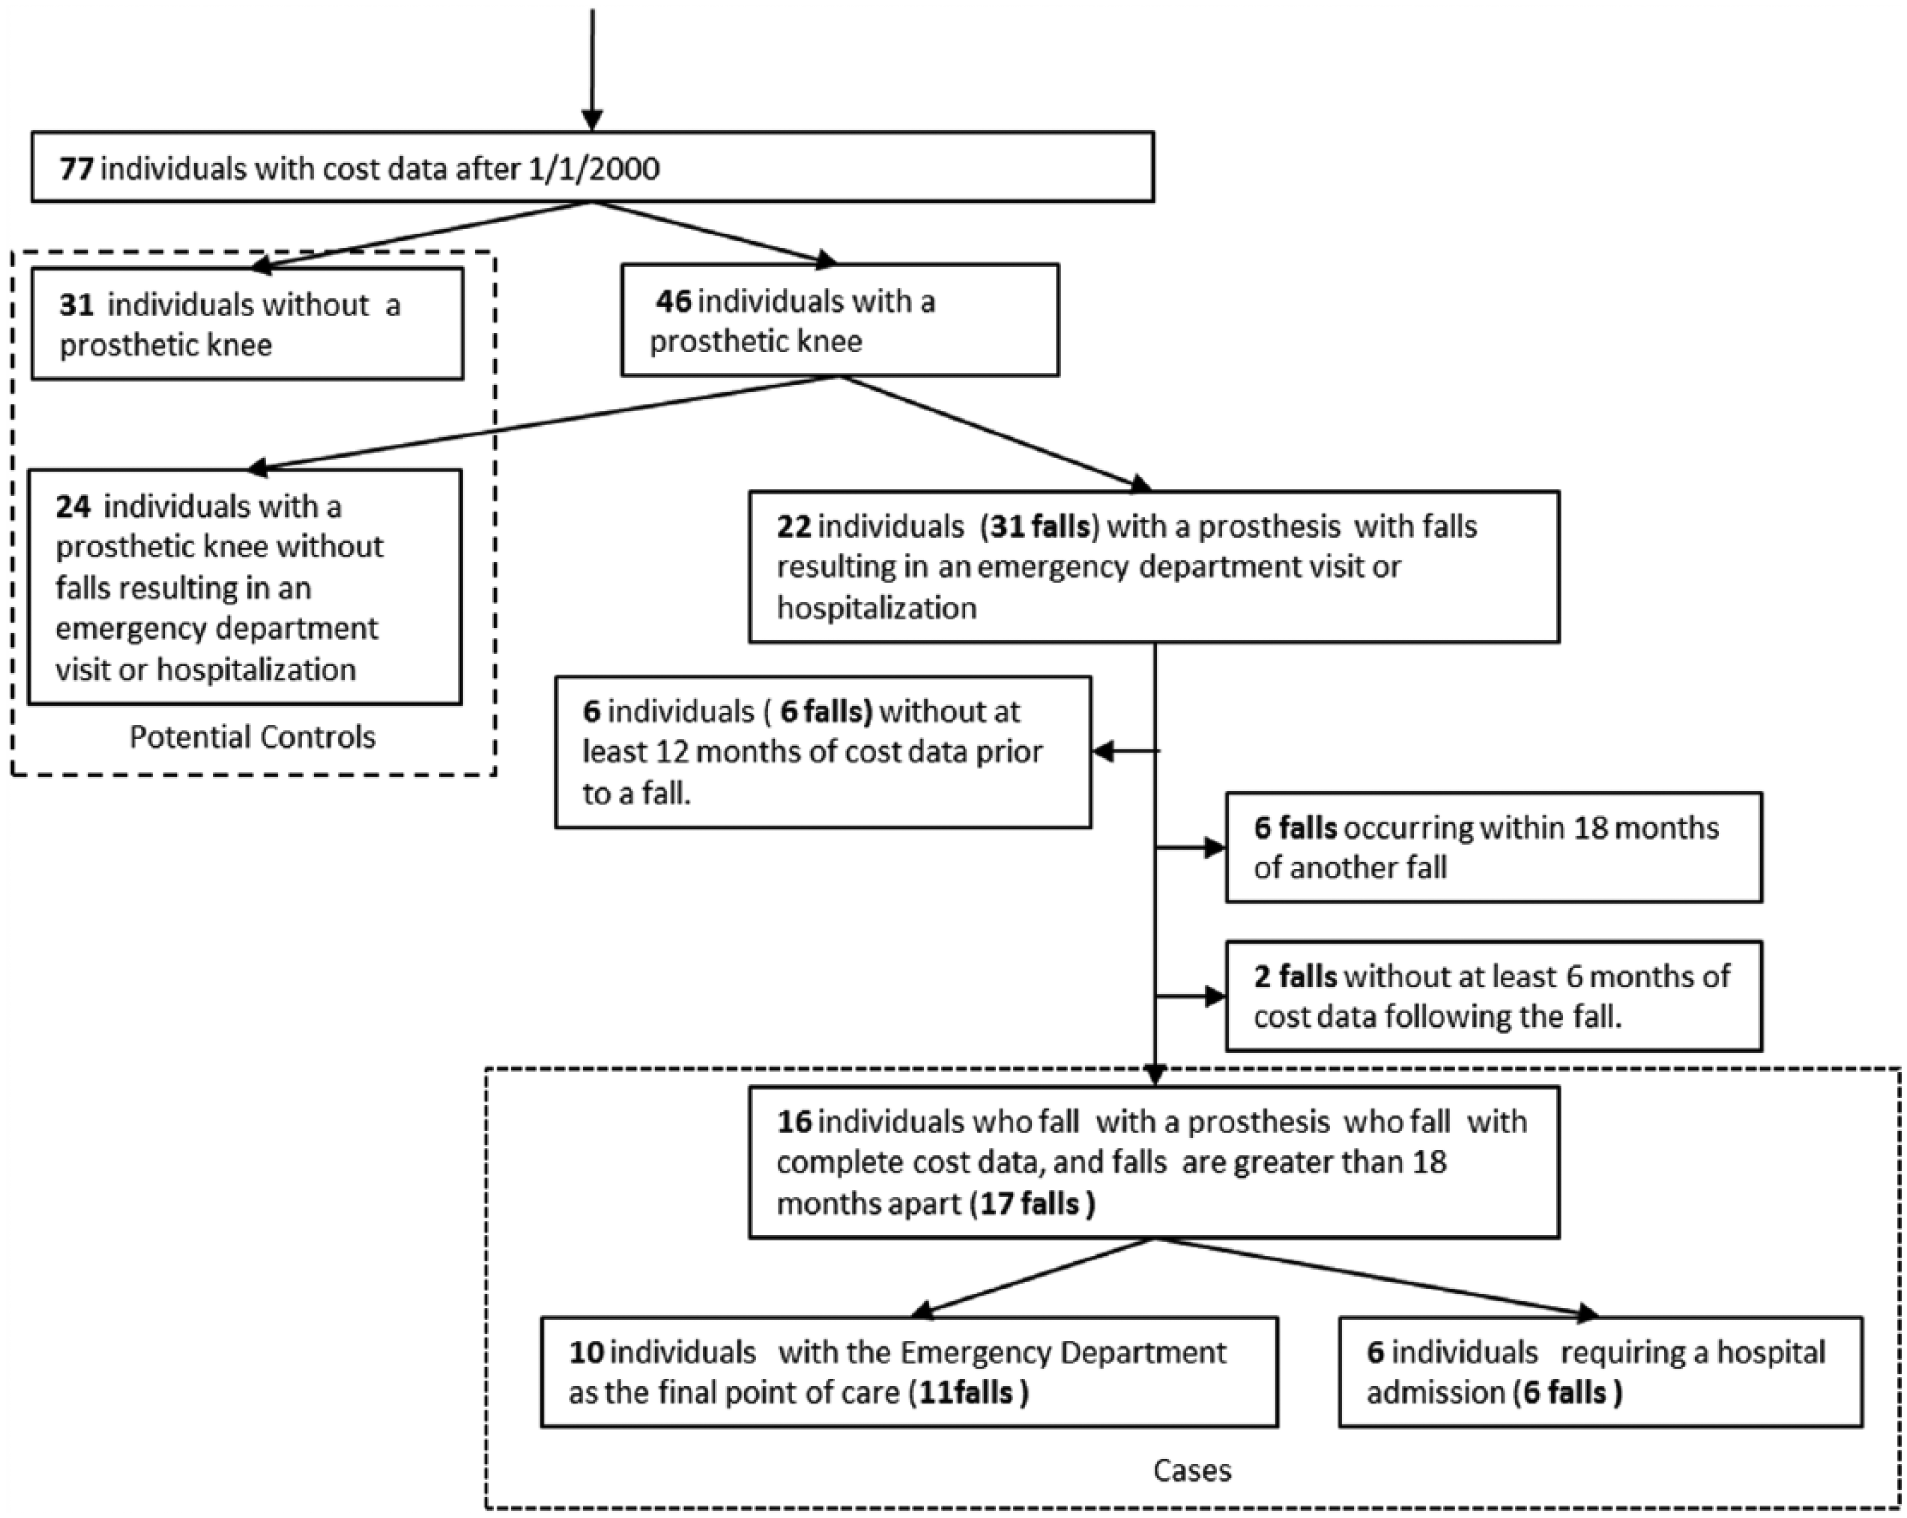
Selection of the study cohort.
Of those, 31 did not have a prosthetic knee and are not prosthetic users and 46 had a prosthetic knee. Medical records were then reviewed longitudinally to identify all falls and associated medical encounters, that is, emergency department visit only or hospital admission. Of the 46 individuals with prosthetic knees, 22 individuals experienced 31 falls. The modeling approach used by past studies looking at fall costs in the elderly population along with our chosen analytic methods led to the requirement that each fall have 12 months of cost data prior to the fall and 6 months of cost data following the fall.5,19 Falls occurring within 18 months of another fall were also eliminated as these falls could still have lingering cost effects that would bias the estimated 6-month cost of falls. These further restrictions resulted in six individuals being completely eliminated from the study along with eight falls for individuals who had multiple falls. We were left with 6 falls (6 individuals) that resulted in a hospitalization and 11 falls (10 individuals) that resulted in a visit to the emergency department. Data collection included information on demographics, etiology of the amputation, receipt of a prosthesis, and comorbidities using the Elixhauser algorithm. 20
Cost analysis
Previous studies that estimate the cost of falls in elderly patients utilized a general estimating equation model approach where fallers and non-fallers were matched based on age and sex with most of the fall costs occurring during the first 6 months after the fall. 21 This methodology requires a large dataset. Our population was much smaller with only 17 falls (16 individuals). In order to use as much of the data available, an adaptation of a Bayesian structural time series model was used to model the pre-fall cost trend. This model, based on one developed by Google to estimate effects of marketing campaigns on website traffic, 19 used the pre-fall direct medical costs to estimate the post-fall direct medical costs if the fall had not occurred.
As an overview, this analytic approach combined both a time series predictive element and a regression framework to use pre-fall cost trends to predict counterfactual post-fall cost trends. The trend estimates were further refined through a regression component that used additional variables that were predictive of the pre-fall cost trend. In our case the comorbidities and cost trends for other individuals with TFAs residing in Olmsted County at the same time as the faller of interest served as potential predictors used to refine the counterfactual post-fall costs. Assessing model fit was straightforward: predicted pre-fall costs were compared to observed pre-fall costs both visually and using 95% credibility intervals (overlapping 0 indicates a good fit on pre-fall data). Finally, predicted post-fall costs were subtracted from the observed post-fall costs to predicted post-fall costs to determine the cumulative cost of falls.
Previous studies for falls in the elderly reported cumulative 6-month costs of falls.5,21 This modeling approach required that the time period prior to the fall be at least double the time period after the fall so that pre-fall costs could be accurately estimated; additionally, using the same post-fall time period offers a more reasonable comparison to previous cost of fall estimates.5,21 With this in mind, we selected a pre-fall period of 12 months and a post-fall period of 6 months. All costs were aggregated to monthly costs and left in the original scale as predictions for healthcare costs have been shown to be accurate using a linear regression framework.22,23
The Bayesian regression component of the model allowed for the refinement of the time series estimates through the addition of any number of predictors associated with the costs and were selected using a spike–slab selection method.19,24 Predictors included the monthly Elixhauser Comorbidity Index (the sum of all the Elixhauser comorbidities present up to that month) and the monthly cost series for all the non-fallers, regardless of ambulation status, in the 18-month period of interest. All of the non-fallers acted as potential controls with their costs providing varying degrees of predictive power for the fallers’ pre-fall and post-fall costs. By matching only within the 18-month time period of interest for each faller, the inherent instability of individual service’s costs over time within the REP Cost Data Warehouse data was mitigated. All costs were transformed by adding a random dollar amount between US$0 and US$1 to ensure monthly costs of zero were handled correctly.
Results
During the 14-year period, we recorded 17 falls occurring in 16 individuals who met our inclusion criteria. The 16 individuals who fell were, on average, older than the 32 non-fallers with a prosthesis but younger than the 29 non-fallers without a prosthesis (Table 1).
Study cohort characteristics.
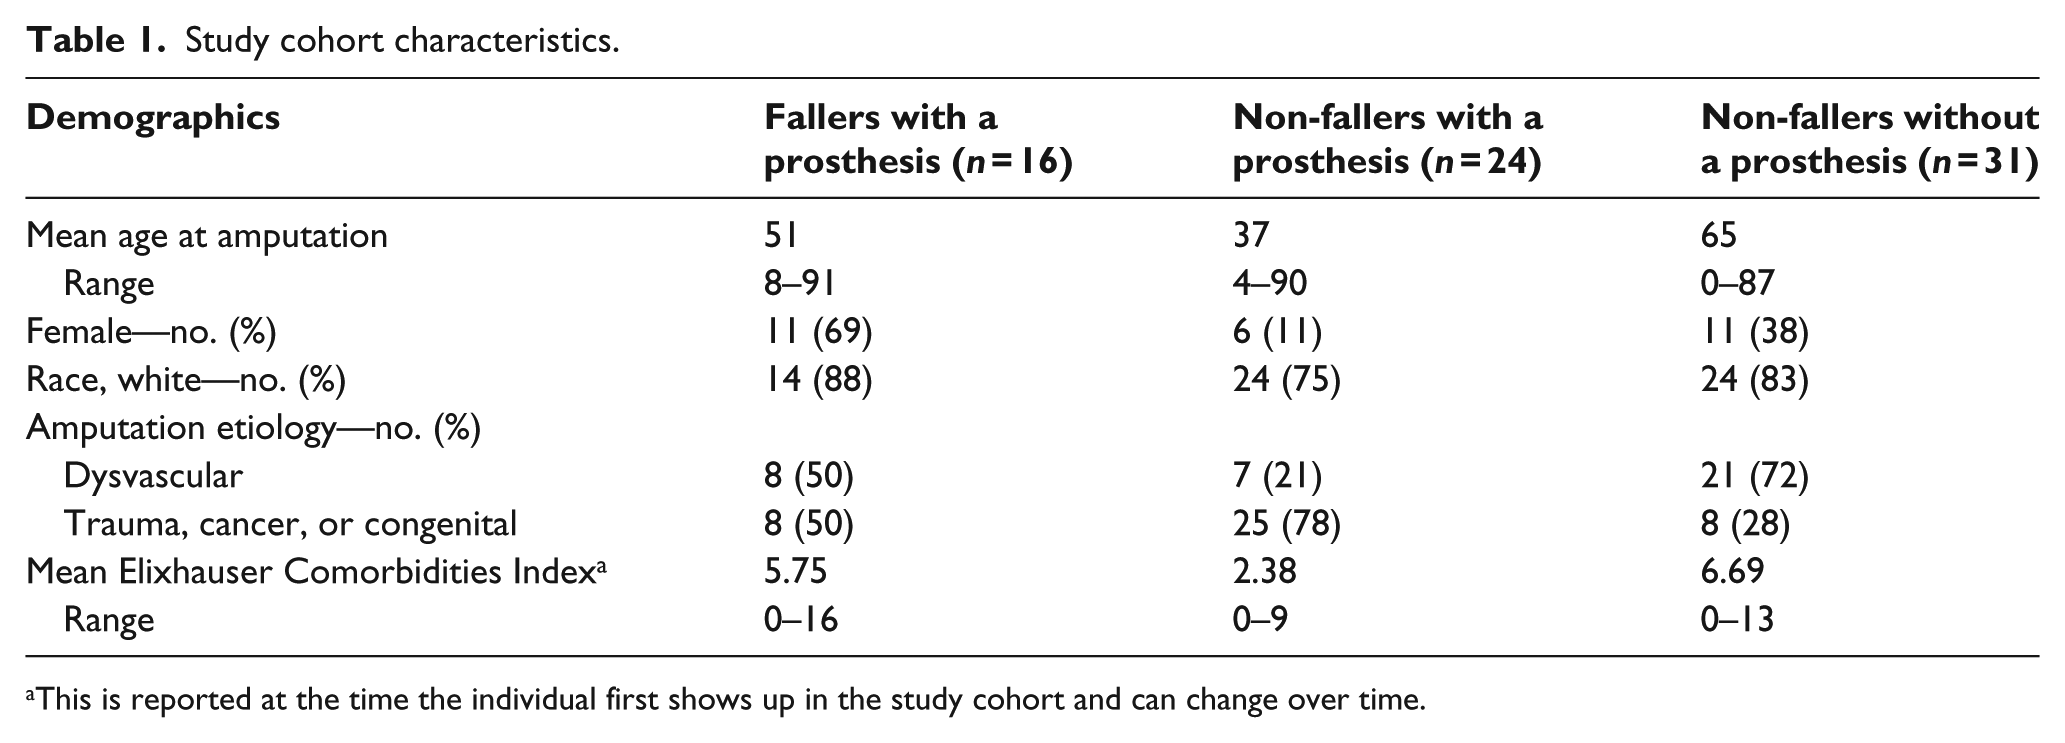
This is reported at the time the individual first shows up in the study cohort and can change over time.
A greater proportion of those who fell were women (69% vs 11% of non-fallers with a prosthesis and 38% of non-fallers without a prosthesis). Half of the fallers had amputations secondary to trauma or cancer, while 78% of non-fallers with a prosthesis and 27% of non-fallers without a prosthesis had amputations secondary to trauma or cancer. The fallers had a higher comorbidity burden (5.75) than non-fallers with a prosthesis (2.38), but were similar to non-fallers without a prosthesis (6.69).
Cost analysis
The median 6-month fall costs for 11 falls (10 individuals) requiring an emergency department visit were US$5638 (interquartile range (IQR): US$304, US$31,576) and US$25,346 (IQR: US$13,334, US$34,789) for 6 falls (6 individuals) requiring hospitalization. Because our model predicted a counterfactual for the costs during the 6 months following a fall, it was possible for the predicted cumulative 6-month fall costs to be negative if observed direct medical costs following a fall were less than the predicted costs since cumulative costs are calculated as observed minus predicted costs (further explanation of this aspect of the model is presented in the Technical Appendix, available online). This was especially true if an emergency department visit following a fall was inexpensive relative to other medical services that the individual received on a regular basis (e.g. dialysis) thereby not increasing the observed post-fall cost trend above the pre-fall cost trend. In 7 of the 17 falls, post-fall costs did not differ significantly from the pre-fall costs (p > .05).
We then combined all model estimates to calculate the mean fall costs and distribution over time. These analyses revealed that the largest costs occurred in the first 2 months following a fall (Figures 2 and 3).
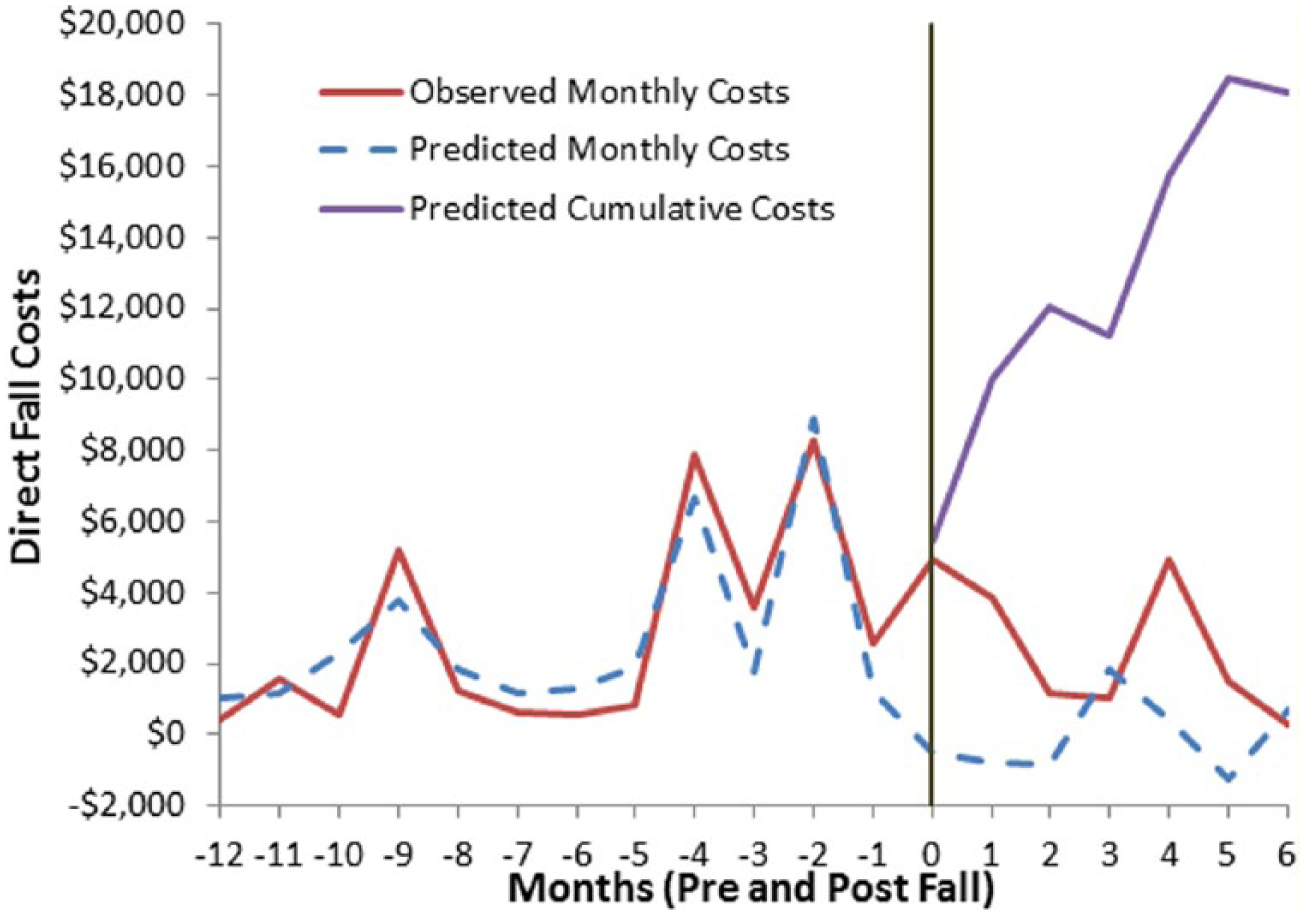
Medical costs over 18 months for those individuals visiting the emergency room due to a fall.
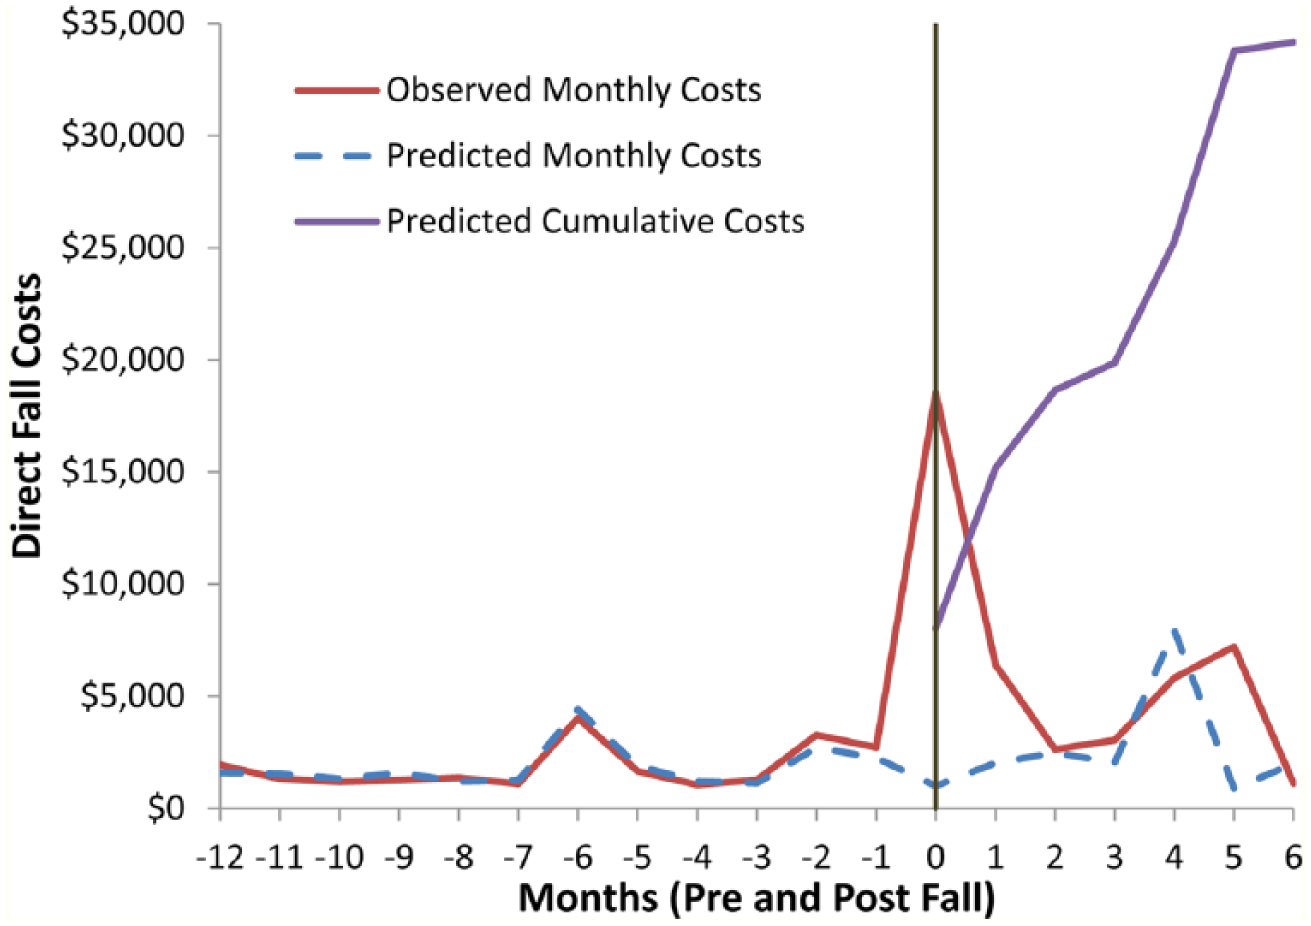
Medical costs over 18 months for individuals with a transfemoral amputation hospitalized due to a fall.
Observed monthly costs, predicted monthly costs after the fall, and cumulative costs after the fall were depicted for each faller. Due to the nature of the Bayesian model, it was possible to predict negative monthly costs which should be interpreted the same as if costs in that month were not incurred. The average 6-month fall cost for individuals requiring an emergency department visit was US$18,091 (US$-7,820, US$57,368). The confidence intervals included zero, indicating that the excess costs associated with emergency department visits were indistinguishable from the pre-fall costs. The average 6-month fall costs for individuals requiring a hospitalization was US$25,652 (US$10,468, US$38,872) and significantly higher than the pre-fall costs. The average 6-month fall costs for all fallers was US$16,645 (US$-9,010, US$61,016).
Discussion
This study is the first report of the cost of falls among individuals with TFA. The 6-month cost of falls in our TFA cohort is similar to the previously reported cost of falls for elderly individuals (US$27,745 to US$25,652 for falls that result in a hospitalization). 5
In our population, 13% of individuals fell with a prosthesis (6 of 46) and required hospitalization. Fall rates among individuals with lower limb loss were previously reported to be similar to those among elderly adults. It is estimated that 16%–33% 25 of adults over 65 years of age fall in a given year, and about 30% of these falls result in an injury. 26 The Centers for Disease Control and Prevention reported that almost 60% of falls where an injury occurs results in an emergency room visit and 15% result in a hospital admission. 27 Given the similarly high propensity of falling for both elderly adults and individuals with a TFA (33% and 52%, respectively),25,28 it is likely that individuals with TFA have similarly high rates of hospitalization for fall-related injuries.
The method we use for estimating cost using a Bayesian structural time series is novel and, to the best of our knowledge, has not been used in health services research. This approach allows for treated individuals, in this case those who fall, to serve as their own controls and also relaxes matching assumptions required by other statistical models allowing all non-treated individuals to serve as a potential control. By comparing actual post-fall costs to estimate post-fall costs based on actual pre-fall costs, the Bayesian structural time series provides an intuitive approach to estimating the change in costs that resulted from the fall.
The REP provides a unique setting that allows us to capture an individual’s entire medical history as long as he or she resides in Olmsted County. Due to the cooperation between the two medical providers in Olmsted County, we are also able to observe both professional and hospital line-item level costs for all billed services in our population of interest. This allows us to capture all direct medical costs before and after a fall. It is possible that some costs may not be captured if an individual receives care at the local Veterans Health Affairs outpatient clinic, but there were no individuals in our data that report using VHA services in their medical records.
Quantifying the costs of falls for individuals with TFA provides a comparison for policy makers when evaluating the value of more expensive healthcare services or technologies, for example, providing an MPK instead of mechanical knee. Insurance policies reflect the uncertainty about the value of a MPK. For example, Anthem Blue Cross of California has instituted a policy that requires additional documentation and the potential for an audit of those prosthetists who provide MPK; no such policy exists for mechanical prosthetic knees. 29 This additional disincentive can change the way a prosthetist or physiatrist practices. Recent proposed policy changes by the Durable Medical Equipment Medicare Administrative Contractors would place additional restriction on reimbursements for a MPK to only those Medicare patients who could achieve a “natural gait” with a MPK regardless of their mobility.30,31 Therefore, there is a need to better quantify the cost-effectiveness of prosthetic devices as highlighted at the recent International Society for Prosthetics and Orthotics World Congress.
Past studies have estimated the overall value of MPKs using QALYs (US$4560/QALY to US$92,407/QALY) but none have attempted to estimate the direct cost of falls in the TFA population.9,12,13 The direct cost of falls estimation method used goes beyond specific QALY estimates by creating a baseline against which any new technology aimed at reducing falls can be assessed and is appealing because it requires less assumptions. 14 Furthermore, cost-to-QALY thresholds commonly used in Europe are prohibited by Affordable Care Act. 32
Study limitations
Our findings should be interpreted in light of potential limitations. Although we were able to track all direct medical costs over time, our sample size was relatively small. 33 The Bayesian structural time series approach allows one to simply subtract observe healthcare costs from predicted healthcare costs after a fall to determine the additional costs attributed to a fall. It is also well suited for smaller data sets, but can be applied to any size data. Though it is unable to make definitive statements about how predictors that do not vary over time on an individual level affect the outcome of interest. This could be particularly important when looking at treatments where the costs vary greatly across known groups within a population. We are unable to account for indirect costs, costs of nursing home care, and lost wages that add to the economic burden associated with a fall. Therefore, our cost estimate underestimates the true cost of an accidental fall among individuals with TFA.
Conclusion
In conclusion, fall costs for individuals with TFA are similar to fall costs within the general elderly population. These direct 6-month costs provide others within the orthotic and prosthetic community a data point that can be used to assess the value of healthcare interventions designed to reduce falls. Our approach allows us to directly estimate the cost of a fall and thereby avoid making value comparisons based on QALYs. Further research is warranted on the risk of falls resulting in a hospitalization for adults with TFA and to what extent it can be mitigated by various prosthetic devices.
Footnotes
Author contribution
All authors contributed equally in the preparation of this manuscript.
Declaration of conflicting interests
The author(s) declared no potential conflicts of interest with respect to the research, authorship, and/or publication of this article.
Funding
This study was made possible using the resources of the Rochester Epidemiology Project, which is supported by the National Institute on Aging of the National Institutes of Health under Award Number R01AG034676. The American Orthotic and Prosthetic Association provided additional funding for this research. It was also made possible in part by the Mayo Clinic Robert D. and Patricia E. Kern Center for the Science for Health Care Delivery. The content is solely the responsibility of the authors and does not necessarily represent the official views of the National Institutes of Health, Rochester Epidemiology Project, Kern Center for the Science of Health Care Delivery, or the American Orthotic and Prosthetic Association.