
Abstract
Background:
The role of the prosthetist has changed substantially over the past century. In the transition from ‘limb-maker’ to ‘clinician’, the expectations of prosthetics professionals have also changed.
Objectives:
To develop and test a new scale capable of assessing and comparing current expectations of the roles of the prosthetist.
Study design:
Scale development and validation.
Methods:
A new scale was constructed in accordance with Organizational Role Theory. It comprised 72 items that subdivide into 11 subscales. Face, content and construct validity, along with test–retest and inter-rater reliability were evaluated.
Results:
The Prosthetist Role Expectations Scale was found to be psychometrically sound, reliable for use in a range of settings and clinically feasible in a sample of 17 Australian therapists.
Conclusion:
The Prosthetist Role Expectations Scale demonstrated robust psychometric properties and appears well suited to monitoring current expectations of the role of the prosthetist in health service delivery.
Clinical relevance
The Prosthetist Role Expectations Scale can identify current expectations of the role of the prosthetist, showing areas of consensus and conflict between key professional and client groups. Wider use of the instrument will contribute to increased understanding of professional roles. This may help to reduce role conflict and improve communication within healthcare teams.
Background
Over the last century, the role of the prosthetist has shifted from apprenticeship origins to that of a university educated, health professional.1,2 In Australia, this evolution has been strongly influenced by five key factors: the emergence of specialized allied health professionals, a shift towards team-based healthcare, changes to tertiary education training in allied health and prosthetics, technological advancements and the establishment of professional organizations such as the Australian Orthotics and Prosthetics Association (AOPA) and the International Society for Prosthetics and Orthotics.2–4 In this transition from ‘limb-maker’ to ‘clinician’, it is likely that expectations of prosthetists have also changed.
Organizational Role Theory 5 indicates individuals within an organization form expectations of their colleagues behaviour within their given role. These role expectations are considered to substantially influence an individual’s behaviour (known as ‘role-behaviour’). Organizational members in contact with the role under investigation are referred to as ‘role-senders’. 5 Role expectations within any organization can be diverse; however, if expectations are ambiguous or conflicting, tensions can emerge within that organization.6–9
Studies of role behaviour and expectations have been conducted in a broad range of organizational7,8,10–15 and psychosocial contexts.9,16–19 Previous studies have utilized scales such as Rizzo, House and Lirtzman20–23 or role-conflict measures.24,25 While these scales provide valuable data concerning role behaviour, they are primarily self-reflective and provide only the perspective of the role under investigation. According to Katz and Kahn, 5 role behaviour studies can be strengthened by comparing expectations from multiple role-senders.
To date, there are no known reports on expectations of the prosthetist’s role from this perspective of organizational psychology. Ostler et al. 26 commented, ‘one area which was wholly unclear was the expectation of the role of the prosthetist. This lack of expectation may be reflected in a lack of research surrounding the role …’ (p. 5). In light of the changing role of the prosthetist at a clinical and educational level, data concerning current expectations would provide valuable insight into areas of consensus and conflict from multiple perspectives.
The aim of this research was to develop and test a new scale capable of assessing expectations of the prosthetics profession from multiple role-senders. It was developed with consideration to Organizational Role Theory 5 as well as current literature describing the prosthetics profession. Our focus was within an Australian health setting in the first instance, with plans for wider reach in future studies.
Scale development method
Development of item-pool and behavioural subscales
The scale was designed in accordance with steps for scale development described by DeVellis. 27 The process commenced by building an item-pool of statements which aimed to adequately describe the breadth of behaviour that encompass the prosthetist’s role.5,27 Items were sourced from a wide range of literature describing prosthetist behaviour. This included competency standards, conference proceedings, experimental research and editorial papers.28–31
A total of 95 items were initially compiled. This number was considered undesirably large, as content-heavy surveys can result in incomplete data and low response rate.32,33
Two reviewers removed 35 items by identifying repetition, double-barrelled phrasing and content overlap with other items. 27 The same reviewers grouped the remaining 60 items thematically into ‘subscales’ according to the content described therein. 27 These were titled ‘clinical activity’, ‘technical tasks’, ‘research and life-long learning’, ‘decision making’, ‘team functioning’, ‘communication’, ‘topics of discussion’ and ‘counselling’.
Several subscales contained items sourced from the literature that indicated conflicting opinions of the role or lack of clarity concerning a certain behaviour. In accordance with Organizational Role Theory, 5 the scale purposefully included items that represented this ambiguity. This was done to allow the respondents to identify their opinion of role boundaries and to provide valuable data concerning the current expectations in an area of uncertainty.
Each item was prefaced with the contextual statement: ‘When providing care for an amputee client, the prosthetist should …’. Items were formatted to follow this preface and refined to remove jargon and technical terminology. 27 The survey was formatted with a 6-point Likert scale, including ‘very strongly agree’ (numerical value of 1), ‘strongly agree’, ‘agree’, ‘disagree’, ‘strongly disagree’ and ‘very strongly disagree’ (numerical value of 6).
Identification of role-senders
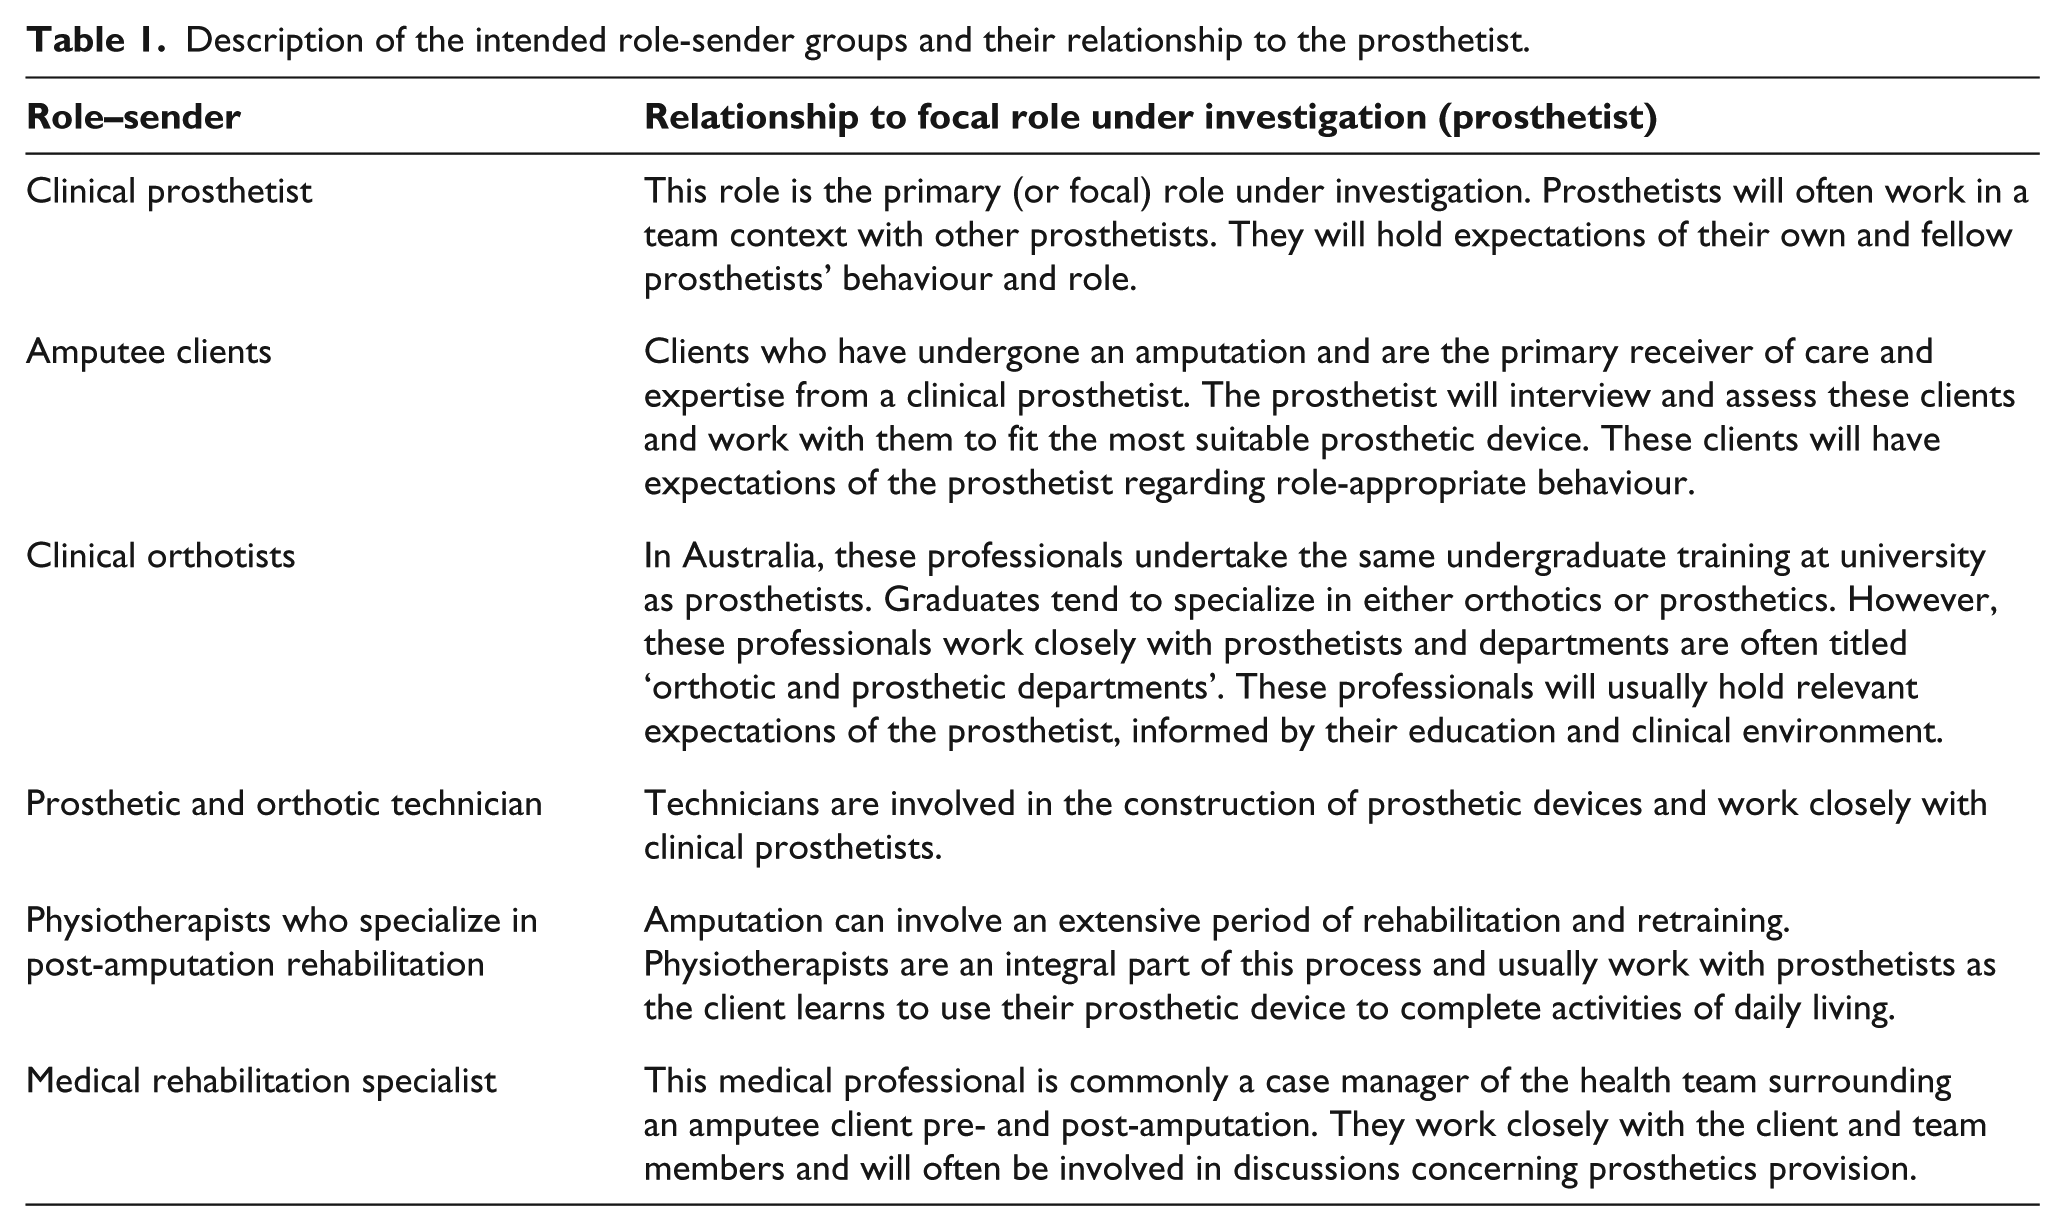
Key role-senders were identified as clients with amputations and fellow prosthetists. 31 Additional role-senders included allied health (such as orthotists), nursing and medical professionals; client family members; facility managers and educators in prosthetics. The initial list was refined by two reviewers with the aim to capture a participant pool that represented regular contact with the prosthetist and allow for realistic participant recruitment. This final list included amputee clients, allied health (prosthetist, orthotist, physiotherapist and prosthetics technician) and medical professionals. Each group is summarized in Table 1.
Description of the intended role-sender groups and their relationship to the prosthetist.
Content and face validity
The first draft was distributed to three experienced prosthetists for expert comment on format, content and clarity of the scale items. They were asked to identify any significant behaviours or themes that they believed had been omitted. Following this feedback, wording changes were made to nine items, and formatting suggestions were incorporated to enhance readability of the survey.
First pilot test
The survey was pilot tested to further explore the construct and content validity. Participant groups were sourced from three of the six intended groups and included prosthetists, amputee clients and medical rehabilitation specialists from the Australian states of New South Wales (NSW) and Victoria. The survey included a demographic section to identify role-sender groups and contained an open-ended feedback section, inviting further comments on content.
Prior to distribution, ethics approval was sought and obtained from the La Trobe University Faculty of Human Ethics Committee. A total of 20 prosthetic facilities were identified by the publicly available National Centre for Prosthetics and Orthotics facilities list. 34
Managers were contacted by mail and invited to participate. If they agreed to participate, managers were asked to request the appropriate number of surveys to distribute to prosthetics staff via the internal mail and clients in their database. A total of 48 medical rehabilitation specialists were invited via public forum information and special interest websites. Participation was voluntary, and return of the survey was considered informed consent.
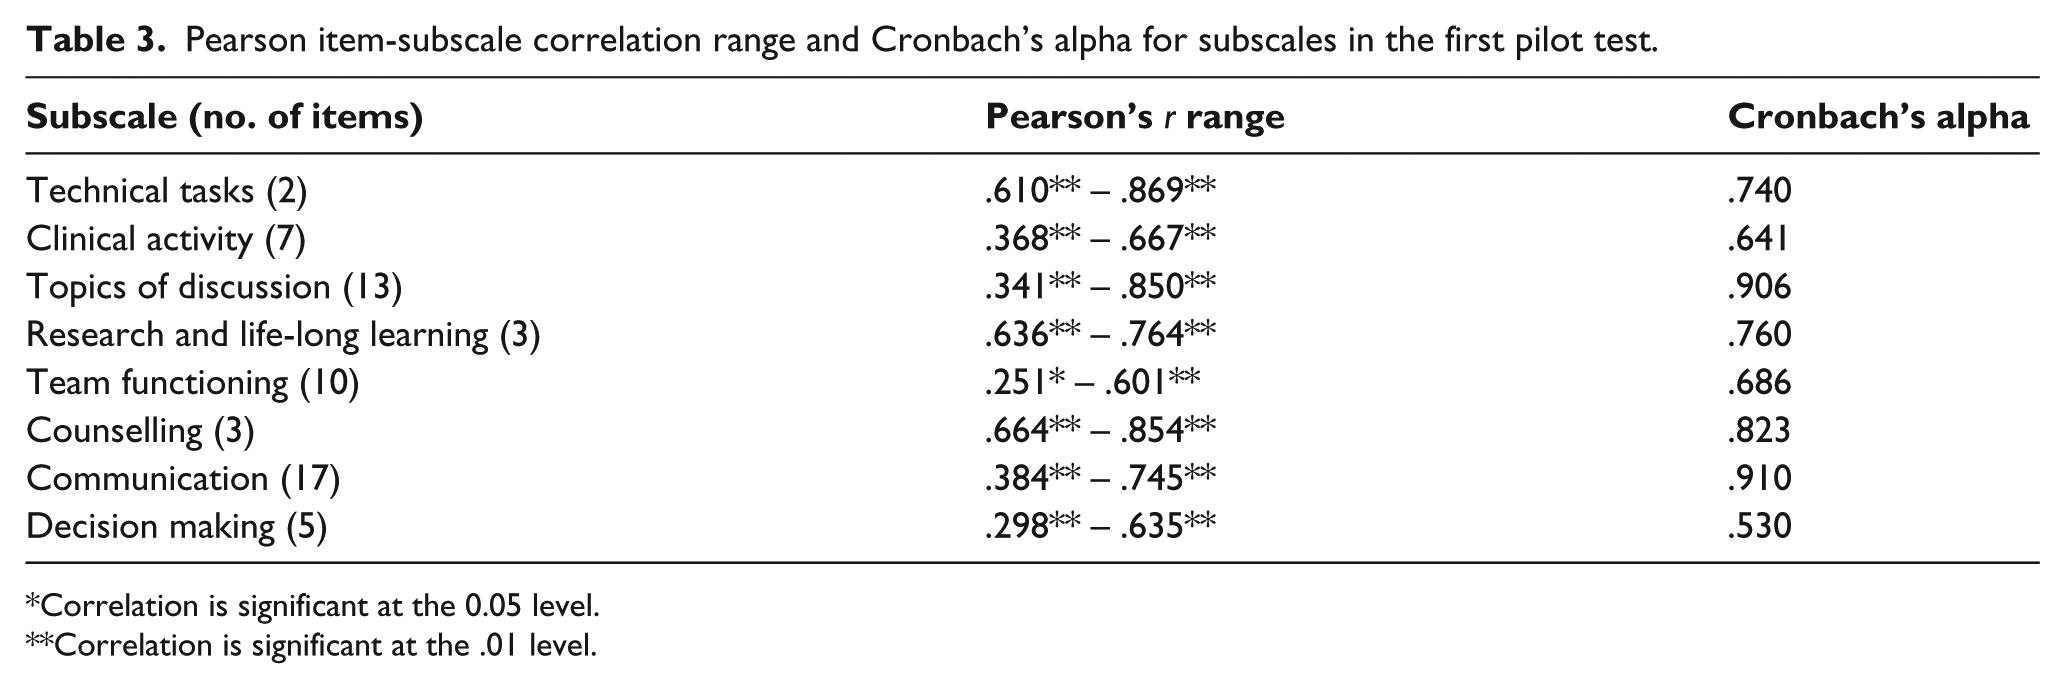
Mean scores for each item and subscale were calculated using the corresponding Likert scale number values. 27 Evaluation of construct validity included item-to-subscale Pearson correlation analysis and measures of internal consistency (Cronbach’s alpha) to determine the item-to-subscale suitability.27,35 Statements yielding a significant positive Pearson’s correlation with the overall response to a subscale were deemed to represent items with an appropriate allocation. Statements showing negative or weak relationships with their allocated subscale, or stronger relationships with another subscale, were considered for deletion or reallocation. Alpha scores of .70 or greater were considered reasonable evidence of subscale internal consistency. Content validity of the instrument was reviewed via subjective comments received relating to items contained within the set of subscales.
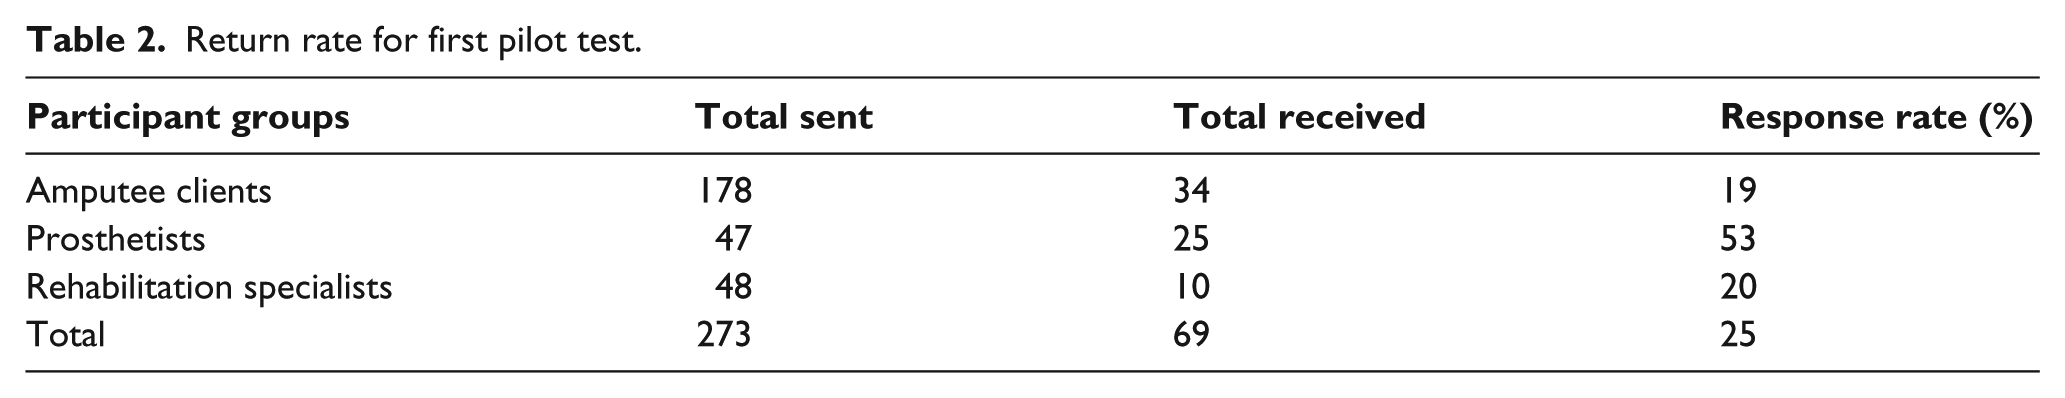
Seven prosthetic facilities agreed to participate (two from NSW and five from Victoria). A total of 273 surveys were sent to participants, and 69 surveys were returned. An additional 14 surveys were received but contained incomplete data and were not included in the analysis. The overall return rate was 25%. Response rate details are presented in Table 2. Results of the correlation analysis are presented in Table 3. Each item demonstrated a positive correlation with its allotted subscale. While all items had a positive correlation, 17 demonstrated a higher correlation with another subscale, and three subscales possessed alpha scores of less than .7.
Return rate for first pilot test.
Pearson item-subscale correlation range and Cronbach’s alpha for subscales in the first pilot test.
*Correlation is significant at the 0.05 level.
**Correlation is significant at the .01 level.
Feedback from the participants identified some concerns thought to affect the content validity of the instrument. Some statements were flagged as problematic, either due to lack of clarity or terminology. Additional behavioural areas were thought to be underrepresented by the survey included communication directly related to using the prosthesis, ‘basic coping’ or ‘adjustment’ to amputation, technical activity and team decision making.
The first pilot test contributed to a better understanding of the construct and content validity of the overall scale. While correlational analysis was supportive of the initial item-to-subscale allocation, a few items produced results that suggested they might be better allocated to other subscales. This indicated that some of the initial subscale classifications were too broad, and the scale would not be sensitive enough to compare specific behavioural areas meaningfully. This was further supported by concerns of content validity identified by participants. It was therefore deemed necessary to improve the clarity of both items and subscales and re-review the suitability of the item-to-subscale allocation.
Scale amendments
The scale underwent an extensive revision with the aim to improve the content validity. Item content and subscale classifications were re-worked by the two reviewers to improve clarity while ensuring the role remained adequately described. 36 Each item was reviewed for ambiguous language, repetitive content and double-barrelled phrasing. 36 A total of 13 items were identified as problematic by the first pilot test participants. By reviewer consensus, 2 were removed entirely and the remaining 11 were re-worded.
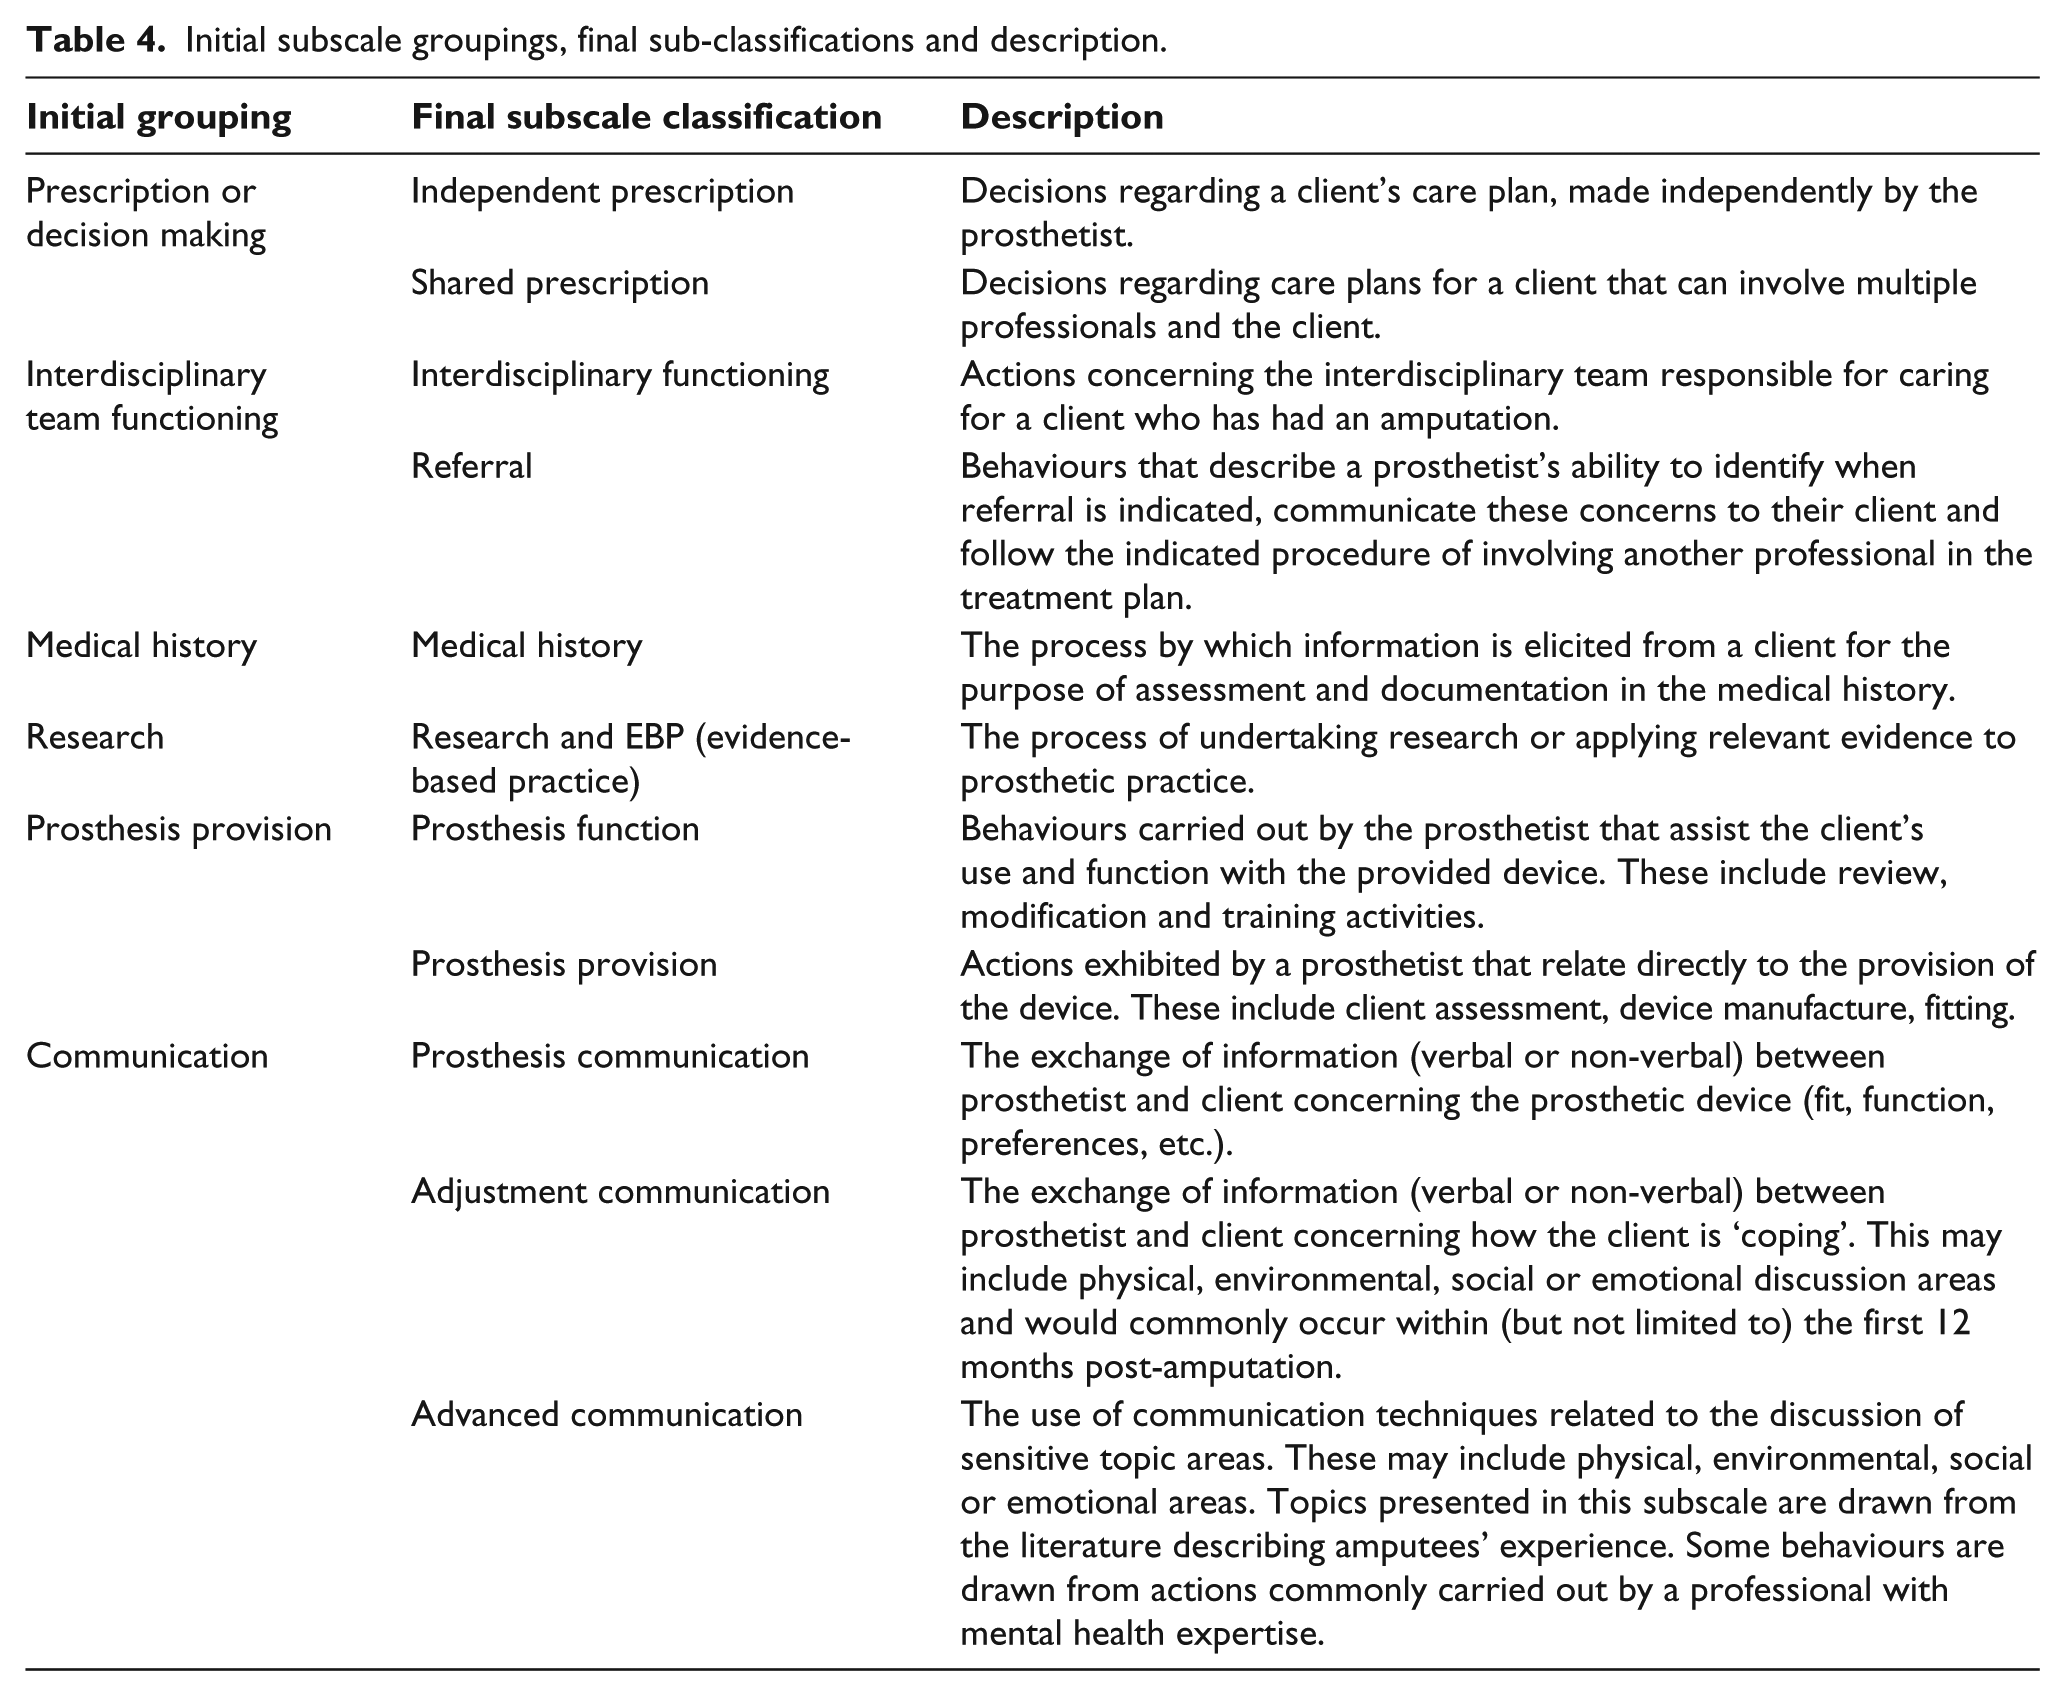
The remaining 58 items were regrouped by reviewer consensus into six new behavioural categories and further sub-divided to address the behavioural areas in more detail. Particular attention was paid to the detail addressed by each statement and any underrepresented areas identified in the first pilot test. Role statement literature was consulted to ensure that behavioural domains were not overlooked by the reallocation and relabelling process. Description of the 11 regrouped subscales can be found in Table 4. A total of 14 new items were built to address the gaps identified by the first pilot test and added to the prosthesis function, independent prescription, shared prescription, advanced communication, research and referral subscales. The second draft of the scale consisted of 72 items. Ethical approval was obtained from the La Trobe University Faculty of Human Ethics Committee prior to distribution in Australia.
Initial subscale groupings, final sub-classifications and description.
Second pilot test
Content validity
Eight experienced prosthetists (>10 years of practice) were invited to comment on the face and content validity of the revised scale. Feedback was received from four participants. Respondents reported the language was easy to follow, and the contents adequately reflected the breadth of behavioural tasks expected of a prosthetist in clinical practice. Notably, the respondents reported that it was difficult to capture the full range of behavioural tasks required of a prosthetist in a single scale. This was because facilities varied substantially in practice and responsibilities. Because of this, some prosthetists may not identify with some items, as these activities may not occur regularly within their scope of practice. The researchers were satisfied that the content validity of the scale had been substantially improved and thus proceeded with further tests concerning scale reliability.
Test–retest and inter-rater reliability
A small sample of two of the six intended participant groups (prosthetic and orthotic clinicians) (n = 17) were recruited to assist with reliability studies. A total of 17 clinicians from the Australian states of Victoria and Queensland responded to the invitation to participate. 34 In all, 41% were from Queensland and 57% were from Victoria. In total, 52% were prosthetists and 48% were orthotists. The test–retest reliability was measured using intraclass correlation coefficients (ICCs) to evaluate the correlations in item response scores (at the subscale level). This was for the same survey on two separate occasions. 37 The chosen time interval for test–retest surveys was 2 weeks. 37 Inter-rater reliability was determined by calculating an ICC for each subscale, where the 17 participants served as raters. 38 Reliability results are presented in Table 5.
Test–retest and inter-rater reliability results.
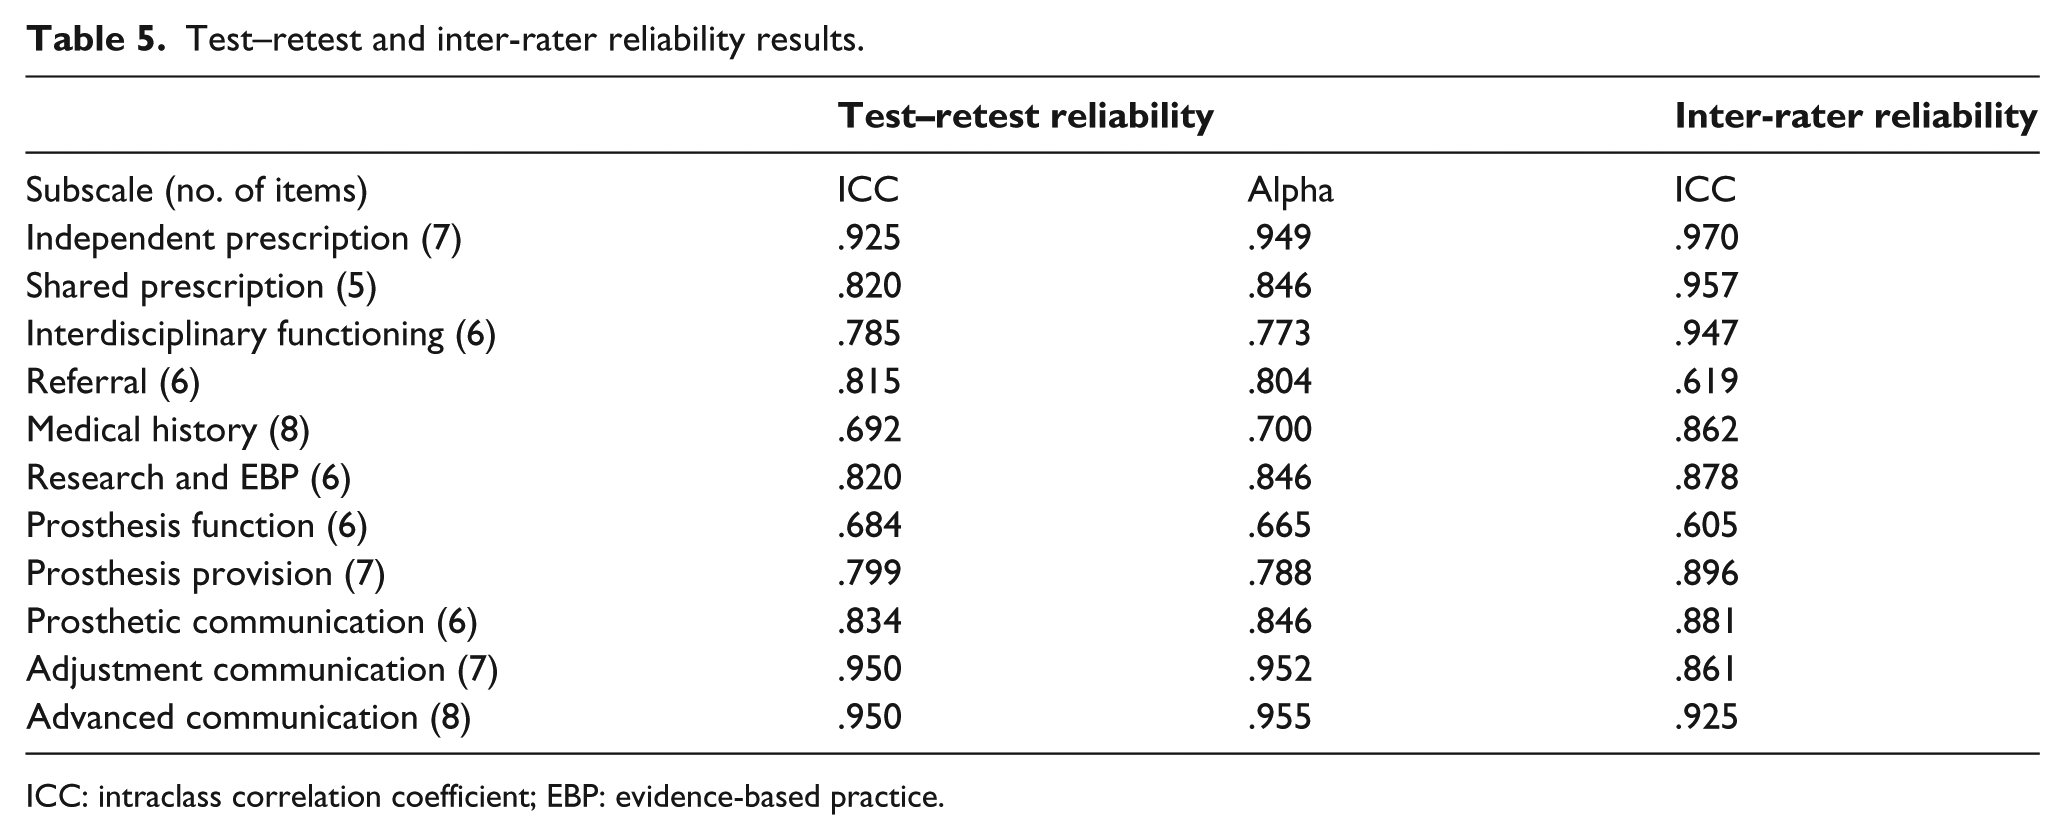
ICC: intraclass correlation coefficient; EBP: evidence-based practice.
The results yielded strong positive ICC for both investigations. Test–retest results showed two subscales that reported ICC scores of slightly less than .70, but these were within .008 (medical history) and .016 (prosthesis function) of .70, respectively. The remaining subscales showed ICC scores exceeding .70. The inter-rater reliability study showed nine subscales reported strong ICC scores (in excess of .861). The ‘prosthesis function’ and ‘referral’ subscales did show ICC scores of less than .70 but were within .095 and .081, respectively, of achieving a score of .70. It was concluded that the scale had adequate test–retest and inter-rater reliability.
Final pilot test
The construct validity of the revised survey was reviewed in a final pilot test. Participants from the six participant groups were recruited across Australia. Recruitment procedures varied from group to group; however, all participants received an invitation to voluntarily contribute to the project and had the option of a hard copy or electronic submission.
A total of 40 prosthetic facility managers were invited to participate in the project by the distribution of survey invitations and surveys to their staff (prosthetists, orthotists and technicians) and 9 agreed to participate. Managers were also invited to make the survey available to amputee clients at their facility. Some facilities chose to forward surveys to clients in their database and others placed them on public display within their clinic for clients to take at their own discretion. Two Australian-based amputee support groups assisted with distribution of an electronic link to the survey via their mailing lists. Medical rehabilitation specialists and physiotherapists were invited to participate via special interest groups and public forum contact information. A total of 1064 hard copy surveys were sent, and 275 were returned within the return-date deadline. A total of 11 surveys were incomplete and not included in data analysis, resulting in a 25% return rate of the hard copy surveys. Thirty-five additional electronic responses were received resulting in a total of 299 surveys utilized for data analysis. The largest respondent group was amputee clients (67%). Prosthetists, orthotists and technicians comprised 10%, 7% and 3%, respectively. Nine percent of the respondents were physiotherapists and 4% were medical rehabilitation specialists.
The suitability of each item to its allocated scale was assessed through Pearson correlation analysis.38,39 Positive, significant correlations between an item and its allocated subscale were considered a reasonable allocation. The homogeneous nature of the items contained within each subscale was explored through measures of internal consistency (coefficient alpha). A score of .70 or greater was deemed a reasonable representation of an internally consistent subscale 35 (Table 6).
Subscale Pearson correlations and Cronbach’s alpha for subscales in the third pilot test.
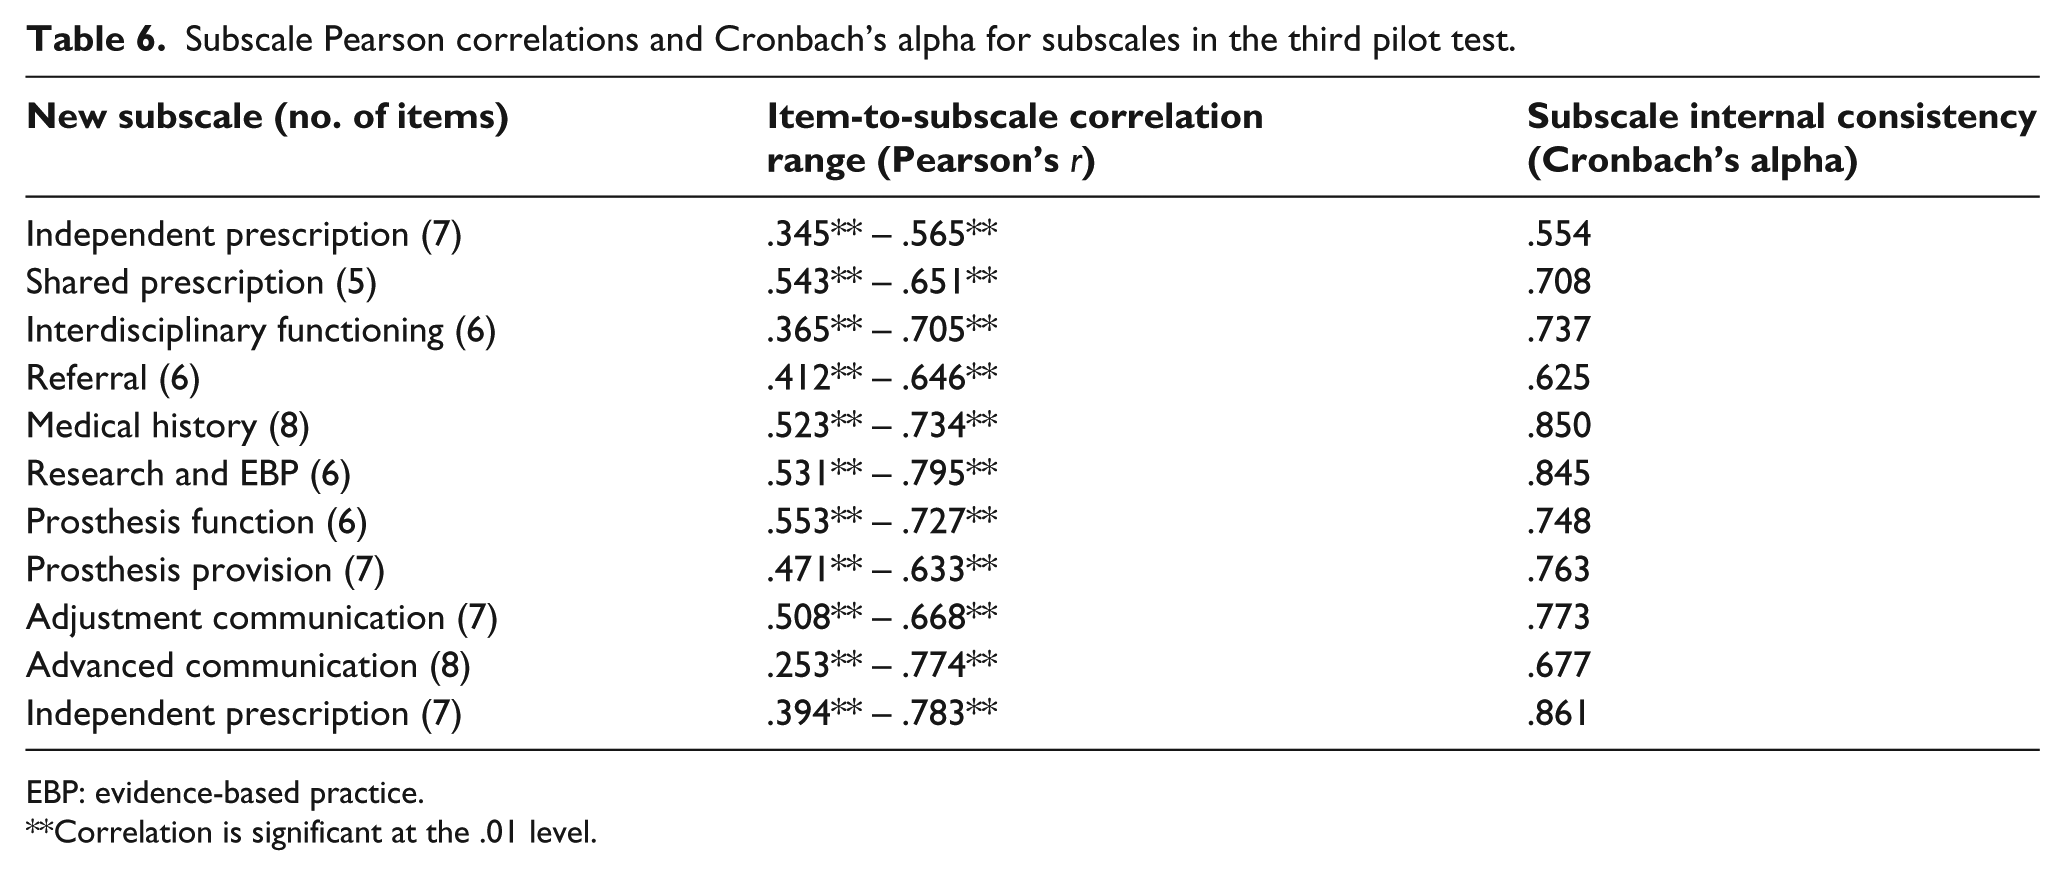
EBP: evidence-based practice.
Correlation is significant at the .01 level.
Alpha scores of .70 or greater indicated 8 of the 11 subscales had adequate internal consistency. The ‘referral’, ‘independent prescription’ and ‘adjustment communication’ subscales showed alpha scores within .075, .146 and .023, respectively, of .70. Despite being less than ideal, these subscales were still considered to have reasonable internal consistency, as the gap between the scores and .70 was small in absolute terms.
Item-to-subscale correlations showed positive significant correlations between each item and its allocated subscale; however, a few of these items did not show high positive scores. The researchers considered these lower scores an indication of the variability that came with inclusion of all six participant groups. The researchers were satisfied that the scale had reasonable empirical support for item-to-subscale allocations and the subscales had been shown to be internally consistent. It was therefore concluded the construct validity of the revised scale was reasonable and that scores from the scale could be used to pursue wider analysis of the role of the prosthetist, using the data obtained from the national distribution.
Discussion
An extensive developmental process resulted in a first-generation scale designed to obtain and compare current expectations of the prosthetist’s role. The strength of the scale is demonstrated through the application of the relevant literature concerning scale development, Organizational Role Theory 5 and evaluation processes at each stage of scale building.5,27 Pilot testing, scale revision and evaluation showed the new scale demonstrated adequate content and construct validity, test–retest and inter-rater reliability. Previous instruments have explored expectations largely from one perspective; 23 however, this scale expands the participant groups so as to allow comparison between different role-sender groups. Further use of scale will provide data to clarify the current expectations of the role of the prosthetist. This clarification may assist therapists to identify areas that may benefit from a more detailed description of roles, with the potential to reduce interprofessional or client conflict.
There are some limitations that should be noted. First, the final survey was longer than desired. The researchers had to balance an adequate description of the role with the length of the survey. It was reduced where possible, but this did not result in a compact survey. This may affect the return rate and generalizability of results in future studies.32,33
Second, some of the reliability and validity studies were limited by time and participant constraints. Content and face validity studies involved only prosthetists and the first pilot test recruited participants from only three of the six participant groups. Reliability studies in the second pilot were limited to prosthetists and orthotists. Both validity and reliability studies were also geographically limited, involving participation from only three Australian states (Victoria, NSW and Queensland). If the pilot studies had contained a more balanced spread of the intended participant groups, it is possible that some content concerns may have been identified earlier in the process.
Third, while the included groups were considered an adequate representation of role-senders, inclusion of a wider range of participants (e.g. occupational therapists) may have resulted in a richer data set. Should future research wish to target role-senders outside of the six intended groups, additional demographic sections could easily be incorporated.
The final limitation concerns the informative literature that contributed to item content. The scale was built using descriptions of the role from the English-language literature describing the role of the prosthetist. One key document was the second edition of the Australian Orthotic and Prosthetic Association Competency Standards. 29 The third edition of these standards was released late 2014, after the PRES had undergone its national distribution. Additional content from these new standards was unfortunately unable to be included in the final scale.
Conclusion
The PRES has 72 items with 11 behavioural subscales and can provide data concerning expectations of the prosthetist’s role. It can be used to identify consistent or conflicting expectations between clients and professionals who work with clinical prosthetists. It may also be used to determine whether current expectations of the role are in keeping with descriptions in the published literature. It is the first scale of its kind to use Organizational Role Theory to explore the role of the prosthetist in health service delivery.
Footnotes
Author contribution
R.L.M. led the scale development process and drafting of the manuscript. M.C.H., G.M. and R.L.M. conceptualized the scale development process and revision. M.E.M. provided critical feedback on pilot testing and scale validation process. R.L.M. oversaw data collection and conducted data analysis with critical feedback from M.C.H., G.M. and M.E.M. R.L.M. drafted the original manuscript and all authors offered editorial comment and reviewed the final manuscript.
Declaration of conflicting interests
The author(s) declared no potential conflicts of interest with respect to the research, authorship, and/or publication of this article: The authors are from the same institution as the Editor-in-Chief of Prosthetics and Orthotics International. Because of this potential conflict of interest, all decisions relating to the review and publication of this manuscript were made by Dr. Edward Lemaire as Acting Editor-in-Chief.
Funding
The author(s) received no financial support for the research, authorship and/or publication of this article.