
Abstract
Background: Each plantar pressure measurement system has a different accuracy and reliability, which is required to establish a range of normal values and determine the reliability.
Objectives: To determine normal pressures with the Gaitview® system and assess its reliability.
Study Design: Single-group repeated measures.
Methods: Dynamic barefoot plantar pressure data were obtained in 30 healthy young participants. In each session, three trials were recorded by one examiner for each foot using the two-step gait initiation method, which was repeated by another examiner the same day. One week later, all of the procedures were repeated. Time-integral mean pressures were measured for each of eight anatomical foot regions. The foot contact time (CT) and the time-integral mean angle of the center of pressure (COP) were also measured.
Results: The greatest time-integral mean pressures were seen under the medial and lateral heel. The mean CT was 0.9 sec for both feet, and the time-integral mean angle of the COP was 9.3° for the right foot and 6.6° for the left. The intraclass correlation coefficients (ICCs) ranged from 0.69 to 0.97, and the coefficient of variation (CoV) from 9.9 to 59.97% for all parameters.
Conclusions: These findings indicate that the Gaitview® system demonstrates good to moderate reliability.
The Gaitview® AFA-50 system (alFOOTs, Seoul, Republic of Korea) has been used by clinicians in Korea, but has not been investigated in an independent study. Therefore, this study established a range of normal values and determined the reliability of the Gaitview® AFA-50 system.
Keywords
Background
The application of plantar pressure measurement systems (PPMSs) has widened in clinical trials to assess foot problems in chronic medical conditions such as diabetes mellitus, rheumatoid arthritis and osteoarthritis. Abnormal pressures are recognized as a causative factor in the development of foot problems. The PPMSs help clinicians to investigate plantar pressure changes for different foot areas.
Each PPMS manufacturer uses different sensor technology, spatial resolution, pressure range, sampling rate, calibration and processing procedures. In a study 1 comparing commonly used platform-type PPMSs of different technologies, static and dynamic pressure tests showed very high accuracy with capacitive, elastomer-based technology (root mean square error (RMSE) < 0.5%), high accuracy for the resistive technology(RMSE < 2.5%) and good performance with capacitive, air-based technology (RMSE < 5%). Even if the in-shoe and the platform-type PPMSs of the same manufacturer uses the same technology, there are differences of measurement outcomes. 2 It may reflect the characteristics of the hardware, the software or the methods of data collection used. These findings suggest that each PPMS has a different range of normal values for reference and comparison purposes and differing accuracy and reliability. Therefore, it is essential to establish a range of normal values and determine the reliability of a given PPMS to be used for research or clinical diagnosis.
Although the validity of commercial PPMSs has been documented in the literature,3-8 the reliability of the Gaitview® AFA-50 system (alFOOTs, Seoul, Republic of Korea), which is used by clinicians in Korea, has not been investigated in an independent study. Therefore, this study established a range of normal values and determined the reliability of the Gaitview® AFA-50 system in 30 healthy asymptomatic participants.
Methods
Participants
Thirty healthy asymptomatic participants were recruited from the general population who visited Uijeongbu St. Mary’s Hospital or public health centers by posting or distributing a poster. All study procedures were approved by the Human Study Ethics Committee, and written informed consent was obtained from all participants before data collection (Approval No. UC10OISI0034). Gender, age (years), height (cm), weight (kg), and body mass index (BMI) (kg/m2) were determined for each of the study participants at baseline.
All participants had normal feet as defined by Schwartz 9 : the absence of any apparent disturbance in the observed walking pattern; absence of significant structural abnormalities in the feet or legs; absence of corns, excessive callus formation, or other lesion of the feet or legs; freedom from complaints of discomfort, disability, or excessive fatigue during prolonged walking or standing.
Measurement device
Time-integral mean plantar pressures were measured during barefoot walking using the Gaitview® AFA-50 system (Figure 1), which includes a 410 × 410 × 3 mm active area consisting of a 45-mm thick floor mat (700 × 500 mm), comprising 2,304 (48 × 48) force-sensitive resistor sensors and sampling data at 17 Hz.
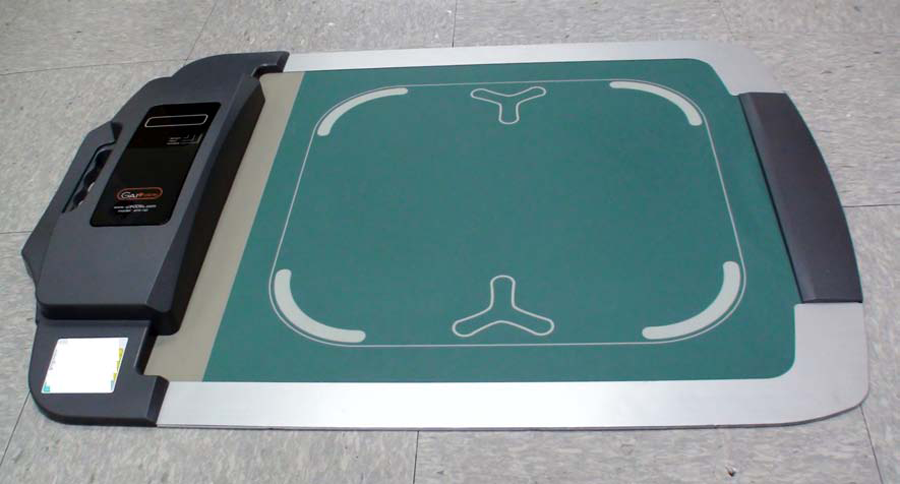
The Gaitview® AFA-50 system (alFOOTs, Seoul, Republic of Korea).
Protocols
The participants were instructed to strike the platform on the second step from the starting position at their own self-selected comfortable pace using the two-step gait-initiation method; they were directed to look ahead at a fixed position away from the platform and not to look down at the platform. Trials were excluded and repeated if the plantar pressure recording was not positioned in the proper area, if the participant paused on the mat while walking, or if the participant did not continue to walk past the mat for more than two steps.
In each session, three consecutive trials were recorded by one examiner for each foot using the two-step gait-initiation method, and the left foot was always assessed first. The procedure was repeated by another examiner one hour later. All procedures were repeated one week later.
Following data collection, Gaitview Pro® Version 1.0 was used to determine the time-integral mean pressure expressed in kPa (1 kPa = 1.98 kg/cm2), under the following eight regions of the foot: first toe (T1), second through fifth toes (T25), first metatarsal (M1), second through fourth metatarsals (M24), fifth metatarsal (M5), midfoot (MF), medial heel (MH), and lateral heel (LH). These regions are identified automatically by the software (Figure 2). The foot contact time (CT) from heel contact to toe-off and the angle of the center of pressure (COP) were also measured.
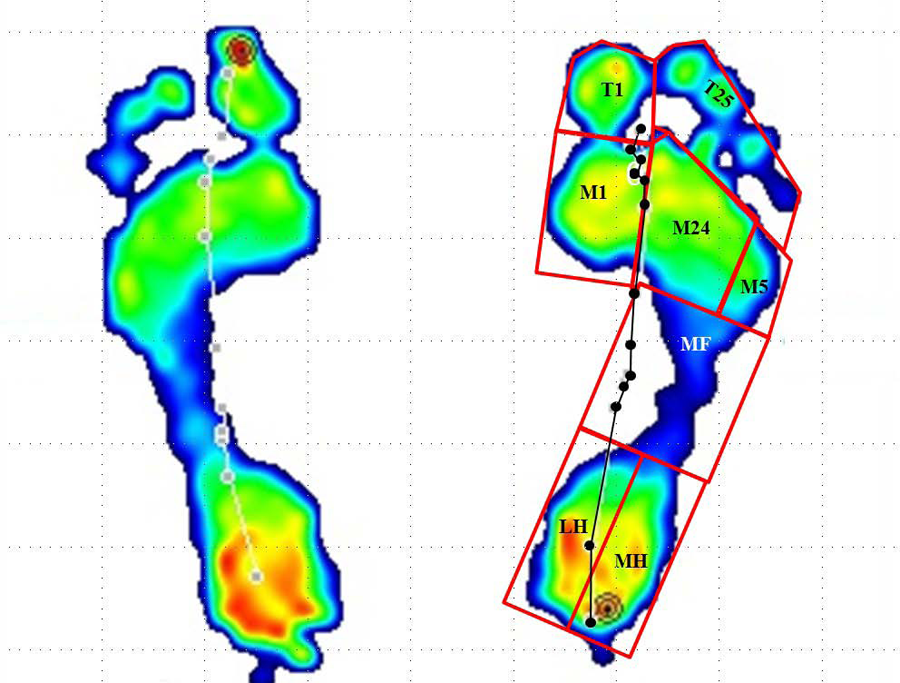
An example of a participant’s walking trial measured by the Gaitview system showing the eight masked regions during barefoot walking. The line with circles indicates the center of pressure trajectory.
Statistical analysis
The means and standard deviations of the variables were calculated for descriptive statistical analysis. The reliabilities of the time-integral mean pressure, foot CT, and angle of the COP were assessed using intraclass correlation coefficients (ICCs) and coefficients of variation (CoV), and repeated-measures analysis of variance (ANOVA) was used to compare the spatiotemporal parameters within and between sessions. The ICCs were interpreted in accordance with suggestions of Portney and Watkins; values > 0.75 indicate good reliability, values of 0.50–0.75 imply moderate reliability, and values < 0.50 suggest poor reliability. 3
Results
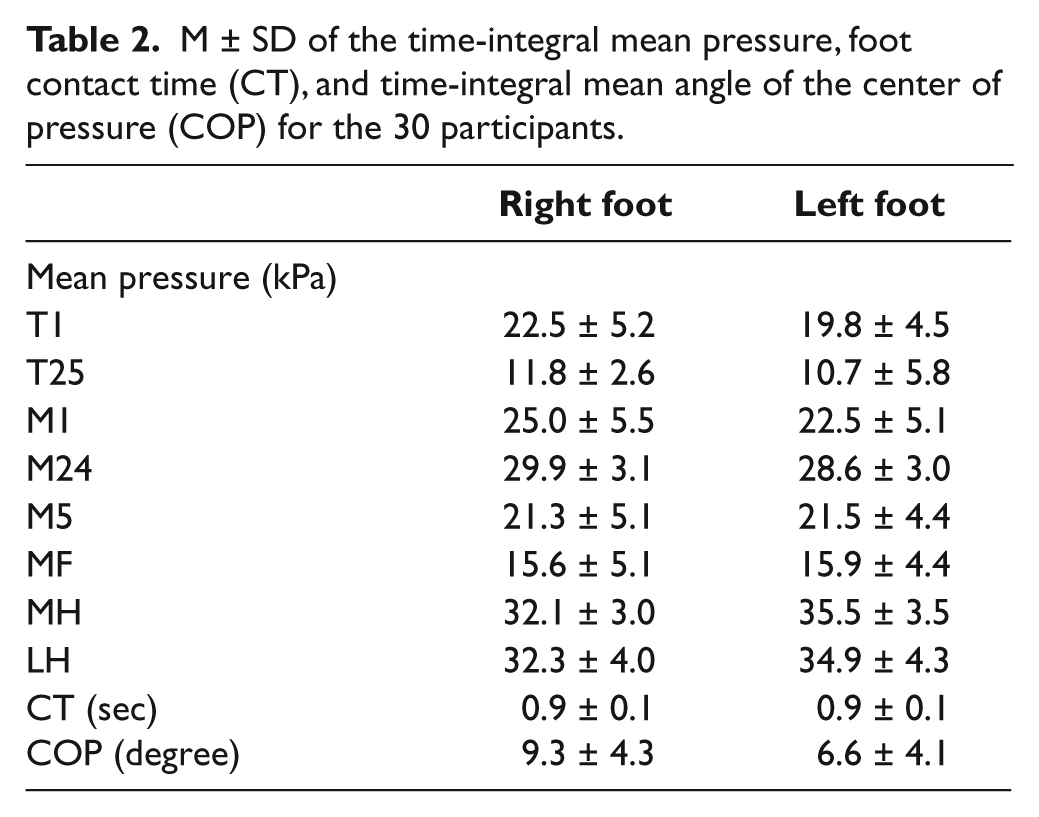
The overall M ± SD age of the participants was 24.9 ± 3.7 (range 21–32) years, and body mass index was 20.6 ± 1.8 kg/m2. Males constituted 50% (n = 15) of the participants, all of whom had normal foot postures by visual inspection. The greatest time-integral mean pressures were seen under the medial and lateral heel. The mean foot contact time was 0.9 sec in both feet, and the time-integral mean angle of the COP was 9.3° in the right foot and 6.6° in the left. Data describing the participant characteristics and the means and standard deviations of the variables are presented in Tables 1 and 2.
Characteristics of the 30 participants.
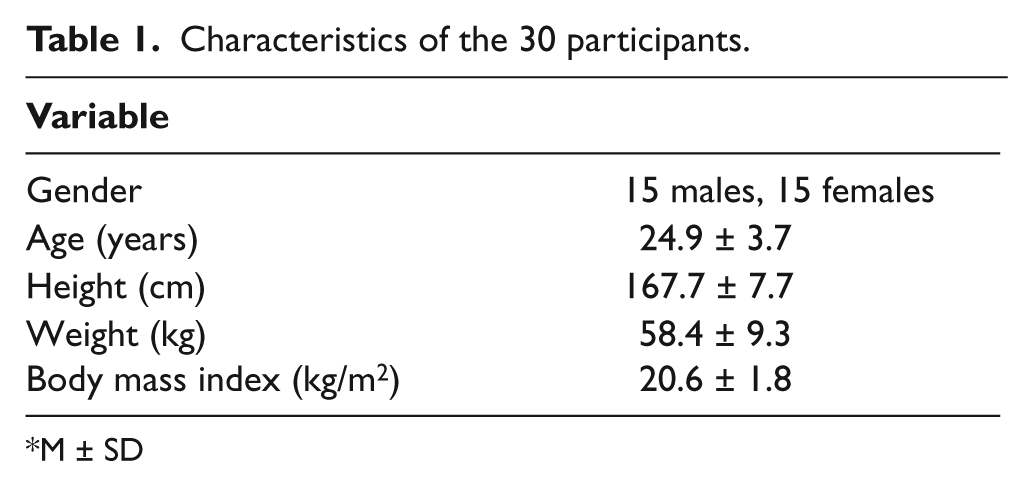
M ± SD
M ± SD of the time-integral mean pressure, foot contact time (CT), and time-integral mean angle of the center of pressure (COP) for the 30 participants.
Intrasession reliability
The intrasession reliability of the first and second examiners was good to moderate for all spatiotemporal parameters, as evidenced by ICCs ranging from 0.69 to 0.95. The CoV of the variables ranged from 63.35 to 10.07% for the first examiner and 59.97 to 9.77% for the second. The CoV of the COP showed the greatest percentage differences for all variables assessed by the two examiners (Tables 3 and 4). There were no systematic differences in the mean values as evidenced by repeated-measures ANOVA for all spatiotemporal parameters assessed within examiners (p > 0.05).
Intrasession reliability (intraclass correlation coefficients (ICC) and coefficients of variation (CoV)) of the time-integral mean pressure (kPa), foot contact time (CT), and angle of the center of pressure (COP) obtained from six repeated trials by the first examiner.
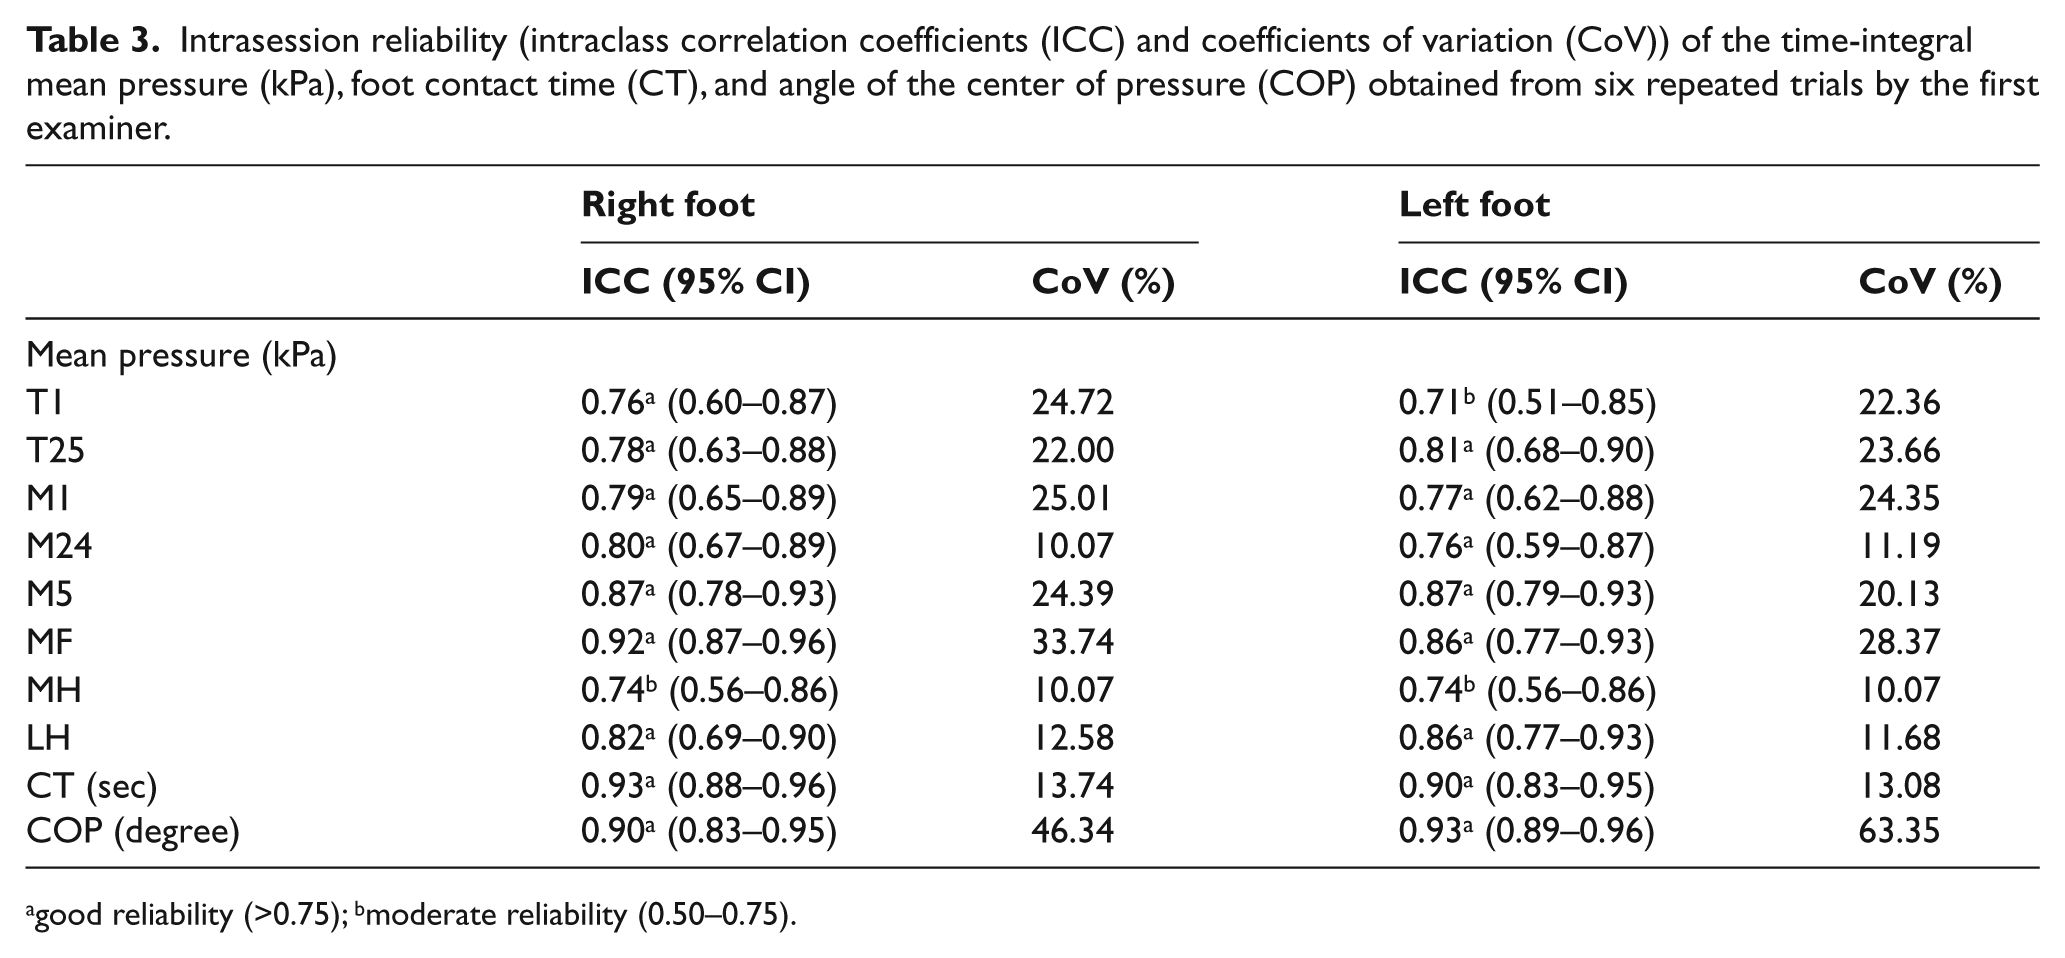
good reliability (>0.75); bmoderate reliability (0.50–0.75).
Intrasession reliability (intraclass correlation coefficients (ICC) and coefficients of variation (CoV)) of the time-integral mean pressure (kPa), foot contact time (CT), and angle of the center of pressure (COP) obtained from six repeated trials by the second examiner.
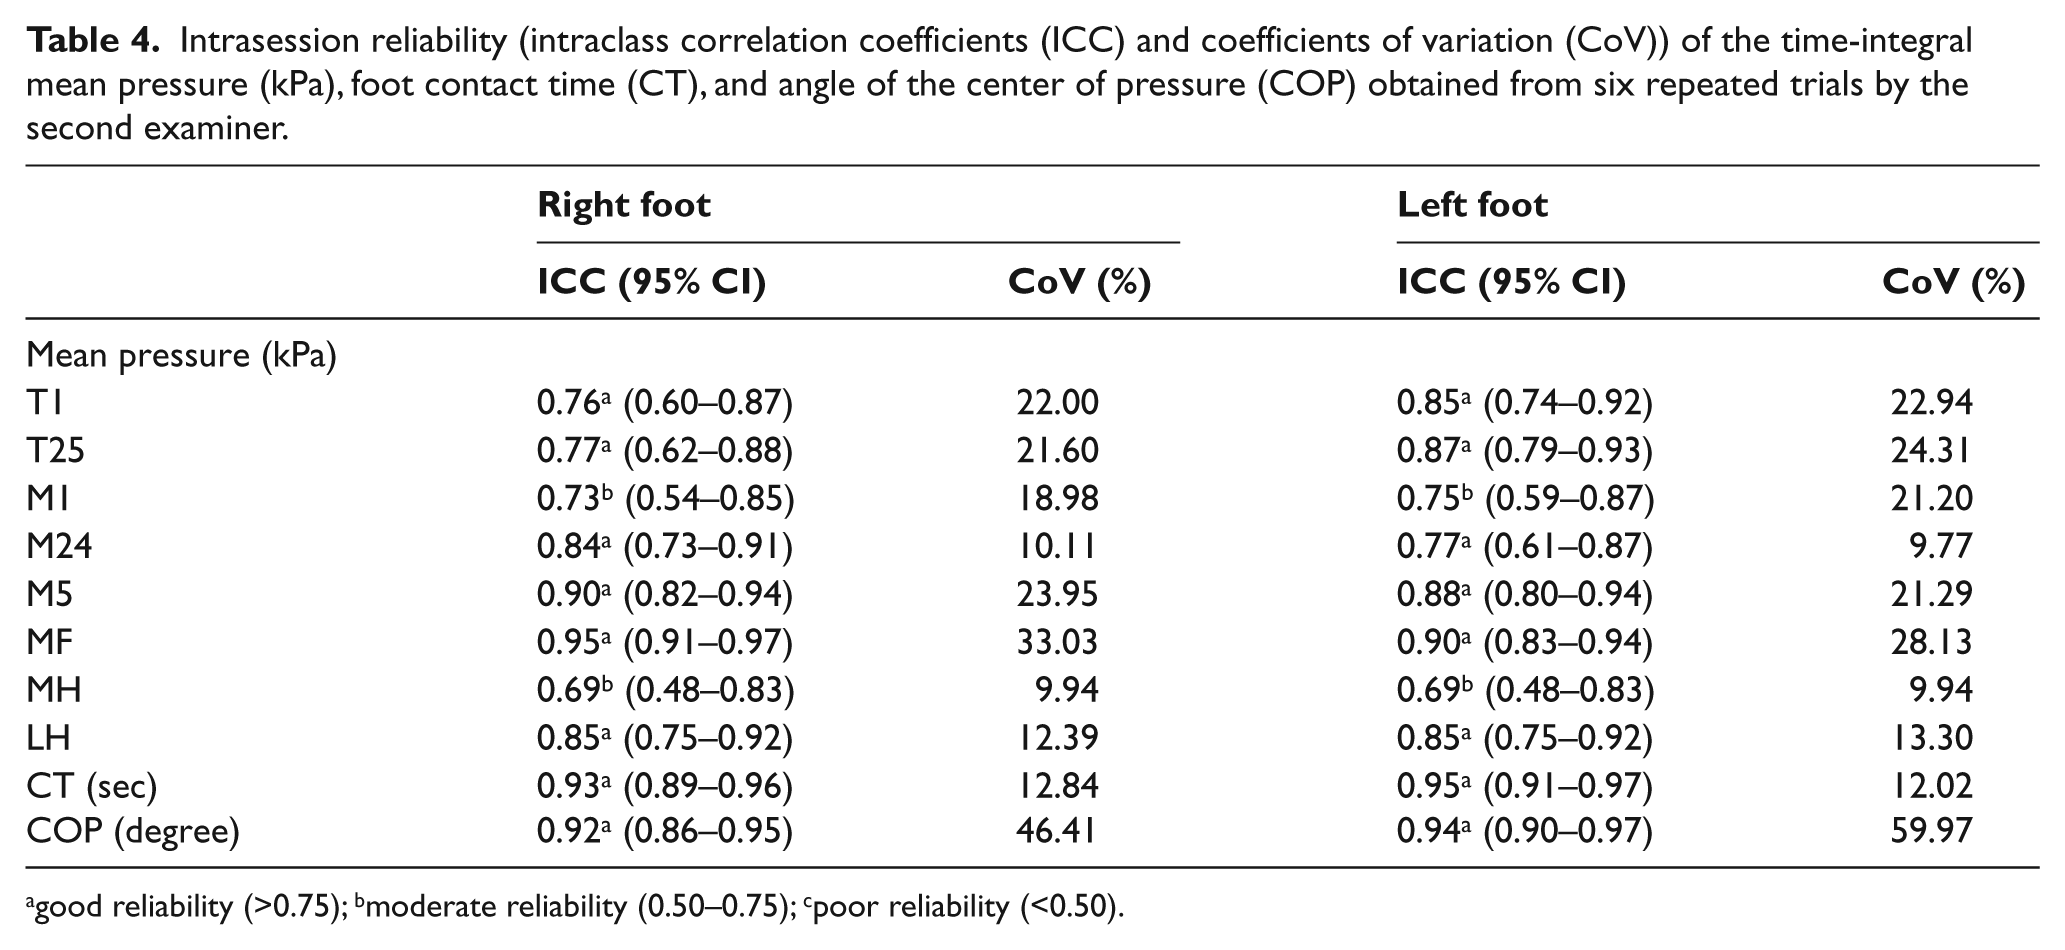
good reliability (>0.75); bmoderate reliability (0.50–0.75); cpoor reliability (<0.50).
Intersession reliability
The reliability between the two examiners was good for all spatiotemporal parameters, as evidenced by ICCs of 0.84–0.97. The CoV for the COP had the greatest percentage differences, 46.38% for the right foot and 61.7% for the left. The respective CoVs were 33.39% and 28.25% for the mean pressure for MF, 24.17% and 20.72% for M5, 22.07% and 22.82% for M1, 23.36% and 22.66% for T1, and 21.79% and 23.99% for T25. There were no systematic differences in the mean values as evidenced by repeated-measures ANOVA for all spatiotemporal parameters assessed between the two examiners (p > 0.05) (Table 5).
Intersession reliability of the time-integral mean pressure, foot contact time (CT), and angle of the center of pressure (COP).
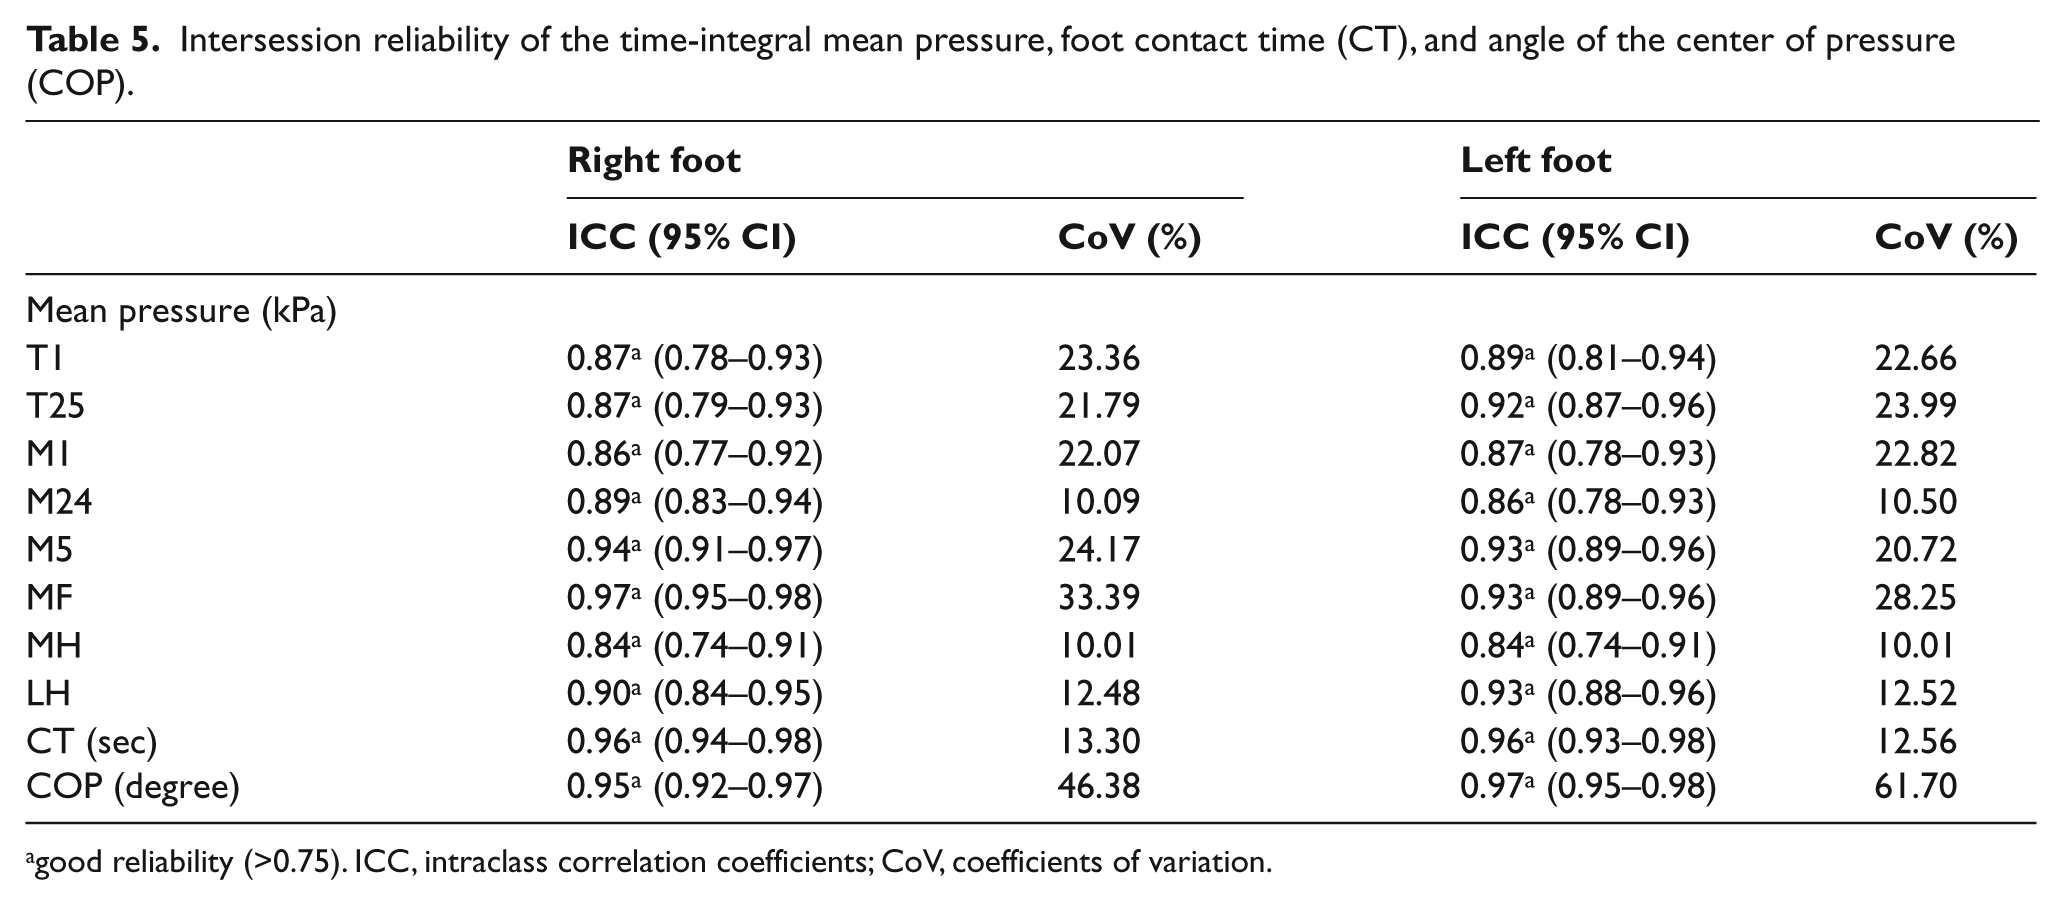
good reliability (>0.75). ICC, intraclass correlation coefficients; CoV, coefficients of variation.
Discussion
Numerous systems have been introduced to investigate the interaction between the foot and ground for evaluating footwear, improving sports performance, or analyzing gait clinically. PPMSs consist of two main types of device: platform systems and in-shoe measurement systems.
Several in-shoe measurement systems have been developed using one of three basic technologies, namely force-sensitive resistive film, capacitive transducers, or piezoelectric elements in either discrete or matrix fabrication format. 10 In-shoe measurement systems have insole sensors embedded in the insole of the shoe, which have the advantage of enabling the clinician to evaluate gait instead of isolated footsteps. Nevertheless, in-shoe measurement systems have drawbacks, such as poor mechanical durability and stability during long-term use, nonlinearity, hysteresis and the need to adjust offsets and sensitivity. Using a matrix form, the exact location of anatomical landmarks is difficult to identify. Additionally, insole sensors, placed in a shoe, are compressed by the foot while the shoe is worn, and these may interfere with a natural gait pattern as these remain connected to a computer during data collection. Toe movement in shoes creates a signal even during the swing phase of gait, which makes the interpretation of the force signal more ambiguous in case of foot deformities. A study of the F-Scan system (Tekscan, Boston, MA, USA) indicated that it lacks durability and suffers significant calibration error, and significant variability in output within and between sensors was detected. 11
Although the drawbacks have been reduced with technological advances in in-shoe measurement systems, many studies have used foot platform systems, which are usually limited to a single-strike, one-off footsteps, and measure the force acting on the bare foot; such studies have also been conducted using different gait protocols. The mid-gait protocols, in which pressure is measured during a steady state somewhere halfway along a relatively long walkway, are the traditional data-acquisition protocols, but these require a relatively large space and time to acquire data. Because this method is unsuitable for obtaining pressure data due to fatigue, the risk of foot injury, or difficulty targeting the sensor platform, especially in individuals with disabilities, different step protocols involving fewer steps before contact have been used, i.e. first-step and two-step gait-initiation protocols.
Although it has been argued that alternative gait protocols may affect spatiotemporal parameters, suggesting that neither of the alternative gait protocols is interchangeable with the mid-gait method, 12 the two-step gait-initiation protocol has the advantage of requiring the smallest number of repeated trials to obtain reliable pressure data and may be preferred because of the ease and speed of data collection,13,14 while one-step gait-initiation protocol produces a longer stance phase and has starting problems that patients with chronic arthritis have difficulty with starting to walk out of a rest position because of joint stiffness, which does not represent natural gait pattern. 15 Because the patients with foot problems usually have comorbid chronic medical problems and tend to easily fatigue in clinical trials, we thought that it was more suitable to establish a range of normal values and determine the reliability of PPMS, using the two-step gait-initiation protocol which requires a relatively small space and time and may not interfere with their own walking pattern.
The results showed that the reliability of the Gaitview® AFA-50 system was moderate to good within and between examiners. Although the participants walked at a self-selected comfortable pace in every trial, so that the foot CT would be predicted to be variable, the ICCs and CoV of the foot CT ranged from 0.90 to 0.96 and 12.02 to 13.08% within and between examiners, respectively, indicating relatively good reliability in comparison with the other parameters.
Gait speed is one of the variables affecting pressure data obtained from platform systems. Hughes et al. concluded that the total force and peak pressure increase linearly with walking speed, although this is not the case for all sites on the foot. 4 Nevertheless, a study that compared the plantar pressure produced by five different modes of walking showed no significant differences in the plantar pressure across protocols, 16 which is in agreement with a report by Talor et al., 17 who concluded that no significant differences were evident between self-selected slow and normal speeds for maximum force and peak pressure values using the two-step gait-initiation protocol. This suggests that when assessing the effects of various interventions on plantar pressure patterns, correcting for small changes in walking speed at slower speeds may not be critical for maximum force and peak pressure measurements.
In our study, however, the results showed the greatest percentage differences in the CoV of the COP for all variables and the CoV for the time-integral mean pressure of the MF and forefoot areas such as T1, T25, M1, and M5 within and between sessions ranged from 33.39 to 20.72%, which were relatively higher percentage differences compared with those for M24, LH, or MH.
In gait, the weight-bearing foot shows the COP of approximately 6 to 7° from the sagittal direction, which varies with walking speed or the individual. The self-selected comfortable pace of participants caused the greatest percentage differences in the CoV of the COP, which may affect the CoV for the time-integral mean pressure of the MF and forefoot.
Studies of the Novel EMED® plantar pressure platform, which used a between-day study protocol to examine the reliability of measurements of peak pressure, maximum force, impulse, and contact time in 10 regions of the foot in nine asymptomatic participants, found that the CoV in the midfoot and lesser toe regions showed the greatest percentage differences and concluded that areas of relatively high loading, such as the forefoot, showed higher reliability (ICC > 0.90) than did areas of lesser loading, such as the medial midfoot, which displayed lower reliability (ICC < 0.80). 18 As the medial heel within-examiner measurement displayed lower reliability (ICC < 0.75) in our study, these results are somewhat different from our data, which may reflect the characteristics of the hardware and software used.
The Gaitview® AFA-50 system is similar to the Novel EMED AT® platform but has a slightly lower resolution of 1.3 sensors/cm2 compared with two sensors/cm2, a lower sampling frequency of 17 Hz compared with 50 Hz, and pressure range of 0–1000 kPa compared with 10–1270 kPa.
Additionally, the Gaitview® AFA-50 system uses automated software that subdivides the foot into eight areas rather than 10. The automated masking algorithm of the Novel EMED AT® platform divides the foot into the lateral and medial heel, lateral and medial midfoot, lateral, central, and medial forefoot, hallux, second toe and third to fifth toes.
The data of measurement outcomes are somewhat different according to PPMSs of different technologies, even if they were obtained from a normal population. It may mean that each PPMS has its own normal values of plantar pressure measurements. Therefore, it indicates the need to establish a range of normal values, which cannot be extrapolated from the data of the other PPMSs if assessed for the diagnosis of foot problems or orthoses-making, and determine the reliability of the PPMSs with the standardised protocol. It is also necessary to assess the reliability of the PPMSs with reproducible protocols in patients with foot problems, because there may be a larger variation in parameters between measurements.
Conclusion
Our results indicate that the Gaitview® system using the two-step gait-initiation method demonstrates good to moderate reliability for measuring plantar pressure, similar to that of other commercial plantar pressure measurement systems, and that it is suitable for use in clinical and research trials.
Footnotes
Funding This research was supported by Uijeongbu St. Mary’s Hospital Clinical Medicine Research Program year of 2010.
We report no any commercial relationships or conflicts of interest.