
Abstract
Background: Pressure sores are a significant problem in the healthcare sector. Although they may cause considerable morbidity, they are preventable.
Objectives: The objectives of this study are to (1) investigate the electrical properties of a tissue close to and away from the pressure sore site, and (2) establish a new approach for objective, reliable, low-cost and noninvasive screening or detection of pressure sore in its early stage.
Study Design: Randomised controlled trial.
Methods: Fifteen patients participated in this study. They all had stage I or stage II sacral pressure sores. Tiny surface electrodes in four-electrode configuration were used for all tissue electrical properties measurements recorded over the frequency range of 30–10 MHz.
Results: Intraclass correlation coefficient (ICC) showed that all measurements (ICC > 0.90 for all measurements) had good reliability and validity. The real part of impedance (R) and the imaginary part of impedance (X) of a tissue measured close to the pressure sore site was found to be significantly smaller (p < 0.05 in all cases) than that measured away from the pressure sore site at a specific frequency range (R: 30.00–38.55 Hz; X: 43.95–606.40 Hz). It was also found that the extracellular resistance (Re) and the ratio of extracellular resistance to intracellular resistance (Re/Ri) of a tissue measured close to the pressure sore site were significantly smaller (p < 0.05 in all cases) than that measured away from the pressure sore site.
Conclusions: Since the electrical properties (R, X, Re, Re/Ri) of a tissue close to, and away from, the pressure sore site can be significantly distinguished, a potentially promising method for the screening of pressure sores at an early stage has been proposed.
Clinical relevance
Significant separation of tissue proximity to pressure sores can be achieved using tissue electrical properties measurement.
Background
People who are old or very ill are likely to get pressure sores. Pressure sores must be taken seriously, if left unchecked a sore can lead to amputation or, in the worst case, death.1,2 Pressure sores remain a significant problem in both the acute and community health settings. They generally lengthen the time spent in hospitals or nursing homes and therefore the cost of treating an established pressure sore can be high.1,2 For example, the annual Medicare cost for pressure sores in the USA is around $1.3 billion. 3 On the other hand, more than 66% of pressure sores occur in patients over 70 years. 4 The average age of old people having pressure sores is about 76.4 years. 5 Taiwan has been facing problem of an aging population since 1993. Currently, 8.86% of the population in Taiwan is aged over 75 (about two million people) and it is estimated that this population will be about 21.68% in 2036. 6 This emphasizes the need for prevention and, as pressure sores are preventable, this is a feasible goal. 7
Pressure sores usually develop over bony parts of the body that do not have much fat to pad them. They are most common on the heels and on the hips. Other at-risk areas include the base of the spine, the shoulder blades, the backs and sides of the knees, and the back of the head. The damage from pressure sores range from slight discolouration of the skin (stage 1; gentle) to open sores that go all the way to the bone (stage 4; severe). 8 Indeed, the pressure sore at stage 1 and 2 can cure within one and two months, respectively. However, in the case of stage 3 and 4, the pressure sore takes a year or more to cure. Therefore, earlier detection and immediate treatment are essential.
Clinically, there are two routine approaches for the pressure sore risk identification: risk assessment scales and clinical judgement. However, both approaches are subjective. Therefore, there is a need for an objective approach for the pressure sore risk identification. Many approaches have been explored to objectively assess the pressure sore risks. For example, a bioimpedance spectrometer was proposed to detect early sores. 9 Other approaches used colour images to analyze the presence of skin erythema. 10
In this study, tissue electrical impedance was employed for the detection of pressure sores at an early stage for the elderly with low-mobility or those who are disabled. Tissue electrical impedance signal is obtained by injecting low-level sinusoidal current into the tissue and measuring the voltage drop generated by the tissue impedance. The electrical properties of tissue vary with the frequency of the applied electric field as seen from α-, β- and γ-dispersion. 11 The α- and β-dispersion regions are more interesting in medical applications, since most changes between pathological and normal tissue occur in this range. 12 Therefore, the tissue electrical impedance was measured at α- and β-dispersion regions (30–10 MHz) in this study. Our approach is different from the approach reported by Yang and Wang in 2005. 9 They used the frequency range of 10 Hz to 1 MHz while a frequency range of 30 Hz to 10 MHz was used in this study. Moreover, the self-normalization concept has been employed in this study to avoid the large subject-to-subject differences in tissue’s electrical properties.
This study aimed to (1) investigate the electrical properties of a tissue close to, and away from, the pressure sore site, and (2) establish a new approach for objective, reliable, low-cost and non-invasive screening or detection of pressure sores at an early stage.
Methods
Subjects
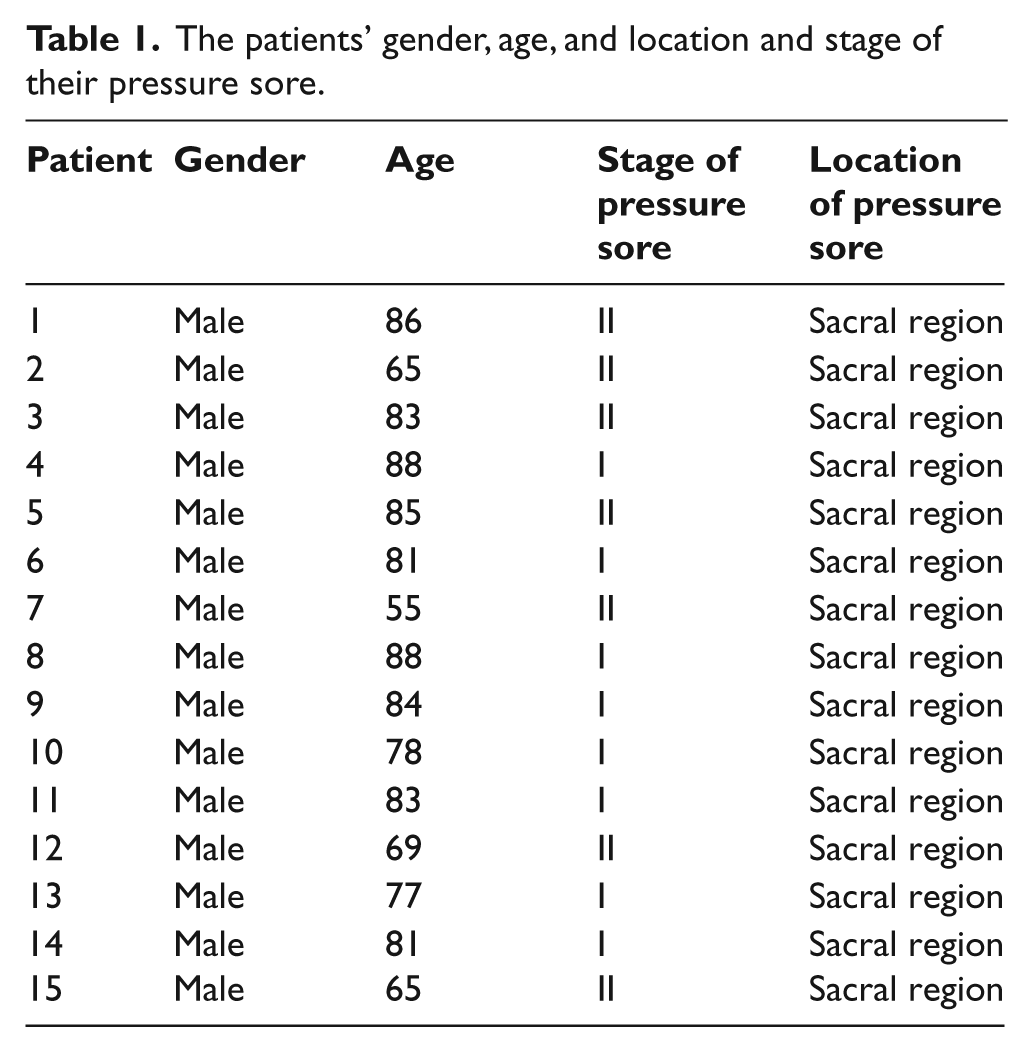
Fifteen patients with sacral pressure sores (stage 1 and 2) were recruited in this study (see Table 1). They were all male with the average age of 77.9±9.9 years old. Their average body weight was 69.7±6.3kg. The study was approved by the Institutional Review Board of National Chi Nan University. Informed consent was obtained from each subject before the experiment.
The patients’ gender, age, and location and stage of their pressure sore.
Equipment
An impedance analyzer (Precision Impedance Analyzer WK6420C, Wayne Kerr Electronics Ltd, UK) was used for all tissue electrical property measurements. An infrared thermometer (TemporalScannerTM 2000C, Exergen Corporation, United States) was used for the temperature determination of the measurement sites.
Measurement procedures
During tissue electrical property measurements, the patient was lying on their side on a sickbed. Ultra-tiny surface electrodes (Kendall Q-Trace Gold 5500 Tab, COVIDIEN, USA) were used for all tissue electrical property measurements. In order to reduce the size of the electrode, before use, each electrode was cut in half using surgical scissors. The measurement site was prepared by briskly rubbing the area for eight seconds with alcohol prep pads. Then, 16 electrodes were placed in four separate positions, each position having four electrodes (Figure 1). The four separate positions were (1) right site close to the wound (abbreviated to RCW), (2) right site far away from the wound (abbreviated to RFW), (3) left site far away from the wound (abbreviated to LFW), and (4) left site close to the wound (abbreviated to LCW). LCW and RCW are defined in this study as the measurement site 1 cm away from the left and right regional edge of the pressure sore, respectively. LFW and RFW are defined in this study as the measurement site 5 cm away from the left and right regional edge of the pressure sore, respectively. Electrodes at each position were separately connected to an impedance analyzer for all tissue electrical property measurements.
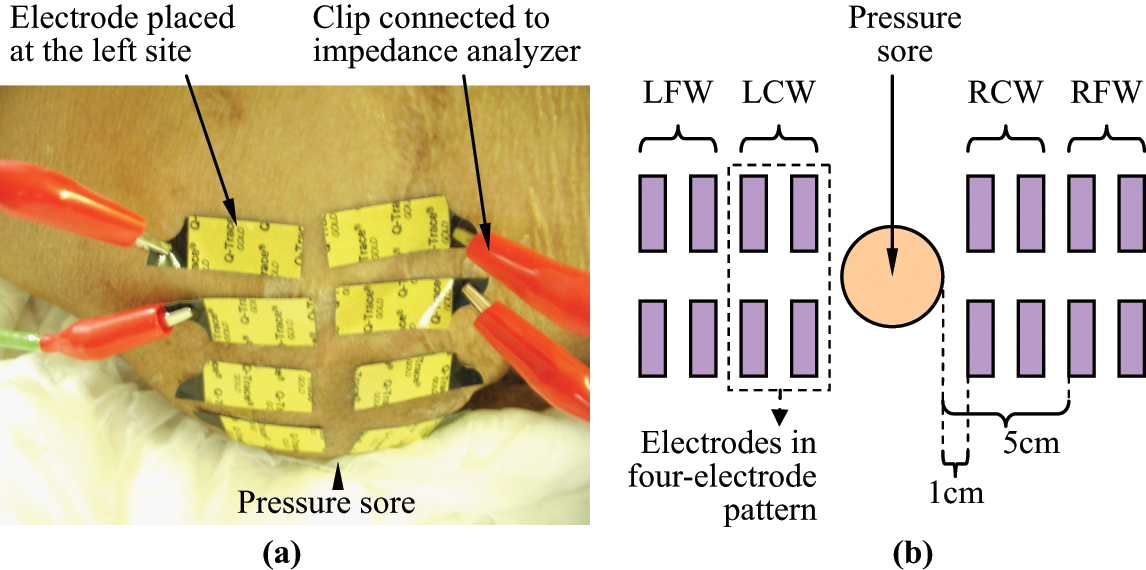
The electrodes placement on the patient for the tissue electrical property measurements. (a) The photo. (b) The schematic diagram showing the placement of the electrodes.
The impedance spectrum of a tissue at LCW, LFW, RCW and RFW were recorded over the frequency range 30 Hz–10 MHz. Within this frequency range, there was 17 frequency points per logarithmic decade. The amplitude of the perturbing wave was limited to 200 mV. For each patient, three sets of measurements of a position were made by a rater (only 1 rater in this study) on the same day. After each measurement, electrodes were detached and new electrodes attached to the same location by the rater. The purpose of these three sets of measurements is to check the intra-rater reliability of the measurements.
The temperatures of the measurement sites were determined before and after each patient measurement, using the infrared thermometer. Three separate sets of measurement were made in succession in all cases.
Data processing
Five electrical properties of a tissue close to, and away from, the pressure sore site were determined: real part of impedance (R), imaginary part of impedance (X), extracellular resistance (Re), intracellular resistance (Ri), and the ratio of extracellular resistance to intracellular resistance (Re/Ri).
Theoretically, a tissue can be electrically represented in impedance terms as a combination of a resistor placed in parallel with another resistor and a capacitor in series, 13 an equivalent circuit of the impedance of a tissue at LCW, LFW, RCW or RFW can be established as shown in Figure 2, with impedance Z:
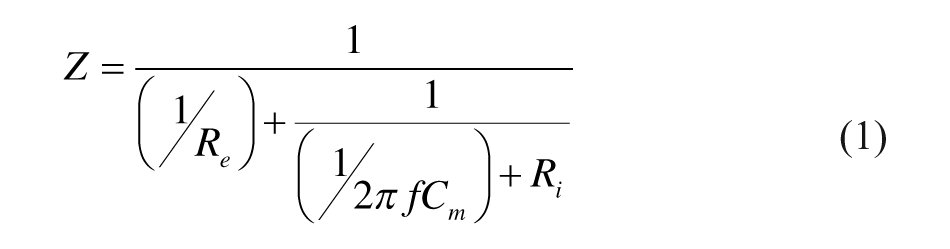
where Re and Ri are the resistance of the extracellular and intracellular medium of a tissue at LCW, LFW, RCW or RFW respectively, Cm is the capacitance of the cell membrane, and f is the frequency.
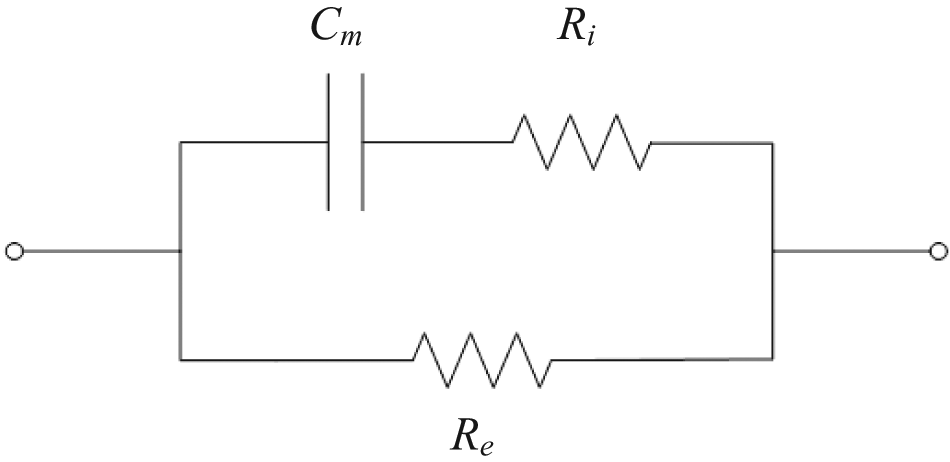
An equivalent circuit of a tissue.
When the frequency approaches zero, Equation 1 can be rewritten:

where Zf→0 is the impedance of a tissue at LCW, LFW, RCW or RFW as frequency closed to zero (30 Hz in this study).
When the frequency approaches infinity, Equation 1 can be rewritten:
where Zf→∞ is the impedance of a tissue at LCW, LFW, RCW or RFW as frequency closed to infinity (10 MHz in this study).
Electrical properties Re, Ri, and the ratio of Re/Ri of a tissue at LCW, LFW, RCW and RFW can thus be determined from Equations 2 and 3 using the impedance spectrum data recorded over the frequency range 30 Hz–10 MHz.
Also, electrical properties R and X of a tissue at LCW, LFW, RCW and RFW can be determined from Equations 4 and 5 using the impedance spectrum data recorded over the frequency range 30–10 MHz.


where Z and θ are the impedance and phase angle of a tissue at LCW, LFW, RCW and RFW, respectively.
Statistical analysis
ICC model 3 was used to evaluate intra-rater reliability (ICC 3,1) for the measurement of R, X, Re, Ri, and Re/Ri. On the other hand, two out of three trials of measurement of Re, Ri, and Re/Ri of a position made by the rater were used to draw the Bland–Altman plot in order to compare the two trials of measurements for their variability. Paired-sample t-test was used to determine whether there were significant differences between patients’ pre- and post-experimental temperatures of the measurement site (i.e. within-subject comparison) while one-way ANOVA was used to determine whether there were significant differences among patients’ temperatures of the measurement site (i.e. between-subject comparison). A non-parametric two-independent-samples test (test type: Mann–Whitney U) was used to determine whether there were significant differences among tissues at LCW, LFW, RCW and RFW for the test parameters of R, X, Re, Ri, and Re/Ri. All statistical analyses were carried out using SPSS software with the level of statistical significance set at 0.05.
Results
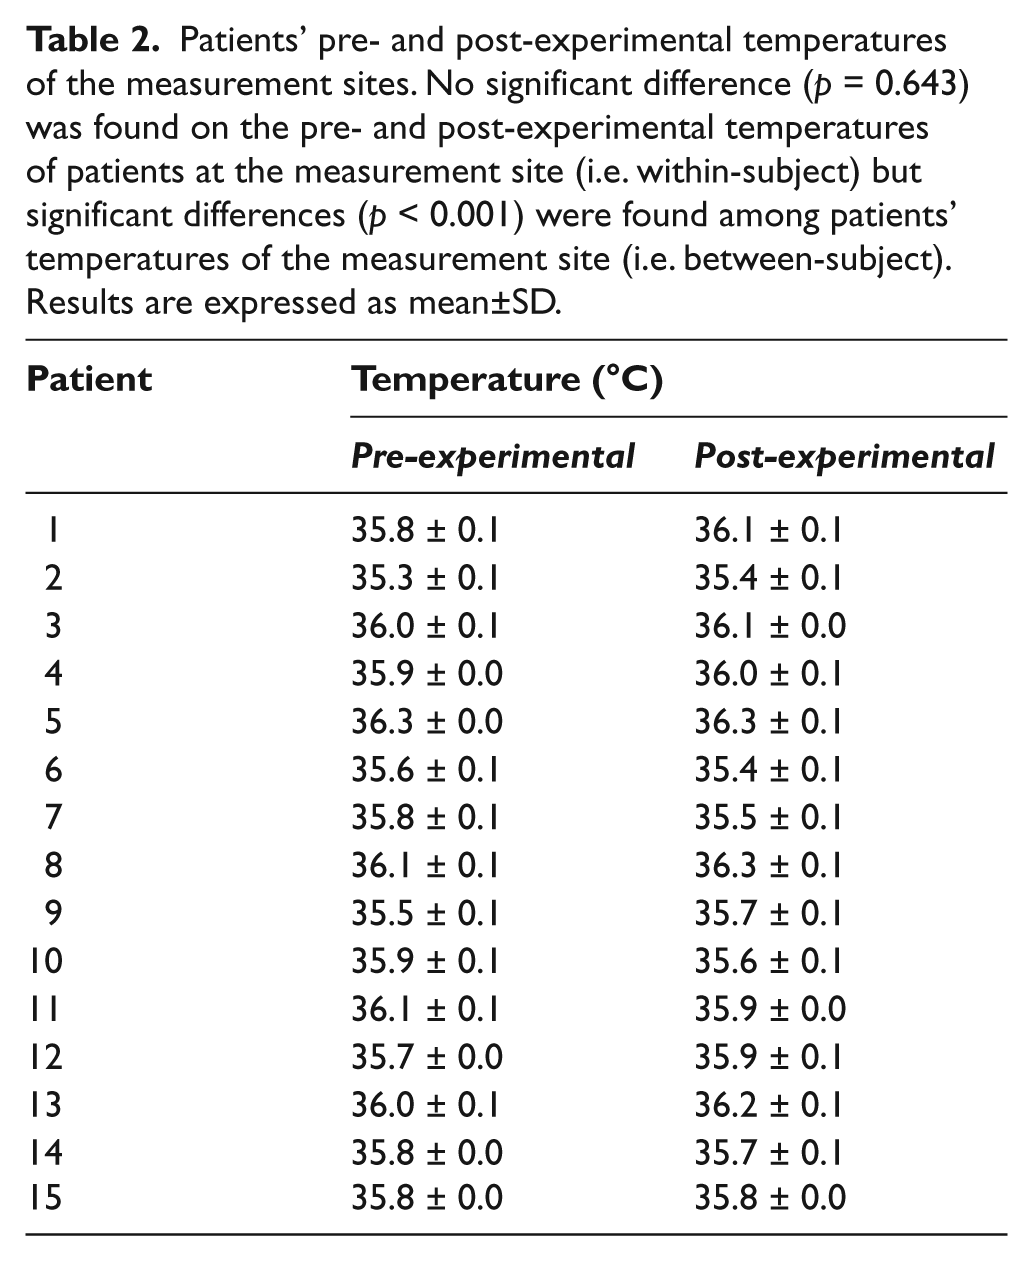
Fifteen patients were recruited to this study. They had stage I or stage II sacral pressure sores. Table 2 showed their pre- and post-experimental temperatures of the measurement sites. The pre- and post-experimental temperatures of patients at the measurement site ranged from 35.3°C to 36.3°C and 35.4°C to 36.3°C, respectively, with no statistical significant difference (paired-sample t-test: p = 0.643, within-patient comparison) being found. However, significant differences (one-way ANOVA: p < 0.001, between-patient comparison) were found among patients’ temperatures of the measurement site.
Patients’ pre- and post-experimental temperatures of the measurement sites. No significant difference (p = 0.643) was found on the pre- and post-experimental temperatures of patients at the measurement site (i.e. within-subject) but significant differences (p < 0.001) were found among patients’ temperatures of the measurement site (i.e. between-subject). Results are expressed as mean±SD.
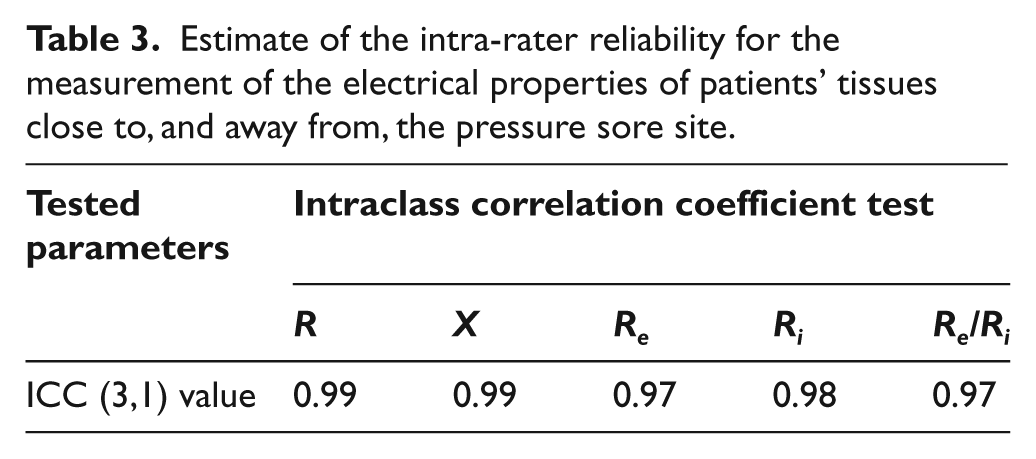
ICC for the intra-rater reliability (ICC 3,1) for the measurement of the electrical properties of patients’ tissues proximity to pressure sores are summarized in Table 3. All electrical property measurements (R, X, Re, Ri, and Re/Ri.) had ICC values ranging from 0.91 to 0.99. On the other hand, Bland–Altman plots (see Figures 3 to 5) showed that almost all the points were within the ± 2 standard deviation lines.
Estimate of the intra-rater reliability for the measurement of the electrical properties of patients’ tissues close to, and away from, the pressure sore site.
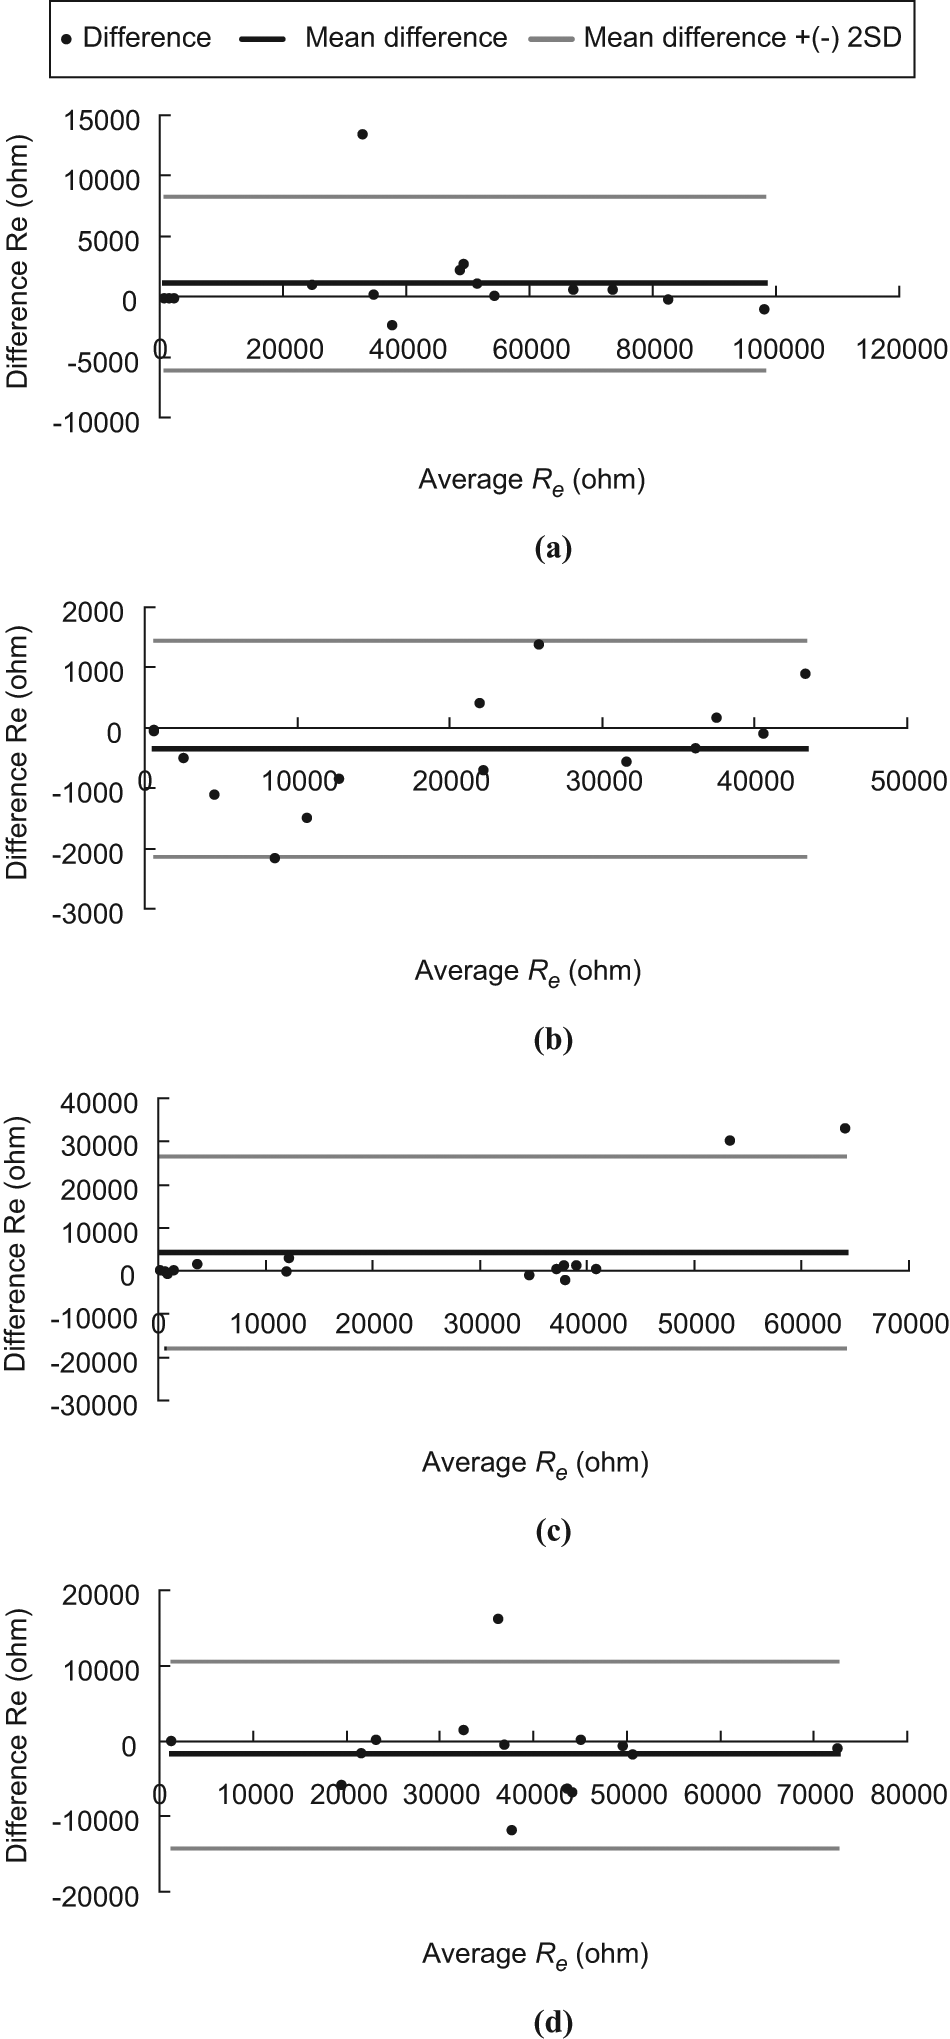
Bland–Altman plot of Re. (a) LFW, (b) LCW, (c) RCW and (d) RFW.
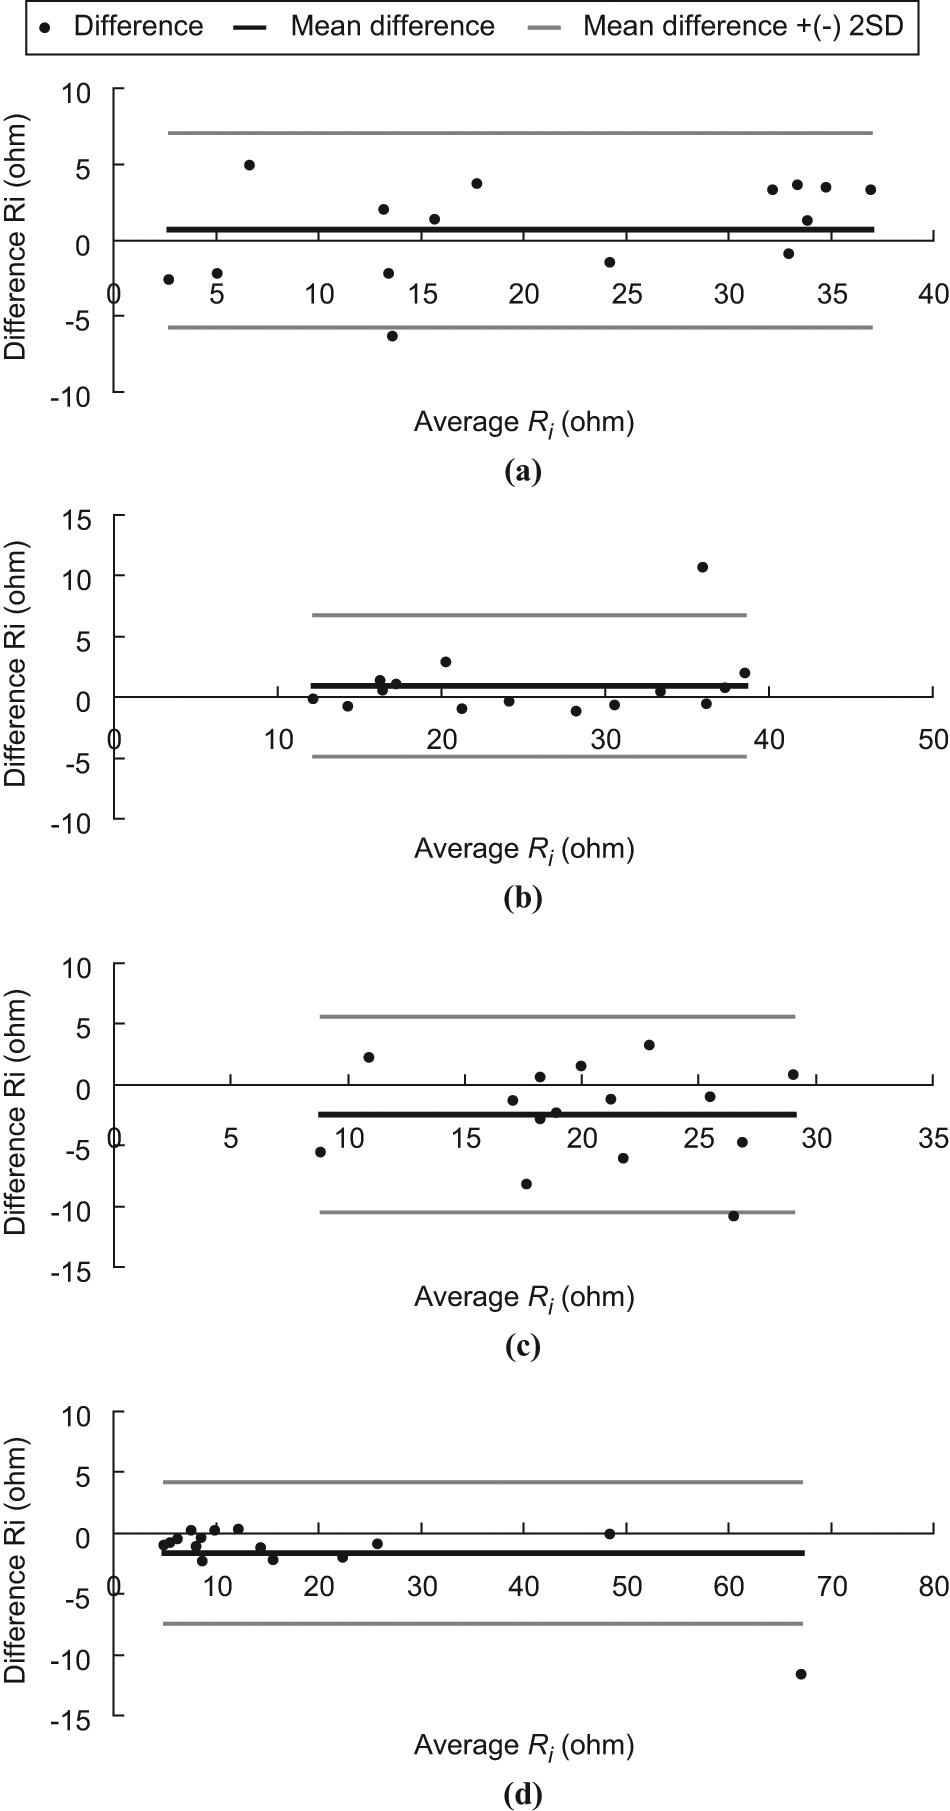
Bland–Altman plot of Ri. (a) LFW, (b) LCW, (c) RCW and (d) RFW.
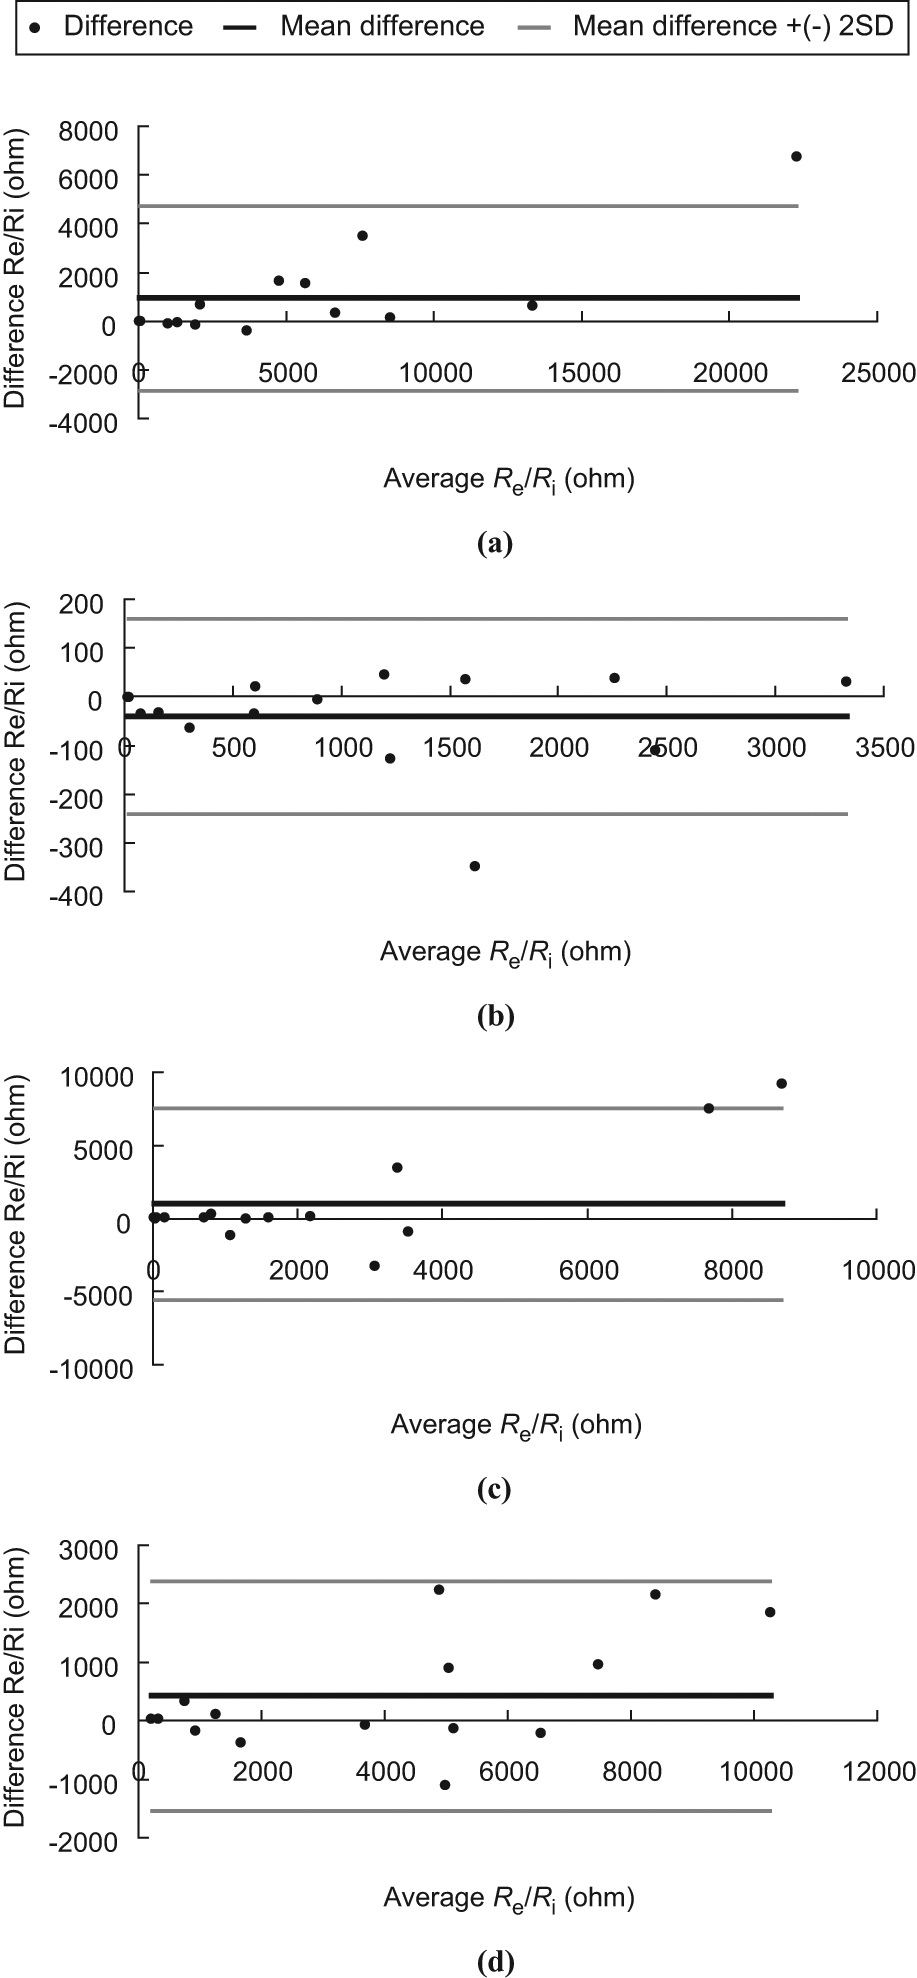
Bland–Altman plot of Re/Ri. (a) LFW, (b) LCW, (c) RCW and (d) RFW.
Figures 6 to 10 showed the electrical properties (R, X, Re, Ri, and Re/Ri.) of a tissue proximity to a pressure sore. It was found that the R (Figure 6) and X (Figure 7) decreased when the frequency increased. Moreover, the R and X of a tissue measured close to the pressure sore site was generally smaller than that measured away from the site. Moreover, it was found that the R and X of a tissue measured close to the pressure sore site was found to be significantly smaller (non-parametric two-independent-samples tested with Mann–Whitney U test: p < 0.05 in all cases) than that measured away from the pressure sore site at a specific frequency range (Table 4, R: 30.00–38.55 Hz; X: 43.95–606.40 Hz).
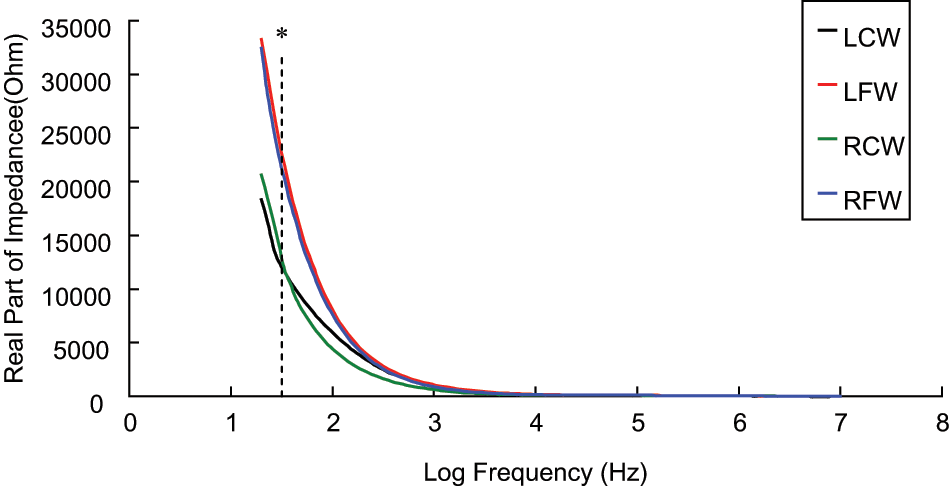
The spectrum (30 Hz–10 MHz) of real part of impedance (R) of a tissue close to, and away from, the pressure sore site (n = 15). A significant difference (p < 0.05, represented by *) was found on R of a tissue close to, and away from, the pressure sore site between the frequency range of 30 Hz and 38.55 Hz. Results are expressed as mean.
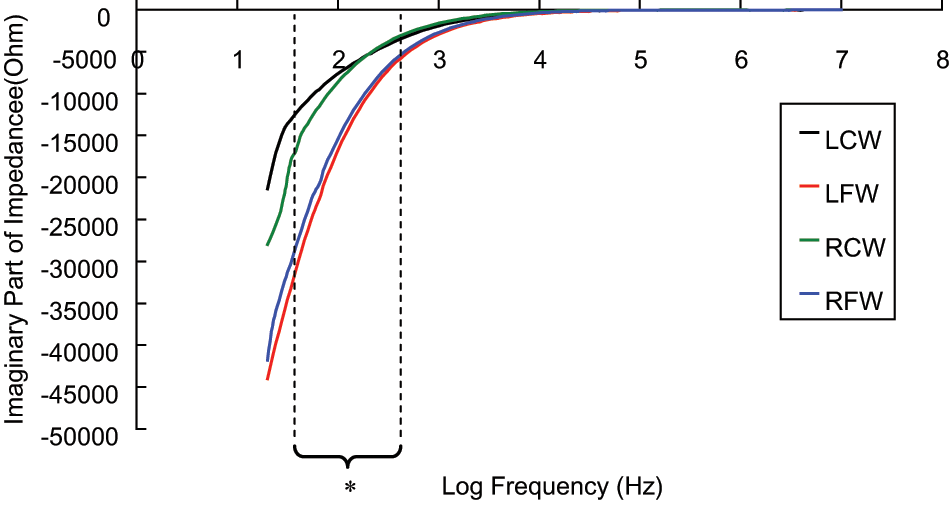
The spectrum (30 Hz–10 MHz) of imaginary part of impedance (X) of a tissue close to, and away from, the pressure sore site (n = 15). A significant difference (p < 0.05, represented by *) was found on X of a tissue close to, and away from, the pressure sore site between the frequency range of 43.95 Hz and 606.40 Hz. Results are expressed as mean.
Comparison of electrical properties (real and imaginary part of impedance) between different locations.
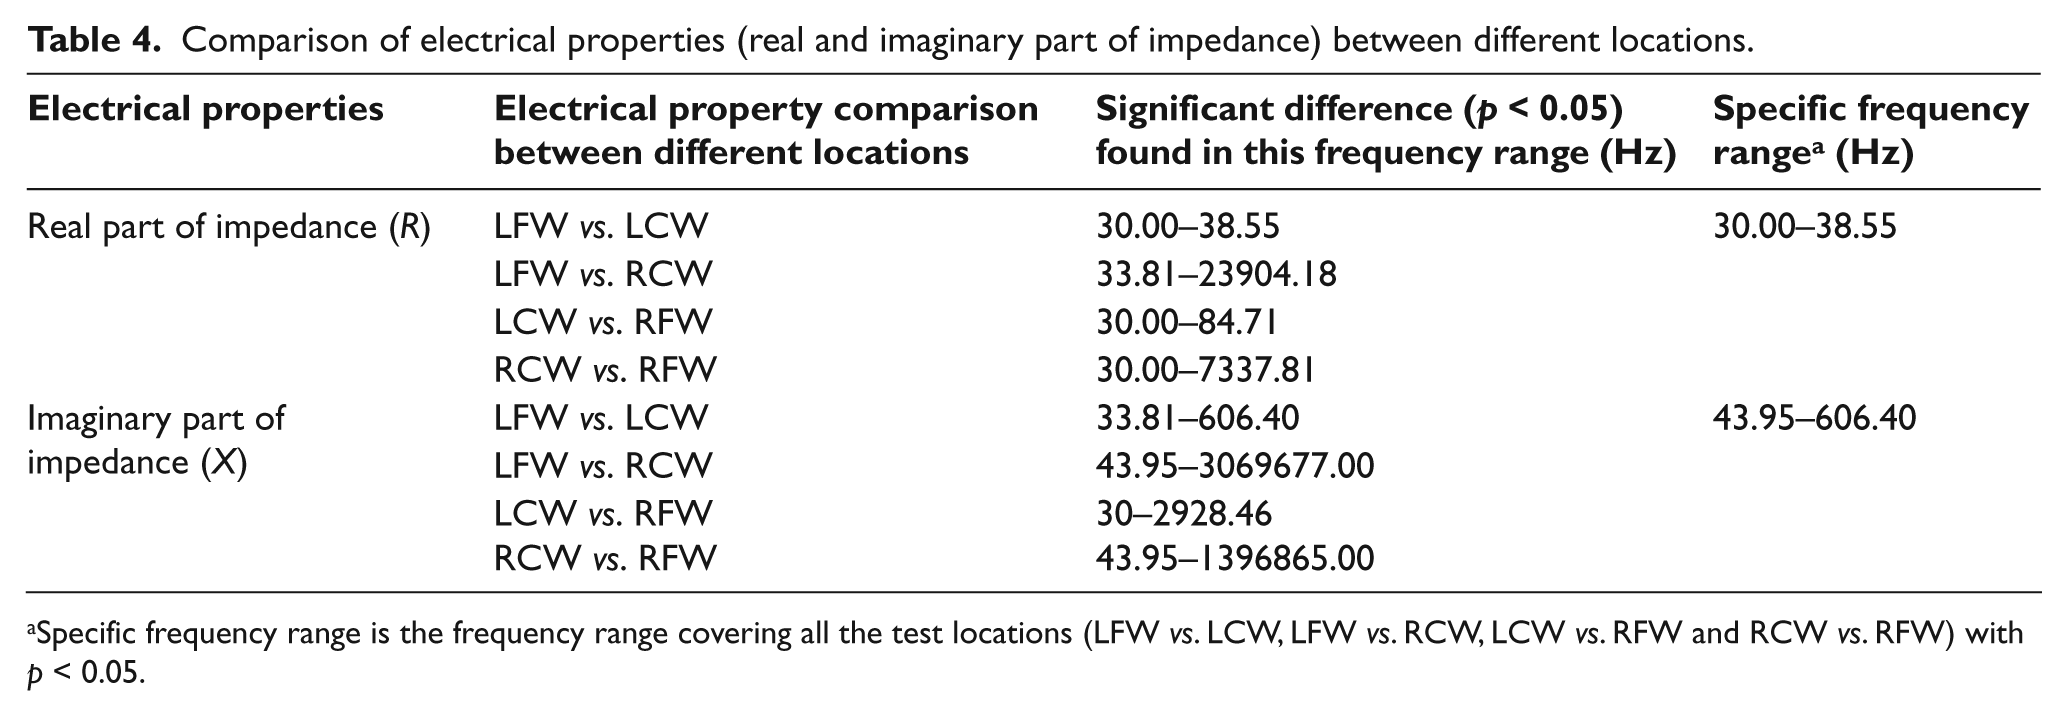
Specific frequency range is the frequency range covering all the test locations (LFW vs. LCW, LFW vs. RCW, LCW vs. RFW and RCW vs. RFW) with p < 0.05.
The Re (Figure 8) and the ratio of Re/Ri (Figure 9) of a tissue measured close to the pressure sore site were also found to be significantly smaller (non-parametric two-independent-samples tested with Mann–Whitney U test: p < 0.05 in all cases) than that measured away from the pressure sore site. However, it was found that the Ri of a tissue measured close to the pressure sore site was close to that measured away from the pressure sore site (Figure 10), with no statistically significant difference.
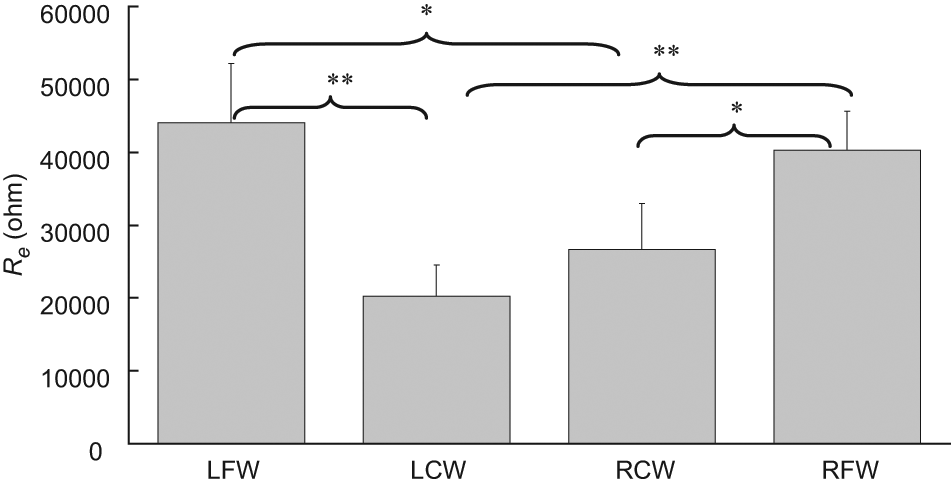
Extracellular resistance (Re) of a tissue measured at LCW, LFW, RCW and RFW (n = 15). Statistically significant difference was found (p < 0.05 represented by * and p < 0.001 represented by **). Results are expressed as mean±standard error of mean.
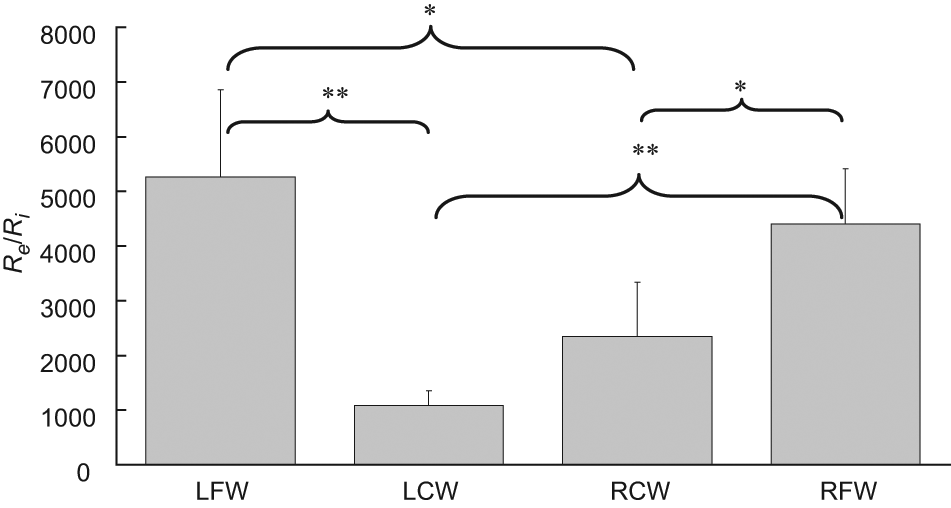
The ratio of extracellular resistance to intracellular resistance (Re/Ri) of a tissue measured at LCW, LFW, RCW and RFW (n = 15). Statistically significant difference was found (p < 0.05 represented by * and p < 0.001 represented by **). Results are expressed as mean±standard error of mean.
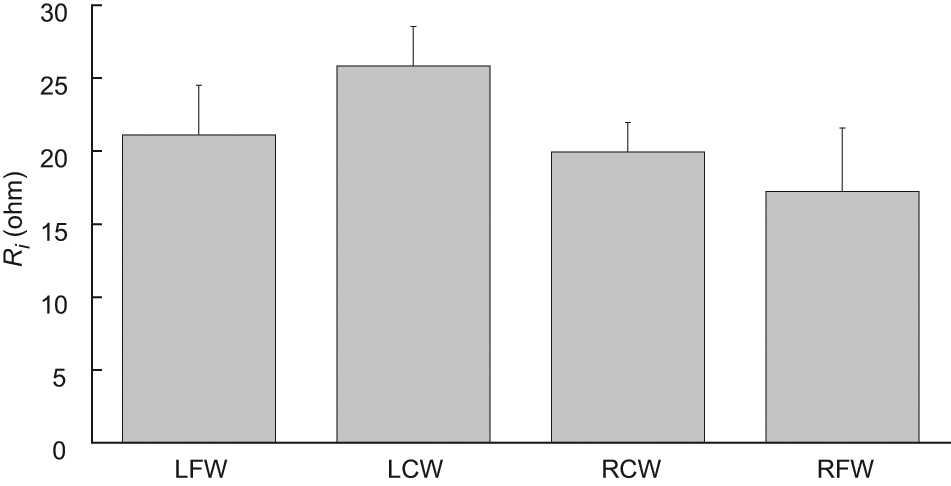
Intracellular resistance (Ri) of a tissue measured at LCW, LFW, RCW and RFW (n = 15). No statistically significant difference was found. Results are expressed as mean±standard error of mean.
Discussion
As temperature has an influence on tissue impedance measurements, 14 patients’ pre- and post-experimental temperatures were measured in this study. Since there were no significant differences (p = 0.643) between the two temperatures of the measurement site (i.e. within-subject temperature), the influence of temperature on the tissue impedance measurements of a patient therefore was assumed to be insignificant. The possible explanation for the comparable pre- and post-experimental temperatures of the measurement site is that the measurement time is short. Therefore, heat loss or heat gain at the measurement site is minimal. Conversely, although significant differences (p < 0.001) were found among patients’ measurement site temperatures (i.e. between-subject temperature), the lowest and the highest temperatures among patients were 35.3°C to 36.3°C respectively, with 1°C temperature difference. For the reason that the measurement site temperature difference among patients was small, therefore, the effect of temperature on patients’ impedance was assumed to be minor and negligible.
The ICC is a measure that can be used to quantify the reproducibility of a variable and a measure of the homogeneity within groups (tissues at LCW, LFW, RCW and RFW) of replicate measurements relative to the total variation between groups. For ICC values ranging from 1.0 to 0.81, the reliability was considered excellent; from 0.80 to 0.61, very good; from 0.60 to 0.41, good; from 0.40 to 0.21, reasonable and, finally, from 0.20 to 0.00, poor. 15 . However, for many clinical measurements reliability should exceed 0.90 to ensure reasonable validity. 15 In this study, all the ICC (3,1) measurements exceeded 0.90 and this suggests that they have exceeded the threshold for both good reliability and reasonable validity. On the other hand, from the Bland–Altman plots, it was observed that all the points are within the ± 2 standard deviation lines being observed in Figures 3b and 5d. One out of 15 (6.7%) of the points are beyond the ± 2 standard deviation lines being observed in Figures 3a, 3d, 4a through 4d and 5a through 5c. Two out of 15 (13.3%) of the points are beyond the ± 2 standard deviation lines being observed in Figures 3c. Based on the Bland–Altman plots (see Figures 3 to 5), the two trials of measurement of Re, Ri, and Re/Ri of a position made by the rater are agreeable and repeatable.
Impedance measurements can be in two-electrode configurations, four-electrode configurations and so on. In this study, a four-electrode impedance measurement was utilized for the reason that this could lead to the measured impedance essentially being independent of the contact impedance between electrode and tissue. But, four-electrode configurations create a sizing problem. In order to solve this problem, the commercial surface electrode was cut in half before use.
As shown in Figure 6, the R of a tissue measured close to the pressure sore site was generally smaller than that measured away from the site. A likely explanation for the changes observed is as follows. It is the assumption that the tissue away from the pressure sore site is normoxic and the tissue close to the pressure sore site is necrotic. Normoxic cells are at a regular size. Hence the extracellular space is normal. However, necrotic cells lose membrane integrity allowing continuity between the extra and intra-cellular media. In accordance with Equation 2, a significant amount of low frequency current is able to flow through the extracellular space in the normoxic condition (Figure 11). As a result of the increase of extracellular space in the necrotic condition, the amount of low-frequency current flowing through the extracellular space increases. This yields an impedance modulus decrease at this low frequency. Therefore, the phenomenon observed in Figure 6 is expected. So, the measurement of R of tissue at the specific frequency range between 30.00 Hz and 38.55 Hz may be a good mean for the screening or detection of early stage pressure sores.
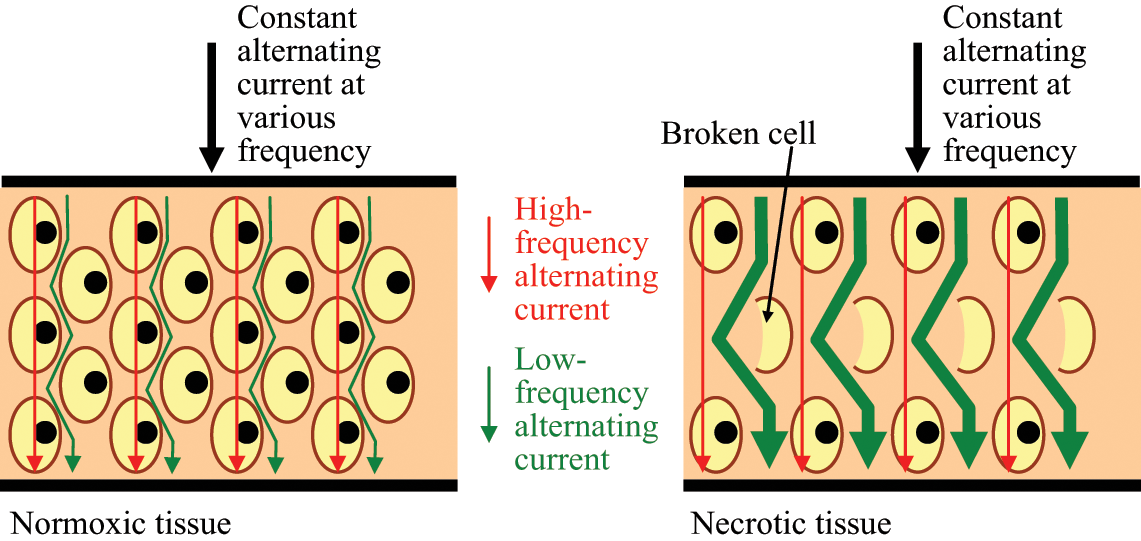
Schematic diagram showing the pathway of high- and low-frequency currents flowing through normoxic and necrotic tissue. According to Equation 2, the impedance of a tissue at LCW, LFW, RCW or RFW as frequency close to zero is equal to its extracellular resistance. This means that low-frequency current mainly flows through the extracellular medium but not the intracellular medium. In a necrotic condition, many cells rupture and this results in the increase of extracellular space. Therefore, low-frequency current has a wider extracellular space to flow and this causes the reduction in the Re.
As shown in Figure 7, the X of a tissue measured close to the pressure sore site was normally less than that measured away from the pressure sore site. A possible explanation for the changes observed is as follows. It is well known that a pressure sore cavity must be present in the fourth stage of a pressure sore, and that the cavity may sometimes be found in the early stages (I and II). In this study, all patients had either stage I or II pressure sores. Therefore, they may have a pressure sore cavity at the site close to the pressure sore rather than the site away from the pressure sore. If a pressure sore cavity is found, the capacitance effect measured just above the pressure sore cavity will increase. Once the capacitance effect increased, the reactance (i.e. imaginary part of impedance) will decrease as reactance is inversely proportional to the capacitance (i.e.
Also, the parameter of Re and Re/Ri can significantly distinguish tissues (non-parametric two-independent-samples tested with Mann–Whitney U test: p < 0.05) at LCW, LFW, RCW and RFW (Figures 8 and 10). It was found that Re of tissue measured at LCW and RCW was less (at least 1.5-fold) than that at LFW and RFW. A possible explanation is as follows. According to Equation 2, Re is equal to the impedance of a tissue at LCW, LFW, RCW or RFW as frequency close to zero (30 Hz in this study). Low-frequency current mainly flows around the cell without being able to penetrate it. Therefore, the measured value of the impedance of a tissue is dominated by contributions from the resistance of the extracellular medium. Assuming tissues at LFW and RFW are normoxic, cells are normally well packed. Therefore a low-frequency current has a very narrow and tortuous intercellular route to follow and this causes high resistance. However, with the assumption of tissues at LCW and RCW being necrotic, cells have the opposite effect on resistance. Therefore, tissues at LCW and RCW have a widening extracellular space because of the loss of membrane integrity and this allows continuity between the extra- and intra-cellular media. Therefore, this would be expected to decrease resistance. Conversely, the test parameter Ri is not a good gauge for the screening or detection of pressure sores as no significant differences among tissues at LCW, LFW, RCW and RFW were found.
Self-normalization concept has been employed in the test parameter of Re/Ri in order to avoid the large subject-to-subject differences in tissue. Therefore, the test parameter of Re/Ri is more trusted and powerful compared to the test parameter of R, X, Re or Ri alone on distinguishing the tissues at LCW, LFW, RCW and RFW. It was found that Re/Ri of tissue measured at LCW (p < 0.001 and p < 0.001 as compared with LFW and RFW, respectively) and RCW (p = 0.006 and p = 0.002 as compared with LFW and RFW, respectively) was significantly less (at least 1.9-fold) than that at LFW and RFW. Therefore, the parameter of Re/Ri is the best indicator to significantly distinguish tissues at LCW, LFW, RCW and RFW.
Conclusions
Significant separation of tissues close to, and away from, the pressure sore site can be achieved using the measurement parameter of R, X, Re and Re/Ri. The ratio Re/Ri is a potential and trustable measurement parameter for distinguishing tissues close to, and away from, the pressure sore site. ICC showed that all measurements have good reliability. The advantage of this method as a potential screening test is that it can provide an immediate result and may be used by those with minimal training in a primary care setting or in the developing world.
Footnotes
Acknowledgements
The authors wish to thank the patients who participated in this study.
Funding
This work was supported by grants from the Puli Veterans Hospital Grant (99A019-1), Taiwan, Republic of China. This work was also partially supported by a grant (NSC 99-2221-E-260-004-) from the National Science Council, Taiwan, Republic of China.