
Abstract
The extent of the domain over which a model validation demonstrates the reliability of a model is discussed and a simple schematic diagram is used to illustrate the domain. The schematic diagram can also be used to optimise the physical test campaign required to demonstrate the reliability of a model for its context of use. The connections to existing validation approaches and procedures are discussed.
Model validation is the process of evaluating the extent to which the predictions from a model are representative of the real-world in the Context Of Use (COU) of the model. 1 It is an important stage in establishing model credibility, which is reflected by the willingness of people, other than the model builder, to utilise predictions made with a model in making decisions with socio-economic consequences.2,3 A number of processes for assessing the reliability, or fitness for purpose, of models and simulations have been developed, including for example the Predictive Capability Maturity Model (PCMM). 4 For engineering applications, there are guidelines and standards describing validation processes, for example associated with computational fluid dynamics, 5 with structural mechanics 3 and with medical devices. 6 Recently, more detailed suggestions on the practicalities of comparing measurements made in the real-world with predictions from computational models have been provided, 7 including the use of a validation metric with fields of measurement and prediction data. 8 Barlas and Carpenter 9 have highlighted the differences between the formalised, structured approaches described in guidelines and standards and the more pragmatic approaches often employed in industry. Time and cost are critical factors when designing a validation process to be used in industry, because time-to-market and cost influence the competitiveness of a product. This leads to questions about, for instance, the appropriateness and reliability of both measurement and simulation data acquired in prior studies, sometimes referred to as ‘historical data’ (e.g. Seaman et al. 10 and Patterson et al. 11 ), whereas the guidelines and standards recommend that physical tests should be designed and performed for the specific purpose of providing data for a validation process. In a recent study, a procedure for evaluating the applicability of historical data in a validation process was developed. 11 The criteria for accepting historical data will usually be high, and little existing historical data will satisfy them; however, consideration of the criteria when specifying new physical tests will allow planned test data to become useful historical data. The FAIR data principles also have an important role to play to ensure that the data has a long and useful life. 12 Once the decision has been made that new physical tests are required to generate data for a validation process, an important question will be the volume of test data required and the range of conditions covered by them. Again, the industrialist will want to reduce time and costs by conducting the minimum number of tests compatible with achieving sufficient confidence in the model to permit it be used in making decisions with socio-economic consequences. However, there is relatively little practical guidance available on this issue. When point sensors are used to acquire measurements for a single set of conditions then it is viable to take a statistical approach, based on the ‘design of experiments’ methodologies, 13 to determine the quantity of measurements required. One guideline recommends using image-based measurement systems and comparing maps of the data that describe the strain (or deformation and stress) field across the majority of the surface of a structure. 7 However, the extent of the domain over which a validation process is relevant still needs to be addressed. A simple example is one in which a range of values of input parameters may occur in the real-world application, and consideration must be given to the domain of input values for which a validation process has demonstrated the model is reliable. This scenario is explored here using the schematic in Figure 1, which, it is suggested, provides a useful tool for considering more complex cases.
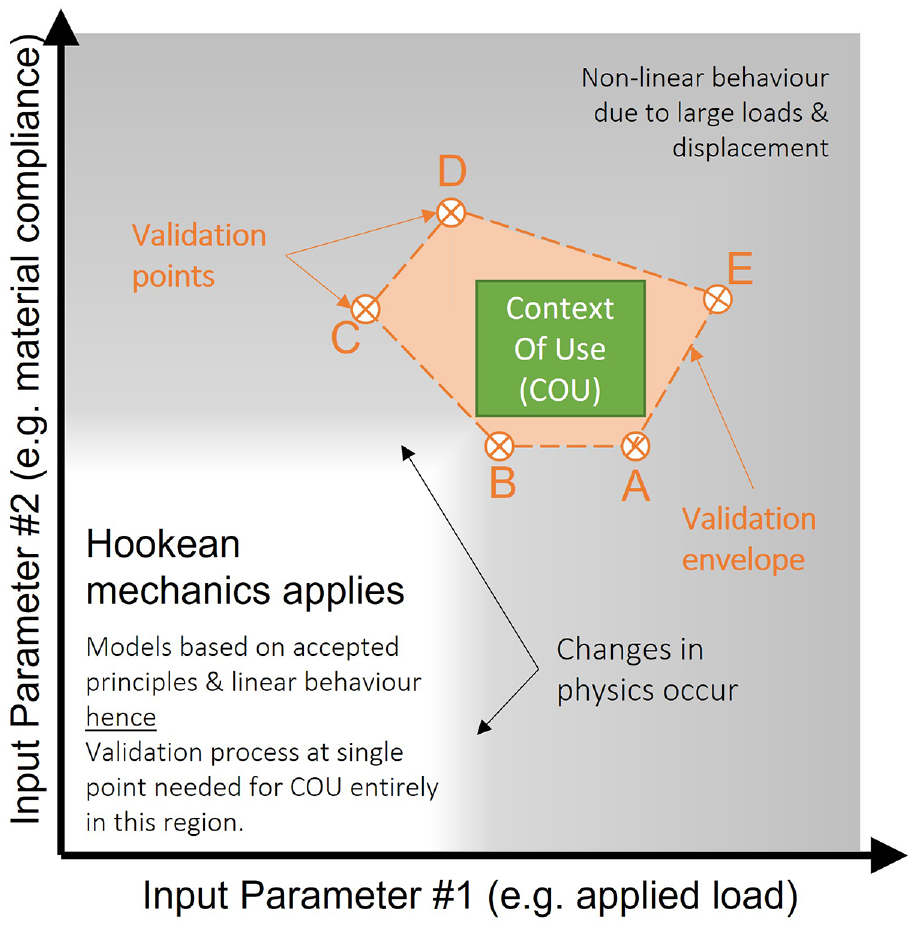
Schematic diagram showing a domain defined by two input parameters, for example applied load and material compliance, in which the non-linear behaviour occurs in the grey-shaded region and linear behaviour (e.g. Hookean mechanics) in the unshaded (white) region. The green box indicates a Context of Use (COU) in the region where the system exhibits non-linear behaviour with respect to both input parameters. Validation points (brown symbols) at which physical test data are acquired form a polygon (brown shading and dashed lines) or validation envelope.
Consider a simple tie bar made from an isotropic homogeneous material and loaded in uniaxial tension. When the tie bar is subject to increasing loads then the resulting deformation will increase. For low values of material compliance and small applied loads, the behaviour will be linear and described by Hooke’s law, that is deformation is directly proportional to applied load, or strain to stress. However, at higher loads the behaviour will eventually become non-linear, that is the load and the resultant deformation will not be directly proportional anymore. Similarly, when the material of the tie bar has a very high compliance, that is low stiffness, small loads will induce large deformations and non-linear behaviour will occur. This situation is described graphically by the grey components of Figure 1 with the applied load plotted on the x-axis and the material compliance on the y-axis, such that the region described by Hookean mechanics is in the bottom left corner. There are gradual transitions from linear (white) to non-linear behaviour (grey).
For Hookean mechanics, the laws of physics are well-known and accepted so that models representing behaviour in the white region of Figure 1 will be principled, that is based on widely accepted principles. A validation process 3 at a single point (i.e. set of parameter values) is required to support the use of the model to make predictions in this region because the response is well-behaved and linear. Although additional physical tests might be necessary to identify the onset of non-linear behaviour; however, it is not strictly necessary to complete a validation process for these additional tests, because the model is principled and the behaviour well-described by the principles.
However, consider a context of use (COU) which lies in the top right corner of the schematic in Figure 1 (the green box). The behaviour of the real-world system – think of a biological cell or a large engineering structure – is difficult to describe because a soft material is likely to have a non-linear stress-strain relationship, which might not be well-known or only defined empirically; and large applied loads lead to geometric non-linearities that are also difficult to describe in a model; or it might be impossible to apply an appropriate load altogether. Finally, the response might be challenging to measure in physical tests. These measurement challenges could be associated with inaccessibility for a sensor system, perturbing the behaviour of the system through the presence of the sensor system, or the probability of destroying the system due to its instability, or proximity to instability, in these conditions. The first two challenges are associated with the technology available for acquiring measurements and do not prevent the design of a real-world system that functions in the context of use; while the latter challenges are more likely associated with possible rare excursions in the behaviour of a system. Hence, it might be undesirable or impractical to conduct physical tests within some or all areas of the green box in Figure 1. Instead, it is proposed that a set of validation points could be selected for the physical tests which form a polygon completely enclosing the context of use, as shown by the brown points and shaded region in Figure 1. This polygon could be termed the validation envelope since the model would be expected to be valid for all the points, describing combinations of the two input parameters, that fall within it. This approach allows some freedom to select combinations of input parameters that are easier, cheaper or quicker to test and to reduce the number of combinations that need to be tested; in other words, to optimise the design of test campaign. In the example shown in Figure 1, some validation points lie some distance into the region of non-linear behaviour with respect to load (A and E) or compliance (C, D and E) while others lie in the transition zones from linear to non-linear behaviour for load (B and D), or compliance (A and B), or both (B); while one point is clearly in the region where behaviour is non-linear with respect to both load and compliance (E). This latter point is likely to involve a physical test which might be unstable, difficult to conduct and expensive; however, the proposed approach implies that only a single such condition needs to be tested, instead of a series of tests along the top boundary of the context of use box.
Figure 1 and the explanation above relates to two simple parameters; however, the same approach could be employed with any pair of input parameters, or with many input parameters by constructing a multi-dimensional representation of the validation envelope. When considering complex systems, which will often have a large number of input parameters, it is important to consider the possibility of emergent behaviour that could cause a system singularity within a validation envelope. It cannot be assumed that a model would be reliable in the vicinity of a system singularity and additional tests would be needed to confirm its applicability. However, model validation in the presence of emergent behaviour is beyond the scope of this brief note which instead presents a schematic that can be used to plan a test campaign as part of a validation process, or to illustrate a validation envelope after a validation process has been completed. In the latter case, if it is found that a context of use lies outside the validation envelope then a further campaign of tests can be planned. Alternatively, the fidelity of the predictions beyond the context of use could be assessed following the approach described in the PCMM 4 or the process of assessing the impact of the distance between the context of use and the validation envelope described by, for example, Hemez et al., 14 Oberkampf and Roy 15 and Pathmanathan et al. 16
Footnotes
Declaration of conflicting interests
The authors declared no potential conflicts of interest with respect to the research, authorship, and/or publication of this article.
Funding
The author(s) disclosed receipt of the following financial support for the research, authorship, and/or publication of this article: The schematic was developed by the authors while engaged in the MOTIVATE (Matrix Optimization for Testing by Interaction of Virtual and Test Environments) project. The MOTIVATE project received funding from the Clean Sky 2 Joint Undertaking under the European Union’s Horizon 2020 research and innovation programme under grant agreement No. 754660 and the Swiss State Secretariat for Education, Research and Innovation under contract number 17.00064. The opinions expressed in this paper reflect only the authors’ view, and the Clean Sky 2 Joint Undertaking is not responsible for any use that may be made of the information it contains.