
Abstract
This paper presents the development of finite element (FE)-based computational models that can be used for predicting the failure load of GFRP-reinforced annealed and heat-strengthened glass–bolted joints. Stress analysis of a single-bolt, single-glass-piece case was first carried out in order to develop the computational models and to establish an appropriate failure criterion for the GFRP-reinforced glass–bolted joints. The computational models were then calibrated against the experimental results reported in a previous experimental study involving reference and reinforced double-lap tension joint test specimens. The paper shows that the failure of both reference and reinforced glass–bolted joints can be predicted using the maximum principal-tensile-stress-based failure of glass. The results also confirm that the use of adhesively bonded GFRP reinforcement has potential to increase the load capacity of the reinforced glass–bolted joints compared to the reference glass–bolted joints.
Introduction
The brittle material behaviour of glass means that fixing glass panels together and/or connecting them onto supporting structures is challenging in building construction industry. Mechanical fixing methods, such as various forms of bolted connections, are commonly used in construction industry because of the construction flexibility they offer, including the ease of replacing damaged glass panels during the service life. Despite the popularity in construction industry, glass–bolted joints are structurally inefficient. Holes must be drilled in glass in order to fabricate the bolted joints where drilling of the holes introduces additional surface defects, thereby weakening the glass in the vicinity of the joints. 1 The combination of strength deficiency in glass in the regions of drilled holes and the high stress concentrations present in glass in the same regions due to the geometric discontinuities and the contact between the bolts and the glass make glass–bolted joints are structurally less efficient. 2 The joint details often govern the design of the glass members, 3 thereby usually requiring thick glass panels as a means of providing safety.
The tensile strength of basic construction-sector float glass (also known as annealed glass) is low (∼40 MPa), 3 and hence the use of annealed glass is largely limited to non-load bearing applications such as windowpanes. Thermally strengthened glass, which possess higher apparent tensile strength compared to annealed glass owing to the surface compressive prestress (i.e. residual stress) introduced during the secondary thermal processing of the strengthened glass, are usually used in glass–bolted joints applications. 4 Thermal processing with high-rate of cooling produces fully-strengthened glass (known as tempered glass or toughened glass), whereas the use of low-rate cooling produces partially-strengthened glass (known as heat-strengthened (HS) glass). In general, tempered and HS glass possess surface compressive residual stress of magnitude 80–150 MPa 5 and ∼24–52 MPa, 6 respectively. Although the high strength of tempered glass makes them suitable for glass–bolted joints, tempered glass shatters into small pieces during failure with no post-peak load resistance in the structures. 7 This is because the penetration of the surface cracks into the tension zone causes rapid fracture in tempered glass. 1 On the other hand, annealed glass, which has residual stress of magnitude less than 10 MPa, 8 is also brittle but fails into large angular pieces with sharp edges. Figure 1 shows the failure patterns of glass–bolted joints in annealed and tempered glass where a few major cracks caused the failure of annealed glass, while tempered glass shattered into small pieces. HS glass with low magnitudes of residual stress usually shows behaviour similar to that of annealed glass, 9 whereas HS glass with high magnitudes of residual stress may show behaviour similar to that of tempered glass.
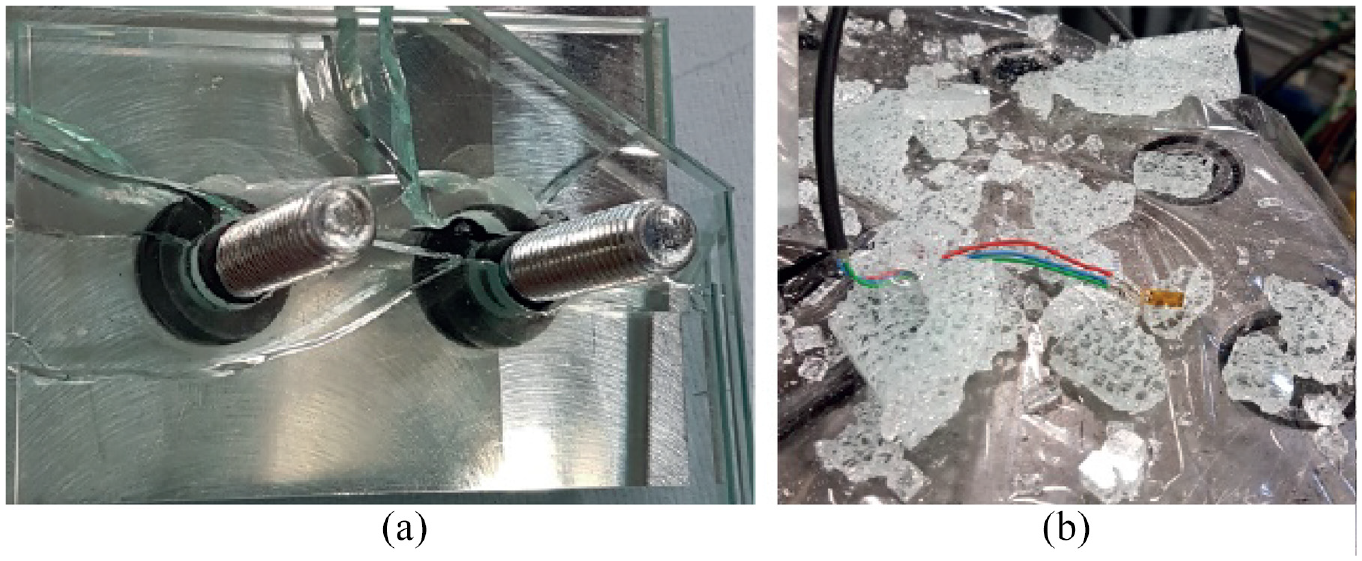
Failure patterns of: (a) annealed and (b) tempered glass–bolted joints. 9
Given the unsafe failure modes of monolithic glass, laminated glass, which consists of thin PolyVinylButyral (PVB) polymer or ionomer interlayers between two or more glass sheets, are used in industry as safe glass. 10 However, despite the usefulness of the laminated glass in various practical applications, laminated glass is inefficient in some bolted joints applications. This is due to the possible squeezing of the interlayers due to the pressure exerted on them when tightening the bolted joints and the geometric discontinuity and/or possible damages of the interlayers due to drilling holes in glass. Both thermally strengthened and laminated glass are expensive, have higher embodied energy/carbon impact compared to monolithic annealed glass and the processing steps such as cutting and drilling holes are difficult to do at construction sites. These limitations and the challenges associated with the use of tempered and laminated glass highlight the structural inefficiency and the construction difficulties of the contemporary glass–bolted joints applications. The current industry practice it to overdesign the joints as a means of reducing the probability of failure, thereby resulting in the use of more volumes of glass than what is actually required.
A previous experimental investigation 9 showed that adhesively bonded Glass Fibre Reinforced Polymer (GFRP) strips around the drilled holes (i.e. bolt holes) in double-lap tension joint configurations ensured higher load capacity (∼140% and 100% increase in annealed glass and HS glass, respectively) and notable post-peak load resistance in annealed and low residual stress HS glass–bolted joints compared to the respective unreinforced reference glass–bolted joints. Furthermore, the post-cracked load resistance of the GFRP reinforced annealed and HS glass–bolted joints were significantly higher (∼280% and 225% in annealed and HS glass, respectively) than similar bolted joints in commercially available laminated-annealed glass. It has shown that 9 the GFRP reinforcement was effective in annealed and low RS HS glass given their fracture pattern of formation of a few large cracks where the bonded GFRP strips managed to retard the development and/or the propagation of the large cracks which would cause a complete failure. It should also be noted that despite the GFRP was translucent, the negative visual impact of the GFRP reinforcement in the reinforced joints was minimal and largely unnoticeable, since only a small patch of GFRP, over the area covered by the bolted joint assembly, was used.
The concept of reinforcing the glass–bolted joints using GFRP strips is similar to the use of bonded crack retarders in metallic airframe structural assemblies 11 where metallic/fibre-metal laminate reinforcing straps are fixed on external surfaces as a means of increasing the fatigue performance of the critical structural components. In airframe structural assemblies, the local increase in the stiffness, crack-bridging capability of the straps and the reduction in the crack growth driving force owing to the bonded crack retarders contribute to reducing the fatigue crack growth rates. 12 In annealed and low residual stress HS glass, it is expected that the bonded GFRP reinforcement ensures crack bridging whilst retarding the development and/or the propagation of critical cracks that would otherwise cause instantons brittle failure of the glass structures. In particular, the potential for the use of GFRP-reinforced annealed glass-bolted joints is promising, where availability, low cost, low-embedded energy, easy constructability, prospect for post-cracked load resistance, etc. of annealed glass make them a better construction material compared to tempered or laminated glass. The concept of GFRP reinforced glass–bolted joints is novel, and no research reported in the literature except the proof-of-concept experimental validation paper published by the same research team led by the author of the present paper. 9 No computational or analytical method is available for analysing the load response of the GFRP reinforced glass–bolted joints.
Using stress analysis and the maximum principal-tensile-stress-based failure of glass, the present paper presents the development of finite element (FE) models for the analysis of GFRP-reinforced glass–bolted joints. Stress analysis around drilled holes (i.e. bolt holes) in glass without and with GFRP reinforcement (i.e. reference and reinforced case, respectively) were first carried out in the present study in order to characterise the stress fields in the vicinity of the glass–bolted joints. The results of the stress analysis were then used to establish a method for predicting the failure of glass in both unreinforced and reinforced bolted joints. Finally, the developed computational methodology was calibrated against the experimental results from a previous study 9 where reference and GFRP-reinforced double-lap tension joints in annealed and HS glass were investigated.
The work presented in the present paper is the results from a preliminary investigation of a detailed ongoing research work towards developing a validated method for the design of GFRP-reinforced glass-bolted joints. Therefore, the work presented here is largely aimed to identify the critical analysis parameters of the FE models and to calibrate the FE models against the results from the previous experimental results. Once the basic methodology is established in the present paper, generic validity of the assumptions made in the computational models and extending the FE models for detailed analysis of the full load response of the reinforced glass–bolted joints, including an analysis of the effects of different design parameters of the GFRP, is proposed for a future study.
Single-bolt, single-glass-piece joints
Stress analysis around a drilled hole without and with GFRP reinforcement (i.e. reference and reinforced cases, respectively) under an applied force representative of that due to the force transfer from a bolt to the glass in glass–bolted joints were first carried out in order to characterise the stress fields in the vicinity of the joints. The considered case represented a single bolt each at each end of the given glass specimen.
Reference glass–bolted joint specimen
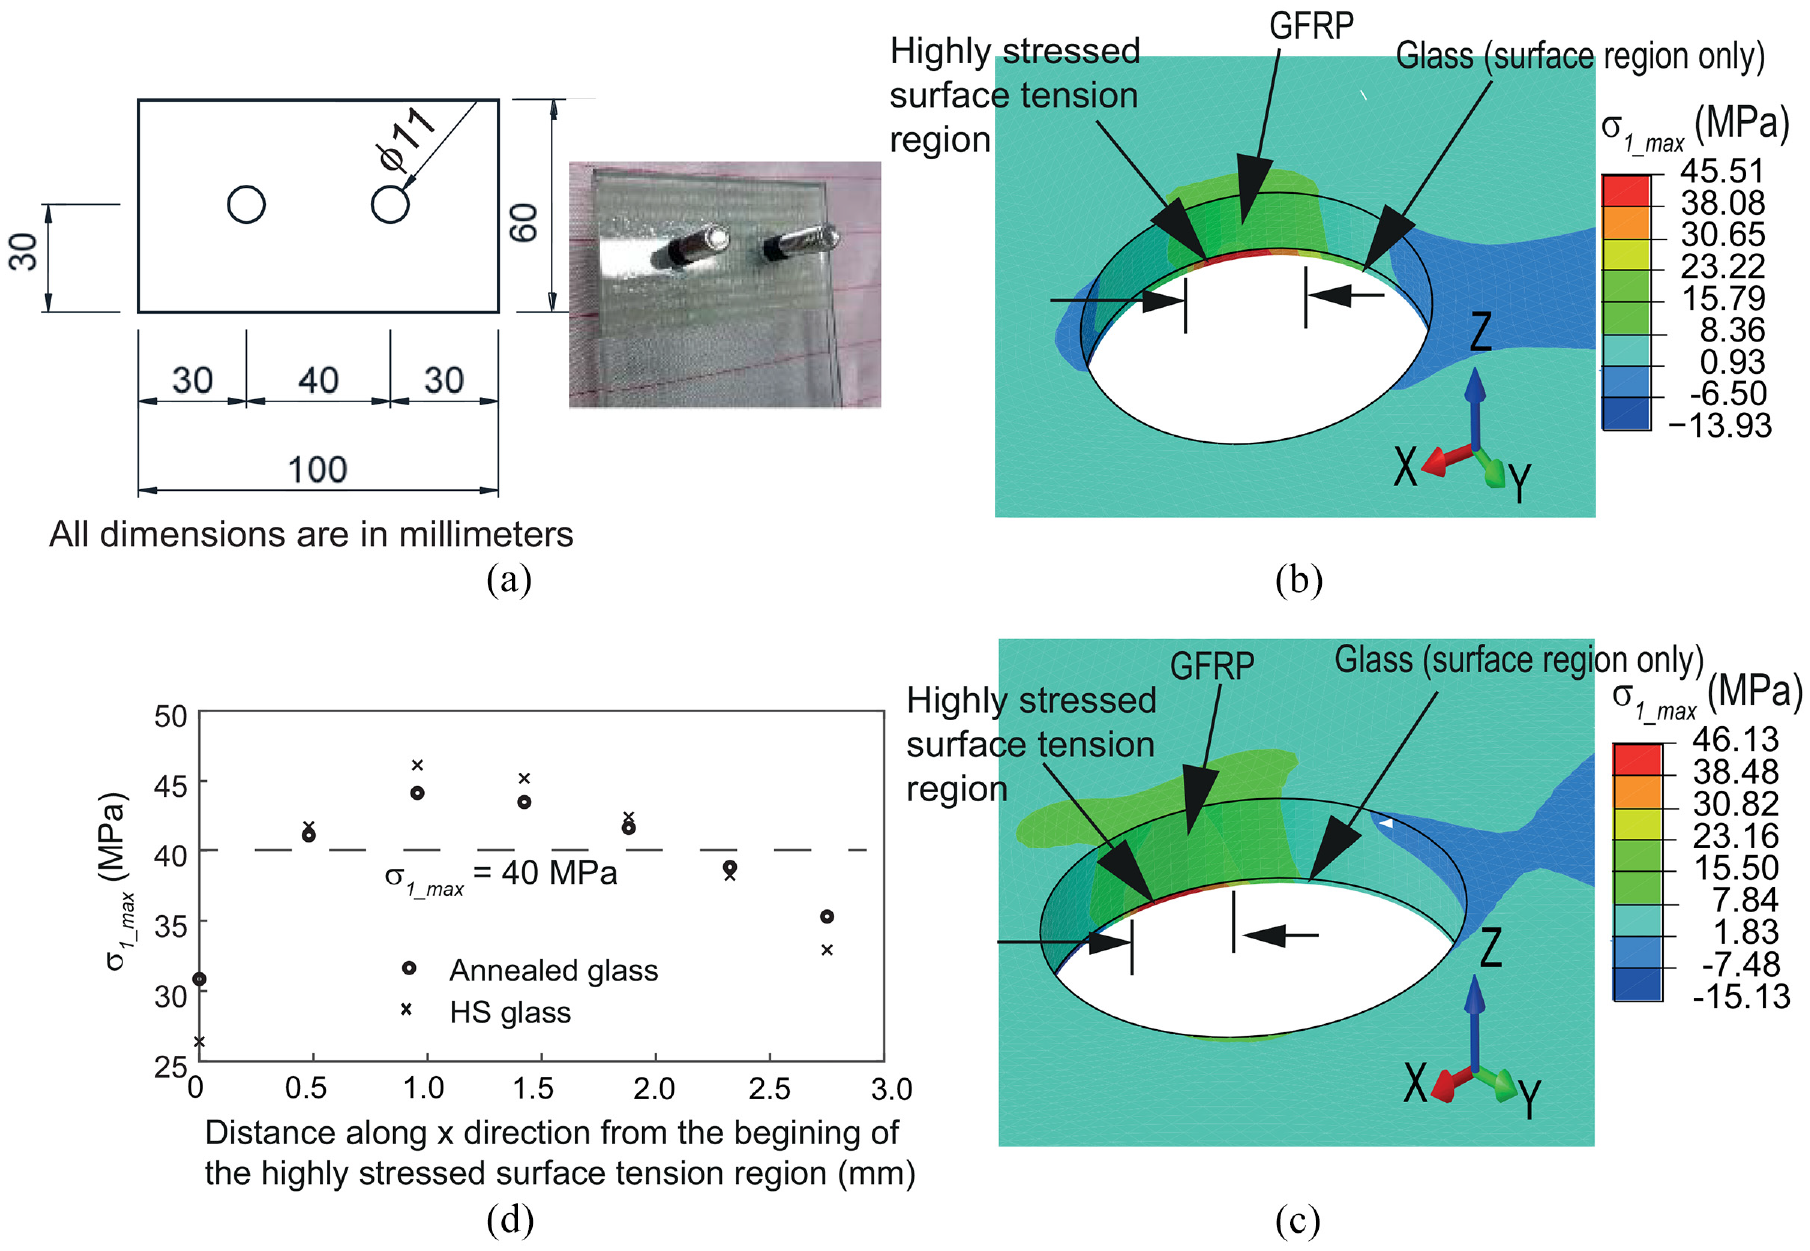
150 mm-long and 60 mm-wide rectangular annealed and HS glass specimens (see Figure 2 for the geometrical details) were considered in this analysis. Other parameters, such as the thickness of the glass specimens (6 mm), residual stress distribution and the size of the drilled holes (11 mm diameter), were assumed to be the same as those of the actual test specimens investigated in the previous experimental study. 9 M10 bolts were used in the glass–bolted joints, and a gap of 1 mm between the hole and the bolt shank was assumed as a means of ensuring space for inserting a rubber layer as an isolating material between the hole and the bolt shank.
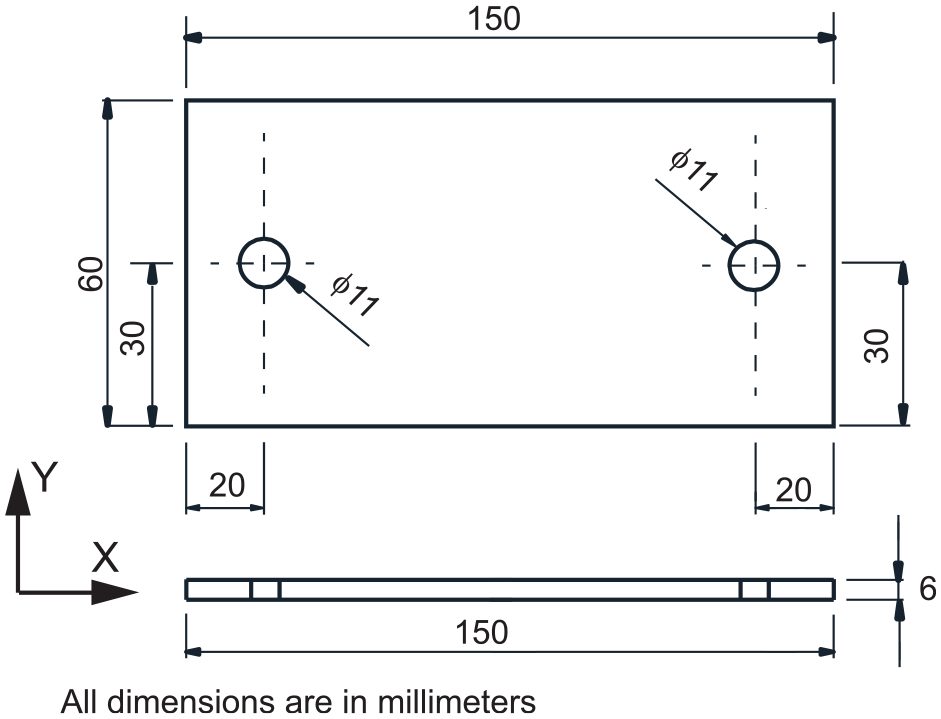
Geometric details of the glass specimen.
The location of the drilled holes with respective to the adjacent edges and the corners of the glass specimen, and the size of the hole compared to the bolt size are important design parameters. 3 In the present investigation, the size of the glass specimen (i.e. 150 mm × 60 mm) was chosen to be of a reasonably small size, but still the holes can be located practically far away from the adjacent edges and the corners. The centre of the hole was located 20 and 30 mm from the nearest short and the long edge of the glass specimen, respectively (see Figure 2). The chosen location of the hole ensured the minimum clear distance requirement specified in ‘Structural Use of Glass in Buildings’ 3 guidelines – two and four times the thickness of the glass from an edge and a corner, respectively.
GFRP-reinforced glass–bolted joint specimen
GFRP strips made by impregnating an ‘E-glass’ dry fabric using a commercially available two-part epoxy resin in a wet lay-up method was used to reinforce the glass-bolted joints in the previous experimental investigation. 9 The average thickness of the cured GFRP was 1.35 mm and the ultimate tensile strength and the Young’s modulus of the GFRP were determined to be 450 MPa and 24.5 GPa, respectively. 9 In the present analysis, the size of the rectangular shape GFRP reinforcement strip was chosen to be 30 mm × 20 mm with a central hole of 11 mm diameter (Figure 3(a)). The GFRP strips were bonded at each end of the glass specimen on the outer surfaces of the glass specimen whilst ensuring the hole in the GFRP was exactly aligned with that in the glass. In the experimental investigation, a commercially available adhesive, Araldite2020, 13 was used to bond the GFRP strips onto the glass surfaces. The fabrication details of the GFRP and the bonding process of the GFRP strips on the glass specimens are published elsewhere, 9 and therefore the details are not repeated in the present paper. The long side (i.e. 30 mm-long side) of the GFRP strip was placed along the Y-direction of the glass specimen (see Figure 3(b)). Because of symmetry of the test specimen about middle axes along all three directions, Figure 3(b) shows only one-eighth of the geometry in the vicinity of one GFRP-reinforced drilled hole. The main fibre direction of the GFRP was oriented along the X-direction of the glass specimen. The results of the FE analysis (Section 3.2) show that the highest tensile stresses in the GFRP occurred along the X-direction, this justifies the appropriateness of the orientation of the fibres in the GFRP reinforcement.
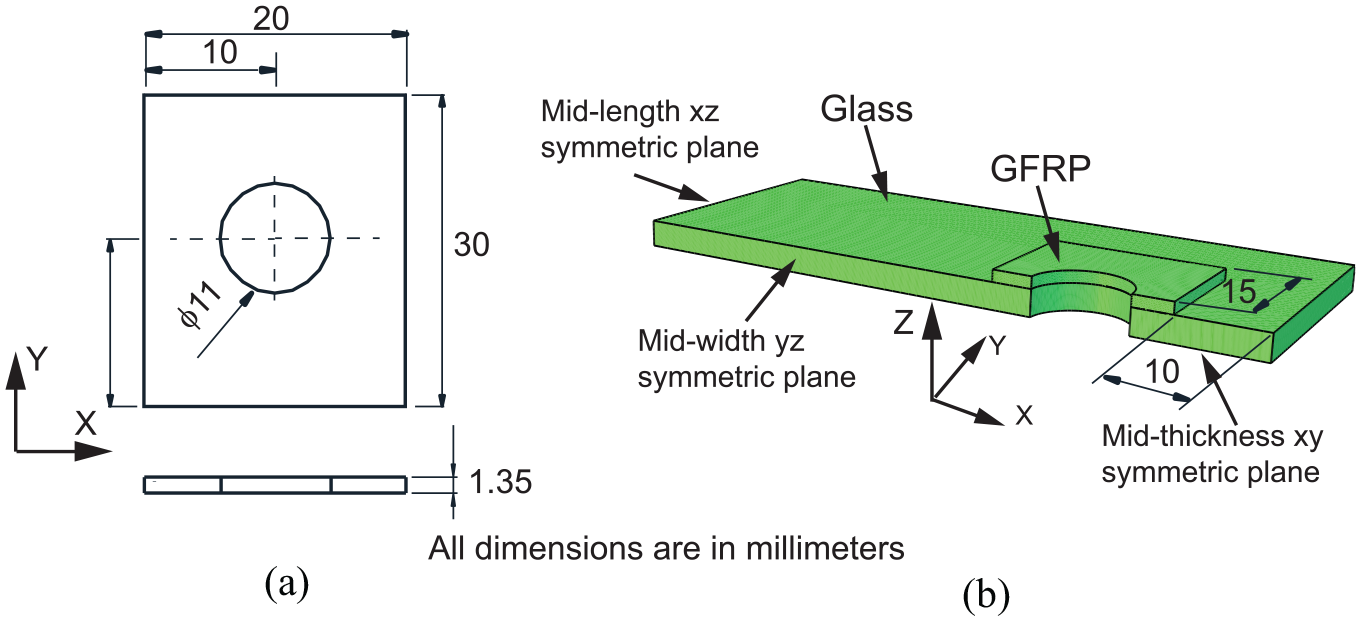
Geometric details of the: (a) GFRP reinforcement strip and (b) GFRP-reinforced glass test specimen (one-eighth of the specimen).
Stress analysis
As a starting point, it was assumed that at the time of the force transfer from the bolt to the glass, the loading direction side of the bolt shank and that half side of the drilled hole surface were in contact causing a uniform pressure on the contact area as shown in Figure 4. It is appreciated that this simplified uniform pressure approach may not exactly mimic the complex interaction between the bolt and the glass. However, this assumption was chosen in the present study given the additional uncertainties and the assumptions associated with a complex analysis would hamper the objective of the present paper – development of a reasonably accurate generic computational method that can be used to predict the formation of the first major crack in the GFRP-reinforced glass–bolted joints. The comparisons between the predictions from the present FE models and the experimental results show reasonable agreement suggesting the appropriateness of the assumptions made in the present work.
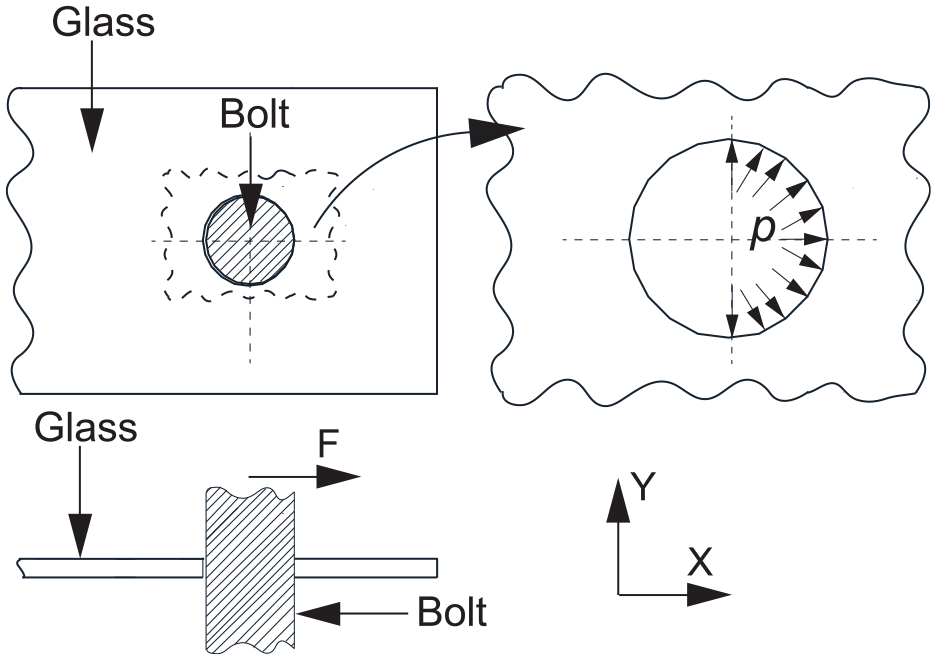
Contact pressure on one-half of the internal surface area of the drilled hole.
Reference glass–bolted joint
Abaqus/CAE 14 was used for the FE analysis carried out in the present study. The symmetry of the specimen in X-, Y- and Z-directions mean that only one-eighth of a specimen was modelled. Glass was modelled as a linear-elastic material with Young’s modulus 70 GPa and Poisson’s ratio 0.22, values often used in glass engineering literature. 15 8-node, linear solid elements of approximately 0.5 mm × 0.5 mm × 0.1 mm size (along the circumferential, radial and thickness directions, respectively) were used to model the glass around the vicinity of the holes. The size of the elements gradually increased up to 1 mm × 1 mm × 0.2 mm (along the Z-, Y- and Z-directions, respectively) towards the far ends of the glass specimens away from the hole. The nature of the loading (i.e. axial loading) and the use of a relatively fine mesh in the vicinity of the hole with many elements along all the directions justified the use of the linear elements (i.e. no shear interlocking). The appropriateness of the size of the elements used in the FE analysis were established through a sensitivity analysis involving an investigation of the stresses along the edge of the hole.
Loading and boundary conditions
Research investigations of glass–bolted joints reported in the literature suggest that yielding and/or failure of the steel bolts is unlikely to occur prior to glass facture (e.g. To et al. 4 and Overend et al. 16 ). Therefore, in the present study, no attempt was made to explicitly model the bolts in the FE models, since the stress state of the bolts is not critical to the results presented in this paper (i.e. the results of glass fracture). As mentioned above, the effects of the bolts were simply incorporated as a uniform contact pressure on one-half surface of the drilled hole (see Figure 4) where the magnitude of the contact pressure was determined by dividing the total force acting on the bolt by the contact surface area. For example, if the force transfer from the bolt to the glass was F N, the uniform contact pressure (p) on right hand side half surface of the drilled hole was:
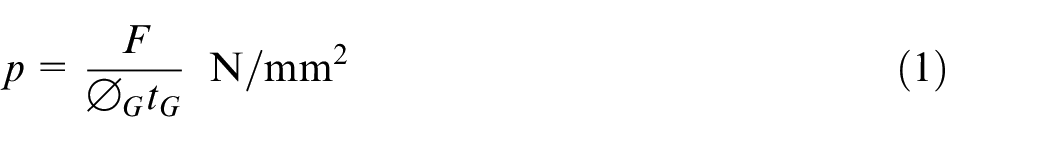
where
The geometric symmetry and the symmetry of loading due to the equal and opposite direction forces (due to the bolt at each end of the glass specimen) along the longitudinal direction (i.e. X-direction on Figure 3) mean that only one-eighth of the specimen was modelled using the knowledge of symmetry as boundary conditions (i.e. X, Y and Z-direction displacement constraints on mid-length XZ-symmetric plane, mid-width YZ-symmetric plane and mid-thickness XY-symmetric plane, respectively (Figure 3)).
Incorporation of the effects of residual stresses
Despite the knowledge of residual stress distributions in middle regions of flat glass sheets,17,18 the residual stress distributions around geometric discontinuities such as drilled holes are complex and difficult to accurately incorporate in stress analysis of the glass–bolted joints. 19 Possible relaxation of the stresses due to the geometric discontinuity mean that the magnitude of the residual stress distribution around the drilled holes is expected to be different to that in middle regions of the glass panels. An interaction between the residual stress distribution and the geometry of the glass (i.e. hole size and the overall thickness) is also expected. Whilst some useful computational methods (e.g. To et al. 4 and Nielsen et al. 19 ), which consider the basic thermomechanical process of the cooling of hot glass are reported in the literature for modelling residual stress distributions in glass, the models require the knowledge of complex thermal and mechanical parameters which are usually not available. Furthermore, the models are too cumbersome to apply in practical applications such as designing of glass–bolted joints. Alternatively, the concept of eigenstrains, where the effects of the complex non-linear cooling process of glass are approximated with a linear elastic approach,20,21 was used in the present study to incorporate the effects of residual stresses in glass.
The eigenstrains method of incorporating the effects of the full 3D residual stress distribution in glass, which was previously developed by the research group led by the author of the present paper, requires only the knowledge of the surface residual stress of the given glass in order to model the full 3D residual stress distribution. 21 The surface residual stress value of a given glass is usually available from the glass manufacturer or can be measured using a scattered-light-polariscope (SCALP). 22 The development and applications of the eigenstrains-based model are published elsewhere, 21 and therefore, the details are not repeated in the present paper. Since this technique of modelling of residual stress in glass explicitly incorporates the geometry, material behaviour and boundary conditions of a given glass specimen, the method enables accurately modelling the residual stress distributions in both flat glass panels and complex geometries such as drilled holes in glass. In the present analysis, the residual stress distributions were incorporated as an ‘initial’ analysis step by implementing the established eigenstrains distributions as an initial strain in the FE models of the glass–bolted joints prior to the ‘applied load’ analysis step.
Figure 5 shows the distribution of the X-direction direct-stress component of the residual stress distribution (σ rs_xx ) in the vicinity of the 11 mm diameter drilled hole in 6 mm thick annealed and HS glass. The measured surface residual stress values 9 of 5 and 30 MPa in annealed and HS glass, respectively, were used in the FE models to determine the results shown in Figure 5. The eigenstrains technique can appropriately model the full 3D residual stress distribution in a glass specimen even if there is an up to ±10% error in the SCALP measurements 21 (note: the manufacturer expected errors in SCALP measurements are much smaller 22 ). The results show that the spatial distribution of σ rs_xx is not uniform on xy-plane in the vicinity of the hole. Figure 6 shows the spatial distribution of σ rs_xx on xz-plane of the same 6 mm thick glass, if there was no drilled holes (i.e. at locations far away from the geometric discontinuities (i.e. holes and edges) where the residual stress distribution largely varies with z-direction (the thickness direction) only). As shown in Figure 7, the variation of the residual stress with the thickness of the glass specimen in the vicinity of a hole is also notably different to that in glass without holes. The results show that the magnitude of σ rs_xx close to the 0° (and 180°) location with respect to the positive x-axis direction (see Figure 5) in the vicinity of the drilled hole is low compared to the corresponding σ rs_xx values in glass without a hole (Figure 7).
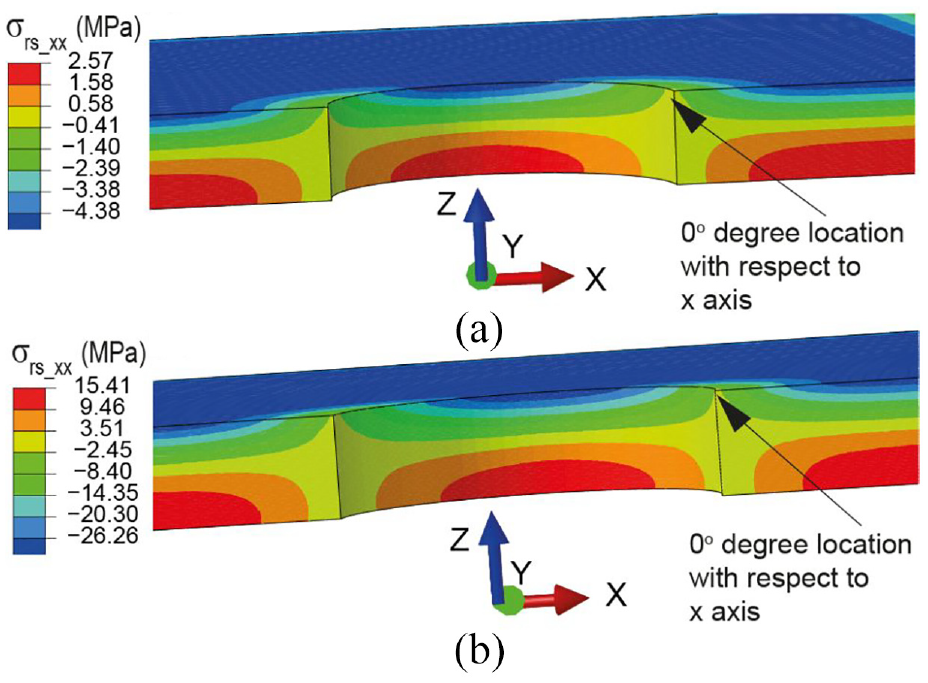
Residual stress distribution in the vicinity of holes in: (a) annealed and (b) HS glass (note: results are to the mid-thickness only).
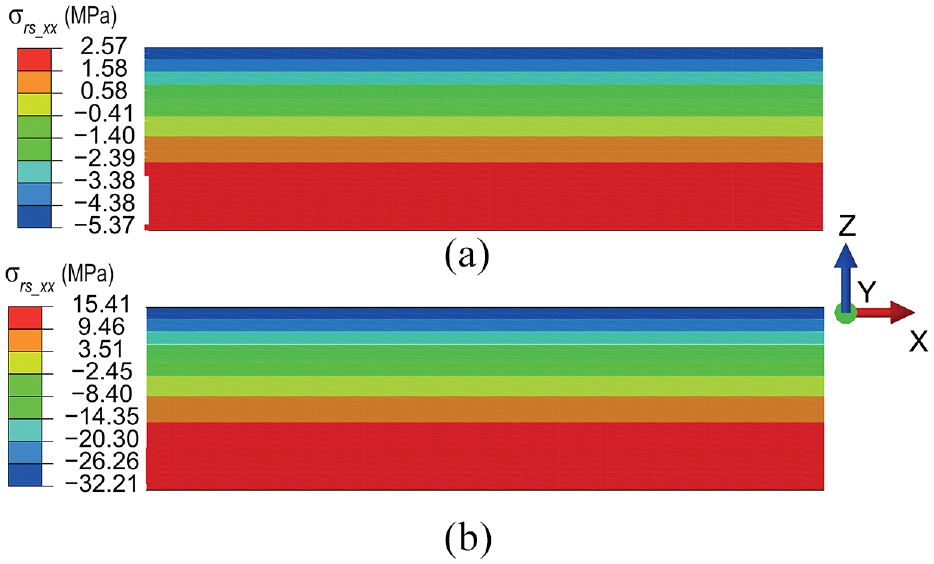
Residual stress distribution on xz-plane of 6 mm thick: (a) annealed and (b) HS glass (note: results are to the mid-thickness of the 6 mm thick glass plates).
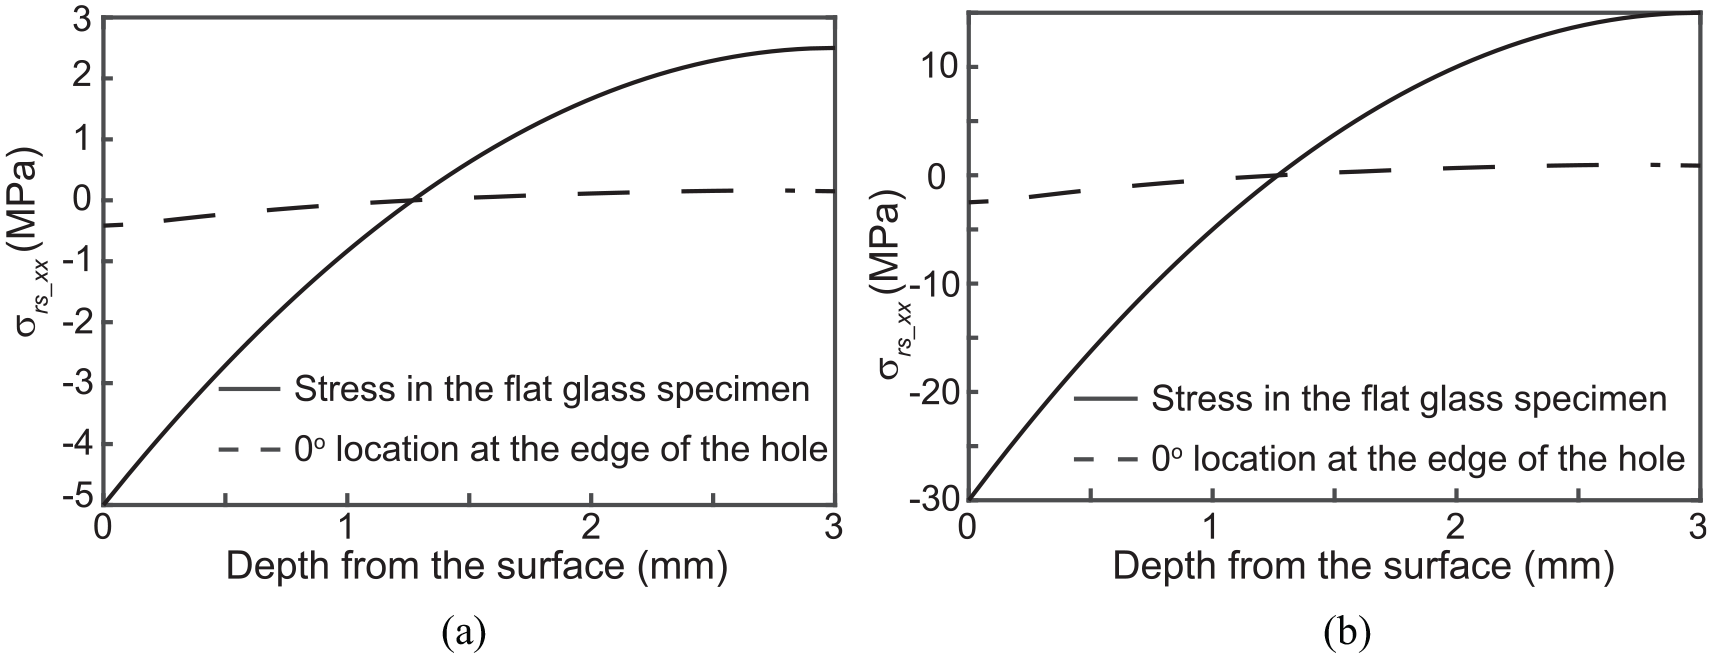
Residual stress depth profiles in flat glass and at the regions with the lowest magnitude residual stress in the vicinity of the drilled holes in 6 mm thick: (a) annealed and (b) HS glass (note: results are to the mid-thickness of the 6 mm thick glass plates).
Maximum principal-tensile-stress failure criterion
Since glass is a brittle material, surface maximum principal-tensile-stress (σ1_ts_max) criterion is appropriate to predict the failure of the glass structures.23,24 When σ1_ts_max at any given location of a given glass structure approaches the tensile strength of the material (σ t_glass ), glass fractures causing failure. Experimental results reported in the literature for strength of glass usually show large scatters; for example, the coefficient of variation of the data of strength of annealed glass can be as high as 25%. 1 Nevertheless, existing literature suggests that σ t_glass is usually ∼40 MPa.3,25,26 Thus, in the present study it was assumed that the glass–bolted joints failed when σ1_ts_max (i.e. maximum principal-tensile-stress at the surface of glass) reached 40 MPa. The literature-based value of 40 MPa was used in the present study instead the experimentally determined results of the test specimens, since this approach will ensure more generic application of the proposed computational method in real-life applications. However, if the tensile strength data is available for a given glass–bolted joint application, the analysis can be carried out with the known actual tensile strength value.
Although the proposed failure criterion is based on the stresses at the surface, the analysis includes the effects of the full 3D distribution of the residual stress, since the effects of the residual stress were incorporated in the FE models using the eigenstrains technique. Therefore, the present analysis is beyond the simple approach of superposing the surface residual stress value on the results from a FE analysis without including the effects of residual stresses. Similarly, given the correct magnitudes of the residual stress in different glass types are explicitly included in the FE models, the use of σ t_glass of annealed glass in maximum principal-tensile-stress-based failure criterion is justifiable for all glass types. It should be noted that the possible relaxation of the original residual stress distribution in glass with the fracture of glass is not relevant in the results presented in the present paper, given the analysis considers up to the first fracture of the glass specimens.
Reference joints – results
Figure 8(a) and (b) show the distribution of the maximum principal-stresses (σ 1_max ) in the vicinity of a bolt hole in surface regions of the annealed and HS glass–bolted joints, respectively under an assumed load case of 2 kN force transfer from the bolt to the glass specimen. Experimental results reported in the literature suggest that failure of the glass–bolted joints usually cause by the propagation of the flaws in the surface regions of the glass.2,27 This is because larger surface flaws (i.e. microcracks/defects) are likely to present in the surface region of the glass in the vicinity of the bolted joint compared to that present in mid-thickness regions of glass. Therefore, the stress values in the surface region of the glass are considered in the results presented in this paper.
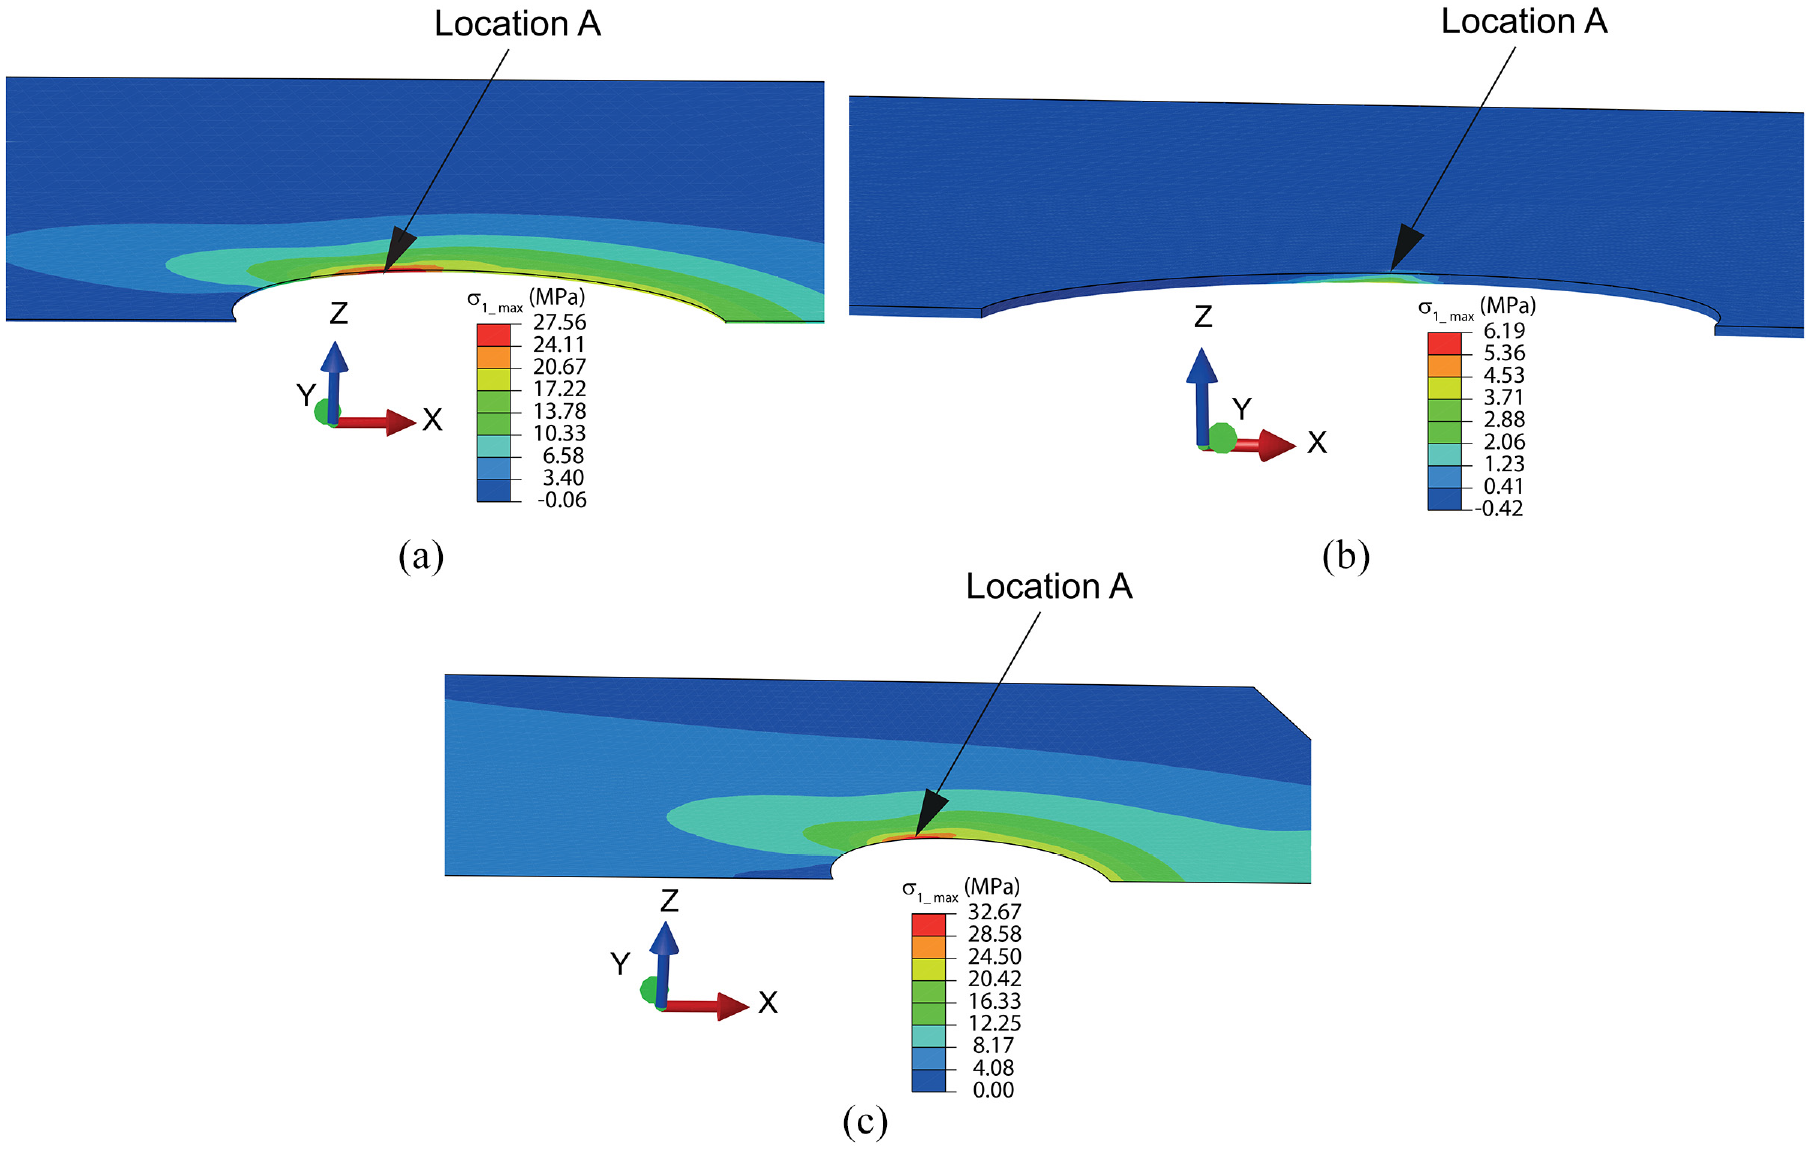
Maximum principal stresses (σ1_max) in the vicinity of a bolt hole in: (a) annealed glass, (b) HS glass and (c) glass with no residual stress at 2 kN force transfer from the bolt to the glass (note: Location A (at the surface of the glass specimen) in the figure is the 90° location with respect to the positive x-axis direction in the vicinity of the drilled hole).
The arbitrary chosen load case of 2 kN transfer from the bolt to the glass specimen was first considered here in order to investigate the stress state, including identifying the regions with the maximum principal tensile stress in the surface regions of the glass prior to the failure of the joints. Figure 8 shows that the surface maximum principal-tensile-stress (σ1_ts_max) developed close to the 90° location with respect to the positive x-axis direction in the vicinity of the drilled hole (Location A in Figure 8) (note: the holes do not appear circular in some of the figures shown in this paper. This is because in order to clearly illustrate the high stress zones, the screenshots shown in the figures were not taken on the XY-plane. The view of the screenshot on a slope towards the holes and due to this reason, the holes do not appear circular). The σ 1_ts_max values in the annealed and HS glass–bolted joints were determined to be 26.9 and 0.3 MPa, respectively. The difference in the stress values in the two types of glass are due to the different respective residual stress distributions. Figure 8(c) shows the expected σ 1_max distribution around the bolt hole, if the residual stress were not included in the analysis. The results suggest that if the residual stress were not taken into account, higher stresses are shown under the same applied load, and hence, such analysis usually leads to overdesign. Since the σ1_ts_max due to the assumed load case of 2 kN (i.e. 26.9 and 0.3 MPa in annealed and HS glass, respectively) are smaller than σ t_glass (i.e. 40 MPa), the results suggest that the assumed load of 2 kN is lower than the failure load of the joints.
The failure load of the reference glass–bolted joints was established using the same FE models (i.e. Figure 8), but by gradually increasing the magnitude of the force transfer from the bolt to glass until σ1_ts_max reached 40 MPa. Figure 9(a) and (b) show σ 1_max distribution in annealed and HS glass–bolted joints when σ1_ts_max just reached 40 MPa. The stress distributions shown in the figure were resulted in due to the force transfers of 2.9 and 4.5 kN from the bolt to the glass in annealed and HS glass–bolted joints, respectively. Figure 9(c) shows the surface σ 1_max along the edge of the hole at the most stressed area of the two joints at the respective failure load. The results shown in Figure 9(c) suggest that σ 1_ts_max of the glass has just reached σ t_glass (∼40 MPa), and thus, the assumed load cases of 2.9 and 4.5 kN from the bolt to the glass can be considered as the failure load of the annealed and HS glass-bolted joints, respectively.
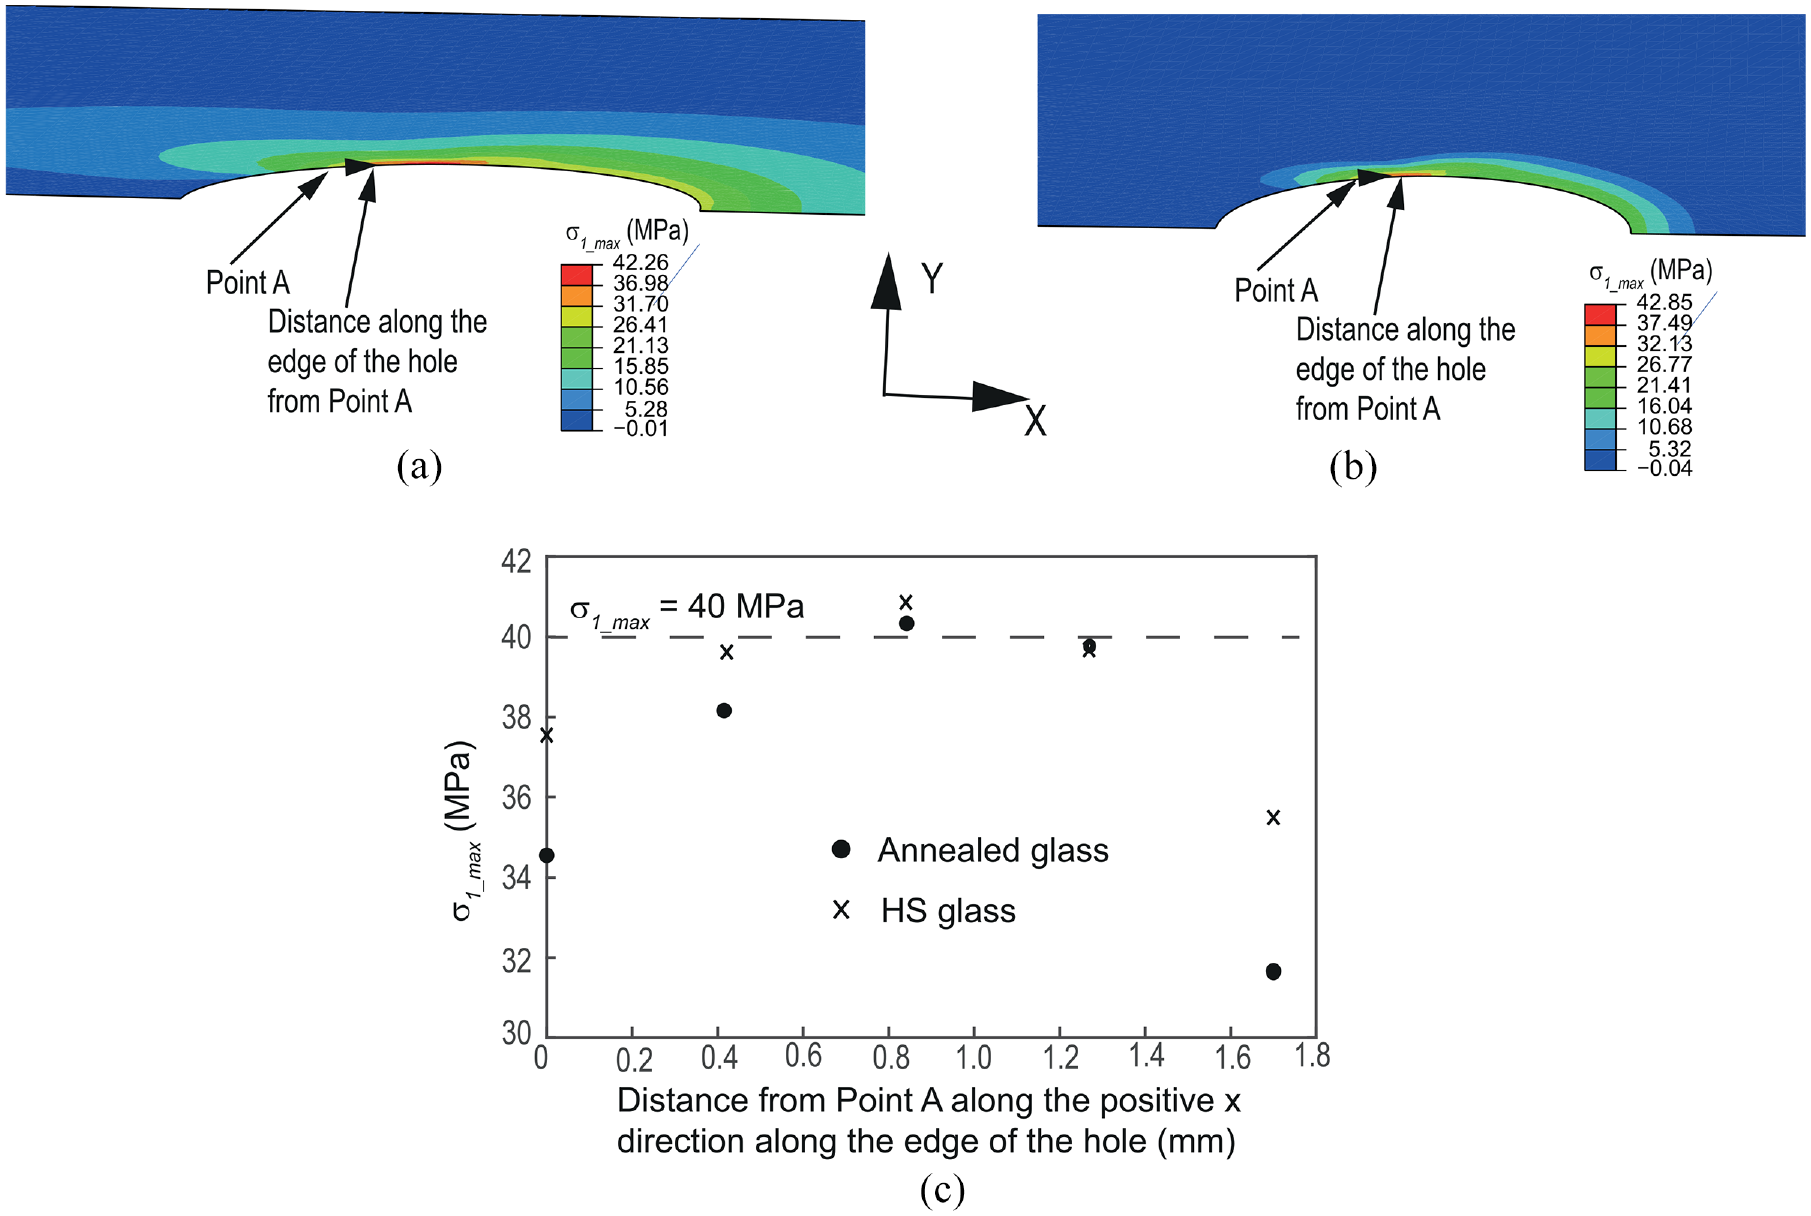
σ 1_max distribution in glass at the onset of glass fracture: (a) annealed glass and (b) HS glass–bolted joints and (c) σ 1_max values at the most stressed surface region of glass.
GFRP-reinforced glass–bolted joint
The same FE modelling approach used for the analysis of the unreinforced glass–bolted joints was used to analyse the GFRP reinforced glass–bolted joints. However, the GFRP strips which were bonded on both outer sides of the glass specimen were included in the FE models. Given the different elastic mechanical properties of the two materials (i.e. glass and GFRP), the load (i.e. pressure) was applied as an imposed displacement over the contact area in the GFRP-reinforced glass-bolted joints instead the direct approach of applying the load in the reference joints (i.e. glass only joints). Similar to the modelling of the unreinforced glass–bolted joint test specimens, symmetry of the test specimen enabled modelling only one-eighth of the test specimen. As mentioned above, the main fibre direction of the GFRP was oriented along the X-direction (Figure 3(b)), the Young’s modulus of the GFRP along this direction was 24.5 GPa and that along the perpendicular directions was 10 GPa. 9 Considering the values and the theories often used in the literature of mechanics of FRP materials [e.g. Gibson 28 ], the Poisson’s ratio of the GFRP along the fibre direction was assumed to be 0.25 whereas that along the transverse and through-thickness directions was assumed to be 0.1. Whilst the assumed values were approximations, as can be seen from the results presented below (Section 3.2.1. and 3.2.2), the magnitudes of the stresses in the GFRP strips were small (often <15 MPa), and therefore, any likely minor inaccuracy in the assumed Poisson’s ratio values are not critical to the results presented in this paper.
The GFRP strips were modelled as linear-elastic material with aforementioned material mechanical properties and 8-node, linear solid elements of 0.5 mm × 0.5 mm × 0.168 mm (approximately) size (X-, Y- and Z-directions, respectively) were used. The chosen element size ensured eight elements along the thickness of the GFRP. Given the magnitude of the stresses were well below the failure stresses of the GFRP, no attempt was made in the present FE models to incorporate the failure criterion of the GFRP. It is expected that the used modelling approach is justifiable to accurately analyse the intended problem without unnecessary complexity.
The previous experimental investigations of the GFRP-reinforced glass–bolted joints 9 and other applications of similar GFRP strips bonded using the same adhesive 26 showed no premature adhesive or interface failure prior to glass fracture. Therefore, as a starting point, the local strain compatibility between the glass and the GFRP (i.e. no slip between the glass and the GFRP) was assumed in the FE models. The inbuilt ‘tie’ constraint option available in Abaqus 14 was used to ‘bond’ the GFRP surface onto the glass surface. Since the objective of the present paper was to establish a method to predict the load which causes the first major glass crack in the GFRP reinforced glass–bolted joints, the local strain compatibility between the glass and the GFRP and linear-elastic material models are justifiable. A non-continuum modelling method, including cohesive zone modelling of the adhesive bonds, is suggested if a detailed analysis of the post-cracked regime of the GFRP reinforced glass–bolted joints is required.
Results
Figure 10(a) and (b) show the σ 1_max distribution in the GFRP reinforced annealed and HS glass– bolted joints at the applied force that caused the failure of the respective reference glass–bolted joints (i.e. 2.9 and 4.5 kN force transfers from the bolt to the glass in annealed and HS glass–bolted joints, respectively) (note: for brevity, the surface region of the glass specimen in the vicinity of the hole together with the bonded GFRP on the top of the glass specimen is shown in Figure 10). The results show that the expected σ1_ts_max in both types of reinforced glass–bolted joints is ∼30 MPa. Since the σ1_ts_max value is below σ t_glass (40 MPa), failure of the reinforced joints is not expected under the considered load values. The reduction in the σ1_ts_max in the reinforced joints compared to the reference joints is due to the contribution of the GFRP reinforcement to the load carrying of the joint.
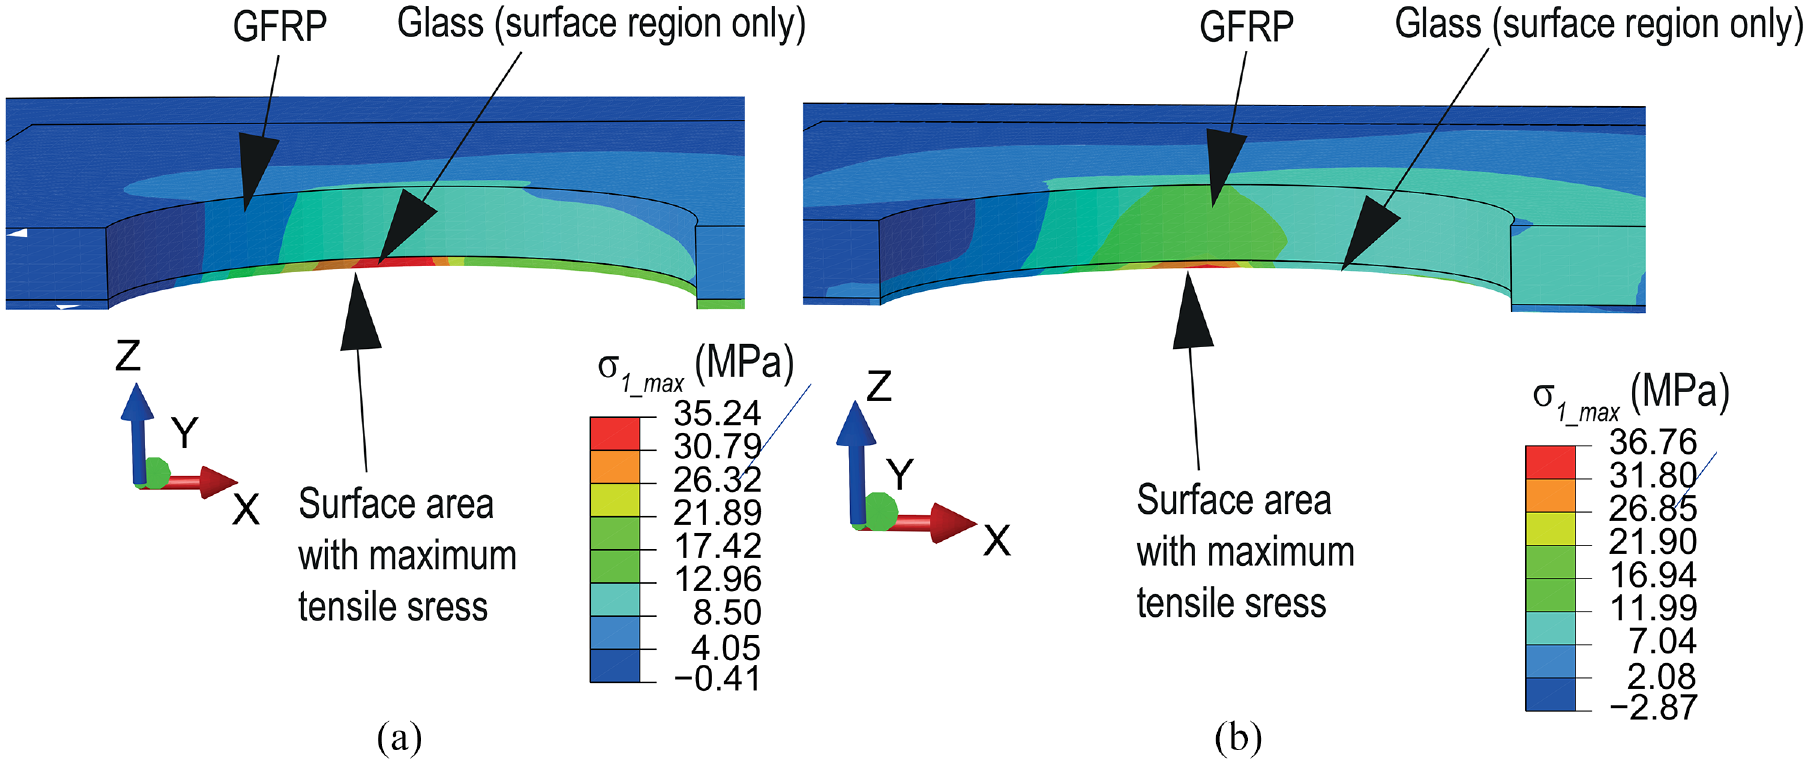
σ 1_max distribution in the GFRP-reinforced: (a) annealed and (b) HS glass–bolted joints at the applied force that caused the failure of the respective reference joint.
The results of the FE analysis also suggest that the σ xx - and σ yy -stresses in the GFRP strips are in the range 0–15 MPa and −3 (compression) to 8 MPa, respectively (note: for brevity, the full results of the stress distributions in the GFRP strips are not shown in the paper). These stress values are significantly lower than the relevant ultimate strength values of 450 MPa (fibre direction tension), 26 ∼30 MPa (tension in the direction perpendicular to the fibres) and over 100 MPa compressive strength in both fibre-direction and the perpendicular directions. 28 Furthermore, previous experimental investigations using the same GFRP material and the adhesive suggested no bond failure between the glass and the adhesive or between the GFRP and the adhesive has occurred under ∼250 MPa stress in the GFRP. 29 Therefore, the results suggest that the GFRP and/or the bond failures were unlikely to happen in the GFRP-reinforced glass–bolted joints, and hence, the assumption of the local strain compatibility between the glass and the GFRPs used in the FE analysis is justifiable.
First major crack in the reinforced joints
Since the bonding of the GFRP strips on the outer surfaces of the glass–bolted joints will not enhance the tensile strength of glass, it is appropriate to assume that cracks in the reinforced joints will also initiate when the maximum surface-tensile stress (σ1_ts_max) reached the tensile strength of glass (σ t_glass = 40 MPa). However, unlike the reference joints where glass fractures causing failure of the glass–bolted joint when σ1_ts_max just reached σ t_glass at the location with the highest tensile stress, in the reinforced joints the adhesively bonded GFRP strips resisted the fracture of the entire glass at once across the bolted joint. 9
It was noted that the formation of a cracked region of the size ∼1.5–2 mm caused the first kink in the load response curve of the joints (Figure 8(i)) (note: although the observation on this critical crack size was recorded in our previous experimental work, this detail was not explicitly stated in the paper, 9 since that publication focussed on the experimental results of the overall load response of the glass–bolted joints). Therefore, in the present computational method, the applied force which caused the formation of the first major crack was established as when σ 1_max distribution shows a ∼1.5–2 mm long surface zone with σ 1_max higher than σ t_glass . Although, the generic validity of this assumption can only be established through an investigation covering a range of experimental test specimens, it is believed that the assumption regarding the critical crack length is justifiable given the objective of the paper is to calibrate the FE models against the previous experimental results, 9
Figure 11(a) and (b) shows the σ 1_max distribution in the reinforced annealed and HS glass–bolted joints at the applied force that expected to cause ∼1.5–2 mm long zone of σ 1_max higher than 40 MPa (i.e. σ t_glass ). The corresponding load cases were 3.77 and 5.92 kN force transfers from the bolt to the glass in annealed and HS glass-bolted joints, respectively. Figure 11(c) shows the distribution of σ 1_max in glass at the most highly stressed surface region in the vicinity of the bolt hole of the two joints. The results (Figure 11(c)) suggest that cracks of length ∼1.5–2 mm could have presented at the surface of the glass, thereby the first major crack could have developed in the reinforced glass–bolted joints at the assumed respective applied force value. The stresses in the GFRPs under these load cases remained small compared to the respective ultimate strength values of the used GFRP (σ xx and σ yy stresses in the GFRPs were in the range −5 (compression) to 20 MPa and −4 to 11 MPa, respectively). Therefore, the results justify no GFRP or bond failure prior to the glass fracture.
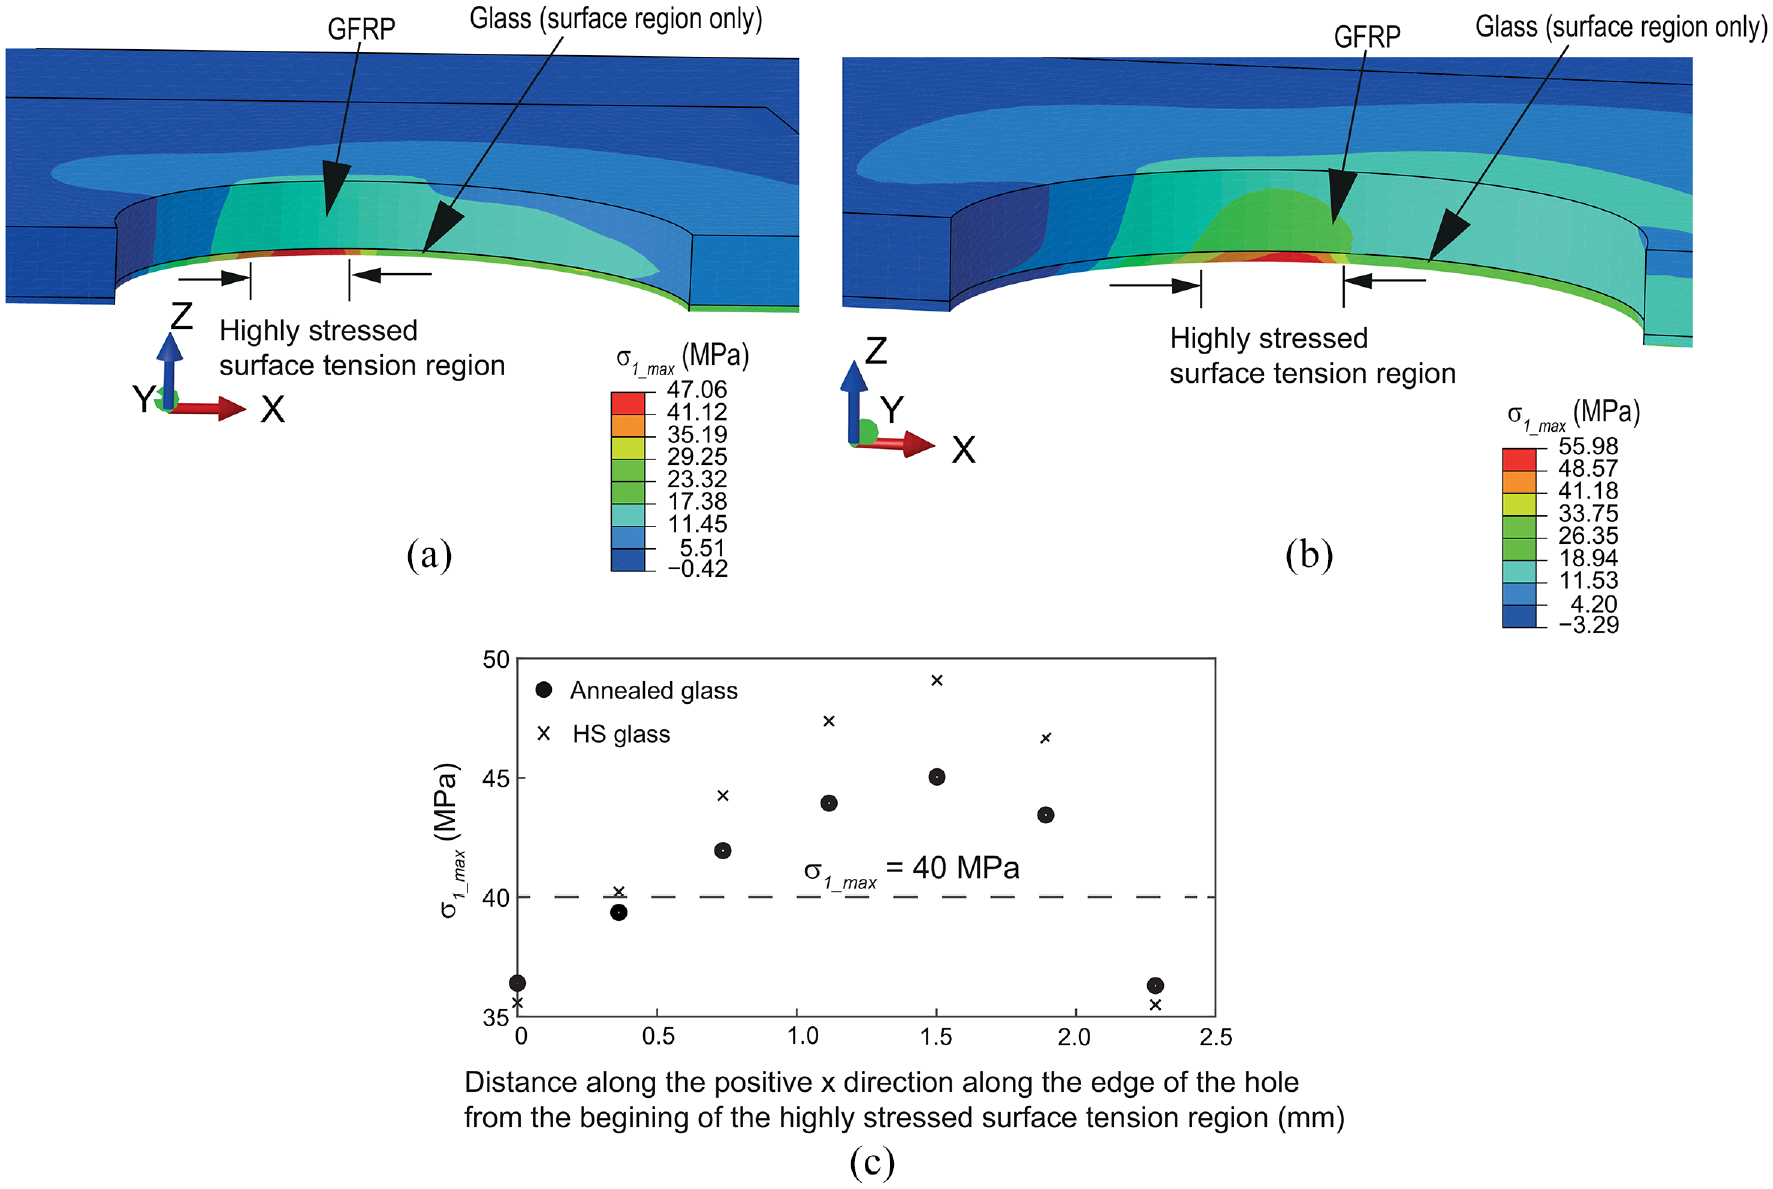
σ 1_max distribution at the onset of glass fracture in GFRP-reinforced: (a) annealed glass and (b) HS glass–bolted joints and (c) σ 1_max distribution at the most stressed surface regions of the reinforced glass–bolted joints.
Calibration against experimental results
The results from the computational methodology developed above were compared against the reported experimental results of the reference and GFRP-reinforced double-lap glass–bolted tension joints in annealed and HS glass. 9 Figure 12 shows the test specimen arrangement where two glass pieces were connected to aluminium plates at both ends of the glass specimens using two bolts at each end. Aluminium plates were used in the experimental investigation, since they enabled fixing the test specimens into the grips of the loading machine where brittle material behaviour of glass mean that fixing the glass specimens directly into the loading machine was not appropriate. The geometric and design details of the reference and reinforced joints were similar except the GFRP strips were bonded on the external surfaces of glass on the reinforced joints. Details of the design, fabrication and testing of the test specimens are published elsewhere, 9 and are not repeated in the present paper.
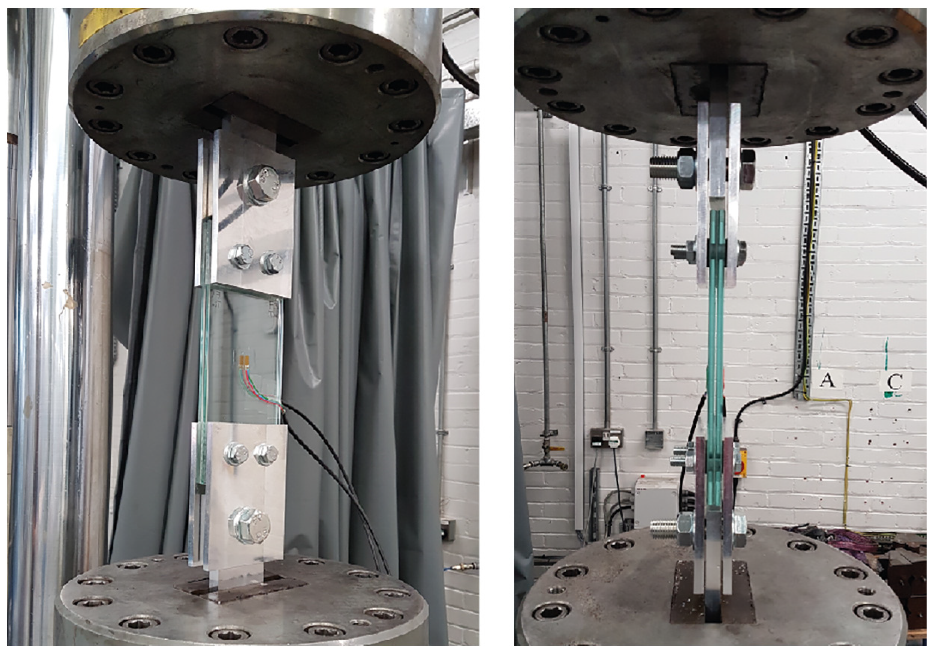
Double-lap glass–bolted tension joints test specimen.
Reference glass–bolted joint test specimens
The same FE modelling approach used in the previous single-bolt, single-glass-piece case was used to analyse the reference double-lap tension joints in annealed and HS glass. The residual stress distribution, thickness of a single glass piece (6 mm), bolt size (
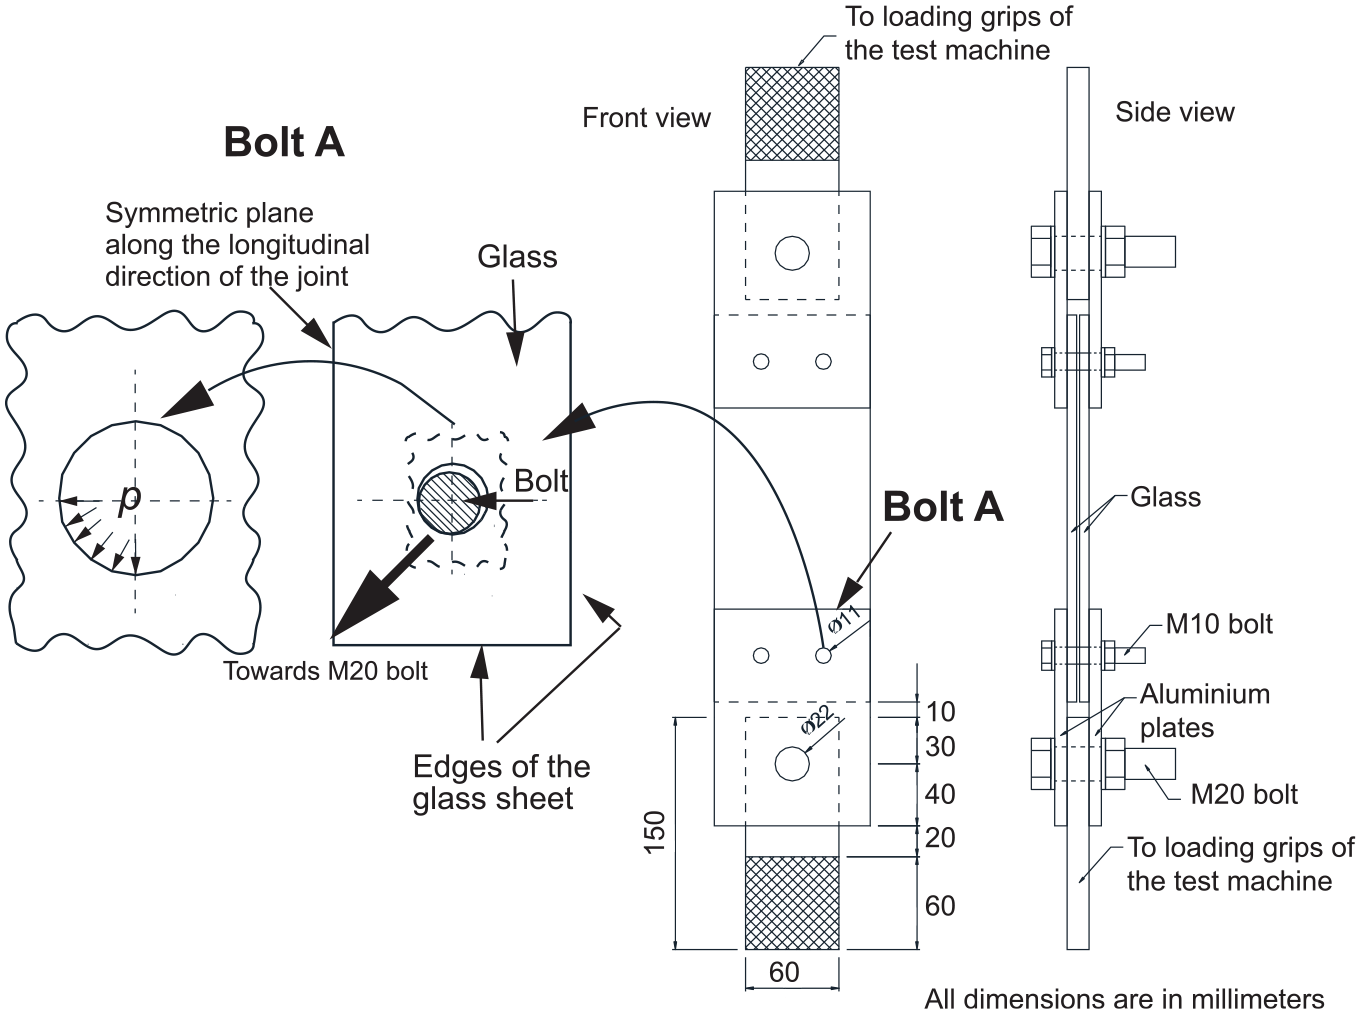
Geometric and loading details of the double-lap tension joint test specimen.
Unlike the previous single-bolt, single-glass-piece scenario considered above, the estimate of the contact pressure on the inner surface of the bolt holes in this double-glass, double-bolt, glass–bolted joint configuration was not trivial. This was due to the small dimensional tolerances in the holes and the minor misalignment between the overlapping holes of the two glass pieces prevented full contact between the bolt shank and the full depth of the two holes. Therefore, in practical applications it may be required to establish the contact area from an inspection of the test specimen or by precisely fabricating the joints to ensure a design contact area. The former method was used in the present study where it was noted that on average when the bolt shank was in contact with the full depth of the inner hole surface of the top glass piece, only about one-fourth of the depth of the second glass piece was in contact with the bolt shank. Furthermore, given the geometry of the overall test specimen where two M10 bolts at left and right sides of the glass specimens were loaded through a M20 bolt located along the centre line between the two M10 bolts (see Figure 13), it was observed that usually about one-fourth of the perimeter of the M10 bolt was in contact with the inner surface of the bolt hole. Similar to the previous assumption of the critical crack size of the reinforced glass–bolted joints, the accuracy of the assumption of this critical parameter regarding the contact area of the bolts can only be generally validated through a detailed investigation covering a range of experimental test specimens. However, the estimate of the contact area through an inspection of the given test specimen, as did in the present study, is reasonably justifiable for the purpose of comparing the experimental results of the same test specimen.
Considering the contact scenarios along the depth and the surface area of the bolt holes, the effective contact area (Ae) of the two M10 bolts was determined to be:
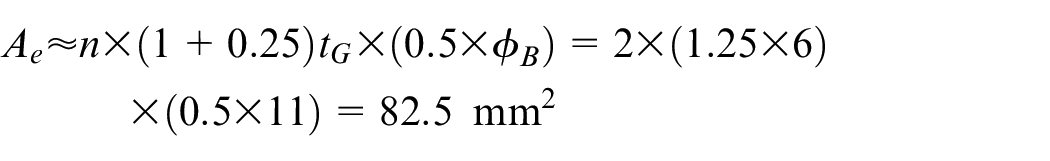
where n = number of bolts at one end of the joint (= 2), t G = thickness of one glass piece (= 6 mm) and φ B = diameter of the drilled hole (= 11 mm).
The magnitude of the contact pressure (p) was then determined by dividing the total force applied by the loading machine by the effective contact area (A e = 82.5 mm2). In the experimental investigation, the reported failure loads of the three reference glass–bolted joints were ∼3.92, 3.76 and 4.34 kN (average = 4.007 kN) for annealed glass and 5.96, 5.7 and 6.12 kN (average = 5.927 kN) for HS glass. It should be noted that the experimental results showed some scatter, but the scatter is within an acceptable range for the experiments of glass where large scatters of the test results (>20%) are usually expected (e.g. Veer et al. 25 ).
In the experiments, 9 the failure of one glass piece was first observed where the failure of the second glass sheet followed that of the former. This was due to the greater contact area of the top glass piece compared to that in other glass piece (i.e. full-depth contact in the former compared to that of one-fourth depth in the latter). Therefore, in the present analysis, only the glass specimen that had full-depth of contact with the bolt shank was analysed. Because of symmetry in all X-, Y- and Z-directions, only one-eighth of the glass piece was modelled. The residual stresses were first modelled using the eigenstrains technique explained in Section 3.1.2. The stress analyses were then carried out under the reported respective average failure loads (i.e. 4.007 and 5.927 kN for annealed and HS glass–bolted joints, respectively). This was done by applying a pressure loads of 48.6 N/mm2 (i.e. = 4007÷82.5) and 71.8 N/mm2 (i.e. = 5927÷82.5) in annealed and HS glass–bolted joints, respectively.
Results
Figure 14(a) and (b) show the σ 1_max distribution in the surface regions of the glass in the reference annealed and HS glass–bolted joints at the respective reported failure load. Figure 14(c) shows the values of the maximum principal-tensile-stress in glass at the most highly stressed surface region in the vicinity of the bolt hole. The results shown in Figure 14(c) suggest that σ 1_ts_max just reached σ t_glass at the highly stressed surface region. The results justify the respective experimentally observed failure loads of the joints and the computational modelling approach developed in Section 3.1 for the analysis of the unreinforced joints.
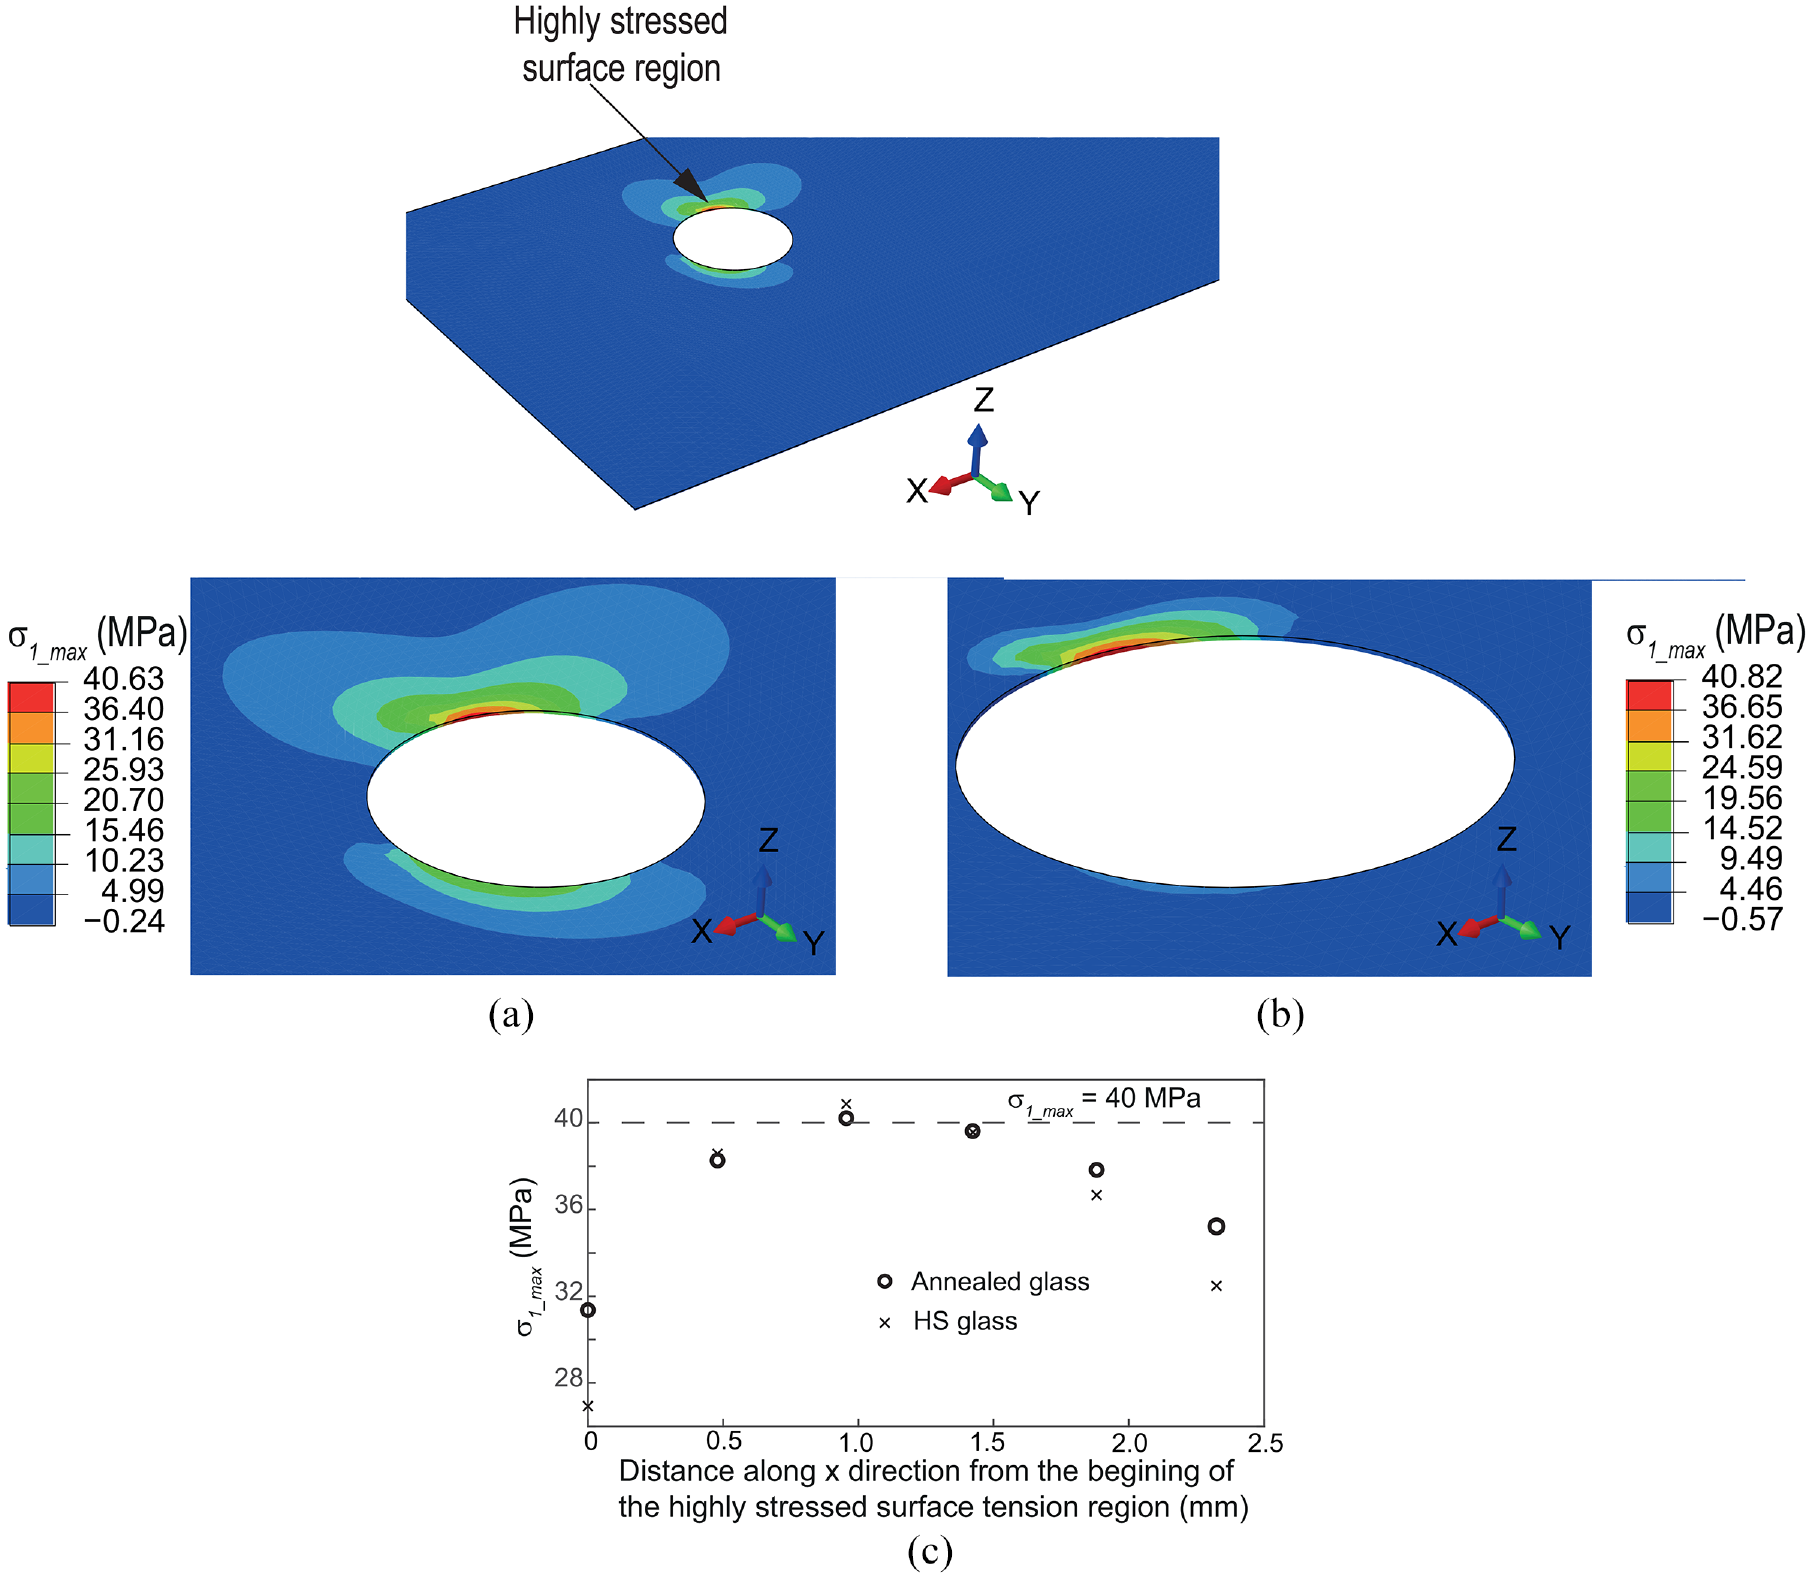
σ 1_max distribution at the onset of glass fracture in: (a) annealed (b) HS glass-bolted double-lap tension joints and (c) σ 1_max values at the most stressed surface region.
GFRP-reinforced glass–bolted joint test specimens
The same FE modelling approach used for the analysis of the previous GFRP-reinforced single-bolt, single-glass-piece case was used to analyse the GFRP-reinforced experimental test specimens. Figure 15(a) shows the geometric details of the GFRP strip used in the test specimens. The GFRP strip had the same width as the glass specimen (100 mm), and the strips were bonded in a way that the GFRP strip covered the bolted–joint area at the end of the glass specimen (Figure 15(a)). Despite the different size of the GFRP strip compared to that considered in single-bolt, single-glass-piece case, the thickness and the mechanical properties of both GFRP were the same. The FE analysis was carried out by incorporating the GFRP reinforcement in the FE models as in the previous case of GFRP-reinforced single-bolt, single-glass-piece case. However, different geometric and design details, including the different size of the GFRP strip used in the double-lap tension joint configuration compared to that used in the single-bolt, single-glass-piece case, was explicitly modelled in the present analysis.
(a) Dimensions of the GFRP reinforcement strip, σ 1_max distribution in glass at the onset of glass fracture in GFRP-reinforced glass-bolted double-lap tension joints in (b) annealed glass and (c) HS glass-bolted joints and (d) σ 1_max values at the most stressed surface regions of the glass.
Results
Figure 15(b) and (c) show the σ 1_max distribution in the reinforced annealed and HS glass-bolted double-lap tension joints at the respective applied force which caused the first kink in the load response curve. The corresponding applied force values were 5.2 and 7.8 kN for the annealed and HS glass-bolted joints, respectively. It should be noted that the reinforced joints continued to resist increasing applied force after the formation of the first major crack, since the GFRP strips prevented complete fracture of the glass across the joint even after the formation of the first major crack (the recorded average ultimate load of the reinforced joints were 9.77 and 11.8 kN in annealed and HS glass, respectively 9 ). Since the scope of the present paper was limited to the formation of the first major crack, the stress analysis was carried out only at the corresponding load cases only (i.e. 5.2 and 7.8 kN in the annealed and HS glass-bolted joints, respectively). Similar to the analysis of the reference joints, the analysis of the reinforced joints was done by considering the same effective contact area (Ae = 82.5 mm2).
Figure 15(d) shows the maximum principal-tensile-stress in glass at the most highly stressed surface region in the vicinity of the drilled hole of the two joints. The results shown in Figure 15(d) suggest that cracks of length ∼1.5–2 mm were presented at the highly stressed surface region of glass. Therefore, the computational methodology and the failure criterion established in Section 3.2 using the results of single-bolt, single-glass-piece case justify the experimental results of the GFRP reinforced double lap tension joint test specimens. Similar to the single-bolt, single-glass-piece example (Section 3.2), the σ xx - and σ yy -stresses in the GFRP strips at the failure of the reinforced glass–bolted joints were low (between −5 (compression) and 10 MPa) compared to the relevant ultimate strength values of the GFRP. The low stresses in the GFRPs also mean that there was no debonding of the GFRPs from the glass specimens.
Conclusions
This paper presented the development of a finite element (FE)-based computational methodology for predicting the stress distributions and safe design load of reference and GFRP-reinforced glass–bolted joints in annealed and heat-strengthened (HS) glass.
The paper showed that an eigenstrains-based modelling approach can be used to incorporate the effects of the residual stresses in the stress analysis of glass–bolted joints. The eigenstrains approach incorporates the effects of the full 3D residual stress distribution, and hence it is different to the simple approach of superposing the value of the surface residual stress on the results from a stress analysis which does not incorporate the effects of residual stress. The results showed that the residual stress distributions in the vicinity of a drilled hole in glass is different to that in middle regions of flat glass sheets. Results of the stress analysis of glass–bolted joints without including the effects of residual stress are different to those analyses which included the effects of residual stress.
The results showed that the maximum principal-tensile-stress based failure of glass can be used to predict the failure load of the reference glass–bolted joints and to predict the formation of first major crack in GFRP-reinforced glass-bolted joints. The failure of the reference joints can be established as when the maximum principal-tensile-stress at the most highly stressed location of the glass surface reaches the tensile strength of glass. In the case of GFRP reinforced glass-bolted joints considered in a previous experimental study, 9 the results suggest that the formation of the first major crack may be assumed as when the maximum principal-tensile-stress exceeded the tensile strength of glass over a surface region of ∼1.5–2 mm long.
The results from the computational models reasonably match with the experimental results of reference and GFRP-reinforced double-lap glass–bolted tension joints in annealed and HS glass tested in a previous experimental study. The generic validity of the assumptions made in the computational models against other experimental results is suggested for a future publication. Similarly, extending the present FE models for detailed analysis of the post-peak load response of the reinforced glass–bolted joints, including an analysis of the effects of different design parameters of the GFRP, is proposed for a future study.
Footnotes
Declaration of conflicting interests
The author(s) declared no potential conflicts of interest with respect to the research, authorship and/or publication of this article.
Funding
The author(s) received no financial support for the research, authorship and/or publication of this article.