
Abstract
The auxetic sandwich panels for structures have been designed to provide impact protection. The aim of this work is to modify an auxetic (re-entrant) honeycomb cell to reduce the stress concentrations within the cell structure, and further enhancement of this design. The auxetic structure was filled to achieve a greater energy absorbance and enhance safety applications. Analytical and elastic three-dimensional finite element approaches were used to investigate the structural strength performance. The basic model (i.e. modified re-entrant strut cell design) consisted of the honeycomb auxetic polypropylene (PP) structure sandwiched between two steel plates (known as safety panels) which were placed under static compression loading. The cell geometry and size were then modified to reduce the stress concentration zones. The structure cells were filled with silly putty and polyvinyl chloride (PVC) foam. The effect of the filling the cells on the stress concentration and energy absorbance were analysed using elastic stress and deformation analysis methods. During the stress path analysis, it was found that an increase in Young’s modulus of the filling was directly proportional to a decrease in internal stresses. It was concluded that while filling the basic model with soft materials reduced the stress concentration, but it led to a reduction in the energy absorbance capability. Further on, the lower stress produced by the enhanced could be useful to prevent significant penetration of the protective panel. Compared to similar structures of steel, auxetic foam panels have the advantage of having only a fraction of the weight and being corrosion resistant at the same time as keeping impact strength.
Graphical abstract
Keywords
Introduction
Auxetic materials with a negative Poisson’s ratio (NPR) have many enhanced mechanical properties that can be benefit a wide range of applications.1–5 Some of these properties include a high indentation resistance, high shear resistance, high fracture toughness and enhanced vibration damping. Also, due to the high energy absorbing properties they have been used for shock and sound absorbers, body armour, elbow pads and packing materials.
There are many types of auxetic cellular structures being hypothesised and synthesised. Some common auxetic structurers include re-entrant structures, rotating units, missing rib, chiral and anti-chiral structures. Cellular structures can be modelled in two-dimensional (2D) or three-dimensional (3D) to either create a plane or fill a 3D space. Honeycomb re-entrant structures can be easily modelled nowadays, and they exhibit auxetic behaviour. 2 An auxetic honeycomb is an array of identical cells connected to form a structure with auxetic properties. The first re-entrant hexagonal auxetic honeycomb structure was originally designed by Evans et al. 1 The re-entrant honeycomb structure displays auxetic behaviour during the deformation mechanisms of flexing, stretching and hinging of the cell’s struts. To ensure a structure has a negative Poisson’s ratio, the individual cells’ geometry needs to be modified to create the re-entrant cell structure.
Based on re-entrant cell structure (Figure 1(a)), Ingrole et al. 2 proposed a modified re-entrant cell structure (Figure 1(b)) for the hexagonal cell’s angle of the inclined strut. It was noted that for a cell’s geometry, the length, height and thickness of the struts are key parameters in determining the features of an auxetic a structure. Yang et al. 3 studied an analytical model for a 3D re-entrant honeycomb and found out that the h/l ratio and the angle of the inclined strut had a significant effect on the properties of the structure. Furthermore, it was found that a structure is not sensitive to the number of cells when the number of unit cells is greater than 2. This is particularly useful when size is a restriction. The individual cells have four main parameters that can be altered: h is the height of the vertical strut, t is the thickness of the strut, l is the length of h of the sloping strut and Θ is the angle of the sloping strut. For the honeycomb and re-entrant structures, the angle Θ is positive and negative, respectively.
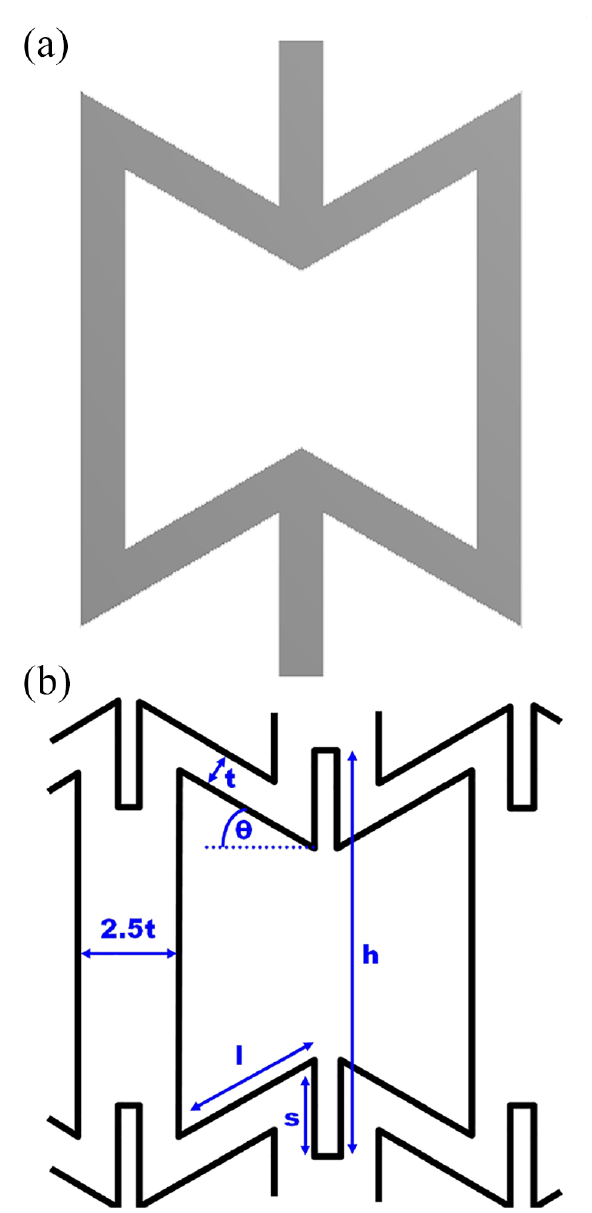
Auxetic cell designs: (a) re-entrant and (b) modified re-entrant strut cell design with dimensions (adapted from Ingrole et al. 2 ).
In addition to re-entrant hexagonal structures, there are many other less common re-entrant honeycombs. Arrowhead and star configurations, and square grid structures are common types of re-entrant honeycomb structures. Smith et al. 4 analysed several structures and found out that the lozenge grid re-entrant structure to have a lesser auxetic effect than the square grid structure when tested under the same strain. Unfortunately, works on auxetic structures that are not re-entrant in structure are rare in the open literature. The common structures are chiral and rotating unit structures. Chiral and anti-chiral structures are formed through connecting a series of straight struts or ligaments to a central node which are then connected to other chiral cells to form the complete structure. They exhibit auxetic behaviour through unwrapping or wrapping of the ligaments around a circular node when force is applied causing the ligaments to flex. Anti-chiral structures have their ligaments attached on the same side as the connecting nodes. Chiral and anti-chiral lattices can be designed to have three, four or six ligaments to every node. Meta-chiral is when the properties of chiral and anti-chiral are combined. This occurs when some nodes are connected to the same side of the ligaments and some connected to the opposite side of the ligaments. Grima et al. 5 researched on meta-chiral structure with four ligaments connected to each node. The structure was found to be highly anisotropic and the Poisson’s ratio was reportedly reliant upon the aspect ratios. Unlike other auxetic structures these structural configurations maintain a high auxetic effect even under a large range of strains. This is due to the auxetic effect being dependent upon the shape of the node and the length of the ligaments and not the any of the structural angles. 6 The in-plane stiffness of the structure is said to decrease with the addition of cylinders in the structure. This is in comparison to the honeycomb re-entrant structures that exhibit a greater in-plane stiffness.
A rotating structure is one in which a series of rigid squares are connected by hinges. When a load is applied to the structure, the square will rotate at the vertices which results in the structure expanding or contracting. The shapes commonly used are square or rectangles, however, there have been designs which have implemented triangles, rhombi and parallelograms. The shape of the units causes the different behaviour in the structures. Similarly, a change in the angle between the units. Grima et al. 7 suggests that the Poisson’s ratios are dependent upon the shape of the unit which means they are strain dependent. Further, the same team Grima et al.8,9 did a study on triangular rotating units and reported that the Poisson’s ratio varied with the shape of the triangles and the angle between them.
Research carried out by Ingrole et al. 2 investigated the compressive strength and energy absorption ability of the honeycomb and the re-entrant honeycomb. It was suggested that the re-entrant structure had a greater compressive strength than the honeycomb structure. The energy absorption ability of the re-entrant structure is also greater than that of the honeycomb, and this agrees with the findings from Hou et al. 10 However, by comparing the works of Hou et al. 10 to Ingrole et al. 2 it can be deduced that the ‘auxetic strut’ had the best crushing strength and energy absorption ability compared to the re-entrant and the honeycomb. It was also suggested by Ingrole et al. 2 that the auxetic strut should be filled with a material to increase the crushing strength. Increasing the crushing strength will improve the impact force a structure could withhold. Ideally this should not affect the auxetic strut energy absorbance although to the authors’ best knowledge this has not been previously reported in the literature.
For optimisation of the honeycomb cells, the parameters can be varied to achieve the largest negative Poisson’s ratio. Although Hou et al. 10 cell optimisation was aimed at attaining the largest absorbed energy, 11 it should be noted that optimisation of cell’s geometry for greater energy absorption can also increase the manufacturing time and cost. Since such structures may be manufactured through additive manufacturing (AM) which is a technology that adds the material layer-upon-layer such as 3D printing using a minimum thickness of the struts. The Poisson’s ratio for a hexagonal cell varies depending on the height to length ratio and the angle of the inclined strut. For hexagonal cells, Θ is positive and for re-entrant cells it is negative.
In this study we focussed on the 2D re-entrant auxetic cell structure due to its mechanical properties. It behaves in a way that shows auxetic behaviour in the two directions. Similarly, the 3D re-entrant honeycomb structure exhibits the same behaviour but in all three principal directions. As the re-entrant structure’s mechanical properties are dependent upon the individual cell’s geometry, optimisation of the cells can be carried out purely through its geometry due to them having a significant effect on the Poisson’s ratio. Therefore, the aim of this work is to modify an auxetic (re-entrant) honeycomb cell and assess the reduction of stress concentrations within the cell structure. Once this was achieved, the modified auxetic structure was filled to achieve a greater energy absorbance and enhance safety applications. This cell is potentially suitable for use in the core material of an auxetic sandwich composite for marine safety applications (e.g. related to collision resistance of ship-shaped structures to side impact).
Methodology
Analytical method (modified re-entrant strut cell design)
The cell structure studied was the modified re-entrant strut cell design, as shown Figure 1(b). The modified re-entrant strut cell structure was first designed by Ingrole et al. 2 by modifying the basic re-entrant cell to decrease stress concentration. For the modified strut, the thickness of the vertical strut connecting the cells together was increased but also spilt at both ends. For a hexagonal cell design, angle of the inclined strut is positive. For a positive angle of the inclined strut, a positive Poisson’s ratio is obtained, whereas, if the angle is negative, the structure is re-entrant and exhibits a negative Poisson’s ratio.
During the designing of the cell structure, the mechanical properties using analytical method need to be considered to ensure the material exhibits auxetic behaviour. To develop equations for the homogenised material properties, such as the elastic moduli and Poisson’s ratios of auxetic materials has taken a great deal of effort. Masters and Evans
12
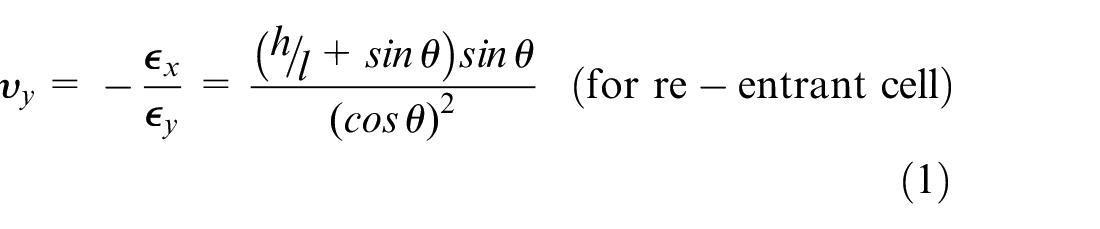
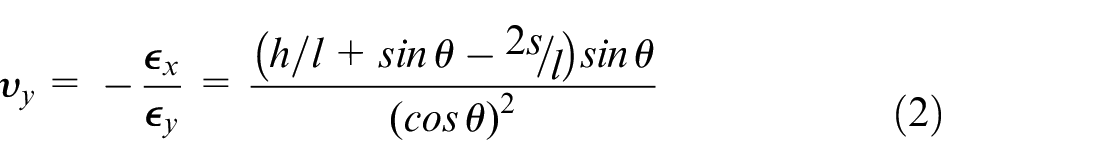
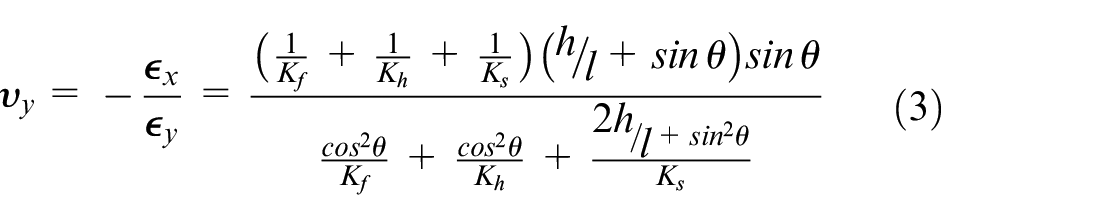
hypothesised that the deformation of the auxetic cells structure is due to flexure in the struts of the cells when load is applied. By using solid mechanics and considering the cell struts as beams, derivations for the material properties of the structure can be developed. Poisson’s ratios have a high sensitivity to the cell’s geometry such as the height and length of the struts. Equations (1) and (2) show the expression for the Poisson’s ratio when the cell structure is loaded in the y-direction.
12
Equation (1) details the Poisson’s ratio (
where
where
where
where
Relative density of the auxetic structure can be increased by increasing the thickness of the struts, decreasing the angle of the inclined strut and/or increasing the height to length ratio. When the strut thickness is increased, this results in the cell wall opposing bending and buckling. Equations (7) and (8) are the relative density equations for the re-entrant cell design and the auxetic strut cell, respectively.2,12
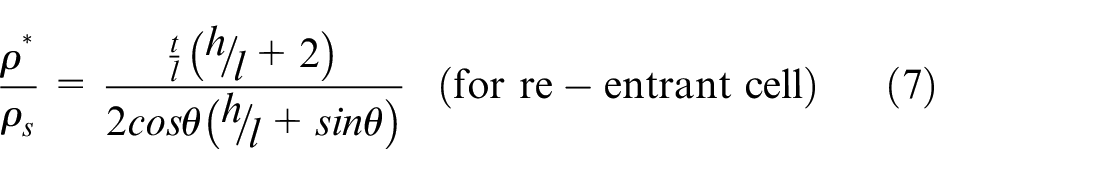
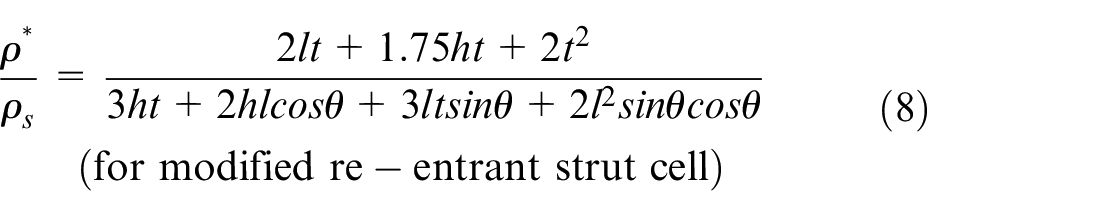
where
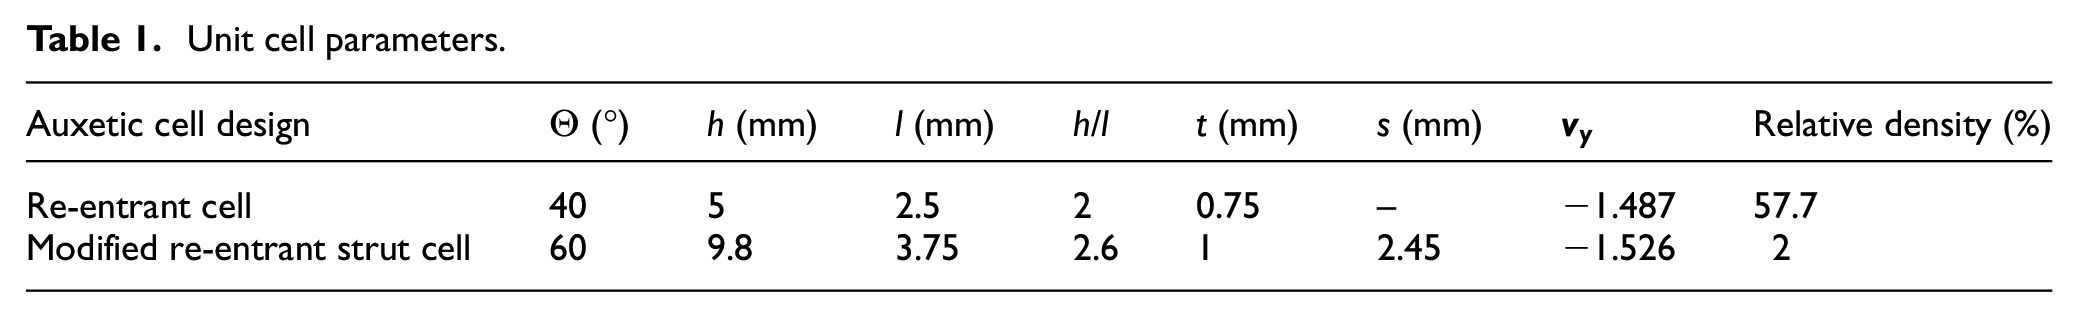
Unit cell parameters.
For optimisation of the modified re-entrant structure, modifications were to be made. This involved altering the height to length ratio and the angle of the inclined strut. Using the analytical methodology presented above, Figure 2 illustrate the relationship between the design parameters for modified re-entrant strut design. An increase in angle of the inclined strut and in the height to length ratio, produced a greater NPR. As Figure 2 depict, the two parameters that influence the Poisson’s ratio are the height to length ratio (h/l) and the re-entrant angle (
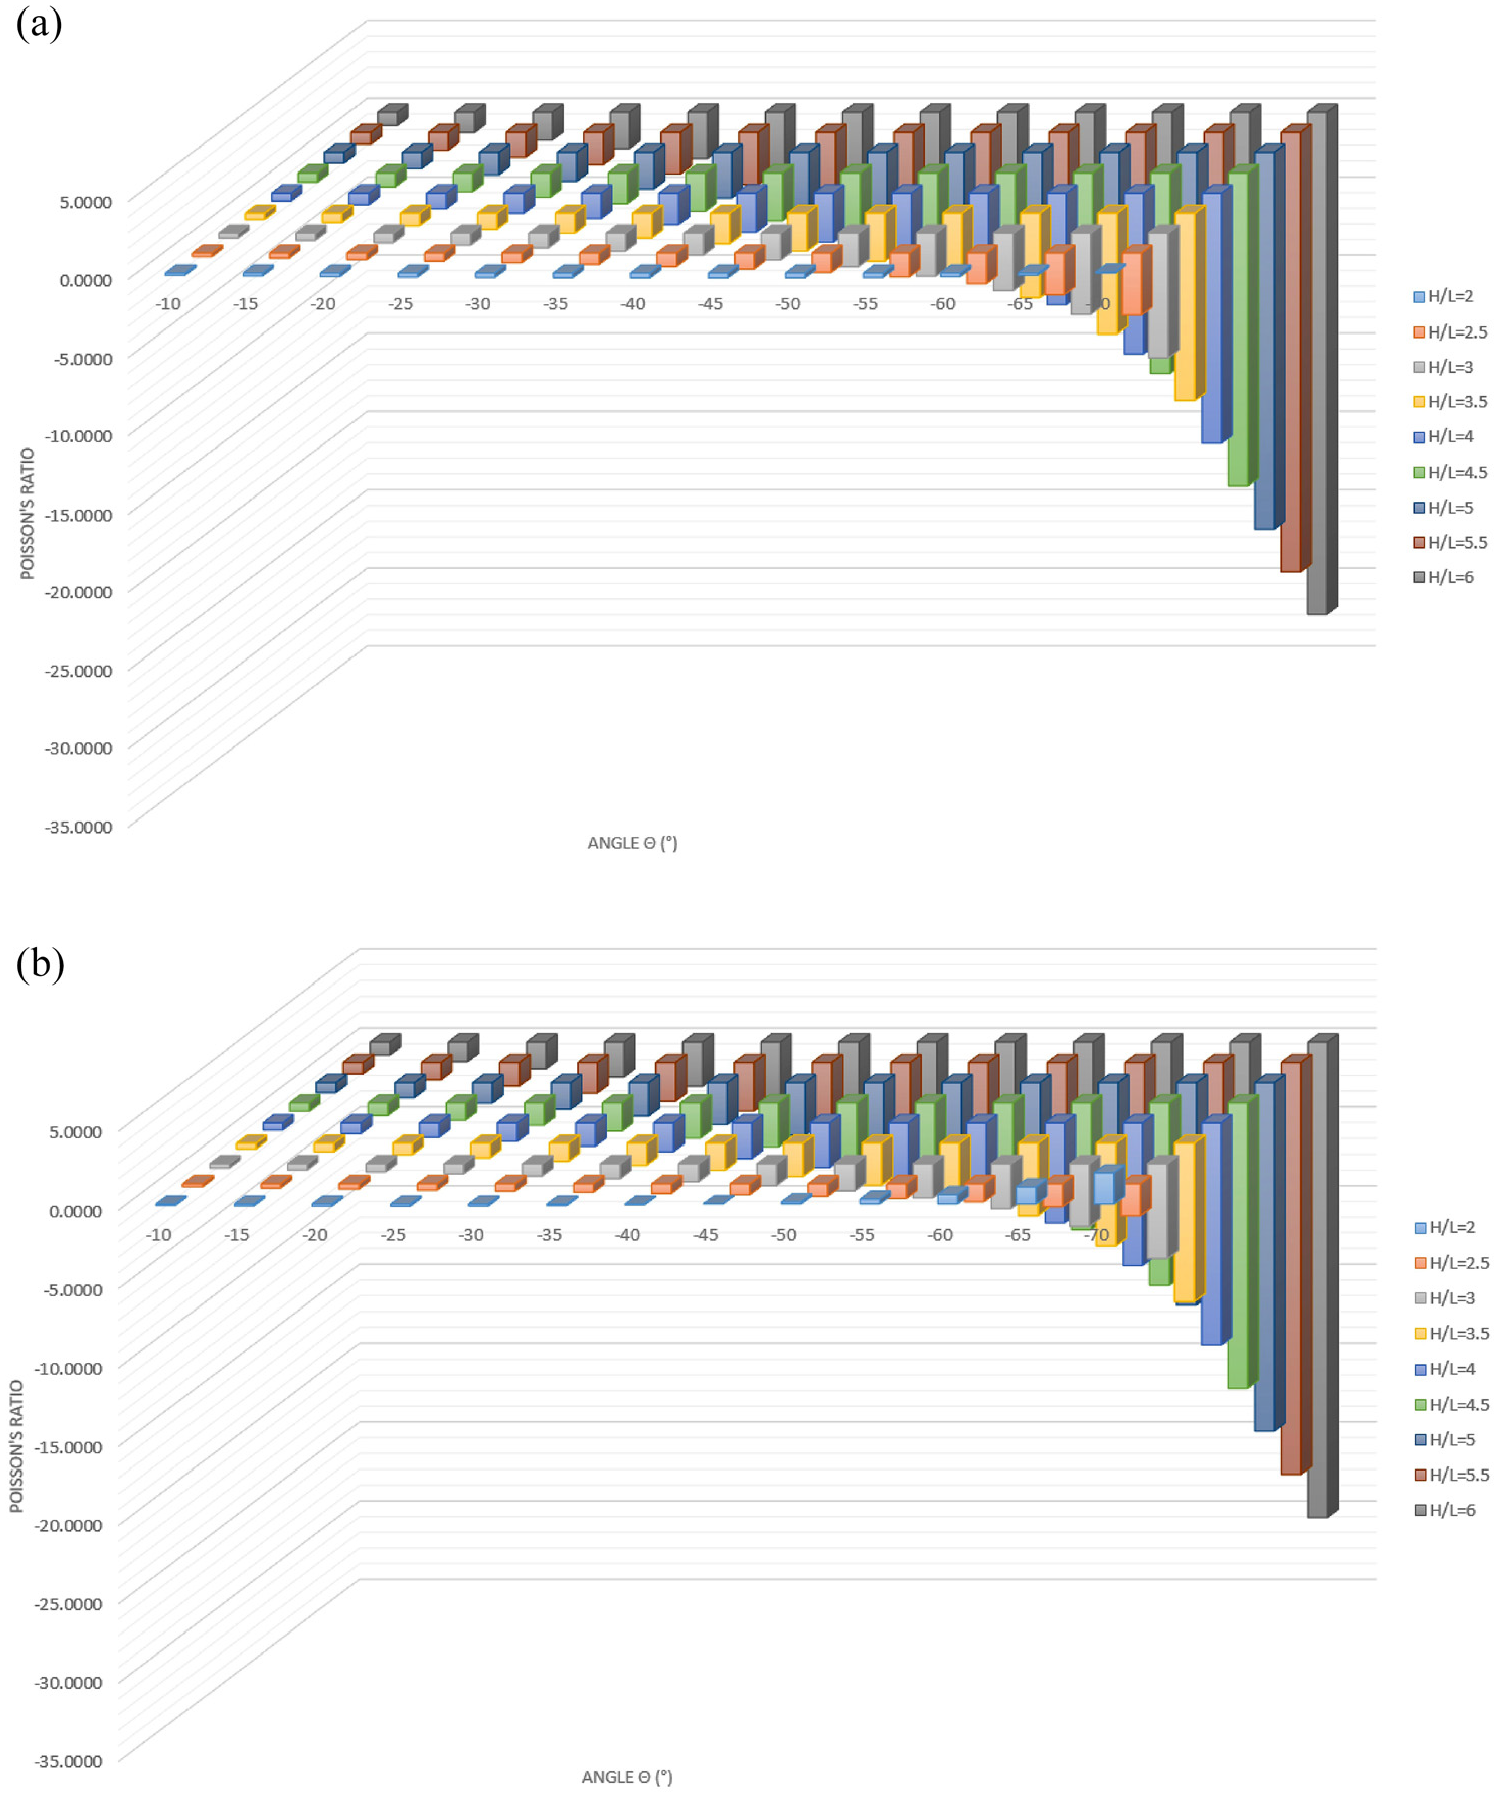
Poisson’s ratio with different h/l ratio (modified re-entrant strut cell design): (a) at l = 3.75 and s = 2 and (b) at l = 3.75 and s = 2.45.
To re-enforce the re-entrant honeycomb structure, an extra material can be added, and the design slightly altered (major part of this study). As the ideal property in the marine safety application is high energy absorption, the modified auxetic strut model can be used to great effect. The split vertical struts in this design (i.e. modified re-entrant strut cell design) allow the structure to retain its auxetic capabilities while being sturdier when subjected to uneven forces. An example would be the shear forces imparted when friction occurs between the impacting object and the outer panel of the auxetic structure. When this occurs, the struts will retain the structures vertical shape while the thinner areas of the strut crumple. This creates a cushioning effect which absorbs the impact slowly. The dimensions chosen in rest of the study for the modified re-entrant strut cell design (Figure 1) and further enhancement were: θ = 60°; t = 1 mm; l = 3.75 mm; h = 9.80 mm; s = 2.45 mm.
Finite element method (modified re-entrant strut cell design)
Model setup
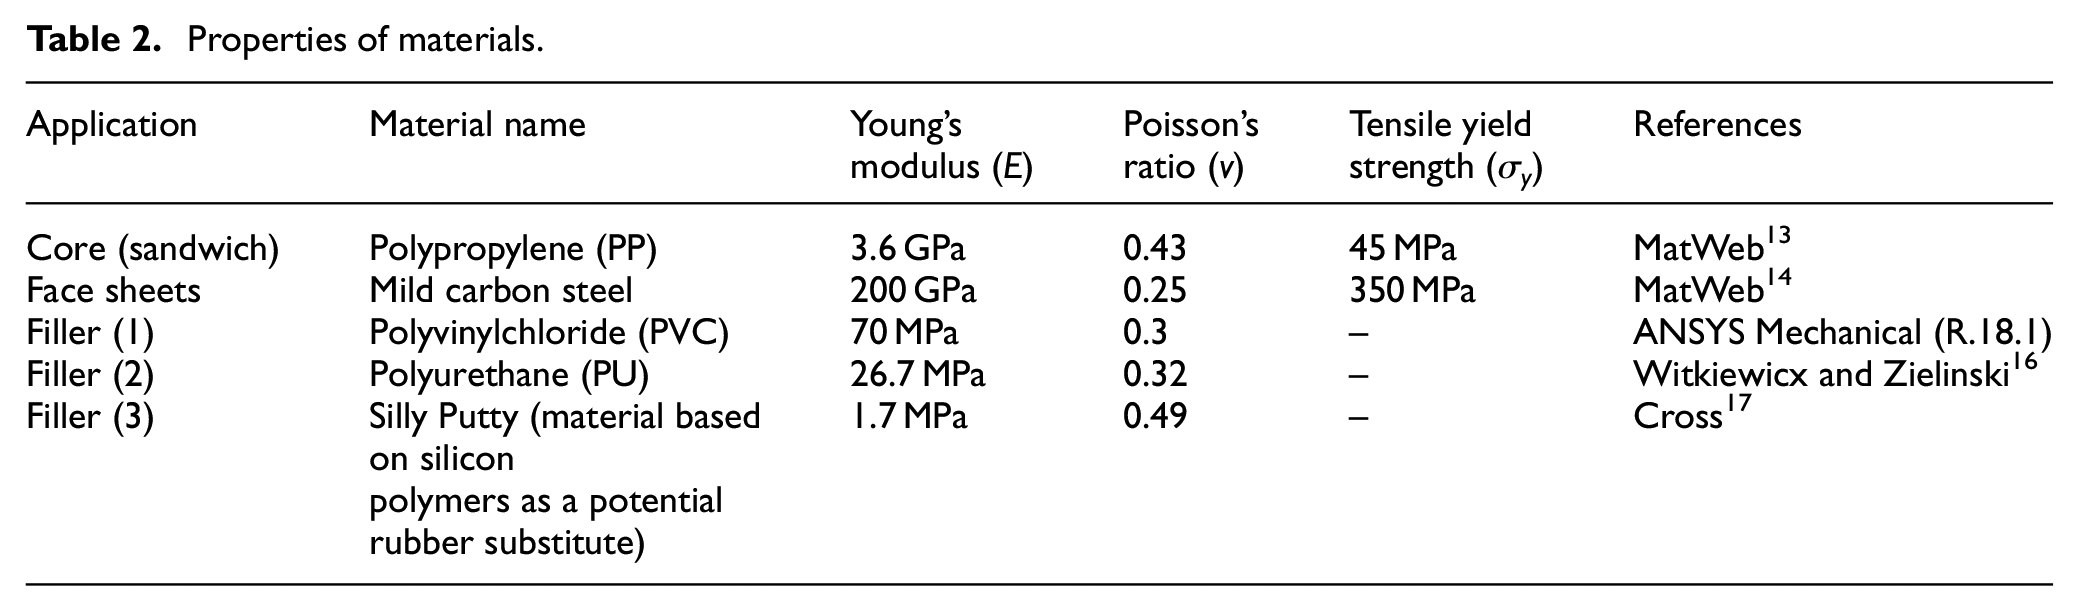
Before a cell design had been finalised, a 3D model of two mild carbon steel face sheets and a core (polypropylene) sandwich composite was created. As listed in Table 2, the properties of polypropylene (PP) are assumed to be elastic with elastic modulus of 3.6 GPa, tensile yield strength of 45 MPa and Poisson’s ratio of 0.43. 13 The properties of mild carbon steel are assumed to be elastic with elastic modulus of 200 GPa, tensile yield strength of 350 MPa and Poisson’s ratio of 0.25. 14
Properties of materials.
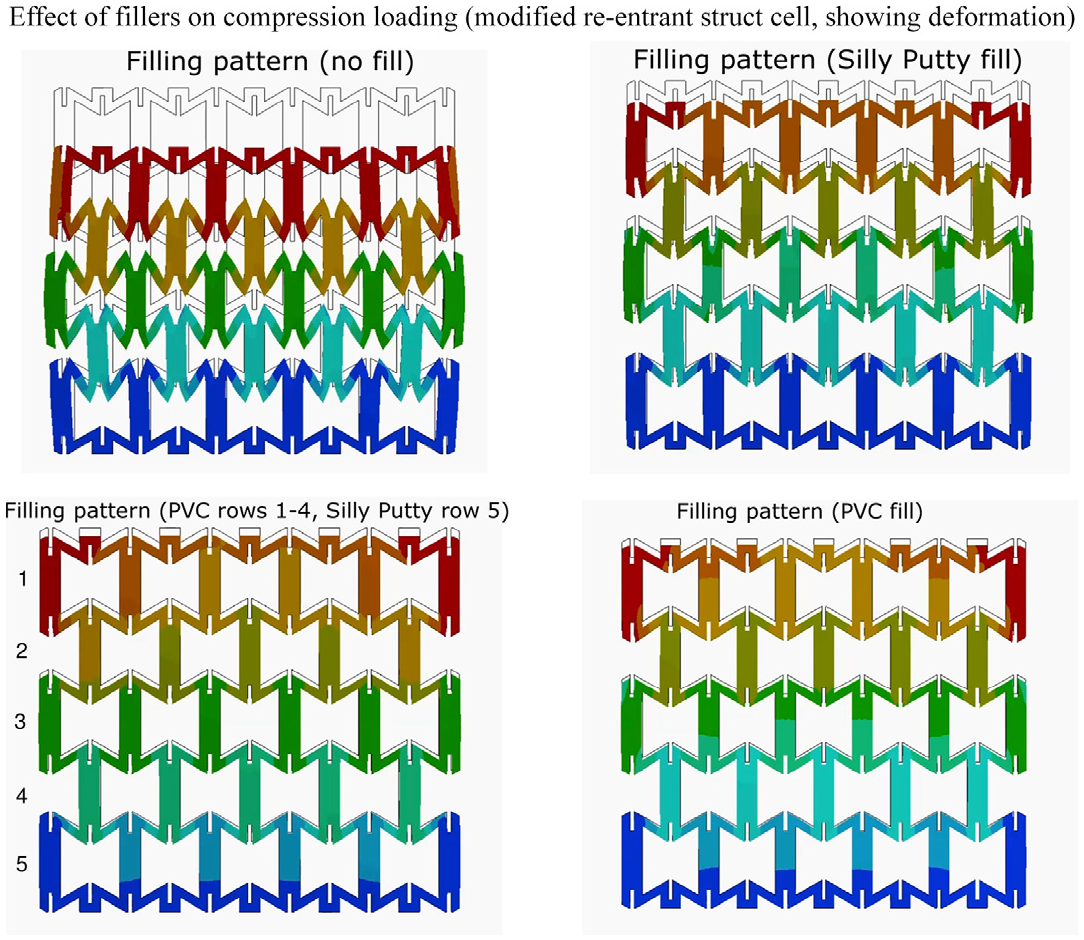
To test the effect of impact energy on the auxetic modified re-entrant strut design suitability, a scale model was implemented (Figure 3(a)). This figure shows the simple sandwich composite structure which was designed in SOLIDWORKS® before being analysed using finite element (FE) method in ANSYS Mechanical (R.18.1). The aim of the FE is to study the response of the effect of fillers on compression loading performance of modified re-entrant honeycomb auxetic sandwich structures. In the FE static structural modelling in the X-Y plane, the materials were assumed isotropic, small deformation of the structure was analysed as having a linear deformation, the load exerted on the top surface was assumed to be evenly distributed along the entire cross-sectional area, and fixed support constrained both degrees of freedom was applied on the lower surface. An elastic-perfectly plastic model was assigned to the single cell wall. The model was placed between two rigid mild carbon steel plates, and interaction property for contact was applied with a tangential behaviour and friction coefficient of 0.2. The quad-dominant element size of 0.1 mm was selected as the converged mesh size for the entire cellular structure. Because the lower surface of the model was used as fixed support therefore, the movement of the model at this limit was restricted on the vertical Y-axis direction and free to move on the longitudinal axis, and the upper boundary was displaced downwards through the exertion of a quasi-static uniform load.
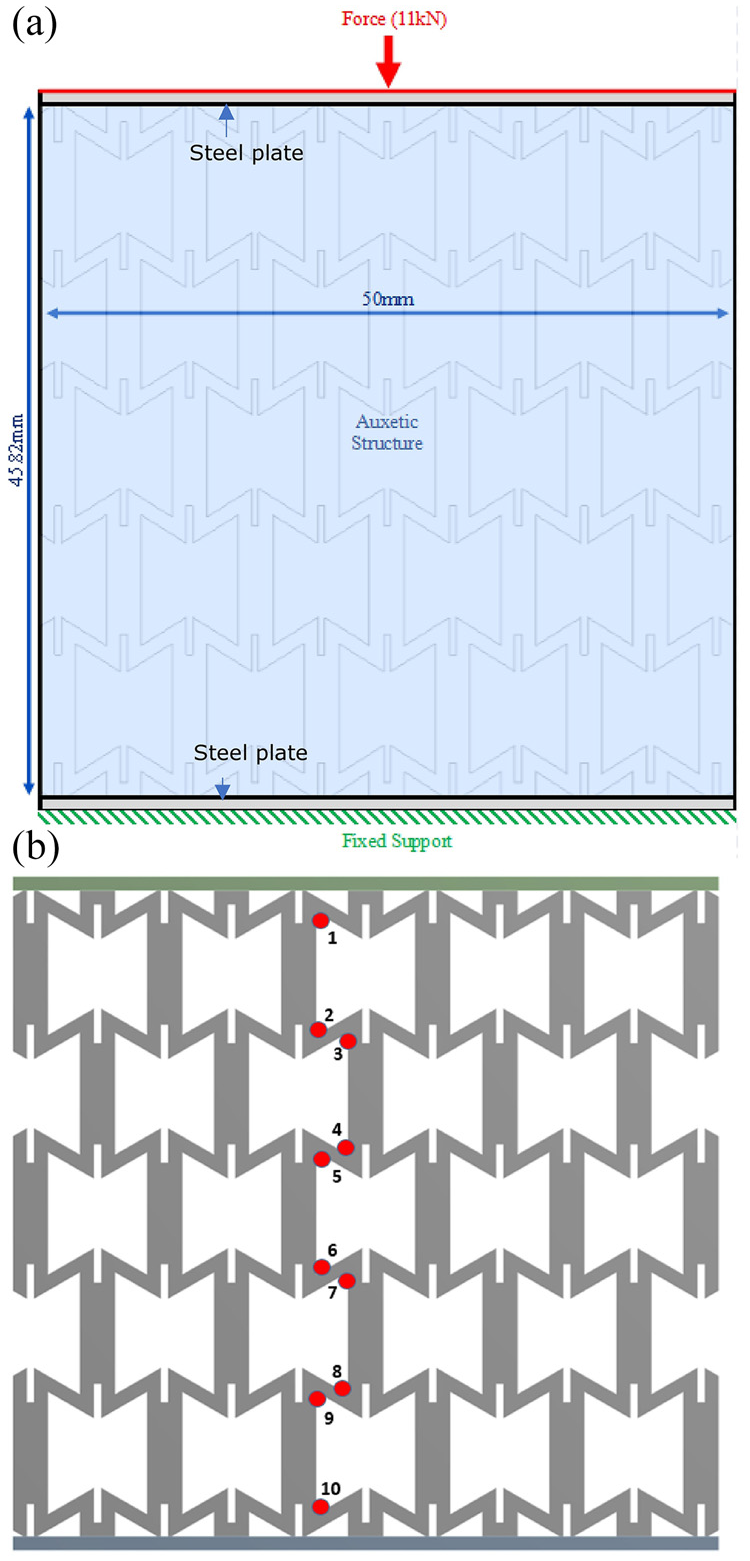
Basic model (modified re-entrant strut cell design): (a) showing polypropylene structure sandwiched between steel baseplates and (b) model with 10 highlighted stress probe locations.
The auxetic strut pattern was cut from the 50 mm × 45.82 mm central block using an extruded cut, through the full depth of the material (50 mm). The height of 45.82 mm was necessary to cut the auxetic structure symmetrically into the block. To find the force required on the simulated model, the total force must be scaled down. The mass and velocity values refer to work done by the Health and Safety Executive (HSE), related to collision resistance of ship-shaped structures to side impact.
15
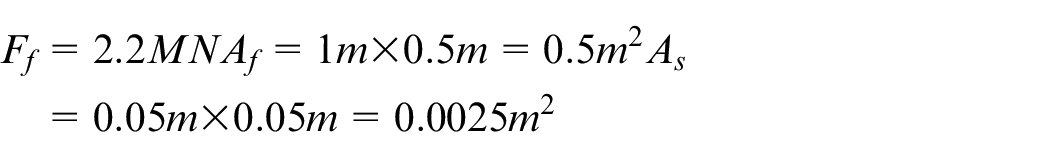
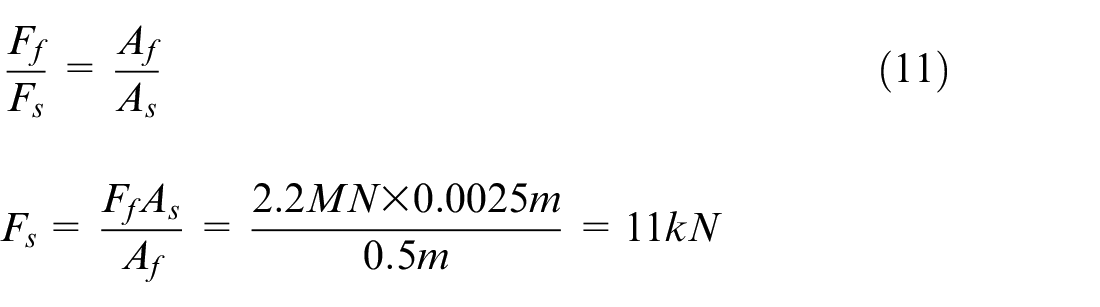
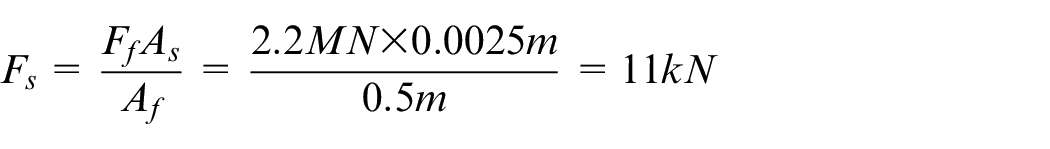
This report uses a mass of 5000 tonnes and a velocity of 2 m/s as to abide by Det Norske Veritas (DNV) rules. This study will use 5500 tonnes to increase the impact energy. The full-scale force (
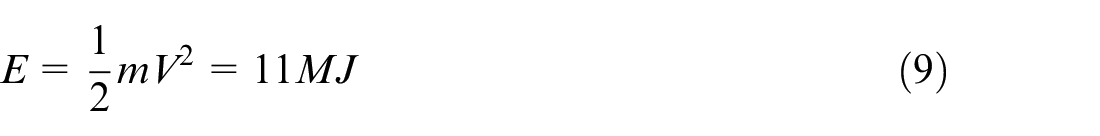
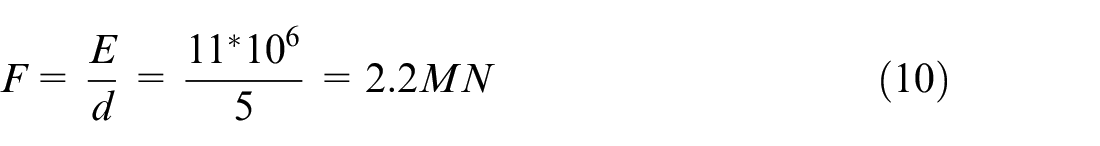
where
To successfully simulate the scale model, some assumptions were made: (a) Support: the component would be tethered to the outer hull of the ship. However, to simplify the simulations, the tether was assumed to be perfect and a fixed support on the bottom face of the steel baseplate will be used (Figure 3(a)). (b) Perfect bonding between steel plate and polypropylene (PP): in simulations bonding between steel plates and polypropylene was assumed perfect. In reality, the bonding agent used as a connection would have different properties and therefore experience an altered stress from that of the model, (c) Perfect bonding between filling materials and polypropylene: in the same way as with the steel and polypropylene, the simulation assumed that the filling materials were perfectly bonded. In reality, these filling would have been pre-cut and slotted in or poured in using an immersion tank technique, (d) Perfectly distributed load across impacted plate: in reality, the destructive impact may only impact part of the steel plate. In order to simplify the simulation process, it was assumed that the impact acted as an evenly distributed loading across the entire plate, (e) Load acting vertically: There was a possibility for the destructive impact to encounter the plate at a variety of angles. However, by assuming that the impact force would occur perpendicular to the steel impact plate, the simulation could be simplified and analysed further and (f) Elastic modelling: the modelling of the materials was assumed elastic.
Basic model (modified re-entrant strut cell design) and fillers
This new structure design included struts which were introduced due to literature 2 proving they would improve the compressive abilities of the cells, hence improving the structural capability. This new structure which were taken forward after some initial testing, as shown below in Figure 3(b). This model proved that for an optimised design, the thickness of the steel face sheets was unimportant and therefore 1 mm sheets were used. The skin thickness was changed from 0.5 to 2.5 mm in 0.5 mm increments. The results proved to show very little change in the deformation of the structure and therefore 1 mm steel face sheets were used as originally planned due to easy availability and cheaper manufacturing costs. This would also reduce the weight of the structure significantly. The stress values also do not change drastically over 2 mm change in skin thickness. Other core materials were investigated across these tests including polyurethane (PU) and polyethylene (PE). However, due to the change in results being negligibly different polypropylene (PP) was decided upon due to it being readily available for 3D printing. The thickness of the core was set to 50 mm as it was a realistic size when real life size (0.5 m), and the thicker the PP core, the more effective the resistance of the structure. This design was firstly tested as it was shown in Figure 3(b) with 11 kN acting downwards on the top face sheet and the bottom face sheet being restricted in movement in all directions followed on by cells’ filling.
The compressive strength of the cells must be extremely high, but they still can have the ability to crush effectively. Hence, to reinforce the cells while retaining their negative Poisson’s ratio (NPR) capabilities, a soft filling was used. Another reason for the filling of the cells was to reduce areas of high stress within the model. These points were identified through choosing 10 points throughout the design, as shown in Figure 3(b), to ensure that there were no points through the model which exceeded the yield point for polypropylene (assuming it to be 45 MPa). This showed stress behaviour throughout the sample as the load was applied. The reason for selecting 10 points through the model was due to follow the path mapping from one face sheet to the other.
A simulation was run on the model in Figure 3(b) which consisted of an 11 kN downward force acting on the top face sheet and a fixed bottom face sheet. Once the stress values had been revealed throughout the model with no fillings, it was noticed that seven out of the ten chosen points were above the yield stress of polypropylene core. Knowing that the stress within the design would not go beyond the elastic limit allowed for more accurate predictions to be made and reduces the cost of repairing the model post impact.
First, a range of materials with the potential to be used as ‘fillers’ had to be chosen (see Table 2) so they could be compared through simulation. The three materials chosen, due to having very different properties from one another are polyvinylchloride (PVC) foam (Young’s modulus: 70 MPa, Poisson’s ratio: 0.3 (ANSYS (R.18.1))), polyurethane (PU) foam (Young’s modulus: 26.7 MPa, Poisson’s ratio: 0.3216), and silly putty (Young’s modulus: 1.7 MPa, Poisson’s ratio: 0.4917). To achieve the required strengthening characteristics, the material selected for filling should have a low Young’s modulus (E < 100 MPa). By using various combinations of filling and analysing the stress patterns through the polypropylene, an optimised material pattern can be selected. Through editing the SOLIDWORKS® model, it was possible to create solid block patterns to fill the cells a row at a time. This enabled simulations to be run with Row 1 of the model filled with PVC. This was then repeated until all the cells were filled, and then repeated further for PU foam and silly putty.
Results
Stresses in modified re-entrant strut cell design
Basic model (modified re-entrant strut cell design)
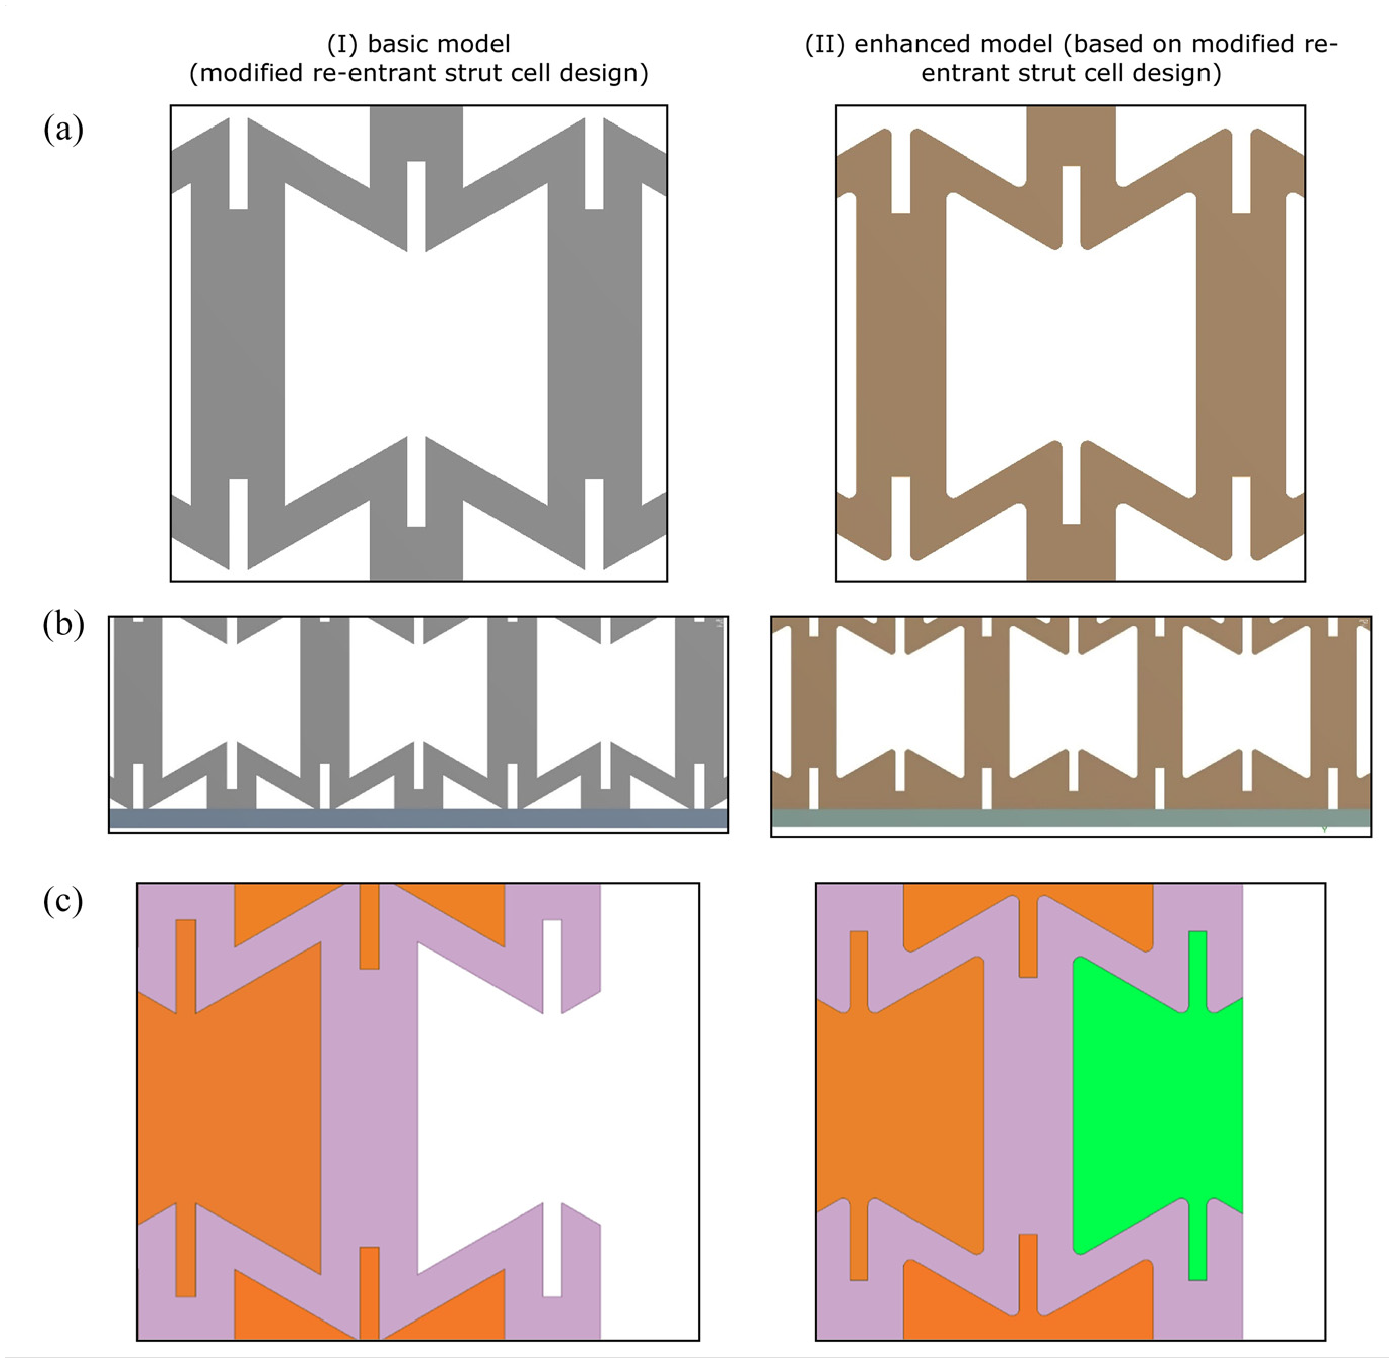
For the first run of simulations, the modified re-entrant strut cell pattern was cut into the polypropylene as shown in Figure 4(a). The dimensions used for this were given in analytical section above. The steel plates (grey) and polypropylene structure (blue) are shown, as well as the gaps in which the filling was inserted (green). As shown in Figure 4(a), the structure was split into rows and filled in various ways based on these row markings. To analyse the suitability of each model four stress paths were created through the polypropylene structure. The first two vertical paths (1 and 2) were used to measure the polypropylene stresses at the interfaces with the filling. The second two horizontal paths (3 and 4) were used to analyse the stress at the interface with the steel plates. These paths are shown in Figure 4(a). Analysing both the principal and the shear stresses through these paths allowed a selection to be made on the best model type and filling pattern for the application.
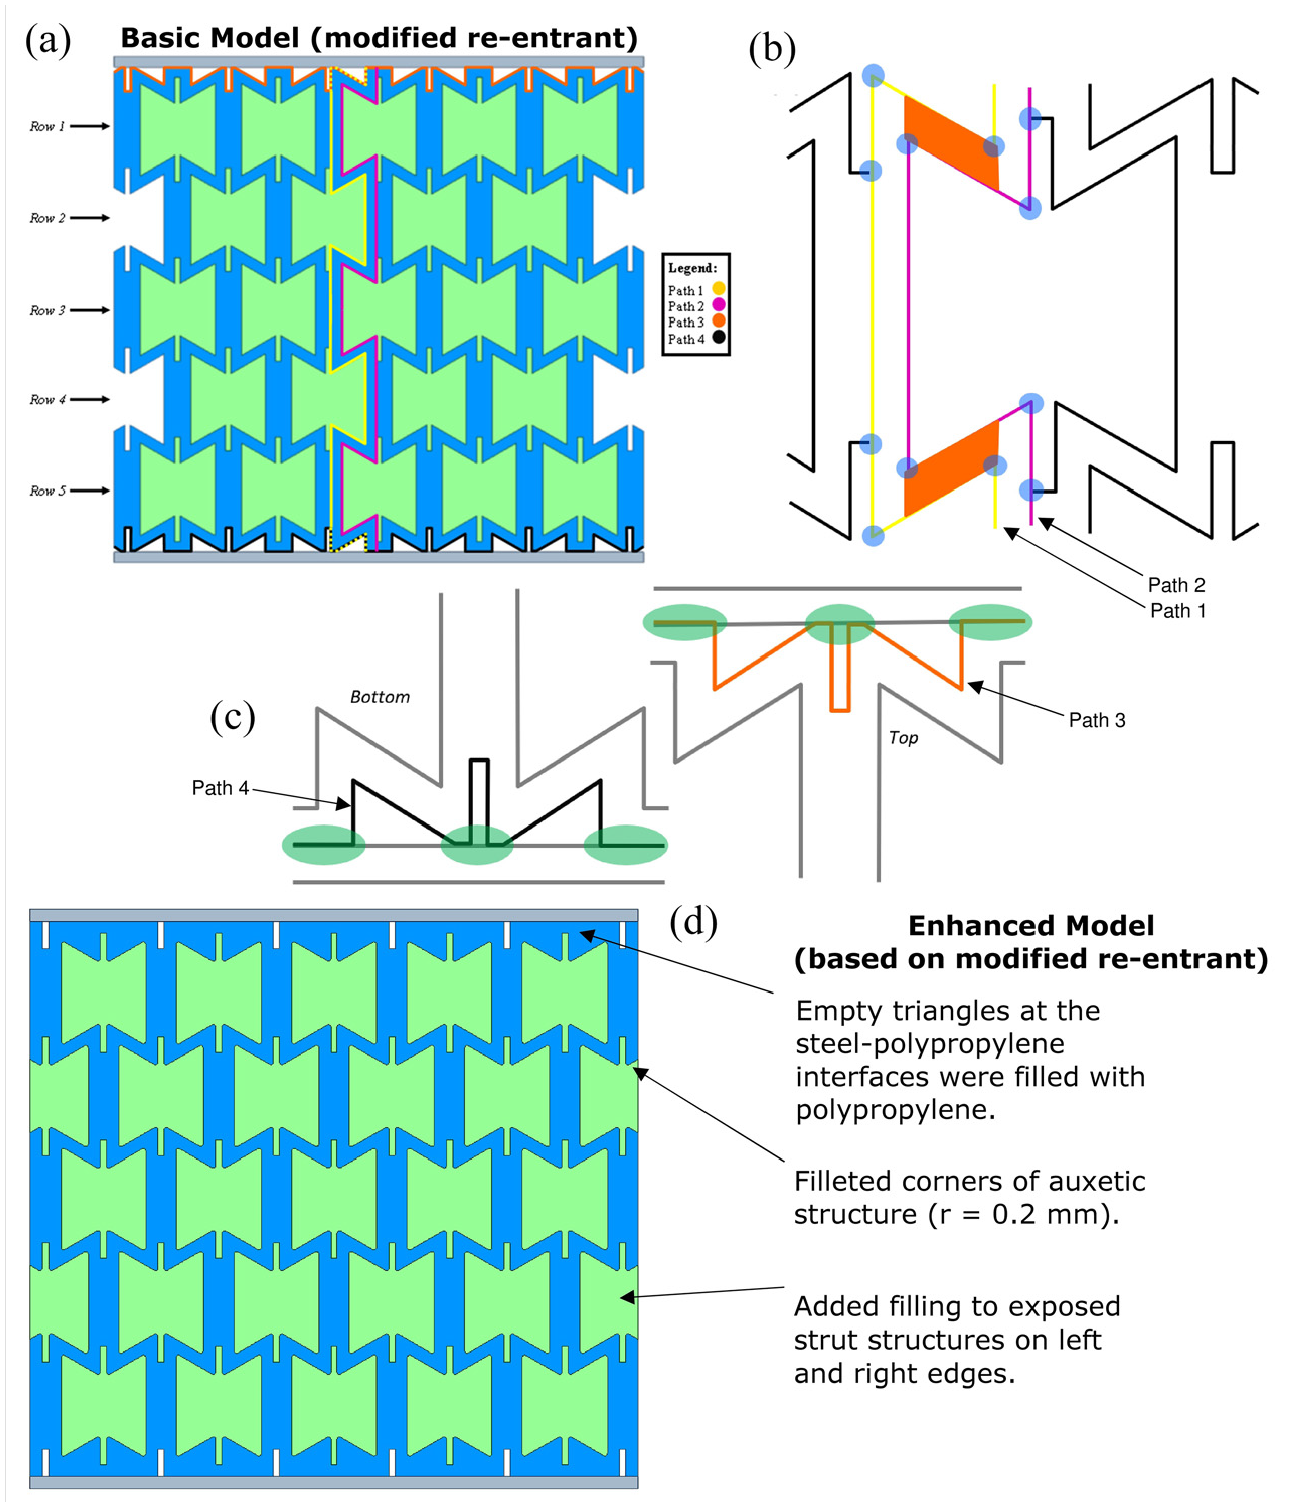
Modified re-entrant strut cell design: (a) basic model elevation with stress paths and row numbers, (b) basic model with analysis areas for paths 1 and 2, (c) basic model with analysis areas for paths 3 and 4 and (d) enhanced model (based on modified strut design) (note: empty triangles at the steel-polypropylene interfaces were filled with polypropylene, filleted corners of auxetic structure and added filling to exposed strut structures on left and right edges.
The purpose of the vertical paths (1 and 2) was primarily to analyse the shear stresses in the thin sections of the auxetic structure (orange zones in Figure 4(b)). This showed how the polypropylene structure reacted to the filling inserted and showed stress concentrations which occurred at the corners of the structure (blue zones in Figure 4(b)). The horizontal paths (3 and 4) found at the extreme top and bottom of the model were used to analyse the polypropylene at its interface with the steel plates (green zones in Figure 4(c)) as well as how the stresses differ through the depth of the model. In theory, the stress values at the bottom of the model should appear slightly higher than the top. The four stress paths measured two types of stress, principal and shear. This shows the stresses in the planar direction as well as the torsional direction, respectively. Principal stress analysis allowed the maximum normal stress to be found while shear stress analysis showed where slipping may occur near the yield point.
Enhanced model (based on modified re-entrant strut cell design)
From the analysis of the basic model a few problems arose. To solve these issues a new model (called as enhanced model but based on modified re-entrant strut cell design) was made with same material configurations. The changes were as follows (Figure 4(d)): (a) empty triangles at the steel-polypropylene interfaces were filled with polypropylene, (b) filleted corners of auxetic structure (
Stresses after filling of modified re-entrant strut design cells
This section shows the stress distribution (normalised) through the core as the auxetic cells were filled with different materials one row at a time. The upper and lower yield lines on the following figures were put in place so that when they are crossed it is easy to identify. When the maximum principal stress exceeds the yield strength, hence being more than 1 or less than −1, the structure will fail.
It was clear from the Figure 5(a) that the structure would fail. This was due to six of the probe stresses clearly going below the lower yield line. The figure also showed that the first and last probes were in tension whereas the other eight are in compression. It was shown in Figure 5(b) that from filling the top row fully with PVC foam that the stresses at the first three probes had been reduced. Hence it proved that from adding filler to the row nearest the impact, the stresses nearest the top plate lower. Figure 5(c) showed a further reduction in stress in the probes which were local to the filled cells. With three rows now filled, Figure 5(d) showed that only two stress probes exceeded either yield line. Figure 5(e) revealed the model to not fail. All stress probes had been decreased sufficiently. When all the rows were filled with PVC, Figure 5(f), maximum principal stress over yield stress for five rows of PVC filled cells clearly showed that minimum stress is experienced at all the probes.
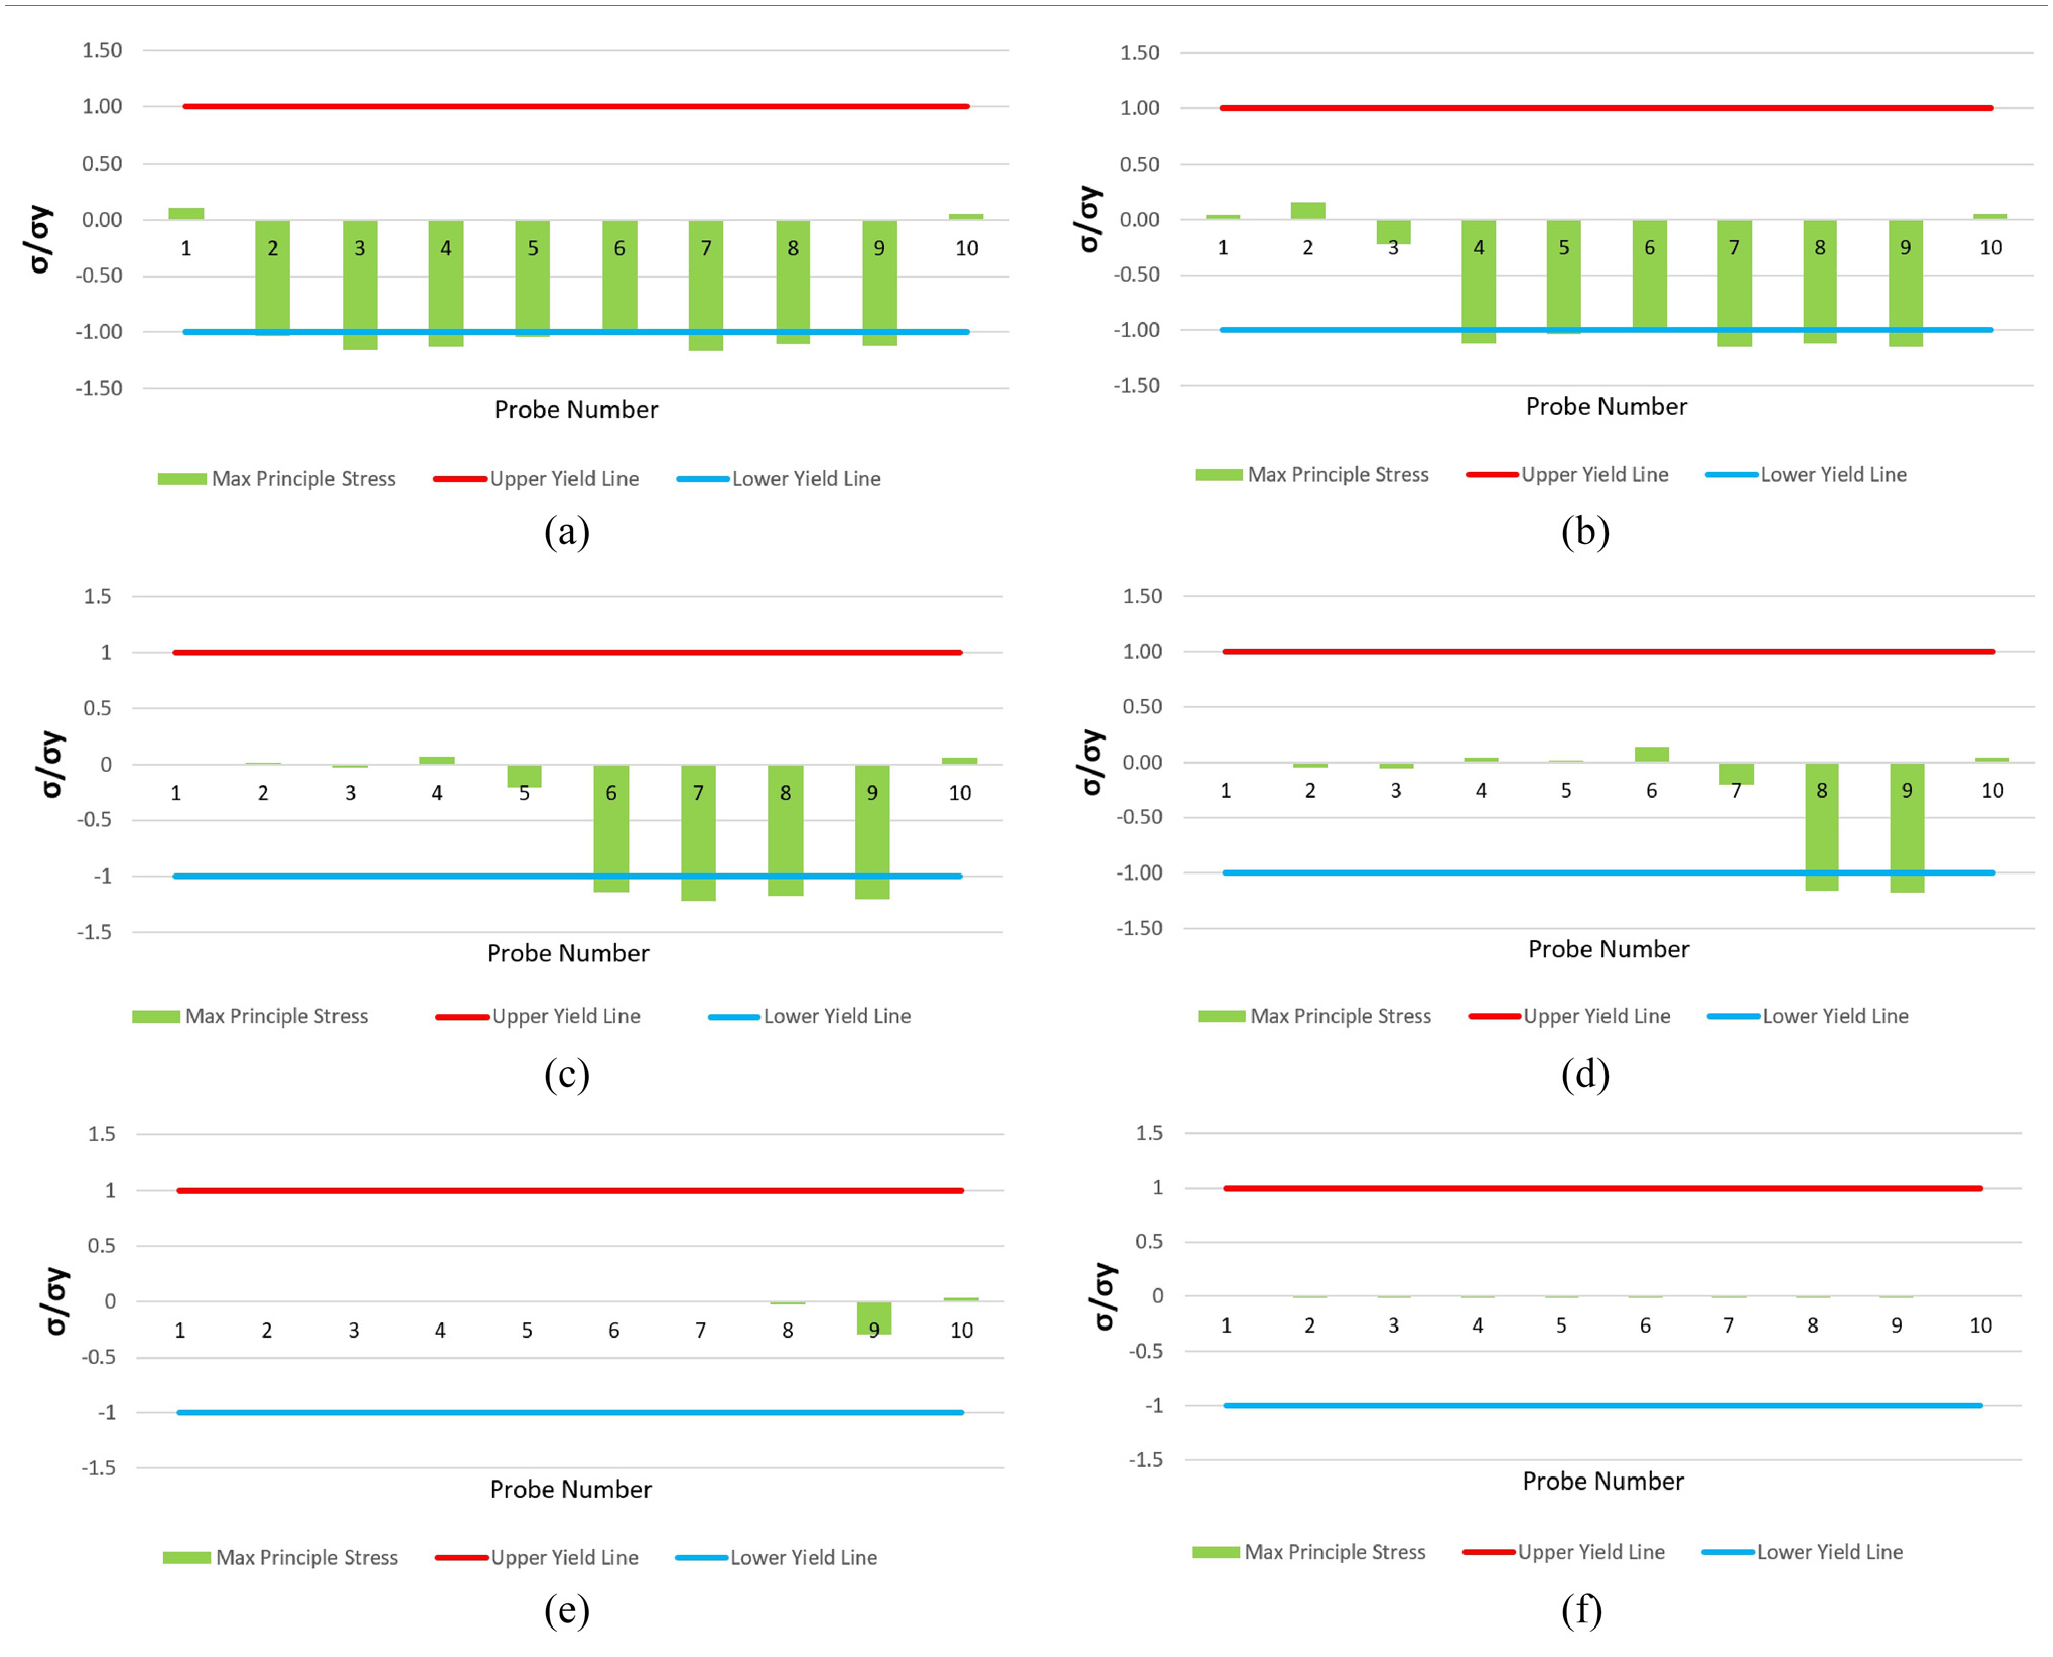
Normalised stress (modified re-entrant strut cell design): (a) for no filling of cells, (b) for top one row of PVC filled cells, (c) for top two rows of PVC filled cells, (d) for top three rows of PVC filled cells, (e) for top four rows of PVC filled cells and (f) for all five rows of PVC filled cells.
Stress path results (basic model: modified re-entrant strut cell design)
Figure 6 shows normalised stress path (paths 1–4) for basic model (modified re-entrant strut cell design) with no filling. Figure 7 shows normalised stress path (paths 1–4) for basic model (modified re-entrant strut cell design) with PVC (rows 1–4), and silly putty (row 5 only). Figure 8 shows normalised stress path (paths 1–4) for basic model (modified re-entrant strut cell design) with PVC (rows 1–5).
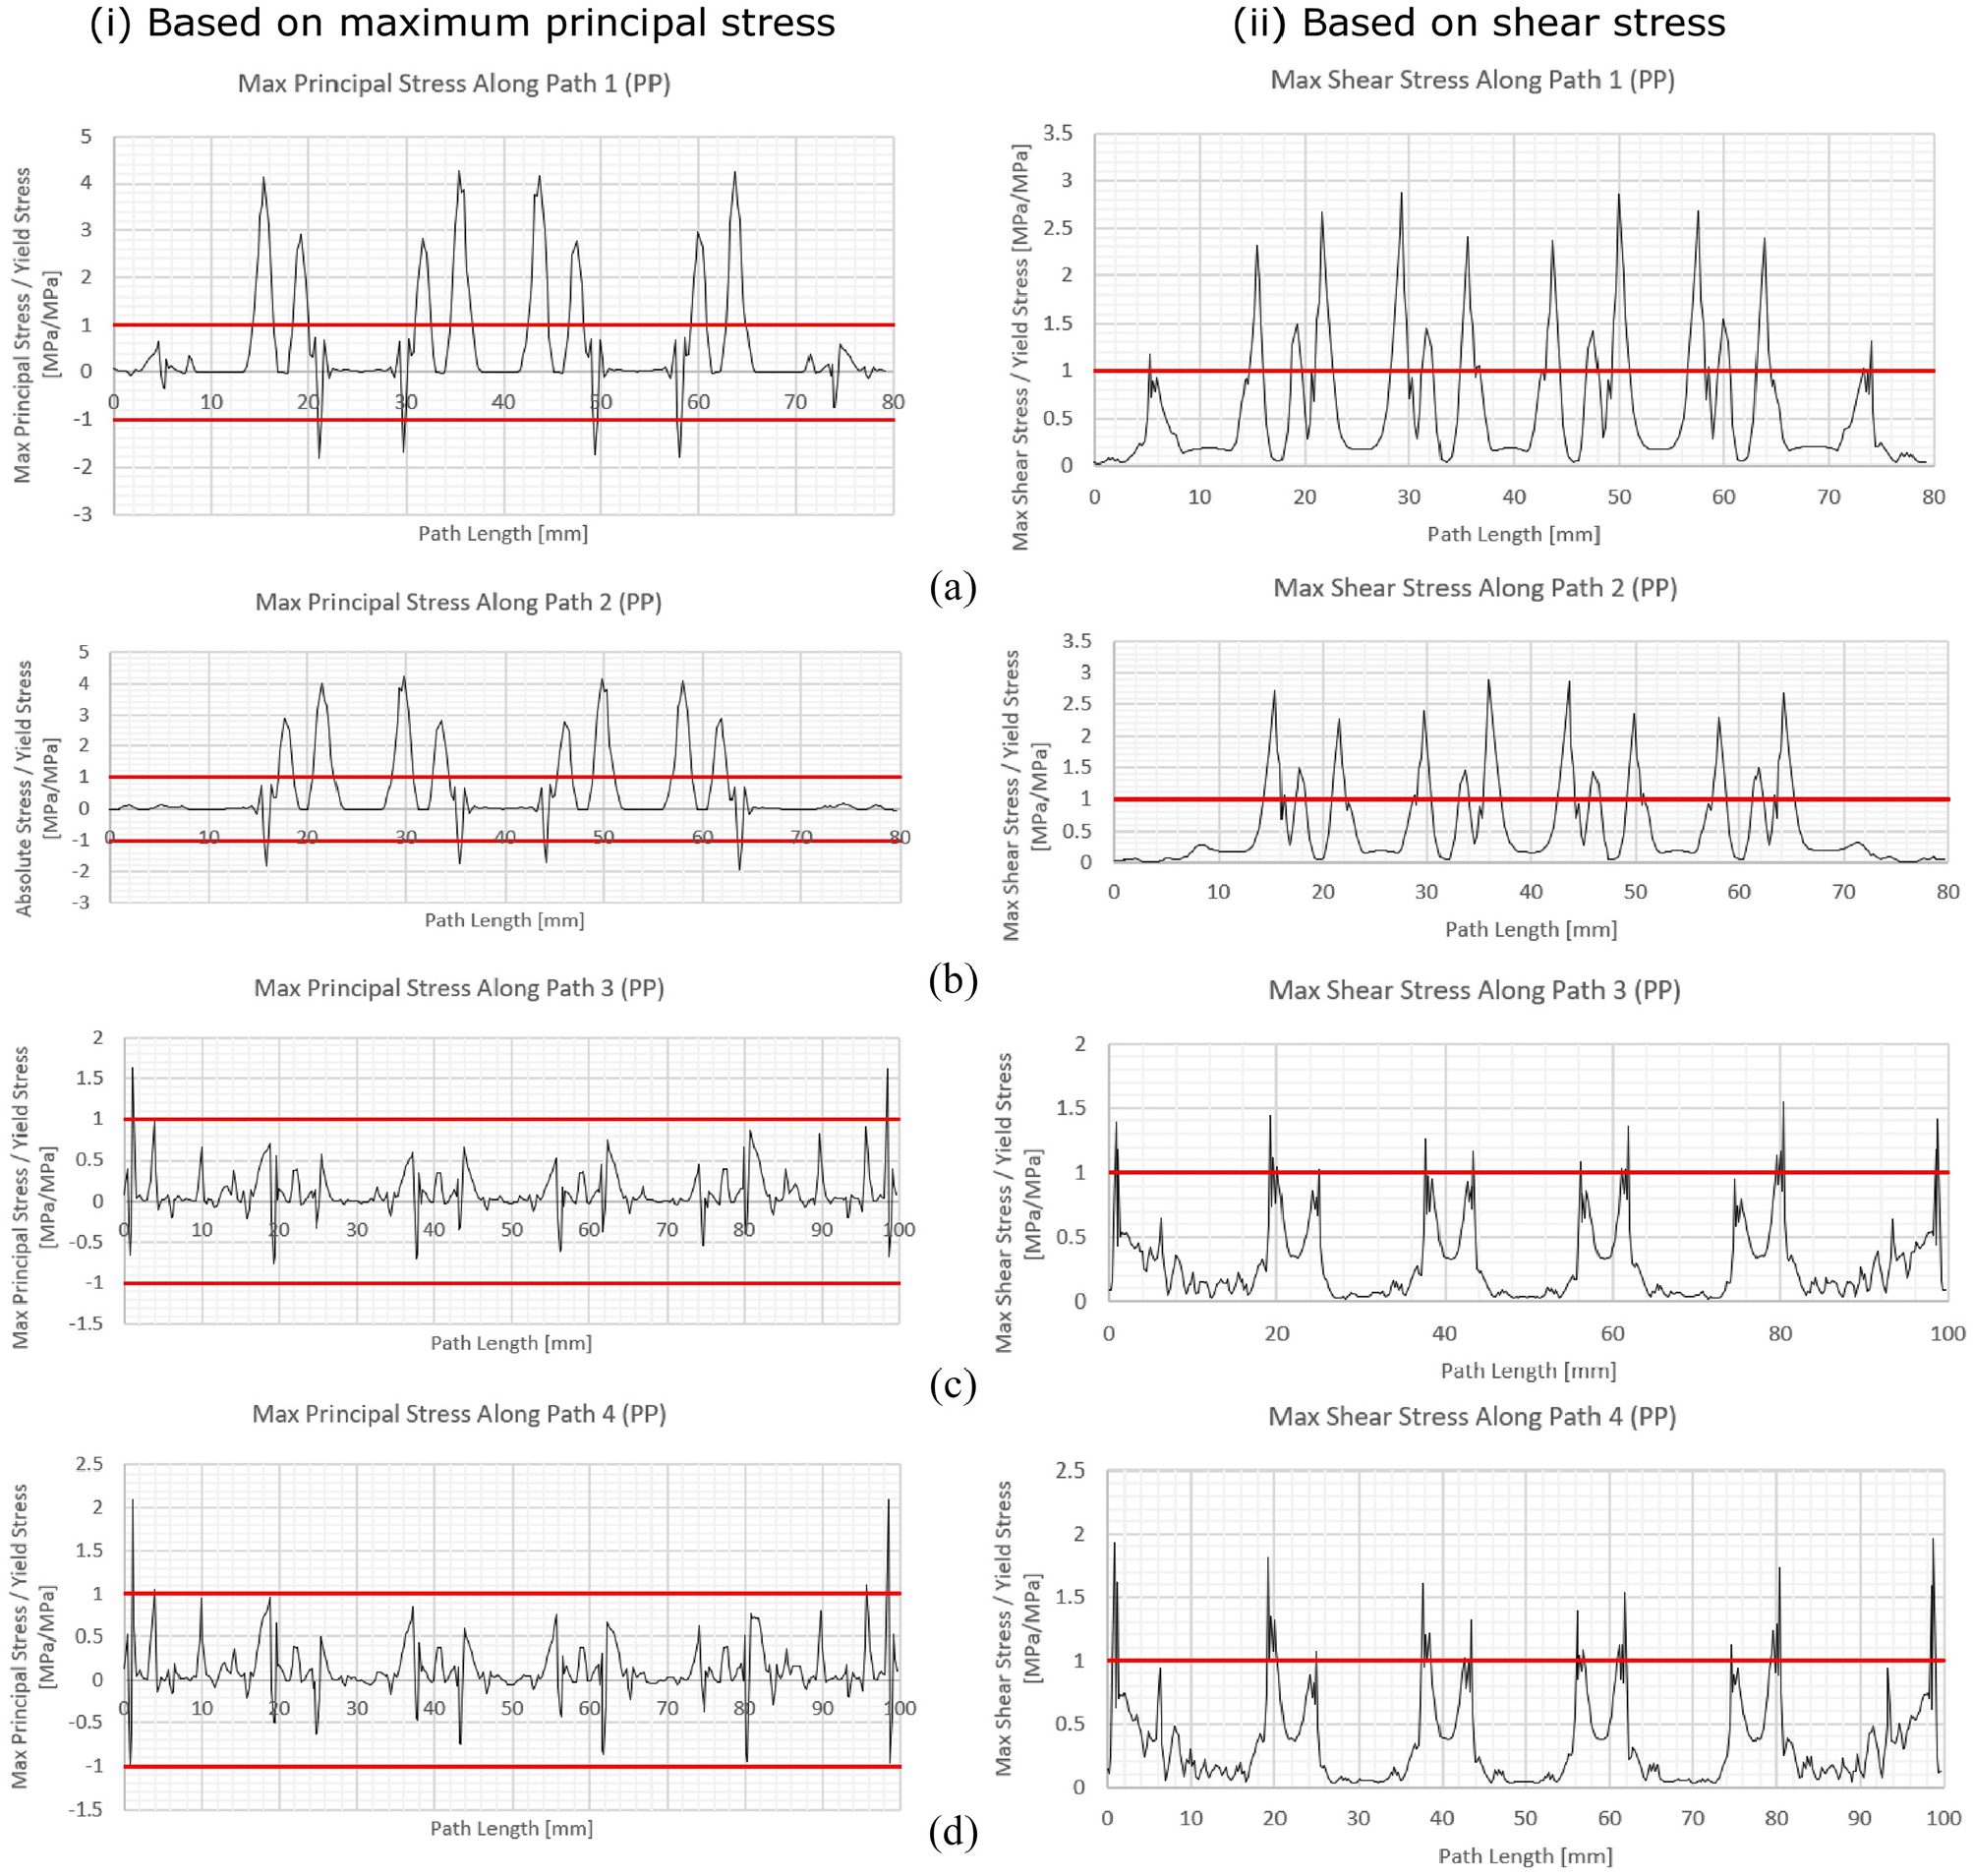
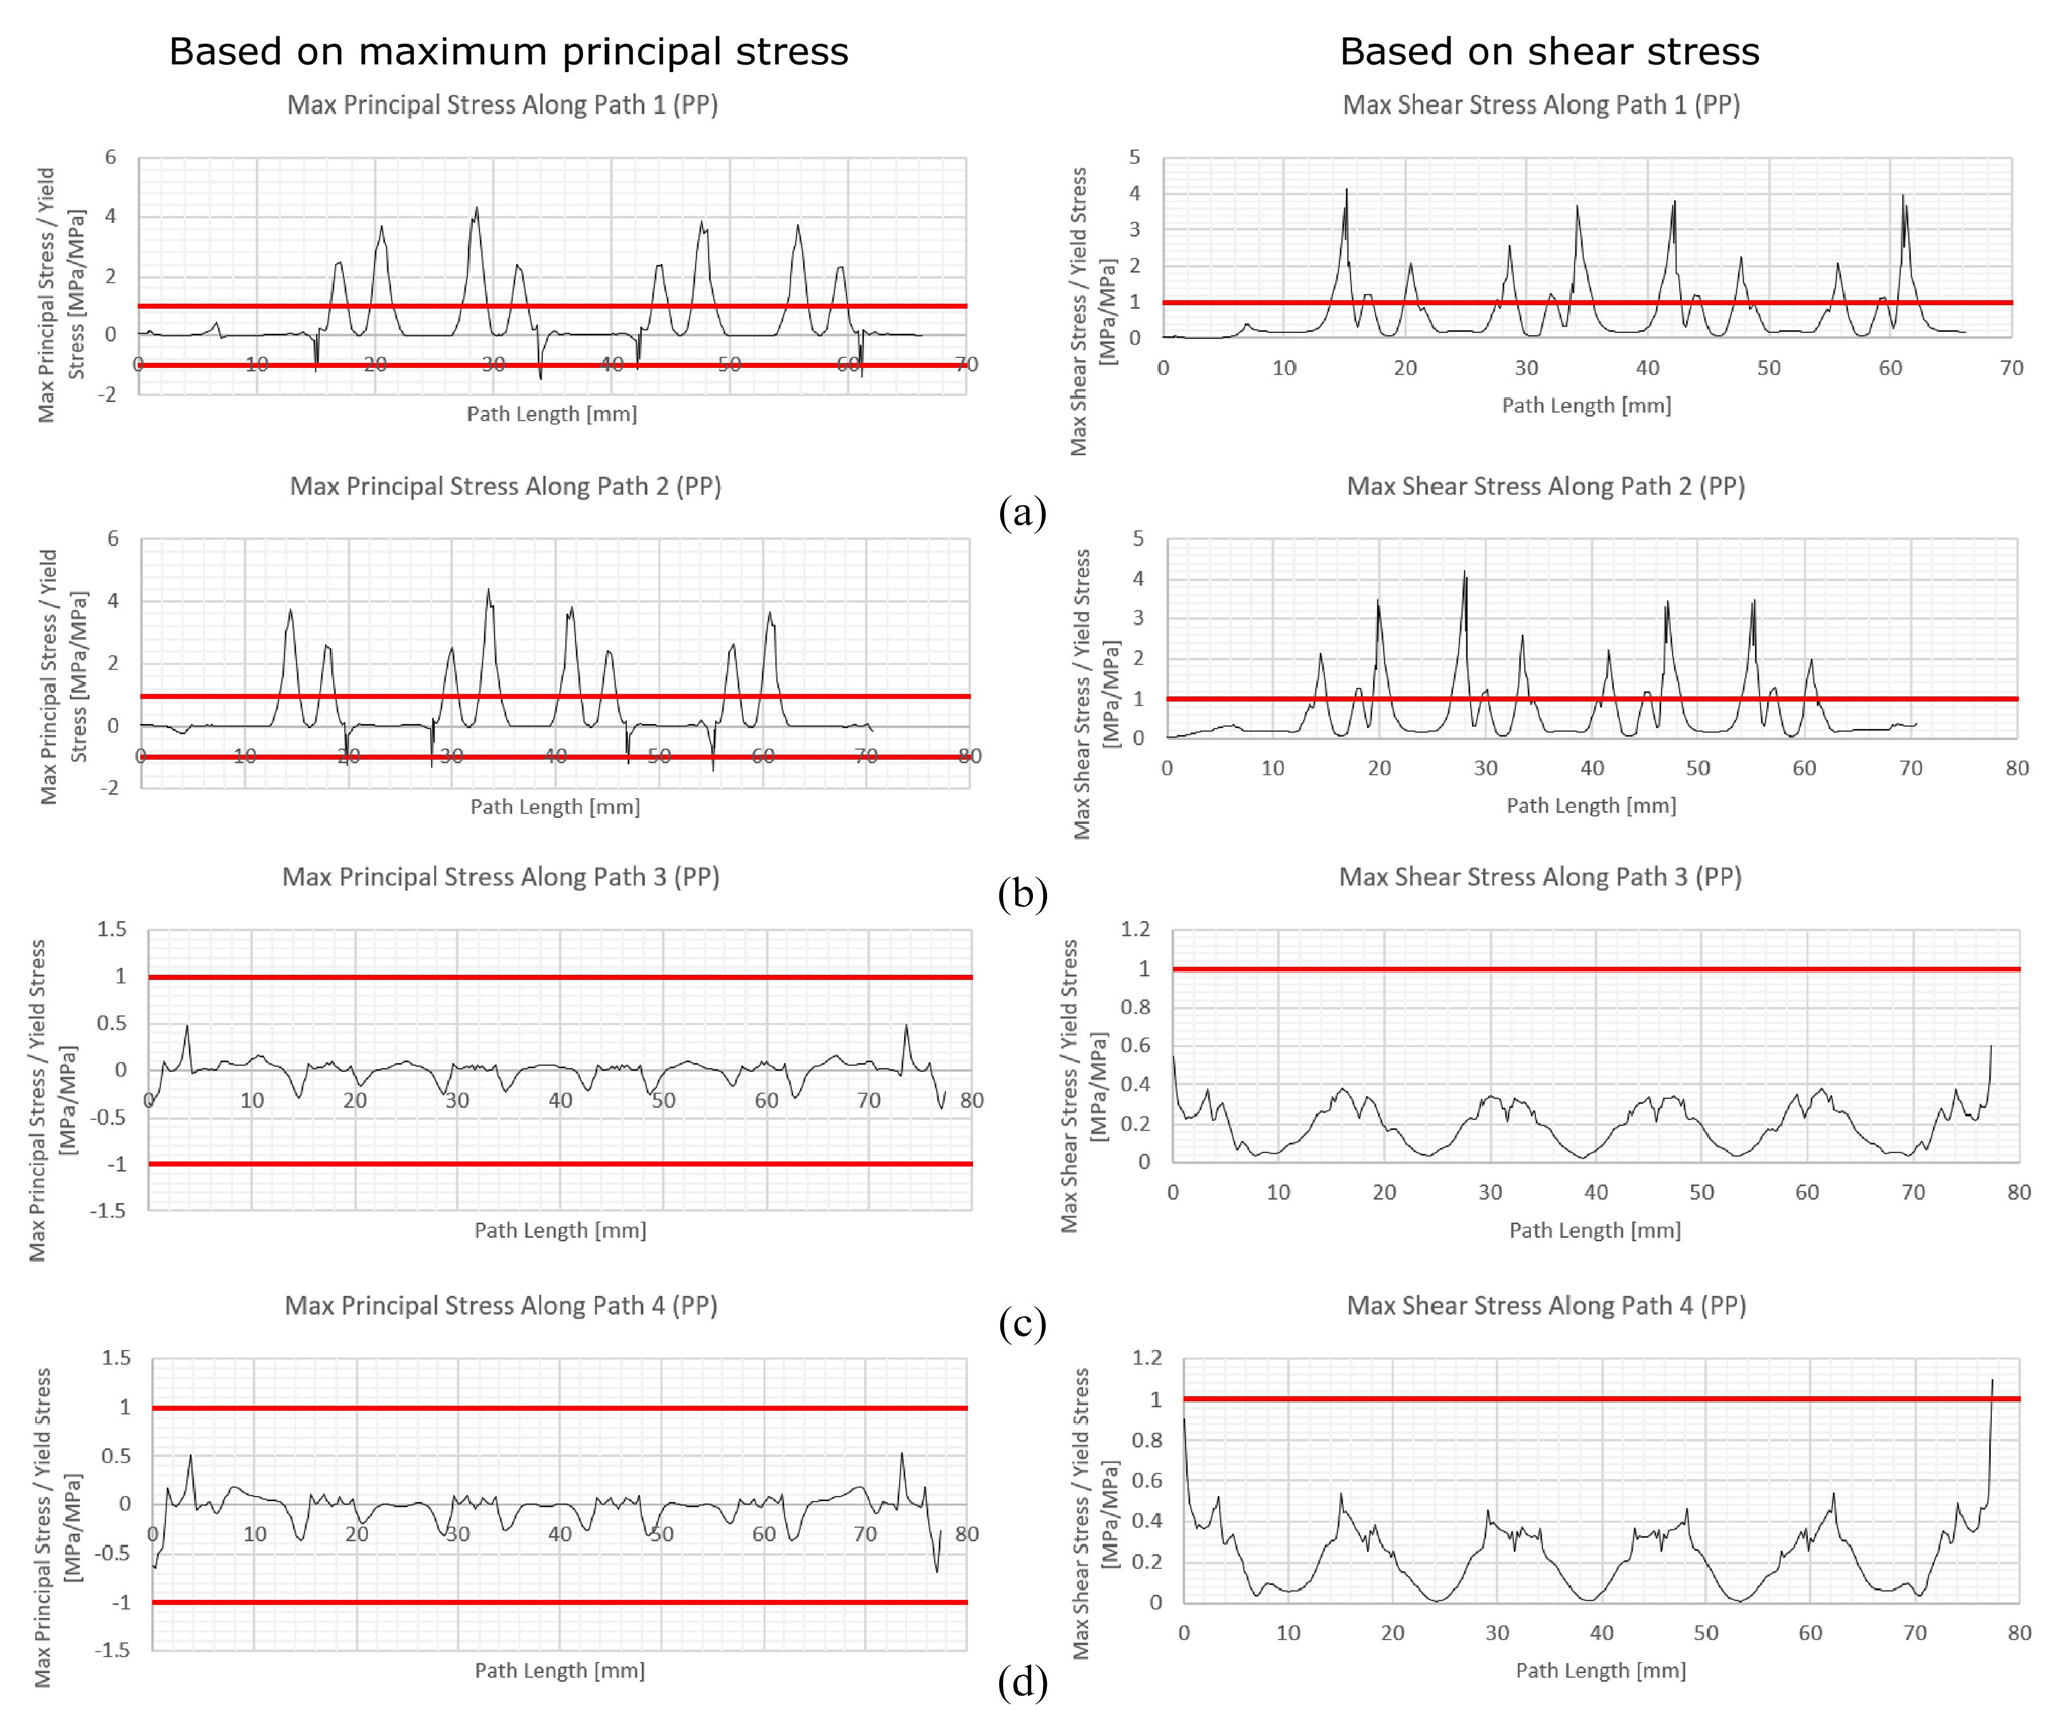
Normalised stresses for basic model (modified re-entrant strut cell design) with no filling: (a) path 1, (b) path 2, (c) path 3 and (d) path 4.
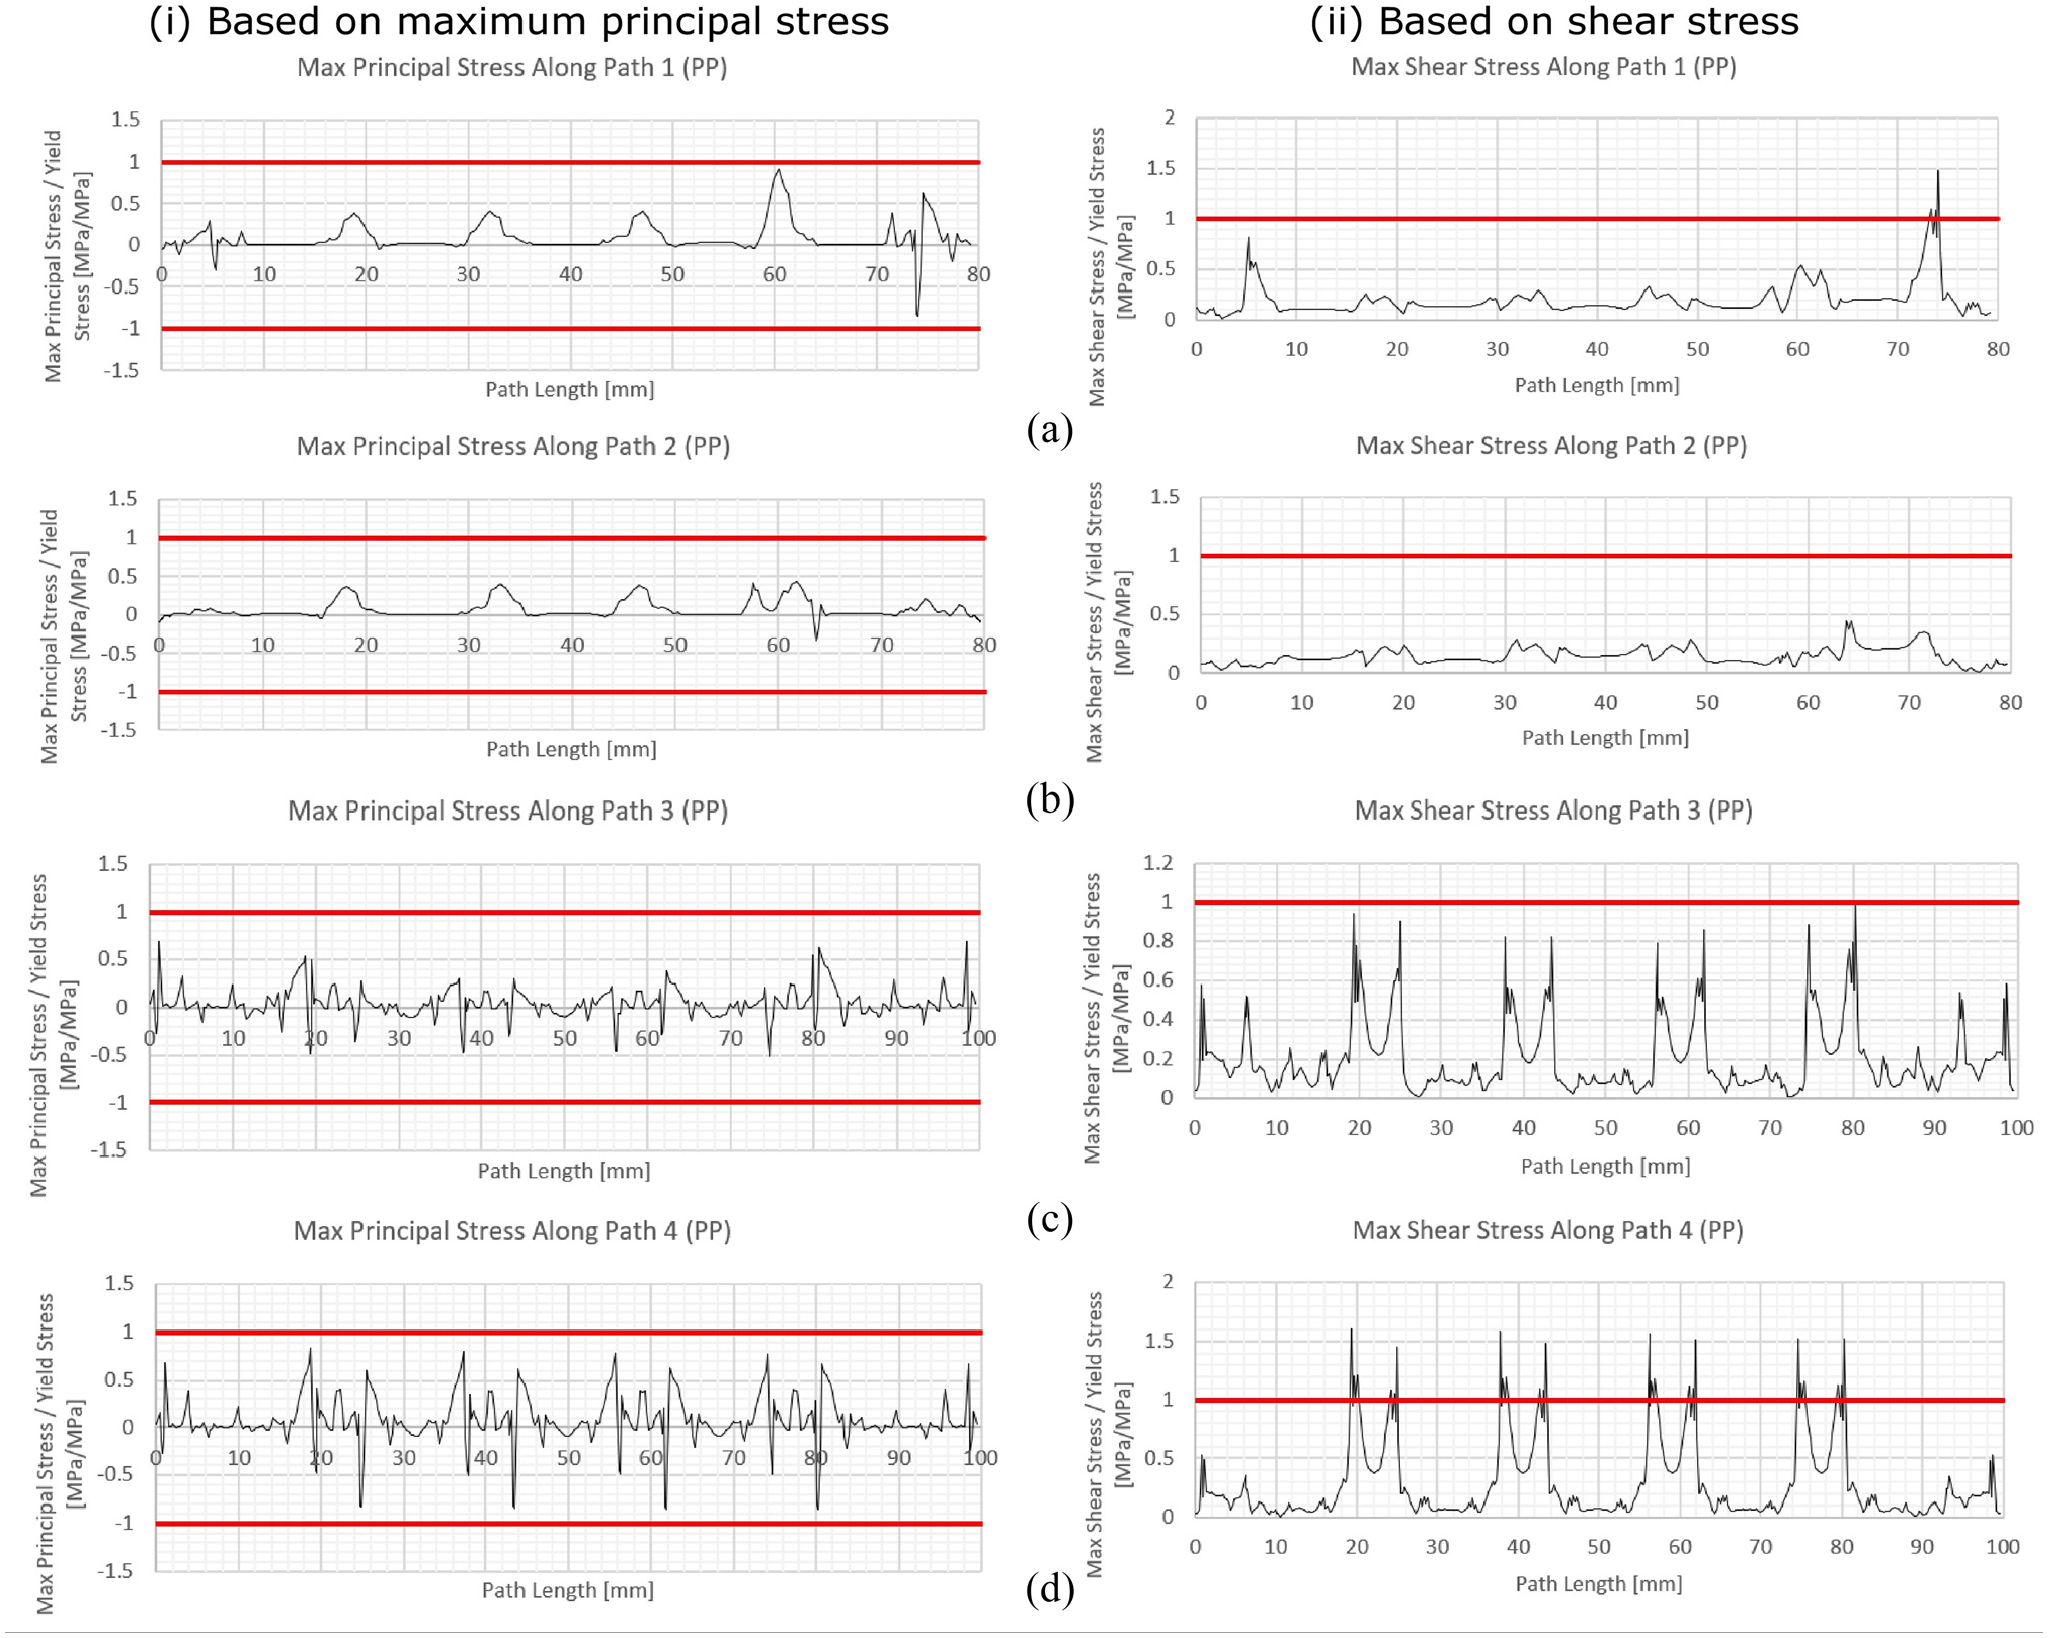
Normalised stresses for basic model (modified re-entrant strut cell design) with PVC (rows 1–4), silly putty (row 5):(a) path 1, (b) path 2, (c) path 3 and (d) path 4.
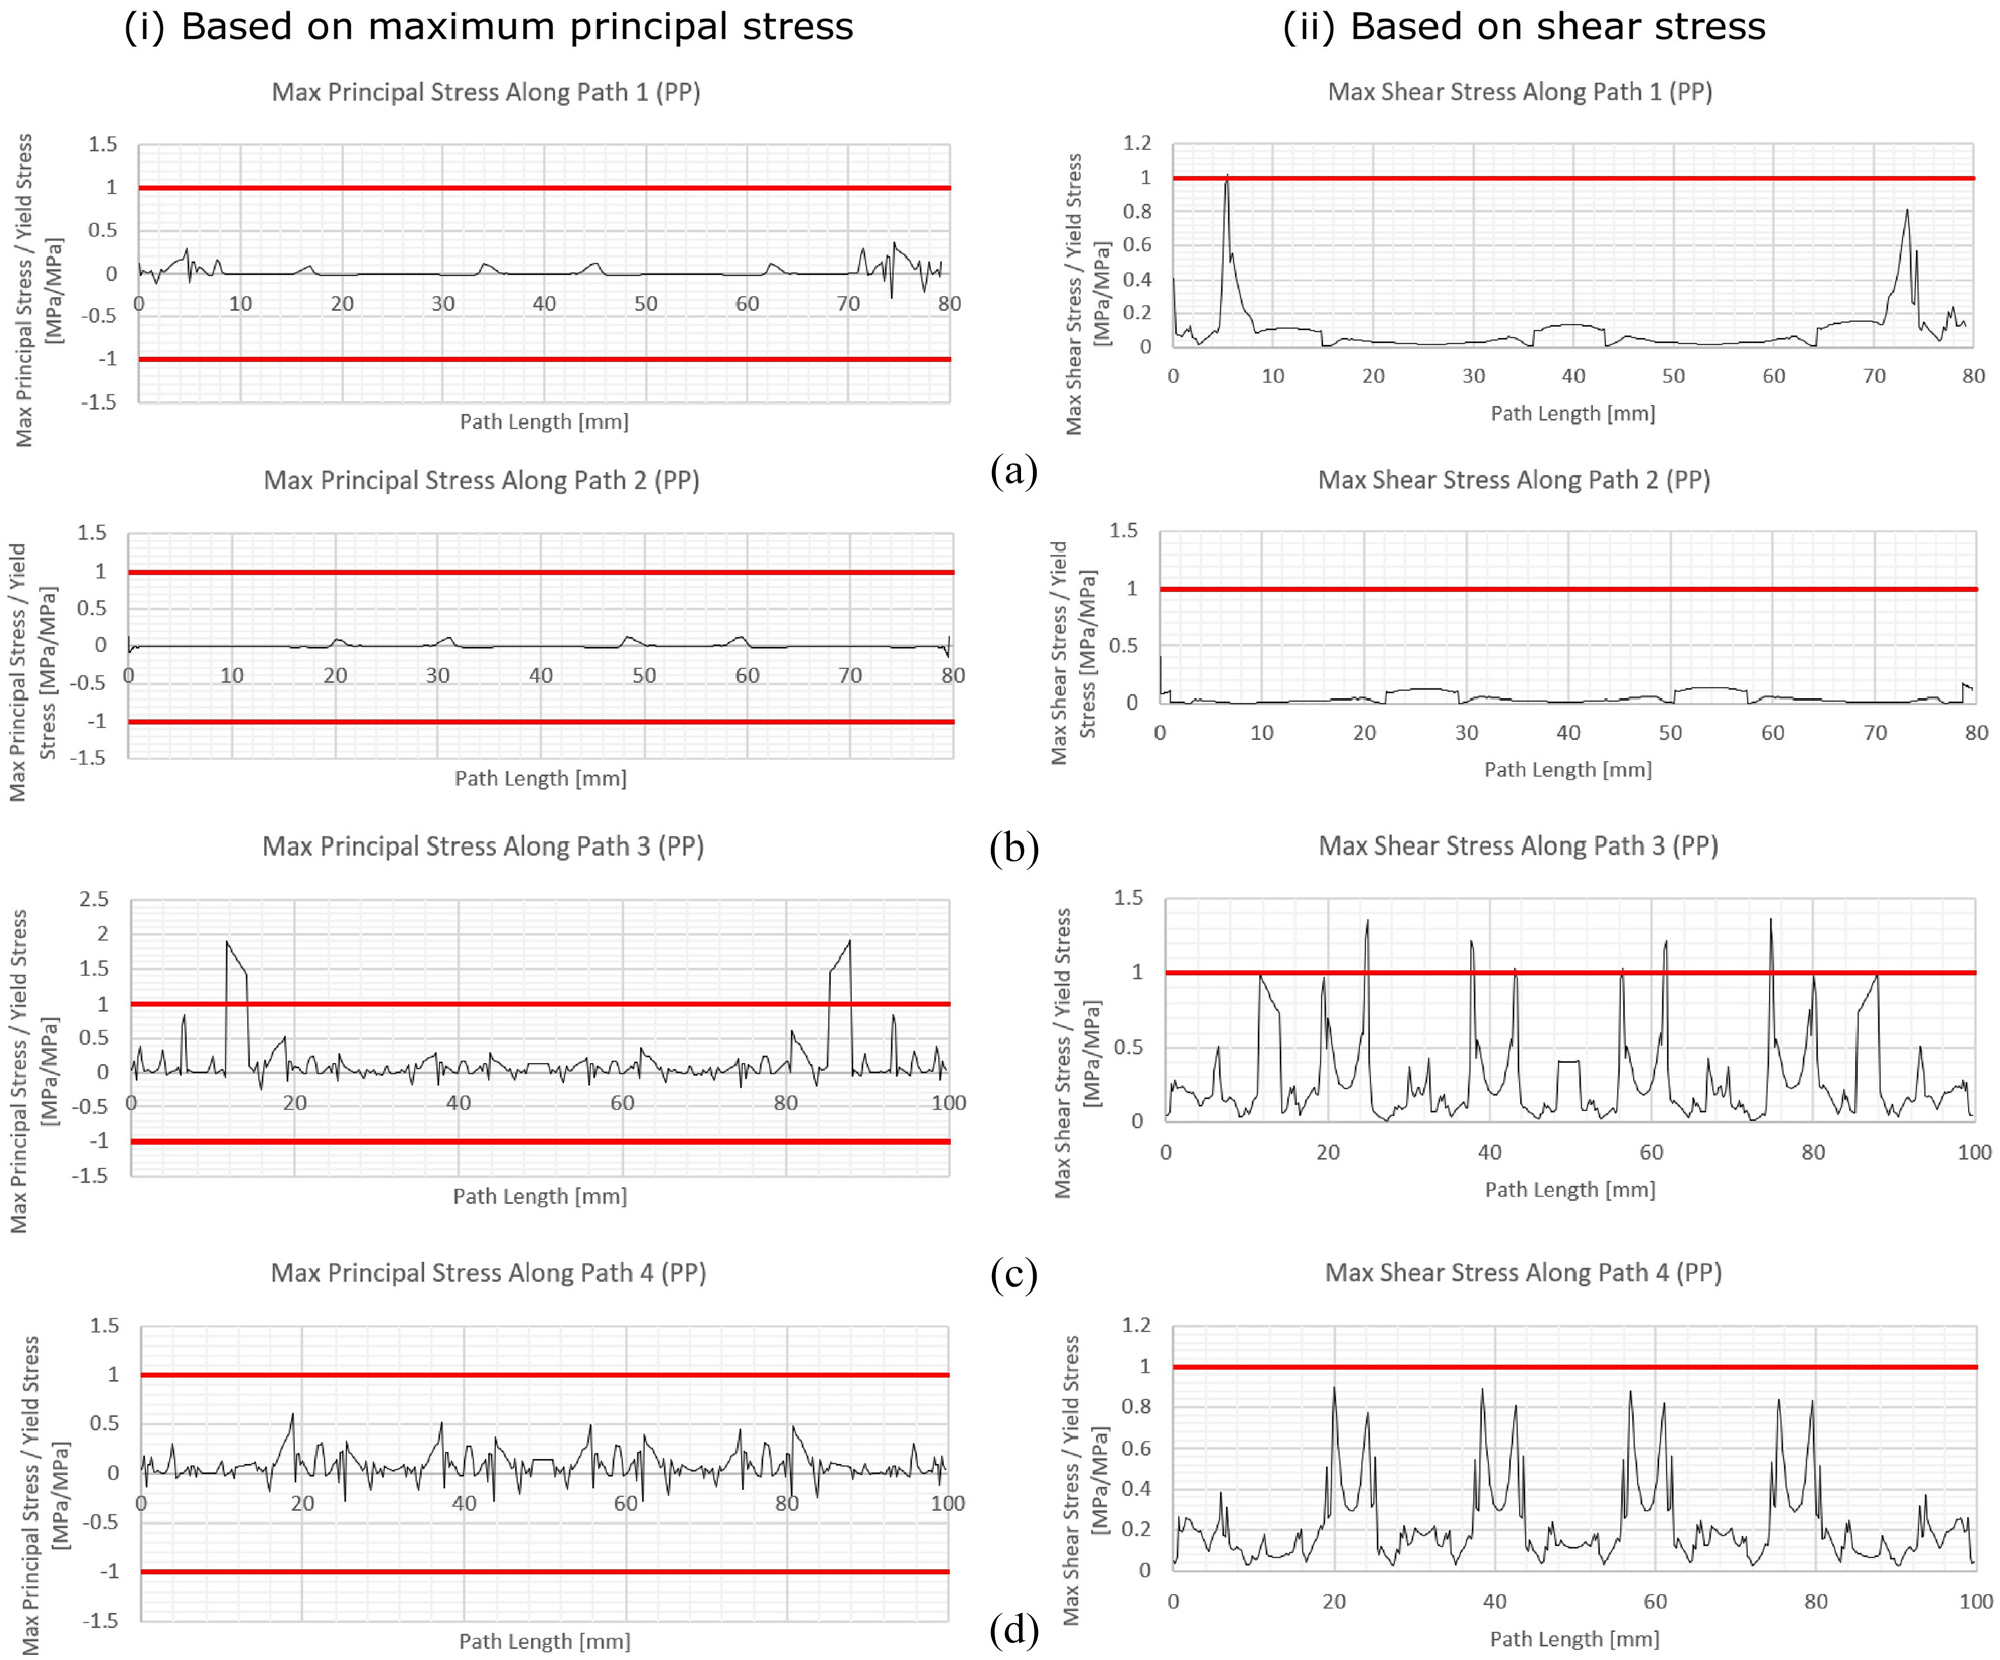
Normalised stresses for basic model (modified re-entrant strut cell design) with PVC (rows 1–5): (a) path 1, (b) path 2,(c) path 3 and (d) path 4.
Stress path results (enhanced model: based on modified re-entrant strut cell design)
Figure 9 shows normalised stress path (paths 1–4) for enhanced model (based on modified re-entrant strut cell design) with no filling. Figure 10 shows normalised stress path (paths 1–4) for enhanced model (based on modified re-entrant strut cell design) with PVC (rows 1–4), and silly putty (row 5 only). Figure 11 shows normalised stress path (paths 1–4) for enhanced model (based on modified re-entrant strut cell design) with PVC (rows 1–5).
Normalised stresses for enhanced model (based on modified re-entrant strut cell design) with no filling: (a) path 1,(b) path 2, (c) path 3 and (d) path 4.
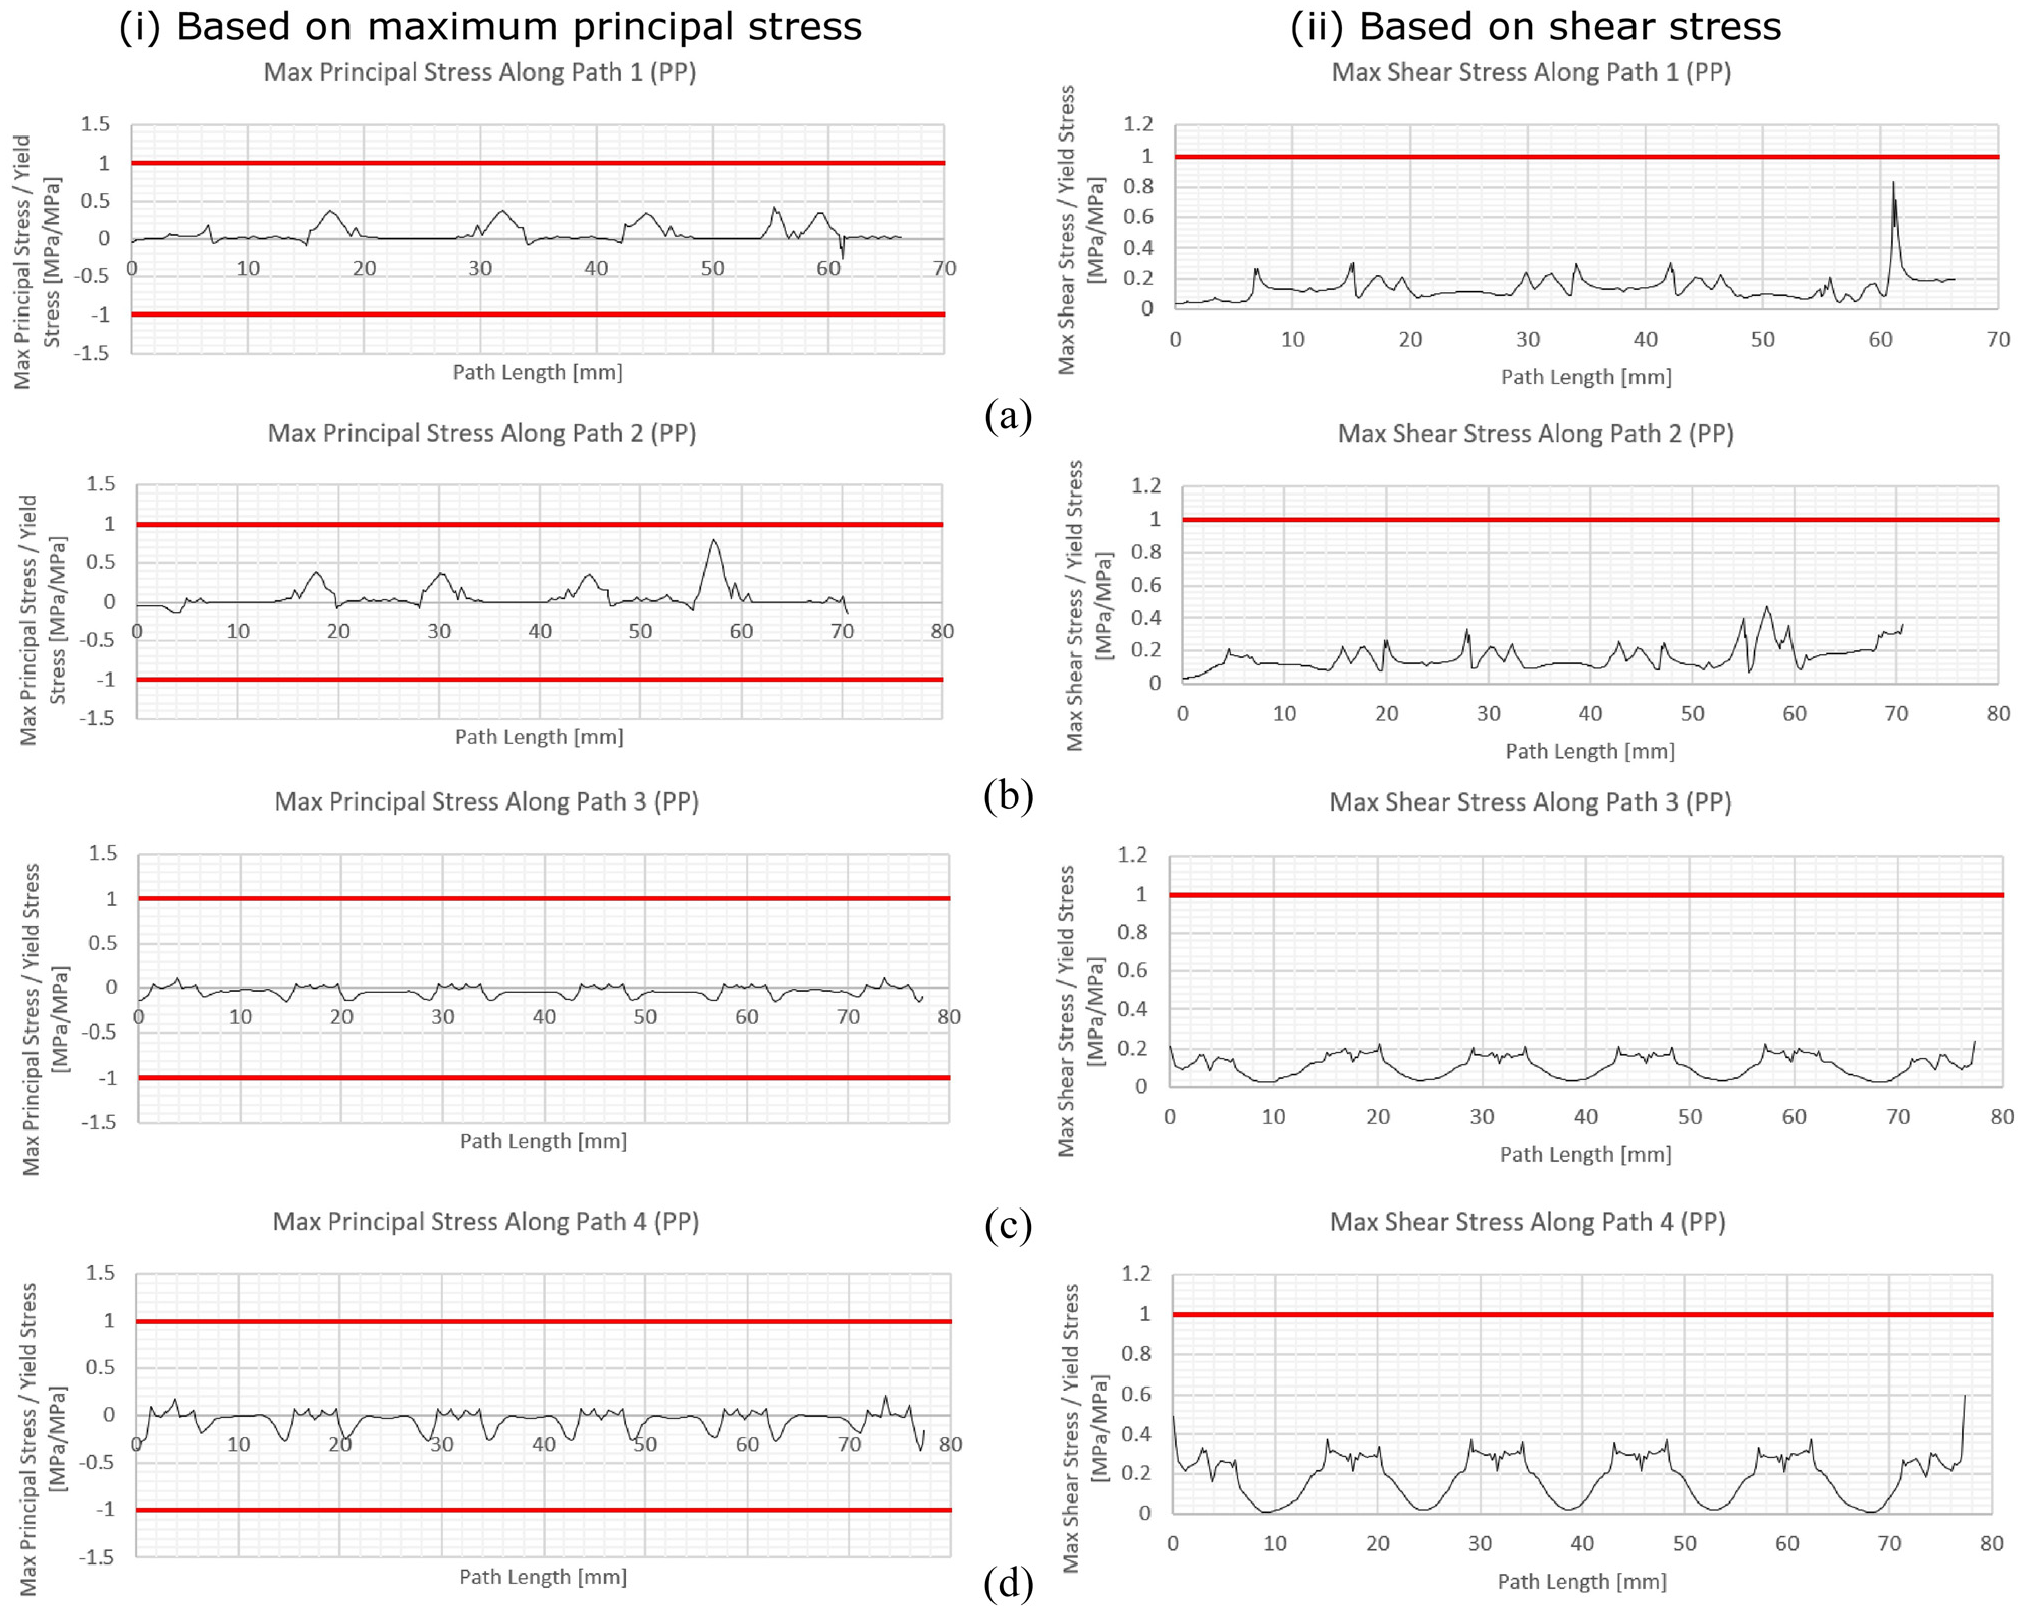
Normalised stresses for enhanced model (based on modified re-entrant strut cell design) with PVC (rows 1–4), silly putty (row 5): (a) path 1, (b) path 2, (c) path 3 and (d) path 4.
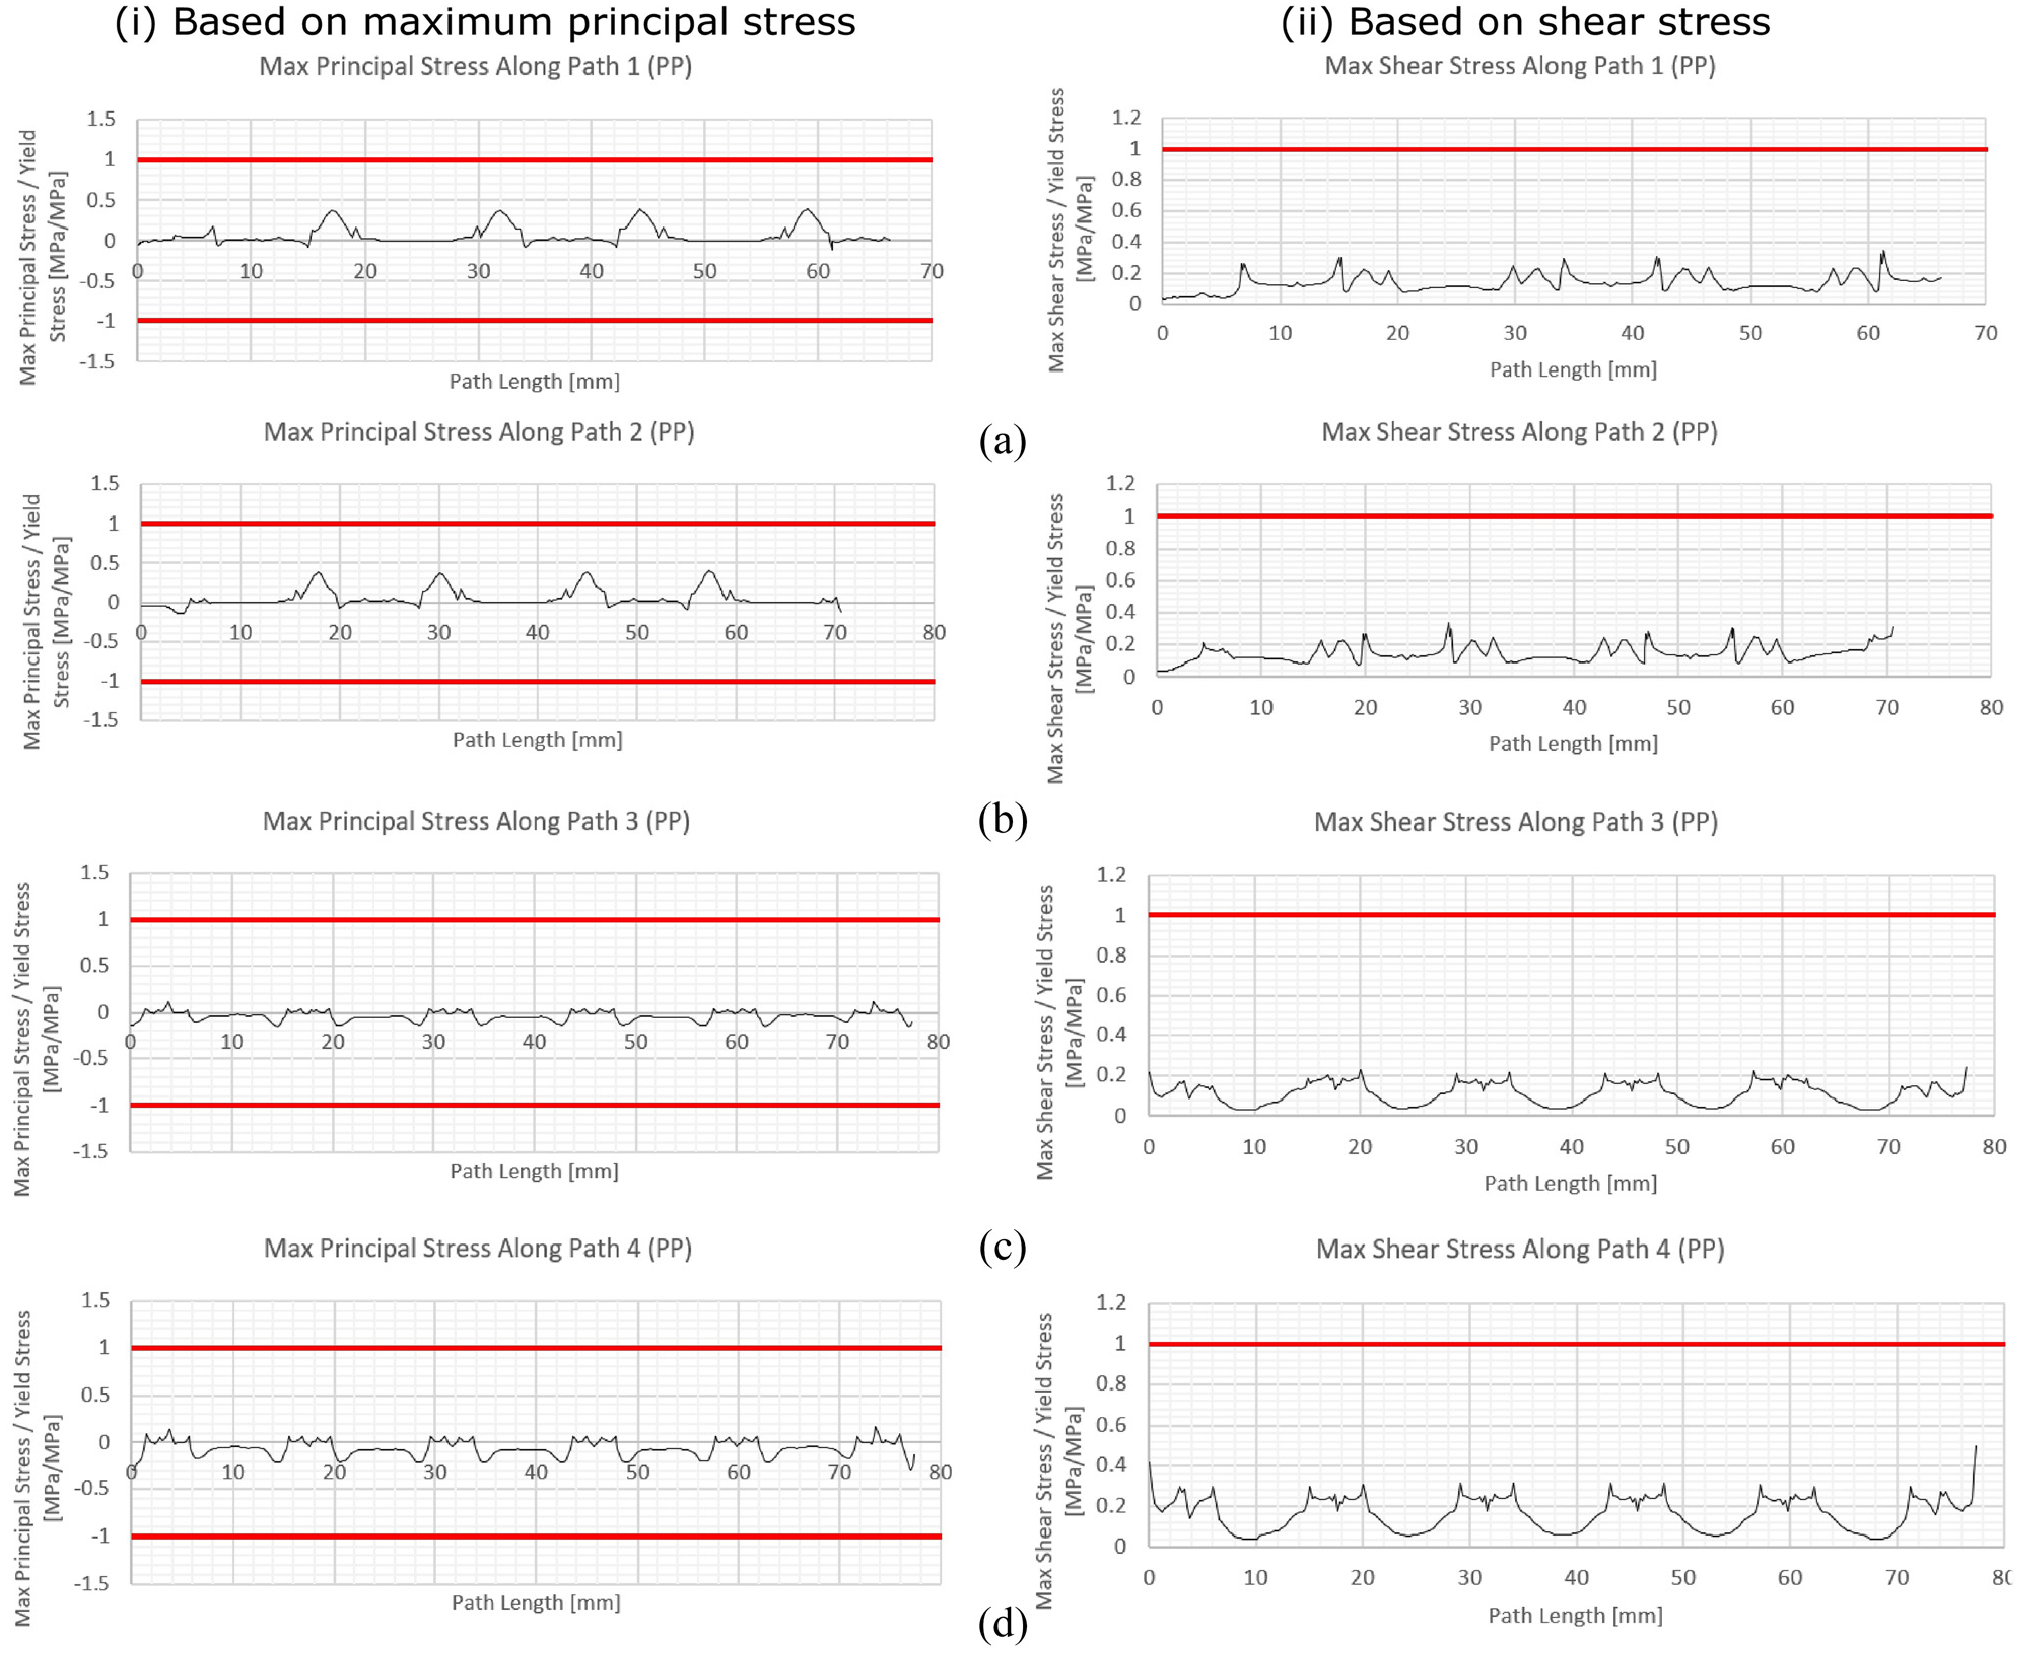
Normalised stresses for enhanced model (based on modified re-entrant strut cell design) with PVC (rows 1–5): (a) path 1, (b) path 2, (c) path 3 and (d) path 4.
Effect of filling materials and energy absorbance (enhanced model)
To see the effect of increase in Young’s modulus of the filling materials, the energy absorbance (EA) was carried out for a final analysis of the enhanced model (i.e. based on modified re-entrant strut cell design): the energy absorbance for the non-filled cells; cells filled with silly putty; and cells filled with PVC foam was carried out. In ANSYS, a ‘time-step’ was applied to the force. The force was applied in the y-direction in 11 increments of −1 kN, until the full compressive load of −11 kN was applied. The total deformation was taken from ANSYS over the 11-time steps. The energy absorbance of the structure was calculated by finding the area under the load-displacement graph which was the formula used to calculate the energy absorbance in the paper by Mohsenizadeh et al. 11
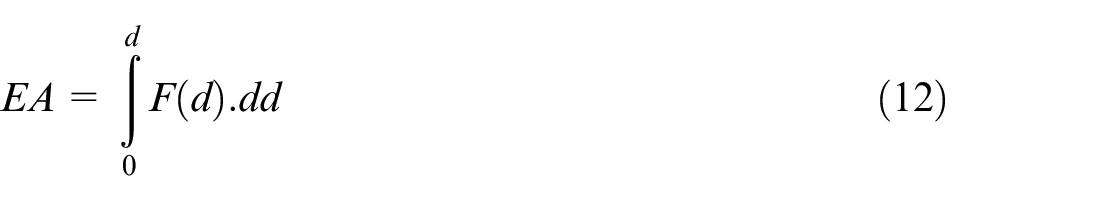
where

The gradient of the line which, denoted in equation (12) as F, had the units Newton per metre, (N/m). The displacement, d, of the structure had the units of metres, m. Integrating the units of the load-displacement curve showed:
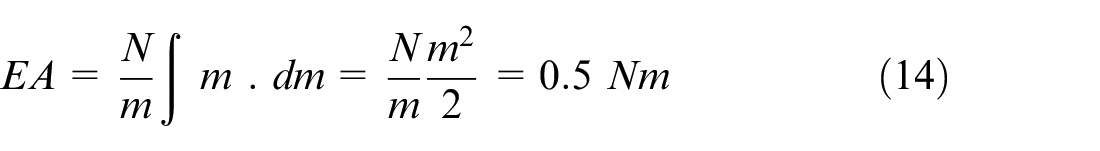
The units for energy are Joules (a Joule was defined as the amount of energy exerted when a force of 1 N is applied over a displacement of 1 m).
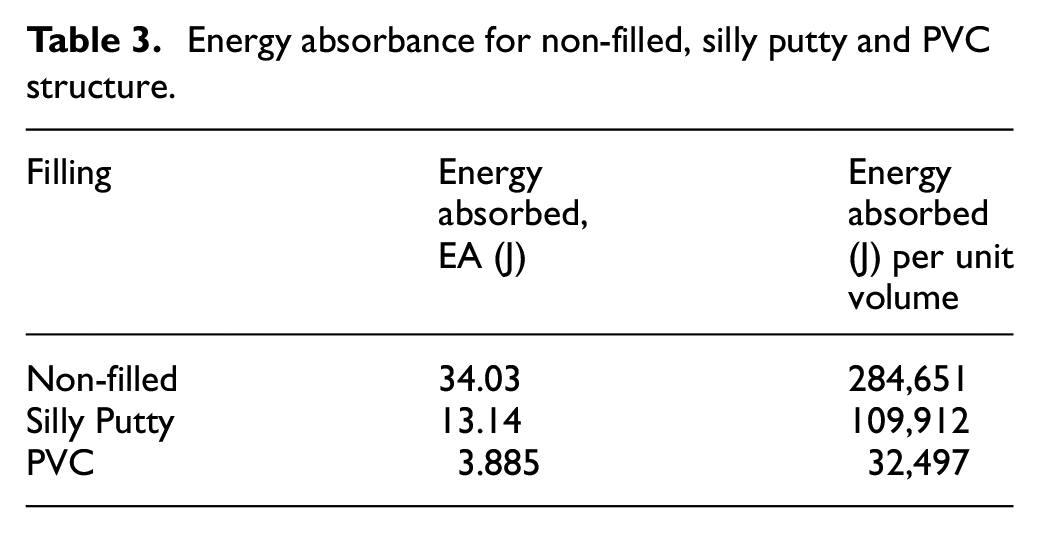
From finite element analysis, the total deformation of the non-filled structure, silly putty filled structure and the structure filled with PVC against the respective force applied, can be seen in Figure 12. From results, the non-filled structure had the greatest deformation at 11 kN of 6.73 mm and the PVC filled structure having the lowest deformation at 0.706 mm. The energy absorbed (Joule, J) by the structure was found by integrating the area under the load-displacement curve (Figure 12) and values of which calculated in Table 3. The energy was divided by the volume of the structure to calculate the energy absorbance of the structure per cubic metre. To find the energy absorbed per cubic metre, the energy was divided by the volume of the structure which was 1.196 × 10⁻⁴ m3. The volume for the non-filled structure was the same as that of the filled structure as the air inside the auxetic structure. These energy values can be obtained from Table 3. The non-filled structure had the greatest energy absorbance and energy absorbance per unit volume, whereas for PVC had the smallest energy absorbance and energy absorbance per unit volume.
Energy absorbance for non-filled, silly putty and PVC structure.
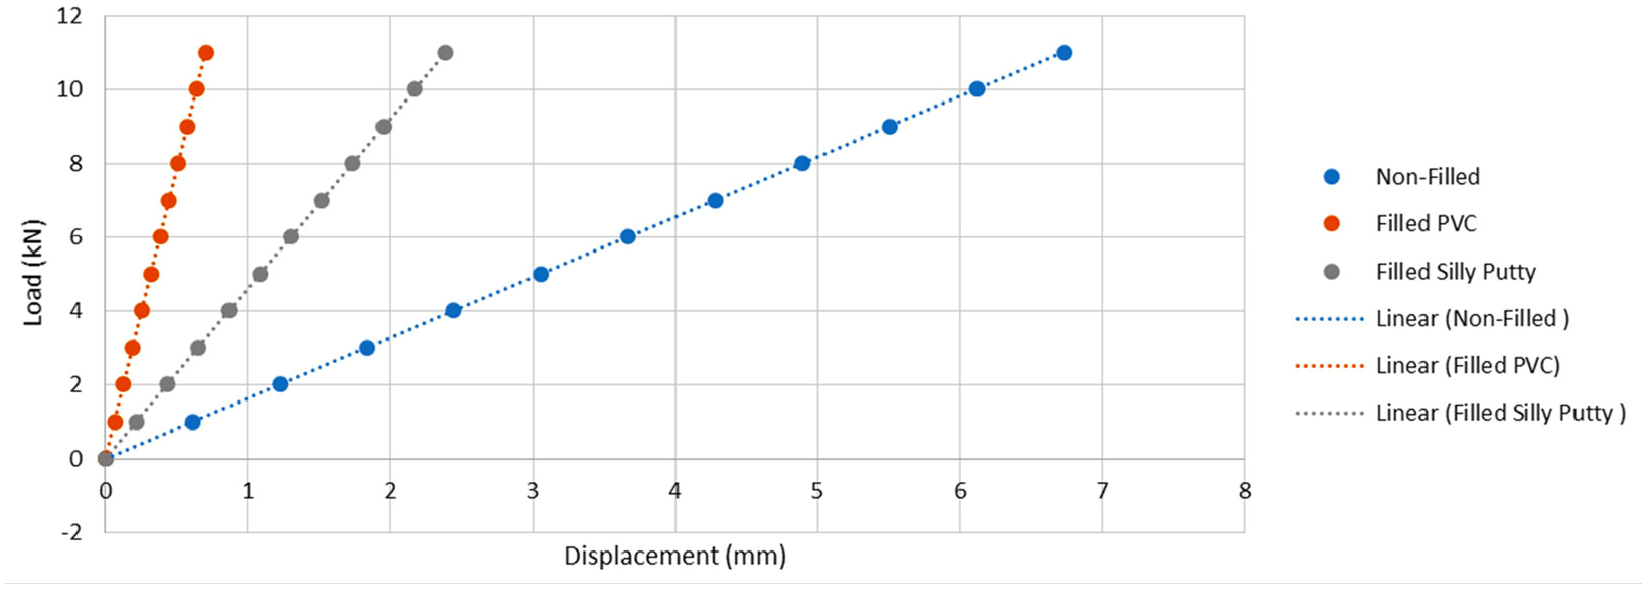
Load-displacement curve (based on finite element method) (enhanced model based on modified re-entrant strut cell design), showing the effect of Young’s modulus of the filling material.
Discussion
Filling of basic model (modified re-entrant strut design) cells
When none of the cells within the auxetic core are filled as seen in Figure 3(a), the lower yield line was crossed seven times out of the ten probed points for readings. This meant the stresses at these points exceeded the compressive yield line which highlighted failure. The maximum principal stress was used as it was the maximum normal stress in any direction and was therefore the best stress to analyse when optimising a model to avoid failure. Maximum principal stress theory states that failure would occur when any maximum normal stress exceeded the yield stress of the material.
Introducing filler into the top row of cells of the core improved the compressive abilities of the structure, see Figure 5(b). This was proven by the fact the yield lines were crossed six times instead of seven. It was seen that the first two probes, which were both in contact with the top row of cells which were filled, experienced stresses of tension whereas only the first and last were tensile stresses before the filling was introduced. This was due to the filler assisting the auxetic cells in resisting the force, improving the compressive abilities of the structure. If Hertzian theory is considered, as the structure is strengthened the amount of the material in tension can extend due to the increased compressive capability, pushing back the compressive lobes within the core. 18
When the top row of cells was filled with silly putty or PU foam the same trend was noticed. However, the compressive loads were higher around the filled cells when silly putty was used. In Figure 5(c), the top two rows of the auxetic cells within the core were filled. This resulted in the lower yield line being crossed four times, hence showing further improvement. Where the line was crossed however, it was by a greater length compared to the previous two graphs. When the probe was adjacent to filled cells, the stresses were oscillating around 0. This showed that filling the cell made the core around this area stronger. From analysing these results, it was found the model was at its most compressive state once all five rows of cells were filled. The trend which had been noticed as the rows were filled continued as the third row of cells was filled with PVC foam, or the other two materials. The yield limit line was only crossed twice, although this still means that the structure failed, it showed continuous improvement as more cells were filled. With four rows of cells filled with the chosen PVC foam, the structure did not fail at the ten probes. The highest stress occurred at the ninth node and was less than 30% of the allowable stress. With four rows of PVC, the structure could theoretically withstand a load of more than 36 kN. The higher the load the structure could withstand, the better as there was going to be a safety factor introduced. As expected, when all the cells were filled, the structure showed to have the highest compressive capability, Figure 5(f), showed no signs of any stresses being near the limits highlighted on the graph.
Basic model (modified re-entrant cell design) stress path analysis
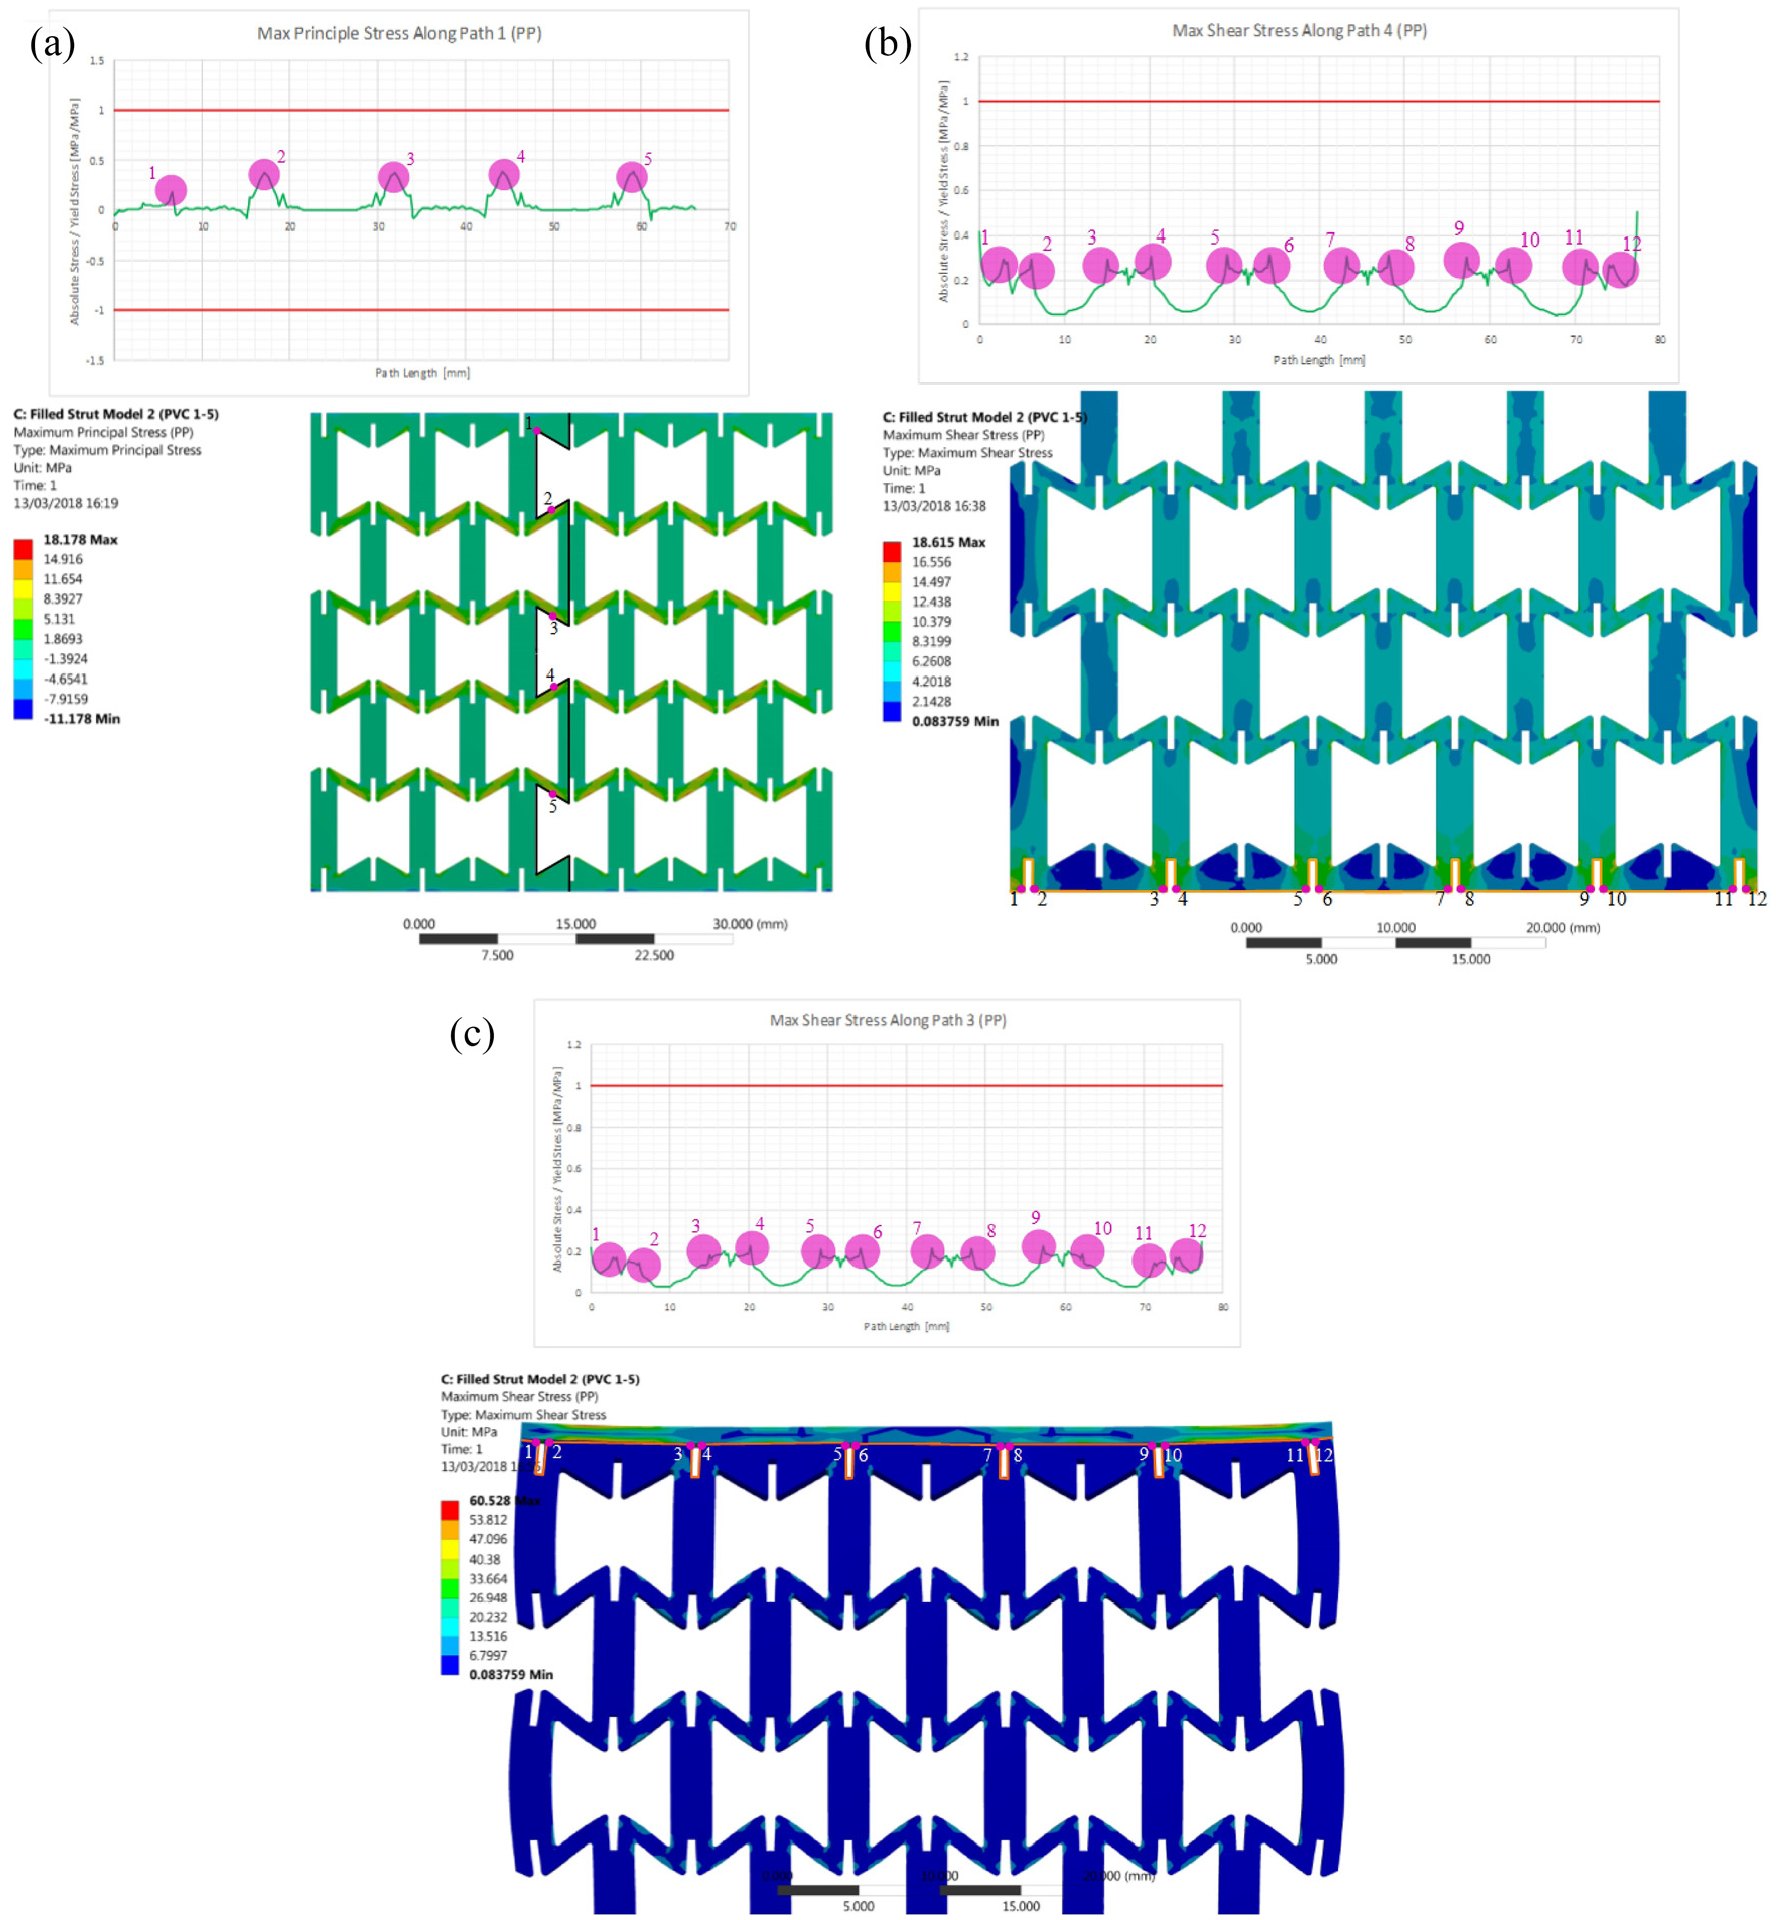
Both principal and shear stresses found in the basic model (modified re-entrant cell design) were extremely high. The initial basic model (Figure 6) showed massive stresses along all paths often reaching three to four times the yield stress of the polypropylene material. These stresses were highest in three instances: at sharp corners of auxetic structure, at small interface between the steel plates and the polypropylene and due to the bending of the top plate.
As the model was compressed, moments acted on the thin strut creating stress concentrations at corners as shown. Points 1 and 2 were in high tension due to the moment at Point 2, and Point 3 was in compression due to the combination of the two moments collapsing the strut vertically (Figure 13(a)). The largest stress peaks in the basic model were found on the vertical paths. The principal stresses in theses paths reached in excess of four times the yield stress of the polypropylene. If put into operation this would cause catastrophic failure in the structure. As shown in Figure 13(b), the peaks on the stress plot correlated directly to the corners of the auxetic strut structure in Path 1. This combination of twisting moments (Figure 13(a)) was repeated throughout the structure three more times in groups of peaks. Points 7, 8 and 9 had an identical stress profile to Points 1, 2 and 3, while Points 4, 5 and 6 along with Points 10, 11 and 12 had the reverse profiles as they were geometrically inverted. Though there were some large stresses at the extremities of this path, they were not as severe as the concentrated stresses already discussed.
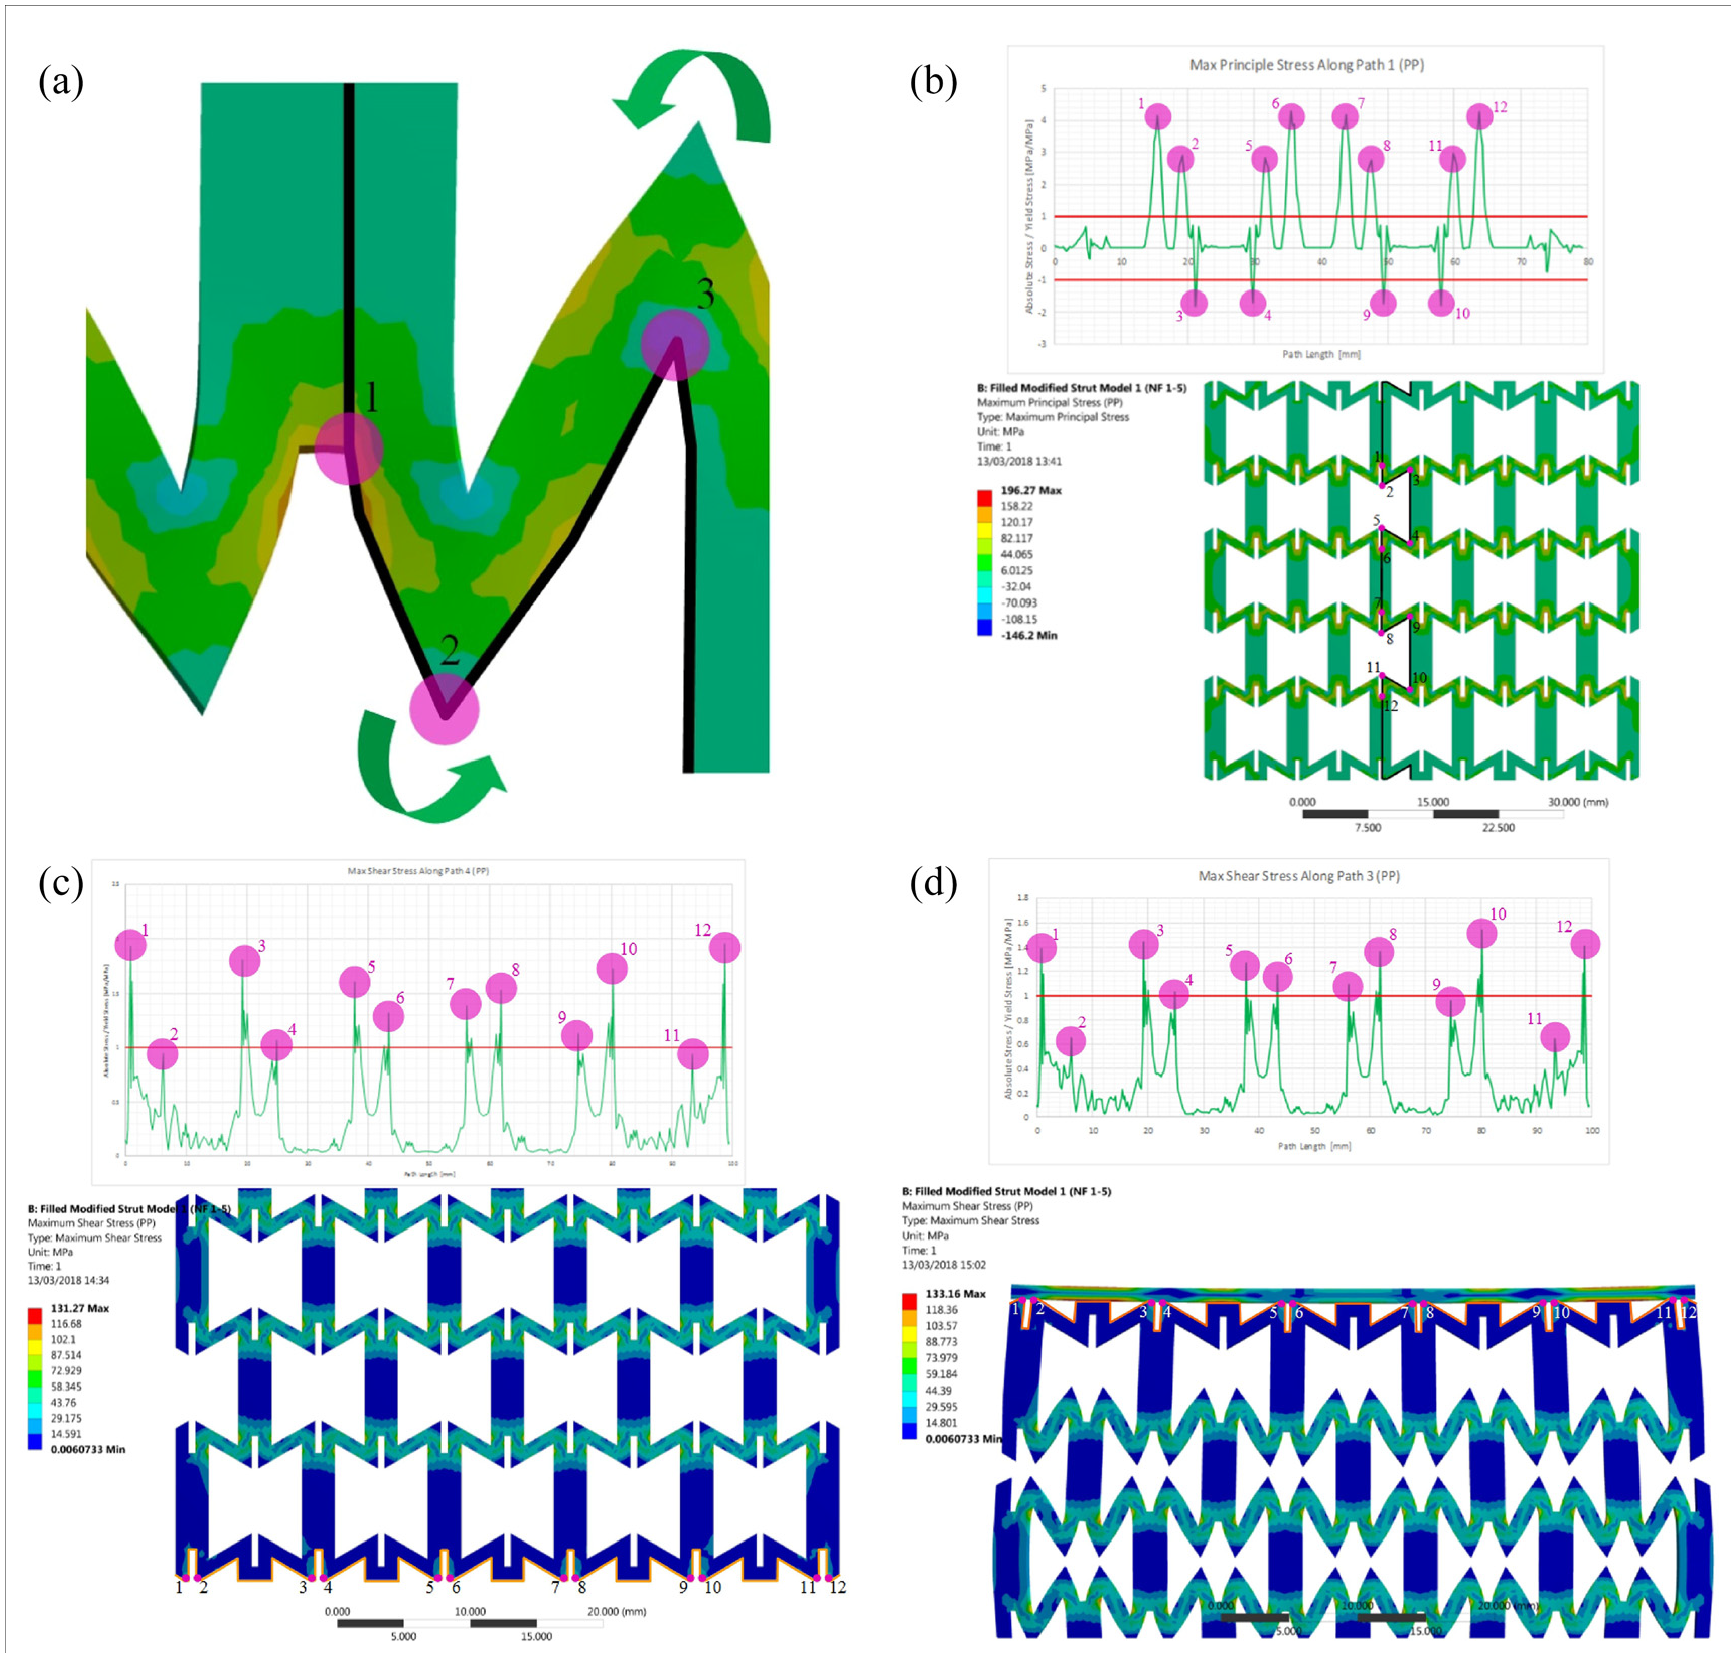
Principal and shear stresses (basic model: modified re-entrant strut cell design): (a) principal stress points 1, 2 and 3 with moments, (b) principal stress points along path 1, (c) shear stress points along path 4 and (d) shear stress points along path 3.
Analysing the shear stresses in Path 3 highlighted another unwanted feature of the basic model. As the interface between the polypropylene structure and the steel plate was relatively small, large shear stress concentrations appeared. Shown in Figure 13(c), these stresses appeared largest at the outer extremities of the model and were due to the moments in the thin struts. These moments create an inward force on the thick vertical struts which, while required for the structures auxetic properties, had the effect of dragging the material in. This created a massive shear force on the interface between the polypropylene and the steel. As the inward forces acted towards the centre of the model the shear stresses through the path were symmetrical. This led to higher stress on the outer interfaces (Points 1 and 12) and, although still high, lower stresses on the interfaces at the centre of the model (Points 6 and 7).
The impact was loaded onto the model from the top and the bottom panel was constrained completely as a fixed support. This meant the top steel plate was free to move and bend and as the force was loaded onto the plate, it becomes very slightly bent. This bending, although small, altered the shear stress concentration which created peaks at Points 10 and 3 (Figure 13(d)).
Improvement for enhanced model
The primary issue with the basic model was the high stress points as discussed in section above. To combat this stress concentration, alteration was made. As mentioned in section above, the primary stress issue appears to be the sharp corner of the structure. By using corner filleting, the stress was distributed more evenly over the length of the edge, which reduced stress concentration in the corners. For the enhanced model, a 2 mm fillet was added at eight corners in the structure. This change is seen in Figure 14(a). By analysing Path 3, it was found that high concentrations of shear stress were localised along the interface between the polypropylene and the steel plate. This was due to the design allowing only a tiny amount of polypropylene to be in contact with the steel plate. To reduce the peak value of this stress, the area of polypropylene in contact with the steel plate must be increased. To do this, the unfilled triangular elements at the interface were refilled with polypropylene. This allowed the high shear stress to distribute more evenly along the path, reducing the peak. This alteration is seen in Figure 14(b). The bending moment and associated excess stresses found on the top plate were thought to be a resultant of the gaps in the sides of the model. As there was a void of material at either side of the model, the force acted more on each edge. This created bending in the top plate. To reduce this, the voids were filled with one of the filling materials, PVC or Silly Putty. This increased the amount of material resistance in the edges of the model to the level of the inside therefore reducing the amount of bend allowed in the top plate. The location of the extra fillings can be seen in Figure 14(c).
Improvement for enhanced model (I: basic model, II: enhanced model): (a) filleting, (b) reduction of interface stress and (c) filling of edge structures.
Filling variations
A proposition to increase the impact resistance capabilities of the cells was to fill them with a soft material. This material could react to the impact but still compress significantly to allow for the retention of the structures NPR. Two types of filling were used, each with differing Young’s moduli. PVC has a higher Young’s modulus of 70 MPa while silly putty has a much lower modulus of 1.7 MPa. By using combinations of these two fillings an optimum filling pattern was obtained.
With no filling in any rows, the only material reacting to the load was the polypropylene. At low loadings, this was sufficient. However, as the load hitting the plate was large at 11 kN over an area of 25 cm2, the stresses increased beyond the desired limit. This was seen through the huge stress peaks in basic model stress analysis. And, in the stress path results in enhanced model stress analysis (no filling) (Figure 9). Though greatly improved by the changes implemented in the enhanced model, the stress peaks were still extremely high. This was especially prevalent in Paths 1 and 2 (Figure 9(a) and (b)). The highest peak in Path 1 for the enhanced model was larger than the basic model without a fill. However, the other peaks in the path were reduced. This disparity in the peak height was improved by filling the model.
Though fillings of silly putty (Rows 1–5) and silly putty (Row 1), PVC (Rows 2–5) were tested, the first successful filled model was a mixture of PVC and silly putty with PVC in the first four rows and silly putty in the final row. The PVC strengthened the cells greatly and led to much reduced stresses in both the basic (Figure 7) and enhanced models (Figure 10). Additionally, the silly putty in the bottom row allowed the cushioning effect of the auxetic material to remain. Though the PVC reduced stresses in the polypropylene significantly, the path lengths around the silly putty still retained large stress peaks. These are seen in Path 1 in both the basic model, as peaks at 74 mm in Path 1 (Figure 7(a)), and the enhanced model, as a shear stress peak at 61 mm in Path 1 (Figure 10(a)). The alterations made for the enhanced model improved this stress peak value from 1.6 times the yield stress, by half, to 0.8 times yield. This improvement allowed the enhanced model to remain in the elastic region while impacted by the 11 kN loading calculated. However, if the loading were slightly increased at any point, the model could be plastically deformed and require replacement.
To increase the load bearing capabilities of the structure further, the silly putty layer could be replaced with an additional layer of PVC filling. The higher Young’s modulus of PVC allowed for reduced stresses in the bottom row, to that of a similar value to other rows. This is shown in Figures 6 to 11 for the basic and enhanced models, respectively. In terms of stresses, the best-case model was the enhanced version of this fill pattern as all stress peaks were kept below 0.5 times the yield stress of polypropylene (Figure 11).
Enhanced model (based on modified re-entrant cell design) stress path analysis
When comparing the PVC filled, enhanced model (based on modified re-entrant cell design) with the basic model (modified re-entrant cell design) previously analysed in basic model stress analysis section, both the principal and shear stresses were reduced massively. Both the filling and the structural changes had influenced an improvement in the load bearing capabilities of the model.
By filleting the corners and filling the structure with PVC, the stress peaks have been almost eliminated. The only peaks which remained occur through the thin polypropylene struts. These stresses existed before but were too small to analyse in the previous model due to the massive stresses at the corners covering them. The stress in the thin struts can be seen in Figure 15(a) (Points 2–5). A single small stress point (Point 1) exists at the first corner; however this was small enough in this model to be considered negligible.
Principal and shear stresses (enhanced model based on modified re-entrant strut cell design): (a) principal stress points along path 1, (b) shear stress points along path 4 and (c) shear stress points along path 3.
As discussed in basic model stress analysis section above, the refilling of the triangular sections leading to an increase in interface area gave a greater distribution to both stresses. Though stresses still existed at the corners of the rectangular block cut outs, the stress along the other path section was reduced to almost zero. This is shown in Figure 15(b). Two slightly large peaks existed at the extreme ends of this path which could not be seen in the previous model. This was likely due to the use of a fixed support along the bottom face of the steel support plate and was discounted as, in reality, the support would not be fixed. This meant the maximum stress values in this path were reduced from 1.5–2 times the yield stress to 0.3–0.5 times the yield. This could be directly attributed to the reduction in stress concentration at the interface and, to a much lesser extent, the PVC filling used in the model.
Path 3 showed the same significant reduction in stresses as Path 4, due to increased interface and filling. It also showed the peaks to be more even than in basic model stress analysis section, with peak values ranging from 0.2 to 0.25 of the yield rather than 0.6–1.55 of the yield in Figure 13(b). These reduced stress points are clearly visible in Figure 15(c). This more even distribution of stress peaks correlated to a reduction in bending of the plate. This was a result of the edge fills inserted for the enhanced model giving reduced bending at the outer edges.
Energy absorbance (enhanced model)
Finally, analysing the effect of increase in Young’s modulus of the filling materials, the energy absorbance (EA) of the non-filled enhanced model (i.e. based on modified re-entrant strut cell design) had the greatest energy absorbance, with the PVC filled structure had the lowest energy absorbance. The structure absorbed energy by elastically deforming, the more it deformed, the more energy it could absorb. The energy absorbed per unit volume (or absorbance) for the non-filled basic model had the greatest value, followed by silly putty filled structure, and then the PVC filled structure (i.e. 61% decrease for silly putty, 88% decrease for PVC, respectively, compared to non-filled basic model). As the PVC foam had a Young’s modulus of 77 GPa, this therefore prevented the structure from elastically deforming and created a resistance to deformation. The non-filled structure had the greatest energy absorption ability as there was nothing was restricting the elastic deformation of the structure.
Structure manufacturing and future directions
Further investigation into the crushing behaviour could be undertaken through compression testing. As the structure could be fabricated through use of additive manufacturing, it is recommended that the honeycomb is 3D printed with the cell wall’s material remaining as polypropylene. Depending on the 3D printer, this is a straightforward process. From this the structure could be compression tested in a laboratory. The process could be repeated filling the different rows on the structure like the methodology mentioned above with use of PVC foam, PU foam and silly putty. From this, a comparison could be undertaken. Developing a functional graded material could be done through two means. By lowering the void fraction at the top of the structure or varying the elastic modulus of the filling throughout the structure. The cell’s void fraction would ensure a higher density would be created at the top of the structure. This would aid the structure through reducing manufacturing and material costings. Altering the elastic modulus through the material would allow for greater compression at the top and greater load bearing capabilities at the bottom. Nanoparticles can be utilised as the filling in the honeycomb structure. This would allow the structure to repair itself when damaged by responding rapidly to areas posing damage. Research would need to be carried out into the properties of self-healing polymers and what affect they would have on the structure’s mechanical properties. As demonstrated through recent work, for energy absorption applications, a hybrid composite auxetic structure based on acrylic matrix and the additively manufactured structure can also be useful to enhance the struts buckling resistance, 19 including those filled with expanded polypropylene (EPP) foam 20 and rubber like materials. 21
Conclusions
The impact resistance of the model is vital to the safety of structures. The aims of this work were to modify an auxetic cell (i.e. modified re-entrant strut cell design, and further enhancement of this design) to reduce the stress concentrations within the structure. The cell consisted of auxetic structure sandwiched by two metal plates which were placed under compression. Following are the main conclusions:
During the stress path analysis of models, it was found that an increase in Young’s modulus of the filling was proportional to a decrease in internal stresses. However, this increase in Young’s modulus caused the energy absorption to decrease.
Filling the auxetic cells with soft materials reduced the stress concentration, but it led to a reduction in the energy absorbance capability.
The lower stress produced by the enhanced model could be useful to prevent significant penetration of the protective panel.
Supplemental Material
sj-docx-1-sdj-10.1177_03093247221083210 – Supplemental material for Effect of fillers on compression loading performance of modified re-entrant honeycomb auxetic sandwich structures
Supplemental material, sj-docx-1-sdj-10.1177_03093247221083210 for Effect of fillers on compression loading performance of modified re-entrant honeycomb auxetic sandwich structures by Nadimul Haque Faisal, Lindsay Scott, Findlay Booth, Scott Duncan, Abbi McLeod, Mohamad Ghazi Droubi and James Njuguna in The Journal of Strain Analysis for Engineering Design
Supplemental Material
sj-pptx-1-sdj-10.1177_03093247221083210 – Supplemental material for Effect of fillers on compression loading performance of modified re-entrant honeycomb auxetic sandwich structures
Supplemental material, sj-pptx-1-sdj-10.1177_03093247221083210 for Effect of fillers on compression loading performance of modified re-entrant honeycomb auxetic sandwich structures by Nadimul Haque Faisal, Lindsay Scott, Findlay Booth, Scott Duncan, Abbi McLeod, Mohamad Ghazi Droubi and James Njuguna in The Journal of Strain Analysis for Engineering Design
Supplemental Material
sj-xlsx-1-sdj-10.1177_03093247221083210 – Supplemental material for Effect of fillers on compression loading performance of modified re-entrant honeycomb auxetic sandwich structures
Supplemental material, sj-xlsx-1-sdj-10.1177_03093247221083210 for Effect of fillers on compression loading performance of modified re-entrant honeycomb auxetic sandwich structures by Nadimul Haque Faisal, Lindsay Scott, Findlay Booth, Scott Duncan, Abbi McLeod, Mohamad Ghazi Droubi and James Njuguna in The Journal of Strain Analysis for Engineering Design
Footnotes
Author contributions
Nadimul Haque Faisal: Conceptualisation, Supervision, Data curation, Investigation, Writing – Original and final draft preparation, reviewing and editing. Lindsay Scott: Investigation, Testing, Validation, Analysis, Reporting. Findlay Booth: Investigation, Testing, Validation, Analysis, Reporting. Scott Duncan: Investigation, Testing, Validation, Analysis, Reporting. Abbi McLeod: Investigation, Testing, Validation, Analysis, Reporting. Mohamad Ghazi Droubi: Supervision, reviewing and editing. James Njuguna: Related research, reviewing and editing.
Declaration of conflicting interests
The author(s) declared no potential conflicts of interest with respect to the research, authorship, and/or publication of this article.
Funding
The author(s) received no financial support for the research, authorship, and/or publication of this article.
Supplemental material
Supplemental material for this article is available online.
References
Supplementary Material
Please find the following supplemental material available below.
For Open Access articles published under a Creative Commons License, all supplemental material carries the same license as the article it is associated with.
For non-Open Access articles published, all supplemental material carries a non-exclusive license, and permission requests for re-use of supplemental material or any part of supplemental material shall be sent directly to the copyright owner as specified in the copyright notice associated with the article.