Abstract
In recent years, bark beetle outbreaks have become a significant threat to forest ecosystems in Central Europe, a trend exacerbated by climate change, creating favourable environmental conditions for pest proliferation. This has increased the interest in remote-sensing-based detection of bark beetle infestations. The objective of this study is to detect and reconstruct forest disturbances in a mountainous area situated in the Upper Puster Valley (South Tyrol, Italy) and quantify spatio-temporal patterns, with a special focus on bark-beetle-induced damages. The study area was severely impacted by the storm VAIA in autumn 2018 as well as widespread snow breakage in subsequent winters, causing large amounts of residual wood in the forests and providing brood material for bark beetles. Combined with warm and dry summer conditions, populations grew significantly. Using a Sentinel-2 satellite time series spanning from 2018 to 2024, we applied a parametric bi-temporal change detection approach based on linear regression. Validation of infestation data from 2021 to 2023 with a reference dataset yielded detection rates ranging from 52% to 92%. The analysis of elevation influence on damage patterns revealed significant differences between abiotic and biotic disturbances. The interannual clustering of forest disturbances was analysed based on bivariate join count statistics. The results indicate a strong spatial correlation between years for both disturbance types. The highest correlations were found for bark beetle infestations, clustering highly around previous disturbances, underlining the importance of understanding interannual spatial connectivity and implementing timely targeted management strategies to limit the spread of outbreaks.
Keywords
Introduction
Forest disturbances in Europe increased significantly over the last decade (Jaime et al., 2024; Seidl et al., 2017). A major driver is the European spruce bark beetle (Ips typographus L.), which has become the predominant forest pest in Central Europe (cf. Huang et al., 2020; Bárta et al., 2021; Dalponte et al., 2022; Luo et al., 2023; Kautz et al., 2024). Bark beetles primarily infest Norway spruce (Picea abies), the most prevalent tree species in this region (Fettig et al., 2022; Hlásny et al., 2021). Vast amounts of logged wood and extensive damages have drawn significant attention to this natural disturbance agent and its impact on ecosystem functioning (Hlásny et al., 2021; Huo et al., 2021). Outbreaks alter forest landscape dynamics, often resulting in large-scale transformations with physical (e.g. loss of protective forest), social (e.g. economic losses, intrinsic values of forest) (Kautz et al., 2024) and climatic consequences (Migliavacca et al., 2025).
Natural disturbances are an integral and essential part of forest ecosystems, playing a crucial role in their development (Turner, 2010). However, in recent years, a significant dynamic shift was observed, indicating increasing frequency as well as intensity of both abiotic and biotic disturbance events (Basile et al., 2024; Lexer et al., 2014; Seidl et al., 2011). Increasing temperatures coupled with reduced precipitation during summer are leading towards decreased resilience of forest ecosystems, particularly affecting spruce trees, which react highly sensitive to dry conditions (Bárta et al., 2022; Hallas et al., 2024; Kautz et al., 2023).
Bark beetles benefit from these changes of climatic conditions, as their life cycle is strongly limited by temperature (Biedermann et al., 2019; Greiser et al., 2025). Warmer conditions in combination with increased availability of brood material resulting from intensified disturbances, facilitates population growth and increases the possible number of generations (Hlásny et al., 2021; Jaime et al., 2024). If frequency and intensity of disturbance events surpass the resilience thresholds of the forest ecosystem, a permanent change in structure and functioning can occur (Lindner et al., 2010; Netherer, 2022).
The decay process caused by bark beetle infestations leads to a gradual change in the visual appearance of the affected trees, as needles change colour from green to red and eventually fall off. The green-attack phase, defined as pre-visual, occurs immediately after successful colonization, meaning no visible differences to healthy trees can be observed. In contrast, the later stages – red-attack and grey-attack phase – are characterized by distinct changes in needle colour, which result in a significant change of spectral reflectance (cf. Luo et al., 2023; Marvasti-Zadeh et al., 2024). These visual changes typically lag behind the actual infestation process, depending on environment conditions, tree health and degree of infestation, making the timely detection even more challenging (Abdullah et al., 2019a; Mandl and Lang, 2023).
Early detection measurements focus on the green-attack phase, aiming to identify and extract infested trees before the new beetle generation emerges (Bozzini et al., 2024). These approaches can support field surveys by practitioners, particularly in complex terrain where extensive field surveys are either costly or unfeasible to implement (Bozzini et al., 2025). However, remote sensing approaches are yet to be fully integrated into forestry practice due to the complexity of the algorithms, challenges in implementation and insufficient accuracy (Kautz et al., 2024; Marvasti-Zadeh et al., 2024).
On the other hand, later-stage detection has been applied successfully in various studies (cf. Junttila et al., 2022; Karpov et al., 2024; Östersund et al., 2024). While it only indirectly contributes to limiting the spread of infestations, it is nevertheless a valuable tool for retrospective analysis and quantification of infestation patterns and trends (Fernandez-Carrillo et al., 2020; Seidl et al., 2016). Additionally, later-stage detection can be used for the identification of infested trees in the fall. If infested trees are correctly identified, they can be removed before the emergence in the following spring (Dalponte et al., 2023).
Time series analyses are commonly applied to study the spread of bark beetle infestations (Dalponte et al., 2023; Gomez et al., 2020; Jamali et al., 2024). Previous studies have shown that the majority of new infestations occur within a 500m radius of previous years infestations (Blake et al., 2014; Kautz et al., 2011). It is therefore necessary to concentrate sanitation efforts around previously infested stands and their close vicinity (Baier et al., 2019). Topography also influences bark beetle spreading, with the elevation level influencing ambient temperature and wind directions (Faccoli and Bernardinelli, 2014).
While visual interpretations using maps are most commonly provided to draw conclusions about the correlation of infestations, these methods are limited in their ability to make statistical assumptions. The degree of spatial autocorrelation provides a statistically based metric for assessing the spatio-temporal clustering of infestations (Anselin and Li, 2019).
When similar values cluster in close proximity, a certain degree of similarity due to spatial proximity can be assumed (Loonis and de belleffon 2018). Moran’s I (Getis, 2008; Moran, 1948) is one of the most frequently used metrics to measure global spatial autocorrelation, which quantifies how similar (or dissimilar) values of a certain variable are across space. It evaluates variances and covariances by comparing differences between observations against the average of all observations using a spatial weight matrix. For categorical data, however, join count statistics (JCS) should be preferred. Based on Moran’s I, JCS are better suited for this study as the goal is to distinguish between healthy and infested forest classes (Anselin and Li, 2019). This approach based on neighbourhood structure instead of buffers or other measurements of distance allows for better comparison of spatial correlations based on a statistical metric.
Therefore, this study has three main objectives: (1) analyse the degree of spatial clustering of forest disturbances, with a special focus on bark beetle infestations on a multi-year scale, (2) evaluate the influence of elevation levels on the distribution of forest disturbances of different agents, and (3) test if spatial autocorrelation analysis based on JCS is suited to accurately quantify multi-year clustering of forest disturbances, with a focus on bark beetle infestations, as it is hypothesised that these show the highest degree of clustering. Furthermore, a deeper understanding of disturbances patterns and dynamics allows for more efficient and effective forest management.
Study area and data
The study area is located in the Northern Italian Alps, within the Autonomous Province of Bolzano/Bozen. It encompasses approximately 260 km2, about half of which is forested (Figure 1). To facilitate analysis, the study area was divided into three subareas, allowing for comparisons between distinct test sites. The landscape is characterized by alpine terrain, with elevation levels from 1100 m asl to nearly 3000 m asl. Some local deciduous forests persist on the valley bottom and the south/south-west exposed slopes, with the majority covered by dense coniferous forest dominated by spruce, with localized occurrences of Scots pine (Pinus sylvestris), Swiss stone pine (Pinus cembra), Silver fir (Abies alba) and larch (Larix decidua) (Autonomous Province of Bolzano/Bozen, 2025c). Overview map of the study area, located in the Northern Italian Alps. The forest classification was downloaded from the Geobrowser (Autonomous Province of Bolzano/Bozen 2025a).
A segmented time-series of Sentinel-2 satellite remote sensing data was incorporated as the main dataset. The reference dataset was provided by the Department of Forest Planning of the Autonomous Province of Bolzano/Bozen and was used for the validation protocol. It consists of vector polygons of infested forested area. Although the dataset covers the years 2017 to 2023, the number of polygons as well as the level of detail are very limited prior to 2021. Consequently, only the years 2021 to 2023 were used for the validation protocol. This limit imposed by data availability should not greatly hinder the workflow of this study as the reference data is available for the years, where major bark beetle activity occurred. The data until 2022 was downloaded via the Geobrowser (Autonomous Province of Bolzano/Bozen, 2025b). In addition, the digital elevation model for the study area was downloaded as well. For visual inspection, high resolution orthophotos were accessed through the WMS-Server (Autonomous Province of Bolzano/Bozen, 2025c).
Methodology
The Sentinel-2 time-series, spanning 2017 to 2024, was processed in the Google Earth Engine (GEE) via the Python API (Gorelick et al., 2017). The S2_HARMONIZED dataset was used, consisting of L1C-Data (top of atmosphere) with processing baseline 04.00. It was pre-processed with Sen2Cor (ESA, 2024), which performs atmospheric-, terrain- and cirrus correction on the L1C input data. For cloud and shadow detection, the s2cloudless algorithm (Zupanc, 2017) was implemented. After pre-processing, all spectral bands were resampled to 10 m spatial resolution.
A forest mask was implemented to mask out non-forest areas within the study area. It was calculated based on a supervised classification with the Random Forest algorithm (Breiman, 2001). The classifier was trained to classify pixels into forest and non-forest based on a selection of spectral (vegetation) indices (VI).
Vegetation indices used for OLS Regression model and forest mask calculation.
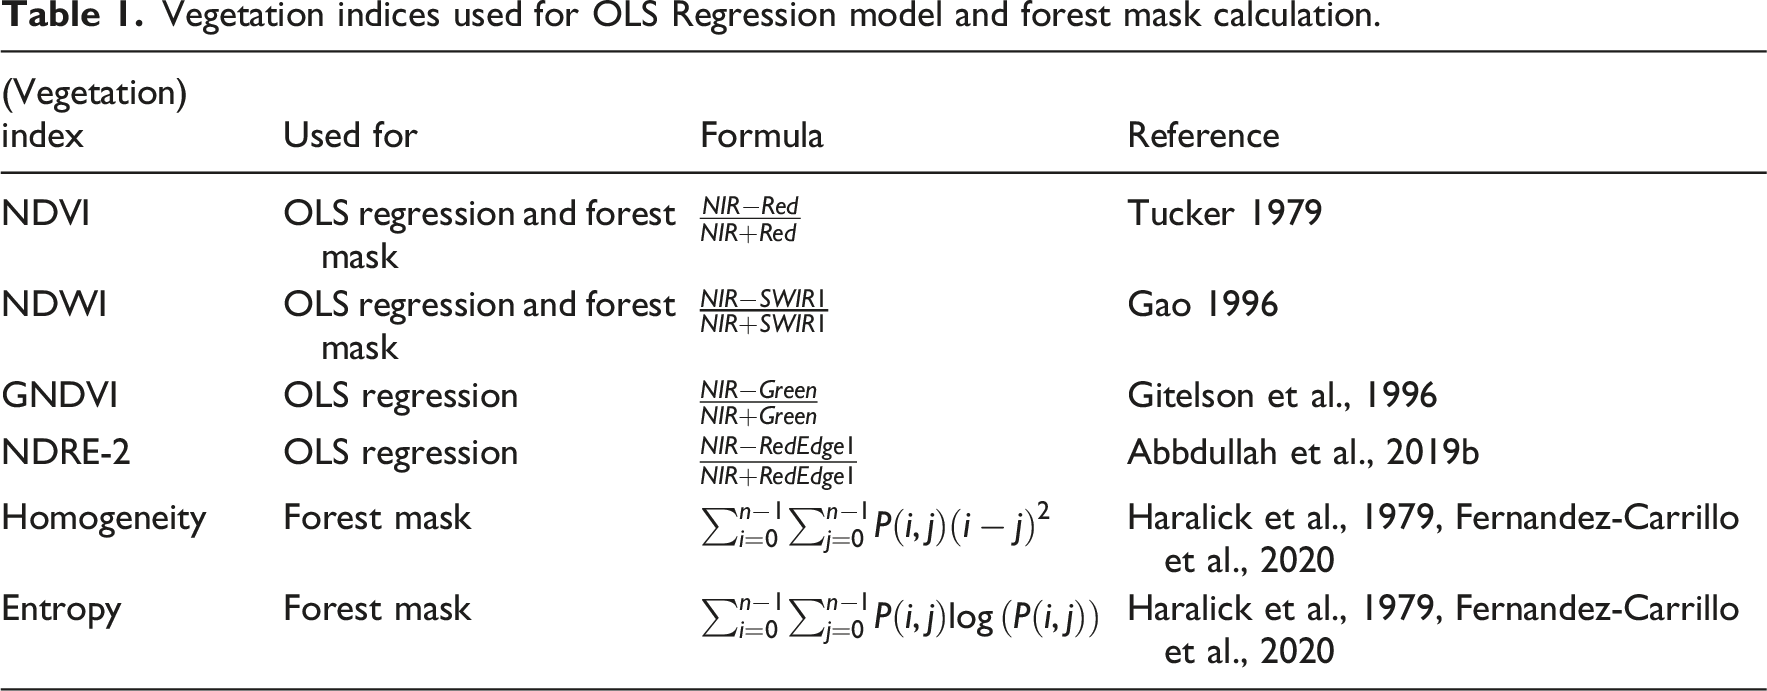
The Normalized Difference Vegetation Index (NDVI) and Normalized Difference Water Index, (NDWI) are well-established for forest classifications (Tucker, 1979; Gao 1996; Kollert et al., 2021). Combined with the Green Normalized Difference Vegetation Index (GNDVI) and Normalized Difference Red Edge Index (NDRE) they were used for the machine learning model. The selected VIs capture decrease (or increase) in vitality associated with changes in photosynthetic activity (Red and Red-Edge Bands), or changes in water or dry matter content (NIR and SWIR Bands) in plants (Ayala-Silva and Beyl, 2005; Muñoz-Huerta et al., 2013).
For the forest mask calculation, two texture-based indices were included to quantify spatial variability in image data. Homogeneity measures the distribution of grey values in an image. High values indicate smooth textures with little contrast, such as uniform land covers like agricultural field. Entropy measures the information content or randomness of the texture. High values indicate higher variability and represent more fragmented areas, for example, urban settlements (Fernandez-Carrillo et al., 2020; Zhang et al., 2018; Zhou et al., 2017).
The forest mask was calculated using the median composite of Sentinel-2 data from June to September 2017, as no single cloud-free image of the entire study area was available. The year was selected to represent a reference of forest vitality, with the objective of detecting disturbances as deviations from this initial state. A 10-fold cross-validation was performed using 300 manually labelled points per class, resulting in a mean overall accuracy of 0.91.
Similarly, the S2 time-series was aggregated into monthly composites for each spectral band and VI (Figure 2(b)), with the September composites being used for the Regression Model. This composite should reflect the final stage of bark beetle activity each year, due to the activity declining with decreasing temperatures, as beetles prepare for hibernation in the litter or beneath the bark (Dalponte et al., 2022; Junttila et al., 2022; Nierhaus-Wunderwald and Forster, 2004). Workflow used in this study. (a) Sentinel-2 bands input time series, (b) processing steps for preparation of regression datasets and detection of forest anomalies, (c) workflow of the Ordinary Least Squares (OLS) Regression, and (d) graphical representation of the concept of (bitemporal-) join counts statistics.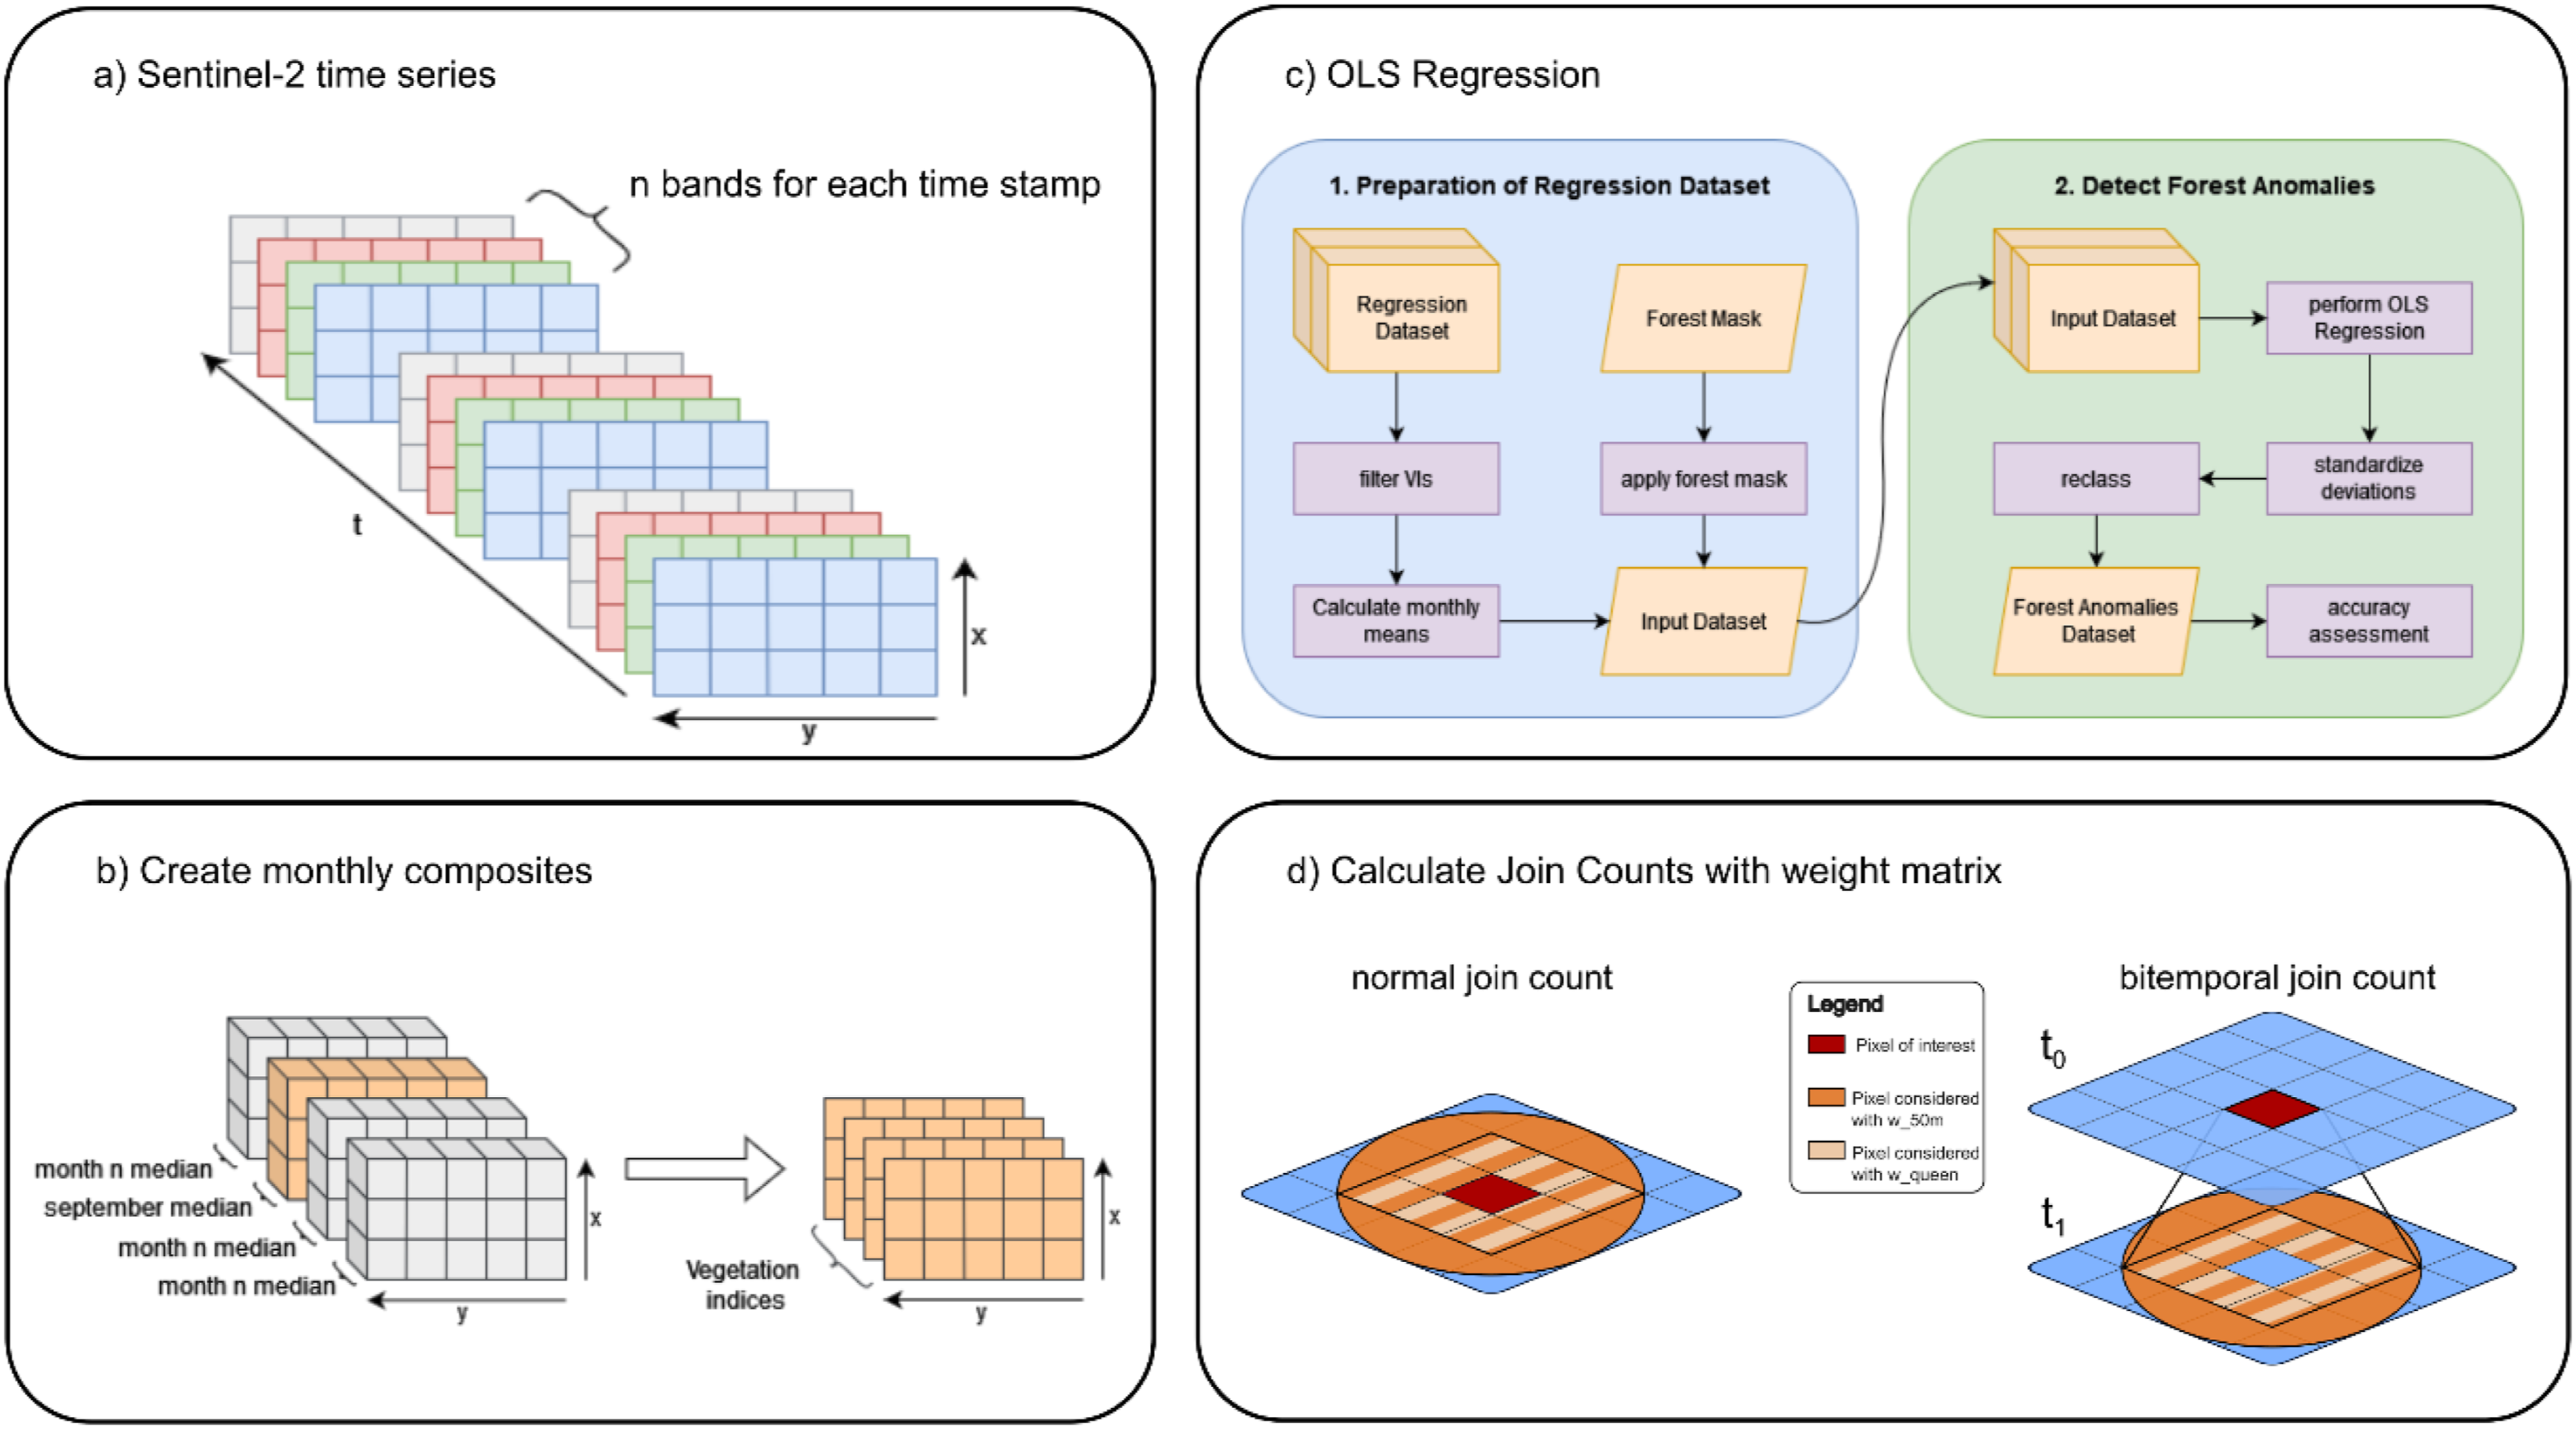
Anomaly detection based on OLS regression
In the next step, a machine learning algorithm based on Ordinary Least Squares (OLS) regression was implemented as a change detection approach to detect deviations from the expected forest condition between two time steps. Change detection algorithms are widely recognized as standard for the retrospective quantification of bark beetle infestations (Giannetti et al., 2021; Marvasti-Zadeh et al., 2024; Senf et al., 2017). Building on the work by Fernandez-Carrillo et al. (2020), the applied algorithm was adapted with a different set of VIs, to cover a wider range of the electromagnetic spectrum. The validation protocol also needed to be adapted to compensate for the lack of validation data collected in situ.
The applied workflow consisted of two main components (Figure 2(c)). The first step involved preparing the dataset (Section 2). The resulting dataset, containing the median September values for each VI and year, was used for the regression, which was performed as a bi-temporal analysis of consecutive timesteps tx and tx+1, iteratively for each timestep pair and VI. Detected deviations between estimated and observed values at the second time step indicate potential forest disturbances. The deviations were calculated for each pixel and each VI. To ensure comparability across indices, deviations are standardised using z-score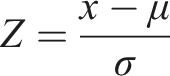
Accuracy assessment and preparation of reference dataset
The accuracy assessment was conducted with the reference dataset. As only the September vegetation condition was analysed, challenges were introduced particularly regarding clear cuts. For instance, if a stand gets infested and subsequently cleared the same year, the September-composite would only capture the clear cut, losing information about earlier processes. Excluding such areas by calculating the forest mask using data from a later year would necessitate adjustments to the number of polygons in the reference dataset. To maintain consistency and account for all relevant processes, it was decided to include these areas and polygons in the accuracy assessment.
Visual inspection of the reference dataset revealed varying levels of precision across subareas and years. With the primary issue being misclassified reference polygons, recorded in years after the infestation. To address this, a simple filtering algorithm was implemented to exclude such polygons. The time series was extracted for each polygon in the reference dataset and the NDVI used as a proxy for forest vitality. Outliers were detected with z-score, with all values >3 being treated as noData. Phenological composites, defined from May 1st to September 30th, were calculated (cf. Kollert et al., 2021). If the NDVI of the year of infestation (as recorded in the reference dataset) decreased compared to the previous year, the polygon was treated as a secondary infestation, indicating that the primary impact event had already occurred the previous year. For the accuracy assessment, only polygons with a higher NDVI – representing primary bark beetle infestations – were considered.
The accuracy assessment utilized zonal statistics to analyse the number of polygons correctly detected by the model for each year. A polygon was considered as detected if the maximum zonal statistic value was greater than zero. A minimum threshold value was not implemented, as the median polygon area was 393 m2 and would therefore remove a large portion of the reference dataset. To evaluate the influence of polygon size, the reference dataset was divided based on minimum area: 100 m2, 200 m2, 500 m2 and 1000 m2. Three specific sub-areas were defined for the accuracy assessment, containing most reference polygons in combination with specific topography (Figure 3). Detail map showing the subdivision of the study area into three separate detail areas used to evaluate the OLS-regression model. The subareas were divided based on the available reference data to represent three main areas of infestation in combination with specific topography and to allow for comparison between areas.
Analysis of the effect of elevation on forest disturbances
To account for variations in elevation levels, the distribution of forest disturbances in relation to elevation was analysed. For each time slice, the elevation of each infested pixel was extracted from the digital terrain model, enabling year-by-year comparisons of the distribution of forest disturbances. Furthermore, shifts in elevation levels give insight into disturbances dynamics and main drivers of forest disturbances in combination with additional environmental factors (Baier, 2019; Faccoli and Bernardinelli, 2014; Kautz et al., 2011).
Spatial analysis based on join count statistics
To analyse the clustering of forest damages, the disturbances maps were used as input for the spatial autocorrelation analysis based on JCS. JCS quantify the degree of spatial clustering or dispersion in binary (categorical) variables (Anselin et al., 2002; Getis et al., 1973; Moran, 1948). Spatial autocorrelation measures the influence of spatial proximity on the values of a variable, that is, the tendency of spatial units in close proximity to exhibit similar values due to their spatial location. For binary data, three types of relations can be distinguished: 0-0, 0-1 and 1-1 (Loonis and De Belleffon, 2018; Moran, 1948).
For binary datasets, the neighbourhood may be defined with this spatial weight matrix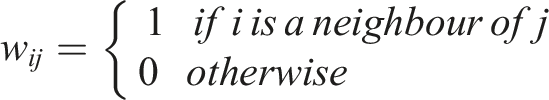
The neighbourhood is defined based on distance or shared borders. With • 1-1 relations • 0-0 relations • 0-1 relations
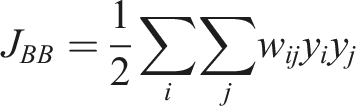
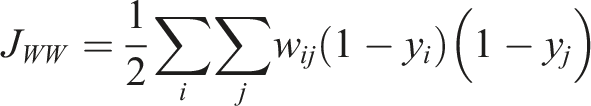
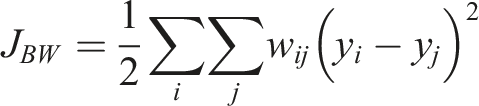
The 1-1 relations are of primary interest, as they represent the disturbed forest class. The null hypothesis for this study states that there is spatial clustering present in the study area across years due to new infestations occurring primarily in close vicinity to previous infestations (Baier, 2019; Kautz et al., 2011). If no spatial autocorrelation is present, the JCS would follow a normal distribution and the null hypothesis must be discarded. Permutation based pseudo p-values were calculated for each JCS to test for statistical significance (Gao et al., 2019).
Two types of neighbourhood definitions were used to calculate the spatial weight matrix (Figure 2(d)). One based on
The second neighbourhood was defined based on a distance radius threshold of 50 m, with all pixels within this radius considered neighbours. This approach was designed to better identify larger clusters of forest disturbances and to analyse multi-year disturbances patterns, with a focus on spatial dispersion.
JCS quantify the spatial autocorrelation of forest disturbances within individual years, to evaluate whether infested pixels are more likely to neighbour other disturbed pixels than expected under random labelling, thereby measuring clustering or dispersion at a defined neighbourhood scale. This approach is well suited to phenomena driven by local contagion or patch coalescence, where many 1–1 (infested–infested) joins directly indicate spatial clustering, which is hypothesised to be case for bark beetle infestations. To detect interannual spread and connectivity of disturbances, the JCS was implemented as a bivariate statistic. This approach examines whether the values of variable
It was further modified as a bitemporal JCS for a single variable, representing disturbed pixels at each time step. A high number of 1-1-Joins between both time slices indicates that disturbances in the second year
Results
Ordinary Least Squares – Regression results based on Sentinel-2 data
In recent years, forests in the study area were subjected to large-scale disturbances, resulting in estimated damages >100 ha triggered by multiple disturbance agents (Figure 4). For each year, a main driver of disturbances was identified based on damage patterns, reference data and recent literature. The disturbed area increased steadily from 2017 onward, reaching a peak in 2019-2020, with over 500 ha of disturbed forest area detected, decreasing again in the following year. The later periods from 2021 to 2024 recorded a continuous increase, reaching over 600 ha in the last two periods. Disturbed forested area identified by the regression model based on Sentinel-2 data. Disturbances are not limited to bark beetles and may include other factors as well. Vertical lines in the figure indicate the years associated with the presumed main driver of disturbances.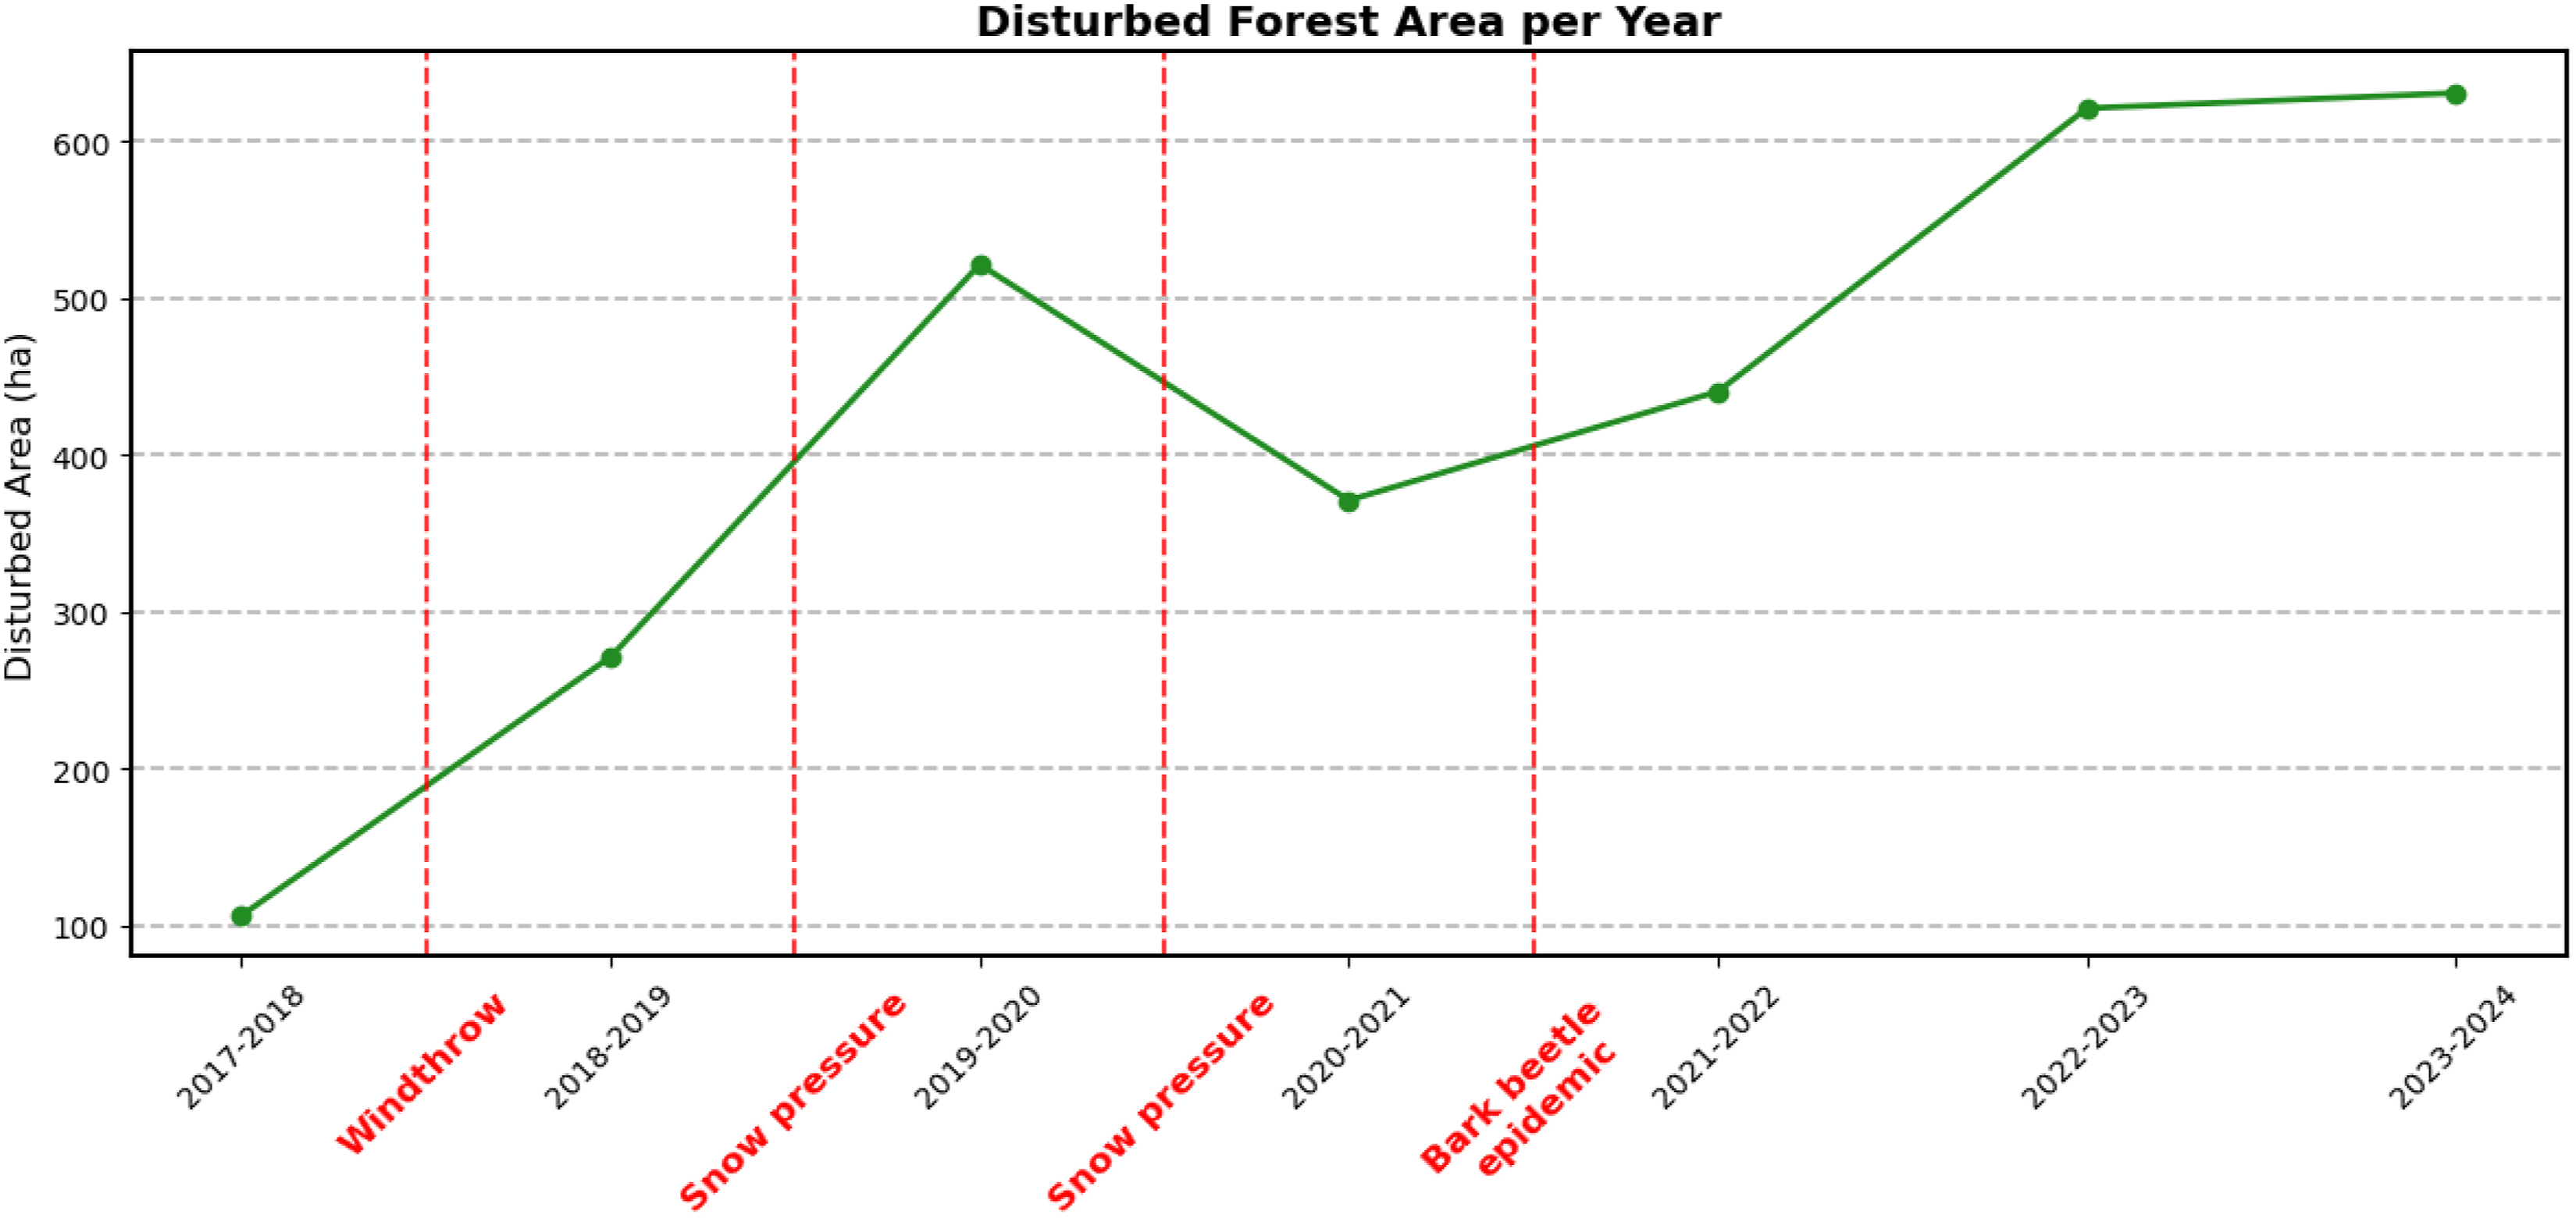
To analyse the heterogeneous spread of disturbances across the study area, corresponding patterns were identified (Figure 5). All four presented examples represent different patterns of forest disturbances relating to bark beetle infestations and could be validated with reference data. With major bark beetle related damages starting in 2021 (Dorigatti et al., 2024; Hallas et al., 2024), some areas showed early infestations, following initial damages from windthrow and snow breakage (Figure 5(a)). The following years, infestations concentrated on the north-facing slope on the opposite side of the valley. Map of yearly forest disturbances from 2019 to 2024. The detailed views show typical patterns of bark beetle infestations. The Years reference the first year of detected change.
Across the whole study area, bark beetle outbreaks were observed in defined clusters across multiple scales. Large scale clusters (Figure 5(b)) developed over multiple years with new infestations emerging in close vicinity to initial damages. This cluster recorded initial damages in 2020 with an intensification in the following years. In 2024, a shift towards higher elevations could be observed.
Damages also occurred in localized clusters (Figure 5(c)). This cluster located on a north-eastern slope consisted of only a small damaged forest stand in 2021. In the following years, infestations were recorded around the initial area.
Forest damages also spread across entire mountain slopes (Figure 5(d)). This northern slope recorded especially strong disturbances, starting in 2020 and intensifying in the following years. A multi-year infestation pattern can be observed, as later infestations strongly cluster around previous damages. In 2024, new disturbances were observed to shift upwards.
The number of polygons in the reference dataset considered across all minimum areas across regions was lowest in 2021, peaked in 2022 and declined again in 2023 (Figure 6). The area threshold limited the number of considered polygons with increasing minimum area. However, this trend was differed across all years and test areas, with some exceptions showing only a slight decline. Achieved accuracies of the OLS-regression for each sub-area and year. The rows represent the sub-areas, while the columns correspond to each year. The bar plots show the total number of considered polygons based on minimum area, with horizontal lines indicating the proportion of correctly identified polygons.
Model accuracy improved consistently over time across all test areas. While the combined accuracy was approximately 50% in the first year, it increased to over 70% for 2022 and peaked in 2023 with an average accuracy of 85%. In 2022, the highest accuracy was observed for AOI Niederdorf, with a mean accuracy of 82%, reaching over 90% for larger polygon thresholds. In contrast, the other study areas achieved significantly lower accuracies, with mean values of approximately 62% for AOI Niederdorf and 68% for AOI Sexten. The highest accuracy was achieved for AOI Sexten, reaching 92% in 2023, albeit, with a smaller number of considered polygons. The other areas achieved accuracies around 82% in the same time period.
Forest disturbances as a function of elevation
The Influence of elevation on forested damages was analysed to determine changes in the distribution relating to different disturbance agents (Figure 7). The distribution of elevation values of infested pixels for each year across the whole study area was compared to all valid pixels in the forest mask. The forested area is distributed from 1100 to 2100 m asl, with highest densities around 1600 m asl. The first three years showed density distributions shifted towards higher elevations, with peaks at around 1700 m asl. In the following years – the years defined by major bark beetle outbreaks – the peaks were recorded for lower elevations under 1500 m asl, with an outlier above 1600 m asl, in 2024. (a) Kernel Density Estimate (KDE) plot and boxplots of height distribution of disturbed pixels compared to all pixel of the forest mask. (b) Boxplots with median values shown as horizontal lines and mean values as circles. Whiskers are defined as 1.5 times the interquartile Range.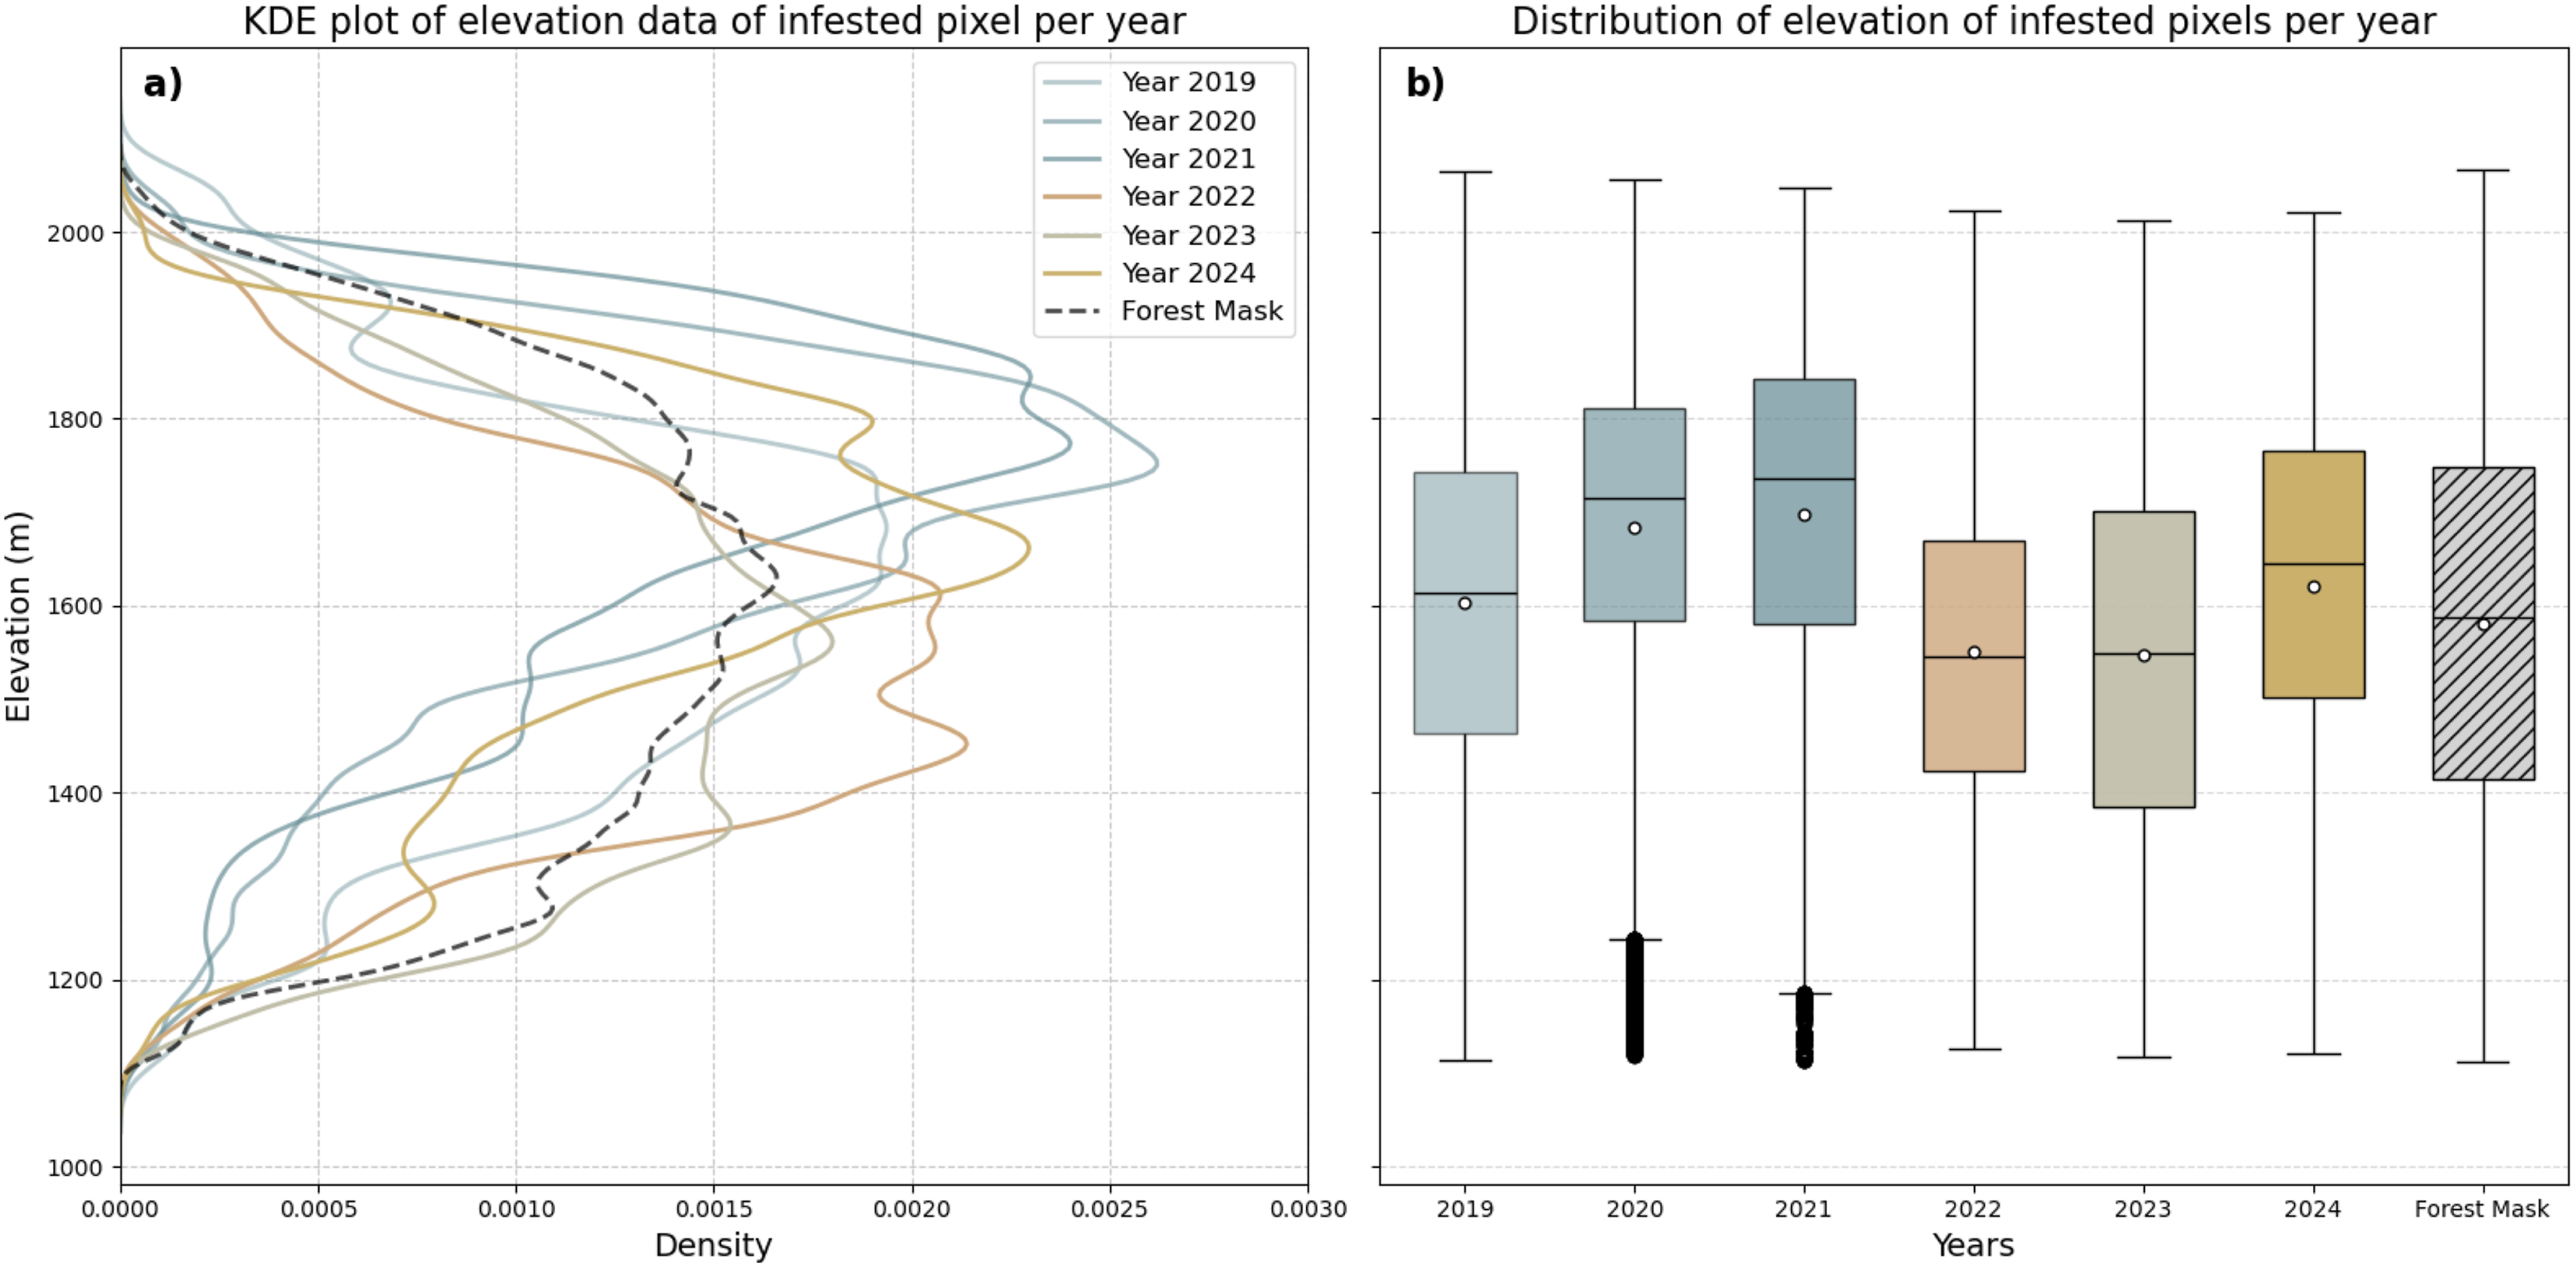
Bitemporal join count analysis
The bitemporal JCS results (Figure 8) compare the observed and expected 1-1 JCs for both spatial weight matrices. The graph reveals a similar pattern for both spatial weight matrices, with statistically significant results for all years ( Comparison of calculated 1-1 bitemporal join count statistics for queen weights and 50m radius weights. The number of 1-1 joins corresponds to the amount of disturbed neighbouring pixels between two time steps. A higher ratio indicates a stronger interannual spatial clustering.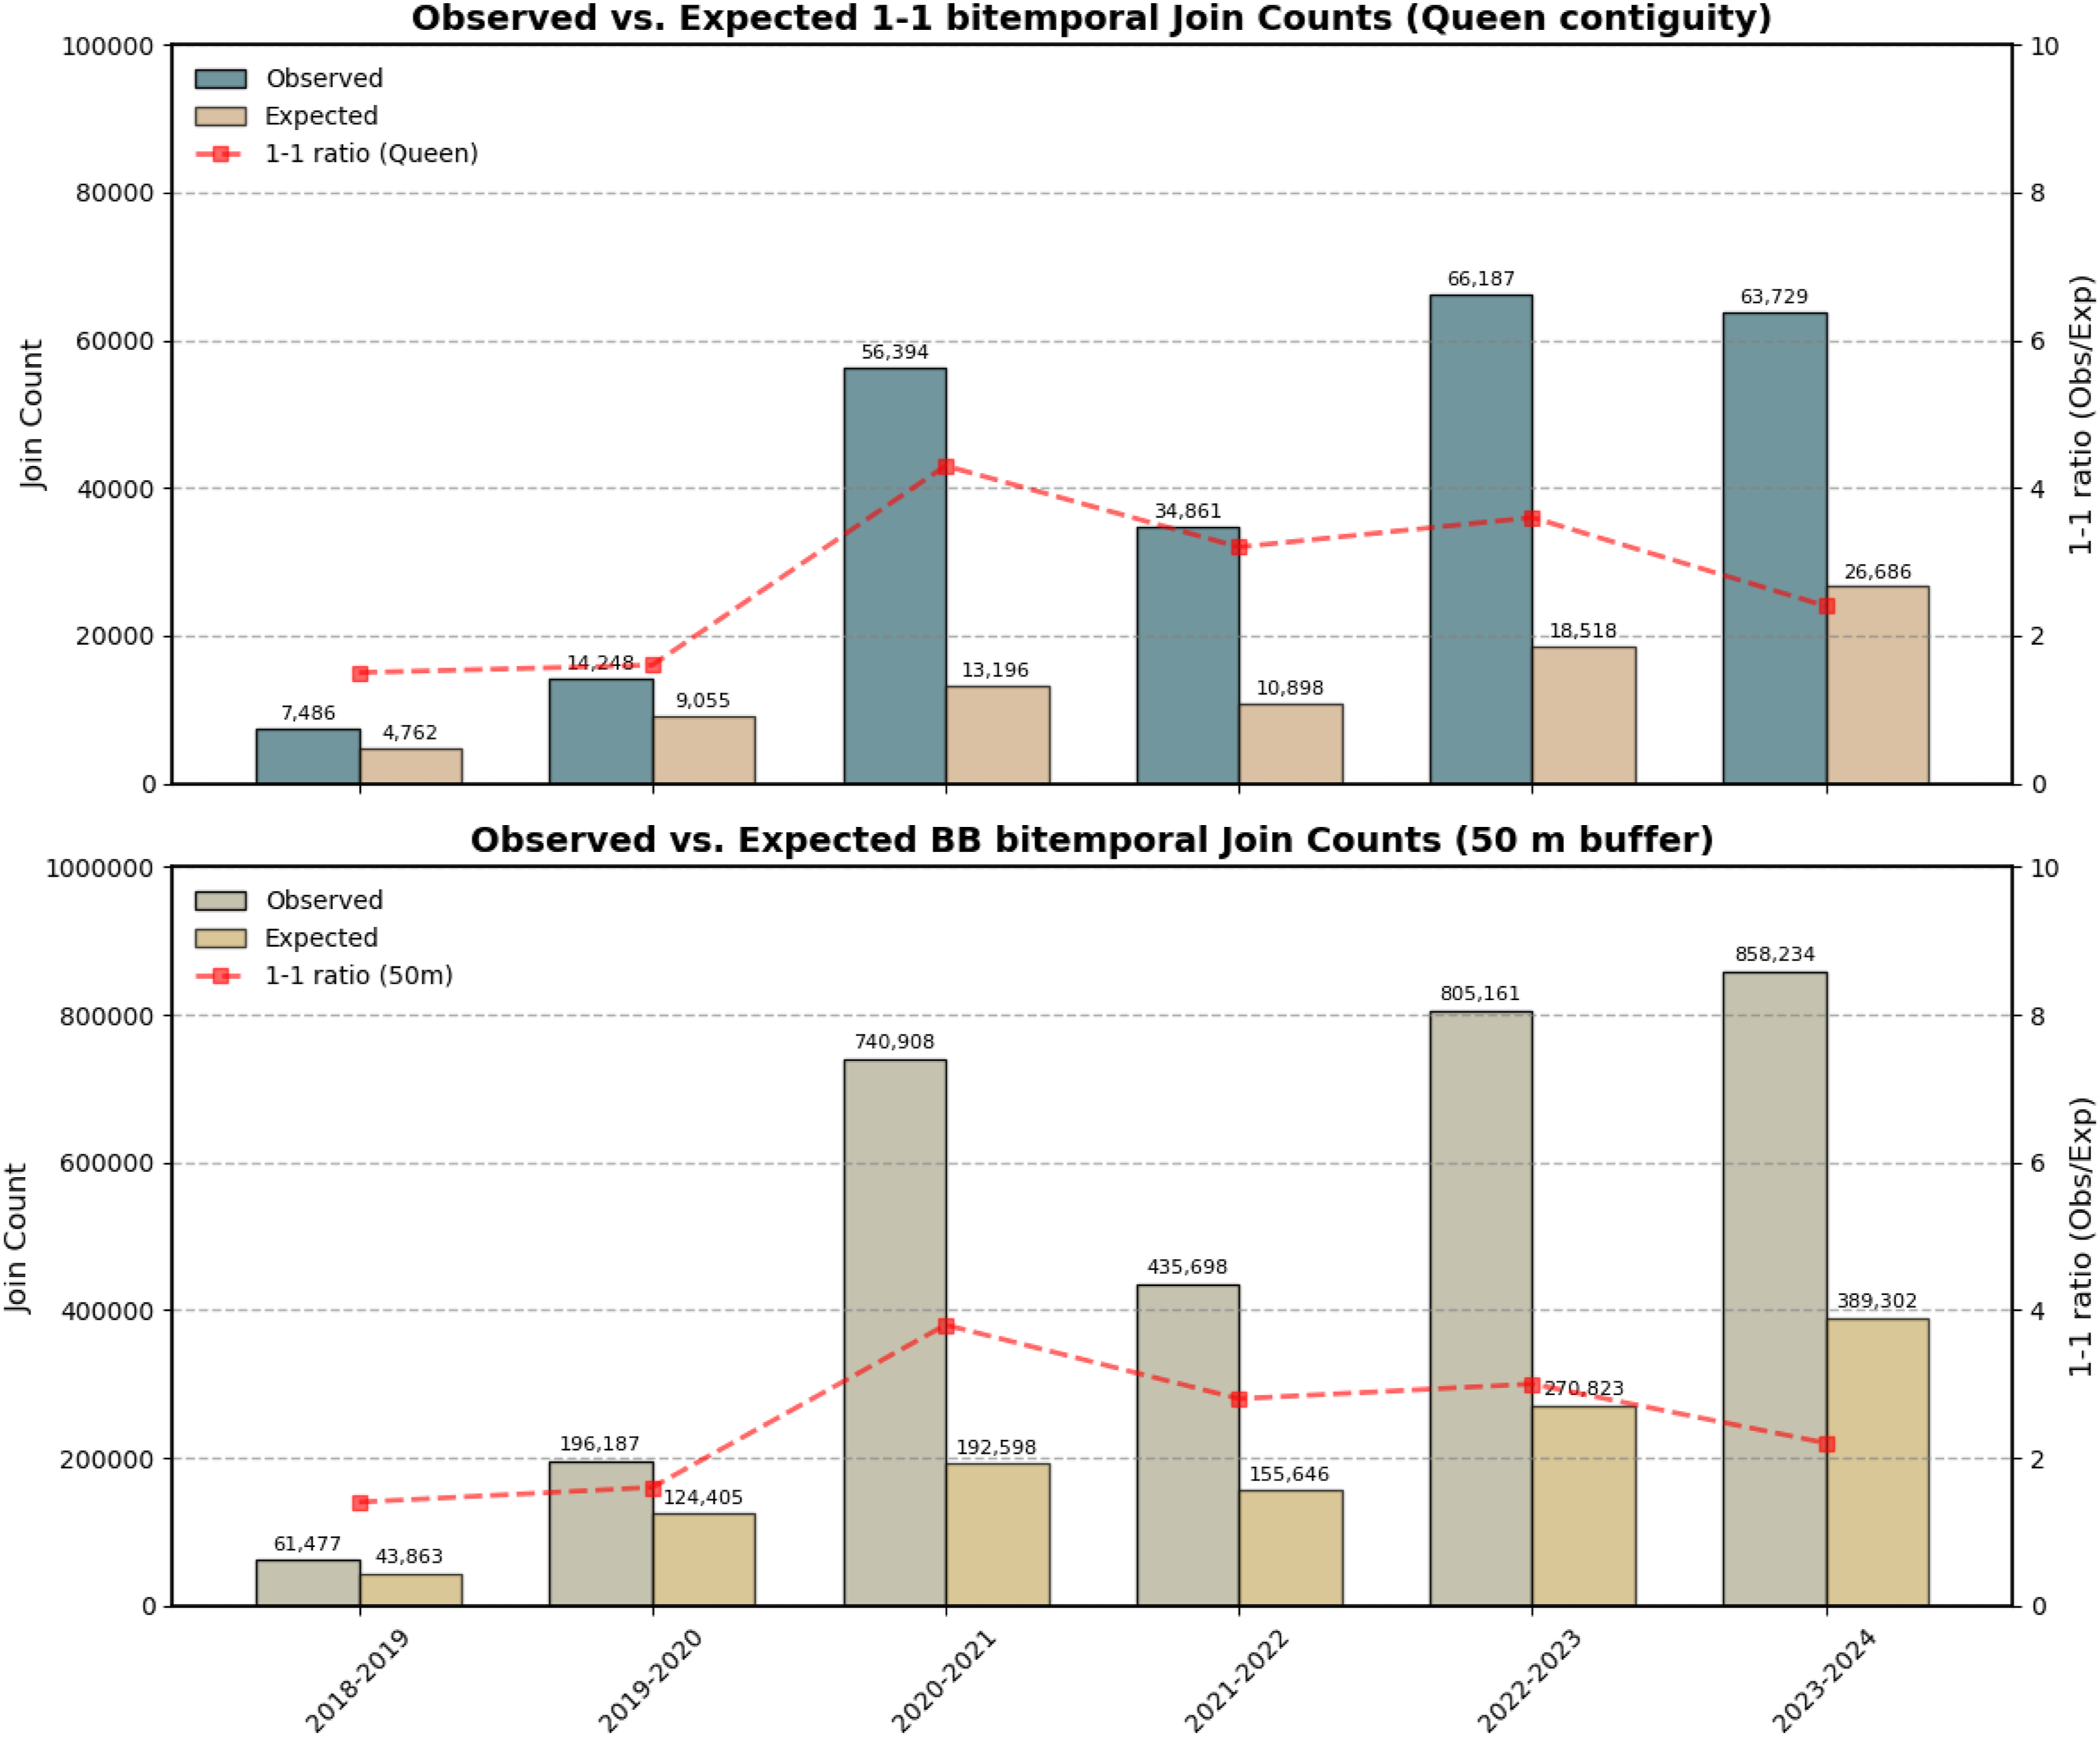
During the periods 2018–2019 and 2019–2020 no significant forest disturbances were detected in the study area, resulting in a lower number of 1-1 joins. In the following period (2020–2021) the number of JCs increased before declining again in the subsequent period. In the final two periods, the number of 1-1 JCs rose again to over 60,000 and over 800,000 joins observed, respectively. These periods were characterized by a high number of forest disturbances and increased bark beetle activity. The ratio of observed and expected JCs was consistently higher across all years when using the queen contiguity weight matrix compared to the 50m distance threshold, peaking in 2020–2021.
Discussion
This study utilized a parametric bi-temporal change detection approach based on OLS regression to detect forest disturbances. The model showed consistent performance across all years and study areas, revealing the varying extents and patterns of forest disturbances. For each period it was attempted to identify a main driver based on recent literature, available datasets and expert knowledge on the study area. It is assumed that the proclaimed main drivers of forest disturbances greatly outweigh all other disturbance agents in the respective year, however, it cannot be ruled out that other disturbance agents did influence the results to a certain degree (Dorigatti et al., 2024; Hallas et al., 2024).
The first period (2017–2018) was treated as the baseline, with damages limited to small areas, with no main driver identified. The following year, damages increased significantly, highlighting the impacts of the storm VAIA and marking the start of a process cascade (Piragnolo et al., 2021; Vaglio et al., 2021). Estimates suggest approximately 67,000 km2 of forest in northern Italy was destroyed or severely impacted (Giannetti et al., 2021). The affected areas were largely homogenous patches, with windthrown trees being removed.
The two subsequent winters were marked by widespread snow breakage events due to heavy snowfall. In combination with clean-up work of storm damages, the peak of disturbances in 2020 can likely be attributed to these events. The diffuse damage pattern of snow-breakage events, blocked forest roads and restrictions imposed by the COVID-pandemic, hindered sanitations efforts and led to large amounts of available breeding material (Hallas et al., 2024).
Starting in 2021, bark beetle populations grew larger due to favourable environmental conditions and an abundance of breeding material. In July, infestations reached an epidemic phase, which led to the infestation of healthy trees and caused unprecedented volumes of damaged wood (Hlásny et al., 2021).
In the following years, major forest disturbances were recorded. The majority resulting from large-scale bark beetle outbreaks and subsequent logging. However, as no reference data is available for 2024, this number may be overestimated, as officials have reported that the peak likely occurred in 2023, the last year which could be validated by the reference dataset (Autonomous Province of Bolzano/Bozen, 2025a).
Model accuracy
The achieved model accuracies (Figure 6) highlight some limitations of the chosen approach. In 2021, accuracies exceeded 60 % only for polygons larger than 1000 m2, most likely resulting from the low number and high uncertainty of reference polygons. Indicating as well that bark beetle infestations were not the sole driver of disturbances during this time period (Dorigatti et al., 2024). In later years, accuracies increased significantly, with averages exceeding 70% in 2022 and 85% in 2024. Minimum polygon area affected overall accuracy across all years and study areas, with an increase for larger polygons, being most pronounced in 2022, where accuracies varied over 30% for different polygon sizes. In other years, the variation was less pronounced, with differences under 10%.
These discrepancies revealed differences in the quality of the reference dataset. In later years, the number and quality of polygons improved, with better delineation of infected stands (Figure 3). The increasing magnitude of outbreaks also heightened awareness, leading to higher quality datasets and more detailed information. To gain further insight into the severity of tree damages, alternative validation protocols based on local field data should be applied. However, as the focus lies on the multi-year trends of infestations, conducting yearly field campaigns to collect high-quality reference data was not feasible due to the high costs associated and the retrospective nature of the study.
The detail maps (Figure 5) revealed different infestation patterns across the study area. Although these four examples could all be validated with the reference dataset, the achieved accuracies reveal that not all patterns were correctly identified, with other disturbance agents also playing a role. The most commonly observed patterns show initial forest damages in 2019 and 2020, most likely a result of windthrow and snow breakage, forming distinct clusters. Then, these areas became increasingly connected, due to new disturbances occurring in close vicinity (Figures 5(c) and (d)), which could be attributed to bark beetle infestations, as they breed in damaged or dying trees and most of the spreading occurs around these nests (Huo et al., 2024; Kautz et al., 2023).
Elevation-driven variations in disturbance dynamics
It could be shown that elevation did influence the distribution of forest disturbances (Figure 7), with the highest forest densities located between 1400 and 1750 m asl. The first three periods recorded higher averages, exceeding 1700 m asl. As the drivers of these disturbances are presumed to be abiotic (windthrow and snow breakage), one possible explanation could be that higher elevations were more exposed to wind and received larger amounts of snow, which in turn resulted in more pronounced damages. On the contrary, the later years revealed higher disturbance densities at comparatively lower elevation levels, being attributed to bark beetle infestation. This discrepancy in elevation could be interpreted as reduced vitality of spruce trees at lower elevations due to warmer temperature and drier conditions (Basile et al., 2024; Faccoli and Bernardinelli, 2014; Jaime et al., 2024), making them more susceptible to infestations due to weakened defence mechanisms (Netherer 2022; Senf and Seidl 2021). However, as only the results from 2021 to 2023 could be validated with reference data, preceding developments need to be further evaluated.
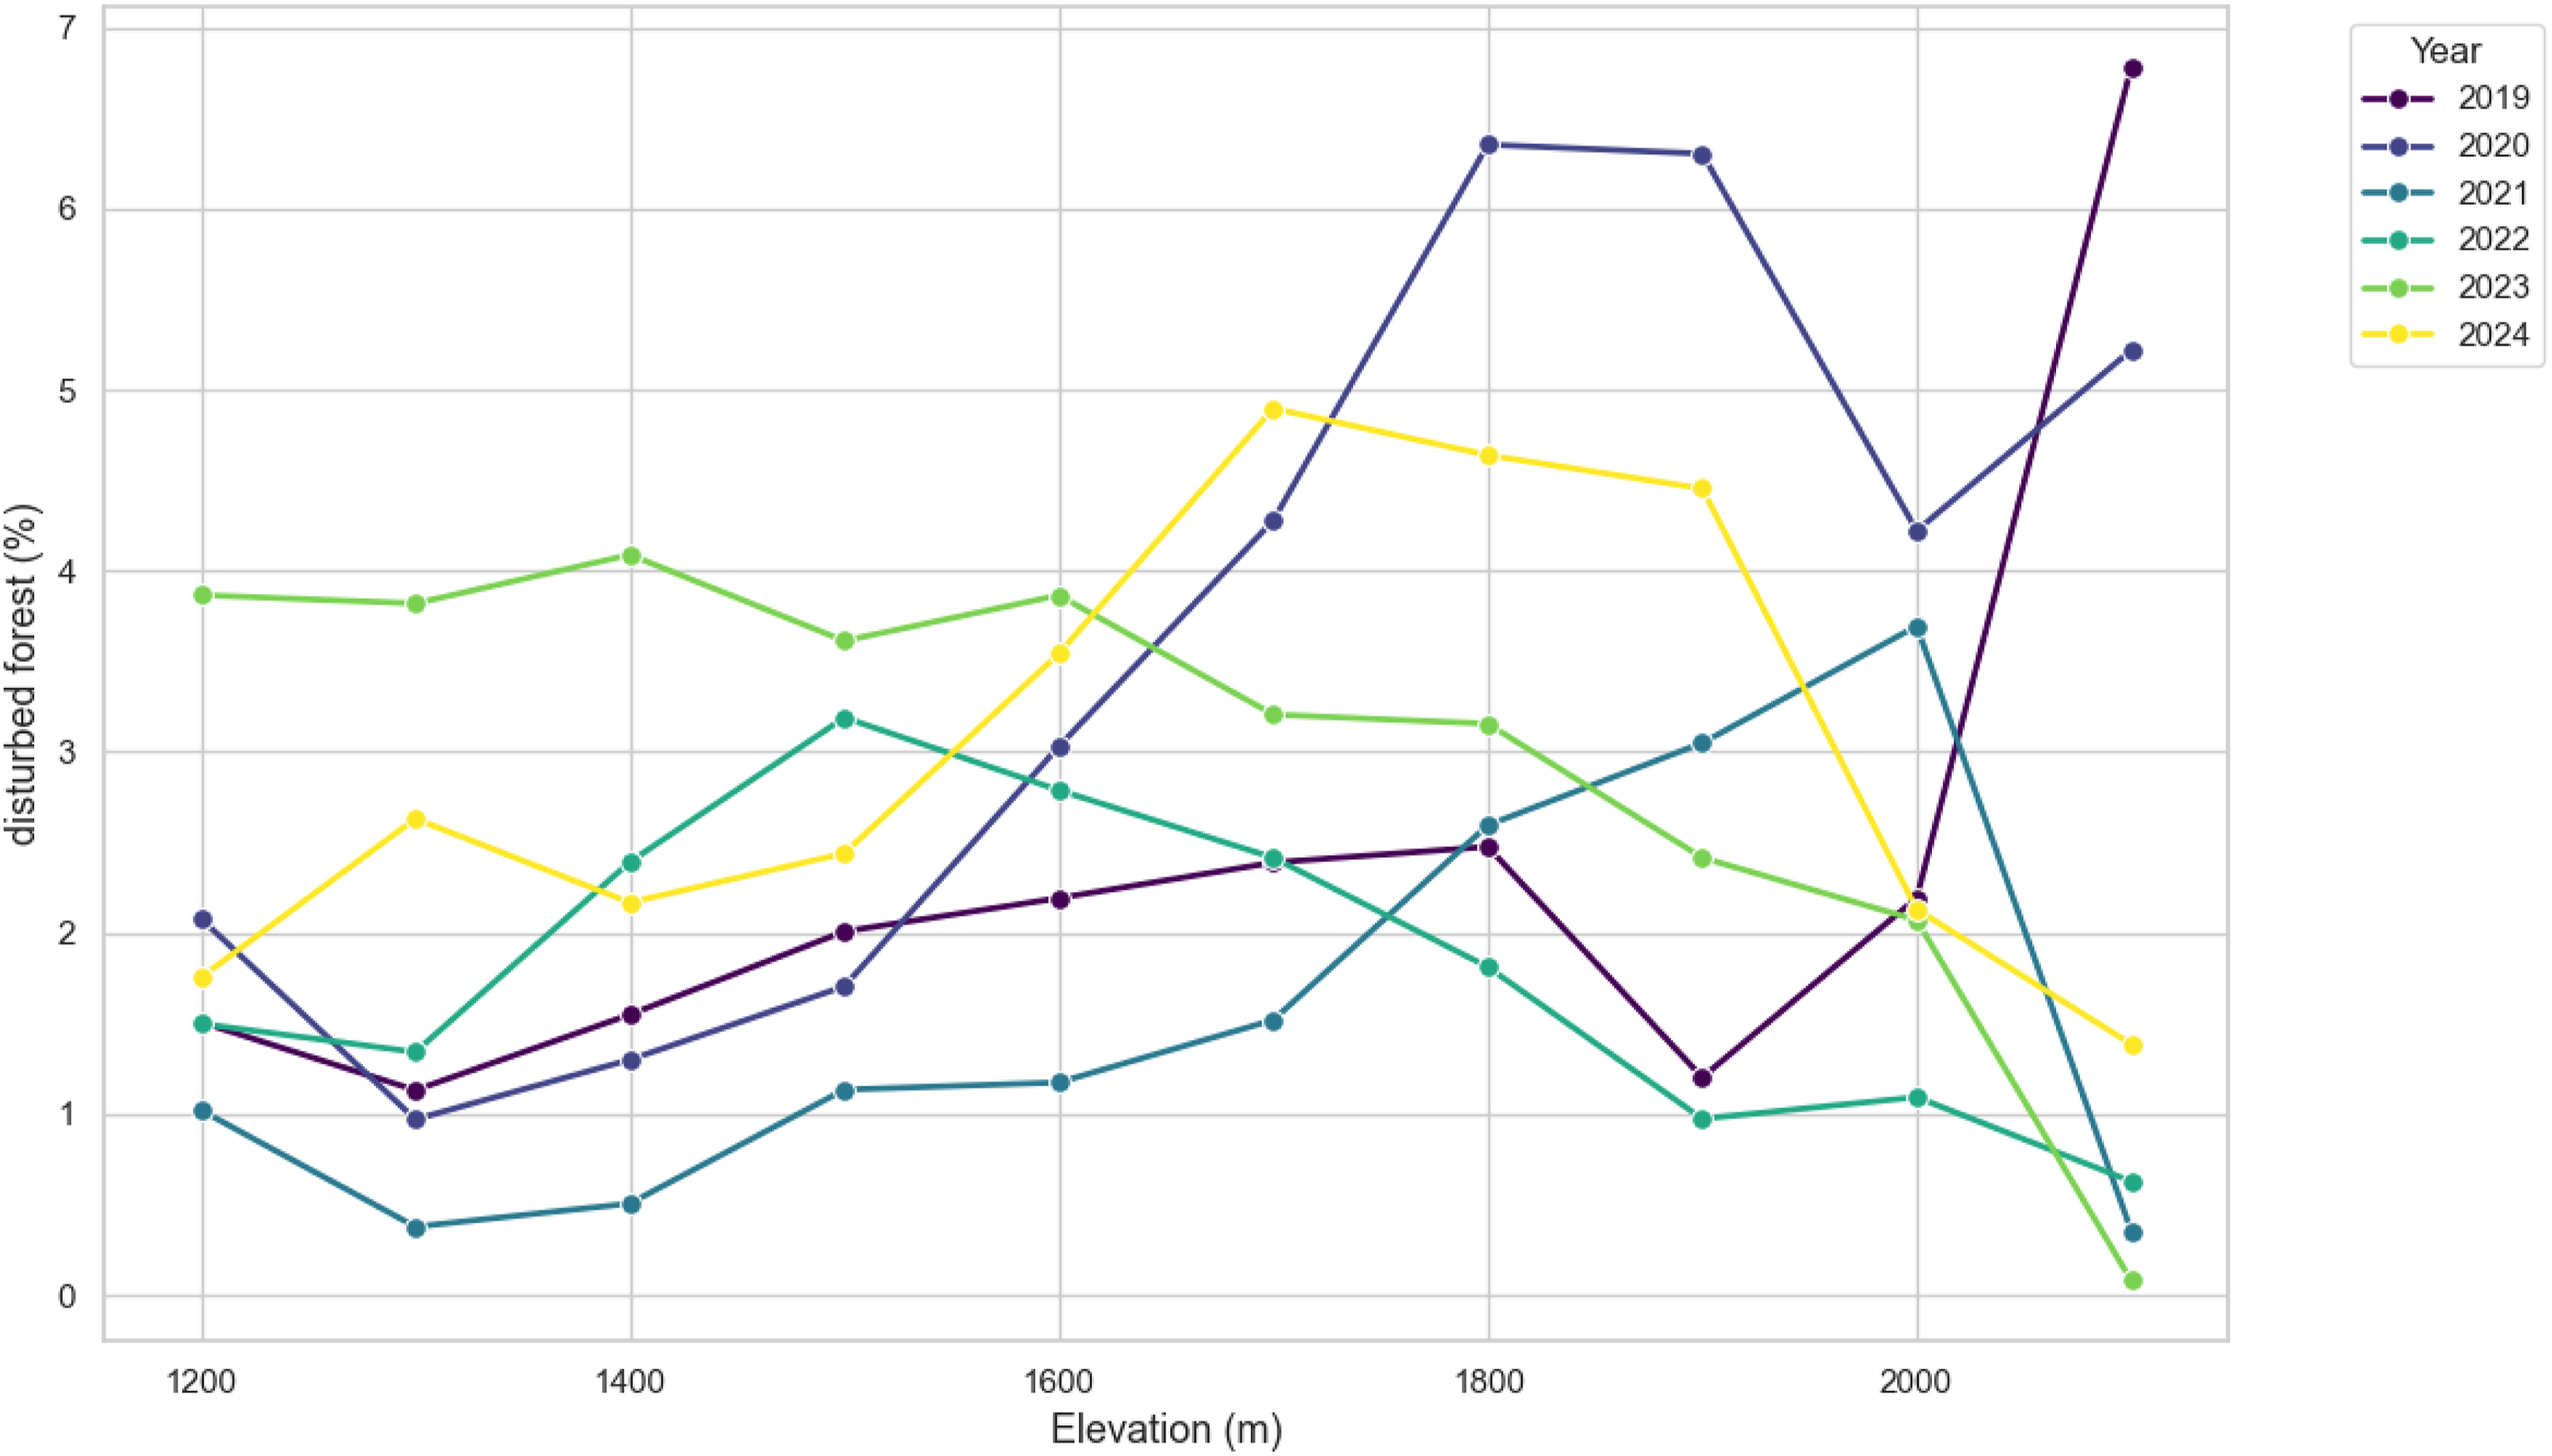
In 2024, the average elevation of damages increased (Figure 4.), which could also be seen in the damage maps (Figure 4). Additionally, the fraction of disturbed forest compared to the total forest area based on 100-meter elevation bins was calculated (Figure 9), showing a similar shift of disturbance rates. This could be a faint signal of bark beetle infestation towards higher elevations. However, there is no reference data available for this year, to validate the results. Additionally, the trend is less pronounced than the previous deviations, reflecting limited interpretability.
Interpretation of achieved bitemporal join count statistic results
The results achieved by the bivariate JCS highlight a strong spatial correlation of forest disturbances during the study period. The number of 1-1-counts exceeded the expected number in every time step, indicating a strong clustering of damages, both biotic and abiotic. Both spatial weight matrices showed similar ratio patterns, with the queen matrix achieving higher rations. Nevertheless, the similarities between the different weight matrices provided clear evidence that disturbances clustered not only in the immediate vicinity but also within a larger perimeter.
The first three periods (2018–2020) recorded a significant increase in disturbed pixels but recorded no significant increase in JCs, indicating a diffuse damage pattern. In the following period, the highest ratio of JCs was observed, resulting not from an increase in damaged areas, as the number declined in 2021, but representing the stronger clustering of disturbances. This is most likely a result of the peak of disturbances in 2020 (Figure 4) with large-scale damages in the northern part of the study area (Figure 5) and subsequent bark beetle infestations. The presumed bark beetle related damages detected in 2021 occurred as a result of abundant brood material, infesting trees in close proximity. Additionally, infestations in this area were recorded in the reference dataset (Figure 5).
The following years saw an increase in disturbed pixels with a high ratio of JCs, indicating a strong clustering of damages. However, the JC-ratio steadily declined, resulting from an increase in expected JCs. A possible explanation is the high number of pixels already classified as disturbed in previous years. Thus, reducing the number of eligible neighbouring pixels, as a pixel is unlikely to be classified as disturbed twice. This is evident in Figures 5(a) and 5(d), where yellow areas neighbour large regions already infested in previous years.
Additionally, edge regions were found to be the most active regions for new disturbances to emerge, while inner regions often lack immediate neighbours. However, as the total number of neighbours increases with a larger weight matrix, the proportion of non-disturbed pixels still outweighs the increase in disturbed pixels, leading to an overall decrease in observed to expected 1-1 JCs (Figure 8).
To the authors best knowledge, there has only been one study done, analysing spatial patterns of bark beetle outbreaks with Moran’s I by (Kamińska et al., 2021). This study reported strong positive spatial autocorrelation with widespread areas being identified as active hotspots, indicating a strong yearly clustering of outbreaks in a study area in Poland from 2015 to 2019. Earlier studies applied different approach to quantify spatial correlation of bark beetle outbreaks. A study by Kautz et al. (2011) analysed a 22-year time series of yearly colour-infrared areal imagery focussing on spatial patterns of dead forest stands. They employed a buffer-based analysis with 100-meter rings around infestations of the previous year. Concluding that the distance to previous infestations is the most accurate predictor of new infestations. A further study analysing a time-series of bark beetle outbreaks was conducted by (Lausch et al., 2013), focussing on focal-point shifts of outbreaks, detecting two distinct phases with the mean focal point shifting from unidirectional to directional. The two studies both focussed on multi-year spatio-temporal patterns of bark beetle infestations. Nevertheless, no statistical metrics of correlation were derived, allowing for limited comparability of findings. The first study applied Moran’s I successfully to analyse yearly infestations and identified local clusters of infestation hotspots. However, no statistical analysis of clustering between multiple years was conducted.
Applications, limitations and outlook
The presented workflow allows for statistical conclusions to be drawn about the spatial clustering of forest disturbances. Focussing on understanding the disturbance dynamics of specific agents and highlighting the potential for analysing the spread of bark beetle infestations. Calculation of spatial autocorrelation based on JCS offers an alternative to quantitively determining spatio-temporal patterns forest disturbances, with a special focus on bark beetle infestations. The application of JCS is not limited to the change detection approach applied in this study. Instead, it works with all rasterised data, resulting in a wide compatibility with studies in and outside this specific field.
However, several uncertainties need to be addressed. First, the reconstruction of forest damages based on Sentinel-2 data and OLS regression doesn’t allow for a clear separation between different disturbance agents and would greatly benefit from additional reference datasets. Therefore, it was not possible to evaluate the influence of disturbance agents other than the presumed main drivers. At best, these results can be compared to studies in the same area (Dorigatti et al., 2024; Hallas et al., 2024), which attributed the disturbances to the same main disturbance agents. As bark beetles often emerge only after an initial disturbance event, a clear separation is often not possible and strongly limited to identifying standing deadwood (Bárta et al., 2021; Dalponte et al., 2022).
Second, the accuracy assessment of the change detection model was only conducted for disturbances related to bark beetles, as reported in the reference dataset. Therefore, no conclusions can be drawn about the extent of other disturbances. This resulted in the validation protocol deviating from classical validation schemes (cf. Fernandez-Carrillo et al., 2020; Marvasti-Zadeh et al., 2024) and limits the comparability due to limitations arising from the reference dataset.
Third, spatial overprediction is not penalised, allowing for a possible overestimation of the detection rate. However, based on visual interpretations, the achieved results showed no significant overestimation. Furthermore, as the validation is limited from 2021 to 2023, the results obtained for previous and later years could not be independently validated, weakening the conclusions drawn of the reported peak and shift in 2024, which need to be further studied.
Fourth, uncertainties also emerge from the forest mask as too strict or lenient masking could lead to erroneous results. The applied forest mask was trained to be strict at landcover transitions to better delineate the forested area. Additionally, threshold setting of the regression model introduces uncertainty. The threshold is defined by the distribution of VI-values across the study area. The shape of the distribution represents the possible variations of the studied forest with respect to topography and therefore determines the detection of disturbances. It was determined by an iterative process, adapted for the study area and limiting the transferability.
Lastly, the threshold determines the number of pixels considered by the JCS. The number of disturbed pixels directly influences the number of observed and expected JCs. Therefore, a high number of disturbed pixels could lead to a high number of joins counts, overestimating the spatial correlation and merely representing the large sample size. The reported results somewhat contradict this hypothesis, as the increase in sample size did not lead to an increase in JC ratio. This was further tested on smaller areas inside the study area, showing no significant correlation between the number of disturbed pixels and the number on JCs. Nevertheless, subsequent studies focussing on JCS should implement a more suitable and robust validation protocol to improve confidence in the achieved results.
Conclusion
This study combined a bit-temporal change detection approach based on OLS-Regression and Sentinel-2 composites with JCS to analyse the spatial correlation of forest disturbances with a focus on reconstructing the interannual spread of bark beetle infestations. The analysis confirmed the research hypothesis and demonstrated a clear correlation of disturbance events throughout the study period. The years which showed the strongest spatial clustering aligned with the main periods of reported bark beetle spread. Thus, highlighting the importance of multi-year analysis of forest disturbances.
Achieved accuracies varied significantly depending on the year and study area, ranging from average accuracies around 50% for 2021 to over 85% in 2023, with discrepancies primarily attributed to the varying quality of the reference dataset.
It could be shown that elevation influenced biotic as well as abiotic forest disturbances. Abiotic disturbances (windthrow and snow breakage) were more pronounced at comparatively higher elevations with biotic disturbances occurring more frequently at comparatively lower elevations. This is hypothesised to be the result of more exposed topography at higher elevations as well as lowered forest resistance at lower elevations. An observed, but unvalidated shift of forest disturbances towards higher elevations needs to be further studied.
To the authors' best knowledge, the application of bivariate JCS represents the first implementation of this spatial statistic approach in the context of forest disturbance mapping. While there have been studies analysing spatio-temporal patterns of bark beetle outbreaks, multi-year patterns are yet to be analysed. JCS provide a means to quantify the spatial correlation of infestations, enabling the analysis of multi-year spatial patterns, revealing trends and insights that are only discernible through multi-year analysis.
The results demonstrate that the chosen approach was effective in tracking the spread of bark beetle outbreaks within the study area, although with limited significance for unvalidated periods. The insights gained from this study can assist forest officials and owners in managing forest disturbances. Specifically, the findings can help concentrate field surveys around already infested areas, thereby improving the efficiency of monitoring and management efforts.
Footnotes
Acknowledgements
The authors would like to thank the Department of Forest Planning of the Autonomous Province of Bolzano/Bozen for providing the reference dataset on bark beetle infestations.
Ethical considerations
This article does not contain any studies with human or animal participants.
Consent to participate
There are no human participants in this article and informed consent is not required.
Funding
The authors disclosed receipt of the following financial support for the research, authorship, and/or publication of this article: This study was conducted within the framework of the research project ‘BeatTheBeetle - Early detection of the spruce bark beetle in Austria using remote sensing’ (project ID: FO999911948), funded by the Austrian Research Promotion Agency (FFG), Austria Space Program (ASAP).
Declaration of conflicting interests
The authors declared no potential conflicts of interest with respect to the research, authorship, and/or publication of this article.
Data Availability Statement
All datasets used in this study are available from the authors upon request.
Appendix
Fraction of yearly disturbed forested area based on 100-meter elevation bins. Markers are placed at the upper boundary of each elevation bin.