
Abstract
An existing national-scale Landsat dynamic surface water dataset over Canada is leveraged to map coastlines in 5-year periods centred on 1987, 2003 and 2019. The spatial and temporal consistency in shoreline locations mapped due to tide level variation is verified using simulations with tide gauge data, and high-resolution WorldView-2 scenes are used to benchmark shoreline positional accuracy. Shoreline change is mapped between periods, and erosion, accretion, and stability are calculated for Canadian Arctic and southern coastal regions. Simulations indicate that the variance in mapped shoreline position due to random sampling of clear-sky Landsat pixels is similar or less than that of tide modelling used in other studies. The shoreline positional accuracy is within one Landsat pixel with a consistent seaward bias, which is comparable to benchmark results for Landsat shoreline extraction algorithms over a micro-mesotidal site with a wide intertidal zone. Between 1987 and 2003, accretion dominated in the Arctic and erosion in southern Canada. While erosion continued to dominate between 2003 and 2019 in southern regions, the Arctic region switched from being accretional to net erosional, possibly due to climatic effects overtaking isostatic rebound. A comparison of the derived coastal dynamics and the CanCoast Sensitivity Index (CSI), which represents an aggregate measure of coastal physical susceptibility to climate change, shows strong monotonic relationships in both Arctic and southern study regions, confirming the consistency between both datasets.
Introduction
Canada’s coasts are considered paraglacial due to late-Holocene relative sea-level changes that have interacted with the pre-existing glaciated topography and glacigenic sediments, to form present day coastal landforms through processes that continue to be profoundly influenced by this glacial legacy (Forbes and Syvitski, 1994). Together Canada’s marine coasts span 39.7 degrees of latitude and 88.4 degrees of longitude with a combined length of approximately 344,000 km (Figure 1), 70 % of which lies within the zones of continuous and discontinuous permafrost (O’Neill et al., 2022; Manson et al., 2019). They include iconic landscapes such as fjords of the Pacific and Arctic coasts, sandy barrier beaches and eroding headlands of the Atlantic, and ice-rich eroding cliffs of the Beaufort. The central and much of the eastern Canadian Arctic is emergent due to post-glacial uplift and regression is broadly anticipated to continue to outpace accelerated sea-level rise beyond the time range of typical climate change projections (James et al., 2021), except near the 0 mm/a vertical motion isopleth where relative sea-level change may be expected switch from falling to stable or stable to rising. Parts of the Atlantic and the Beaufort coasts were uplifted on peripheral forebulges (Hill et al., 1985; Quinlan and Beaumont, 1981) during the last glaciation. Forebulge migration and subsidence generally occurs over millenia while eustatic sea-level rise is expected to increase rapidly, contributing to accelerated relative sea-level rise in these areas (James et al., 2021). Post-glacial vertical crustal motion due to alpine glaciation and subduction-related neo-tectonics complicates relative sea-level trends along the Pacific coast, but in general relative sea-level rise is anticipated to accelerate in future climate projections (James et al., 2021). Location map in Lat/Long Lambert Conformal Conic showing the coastlines of the Arctic study region between 66.5° N and 76° N, and southern region below 66.5° N with inset boxes showing Tuktoyaktuk and Charlottetown and the locations of sites in Figure 4.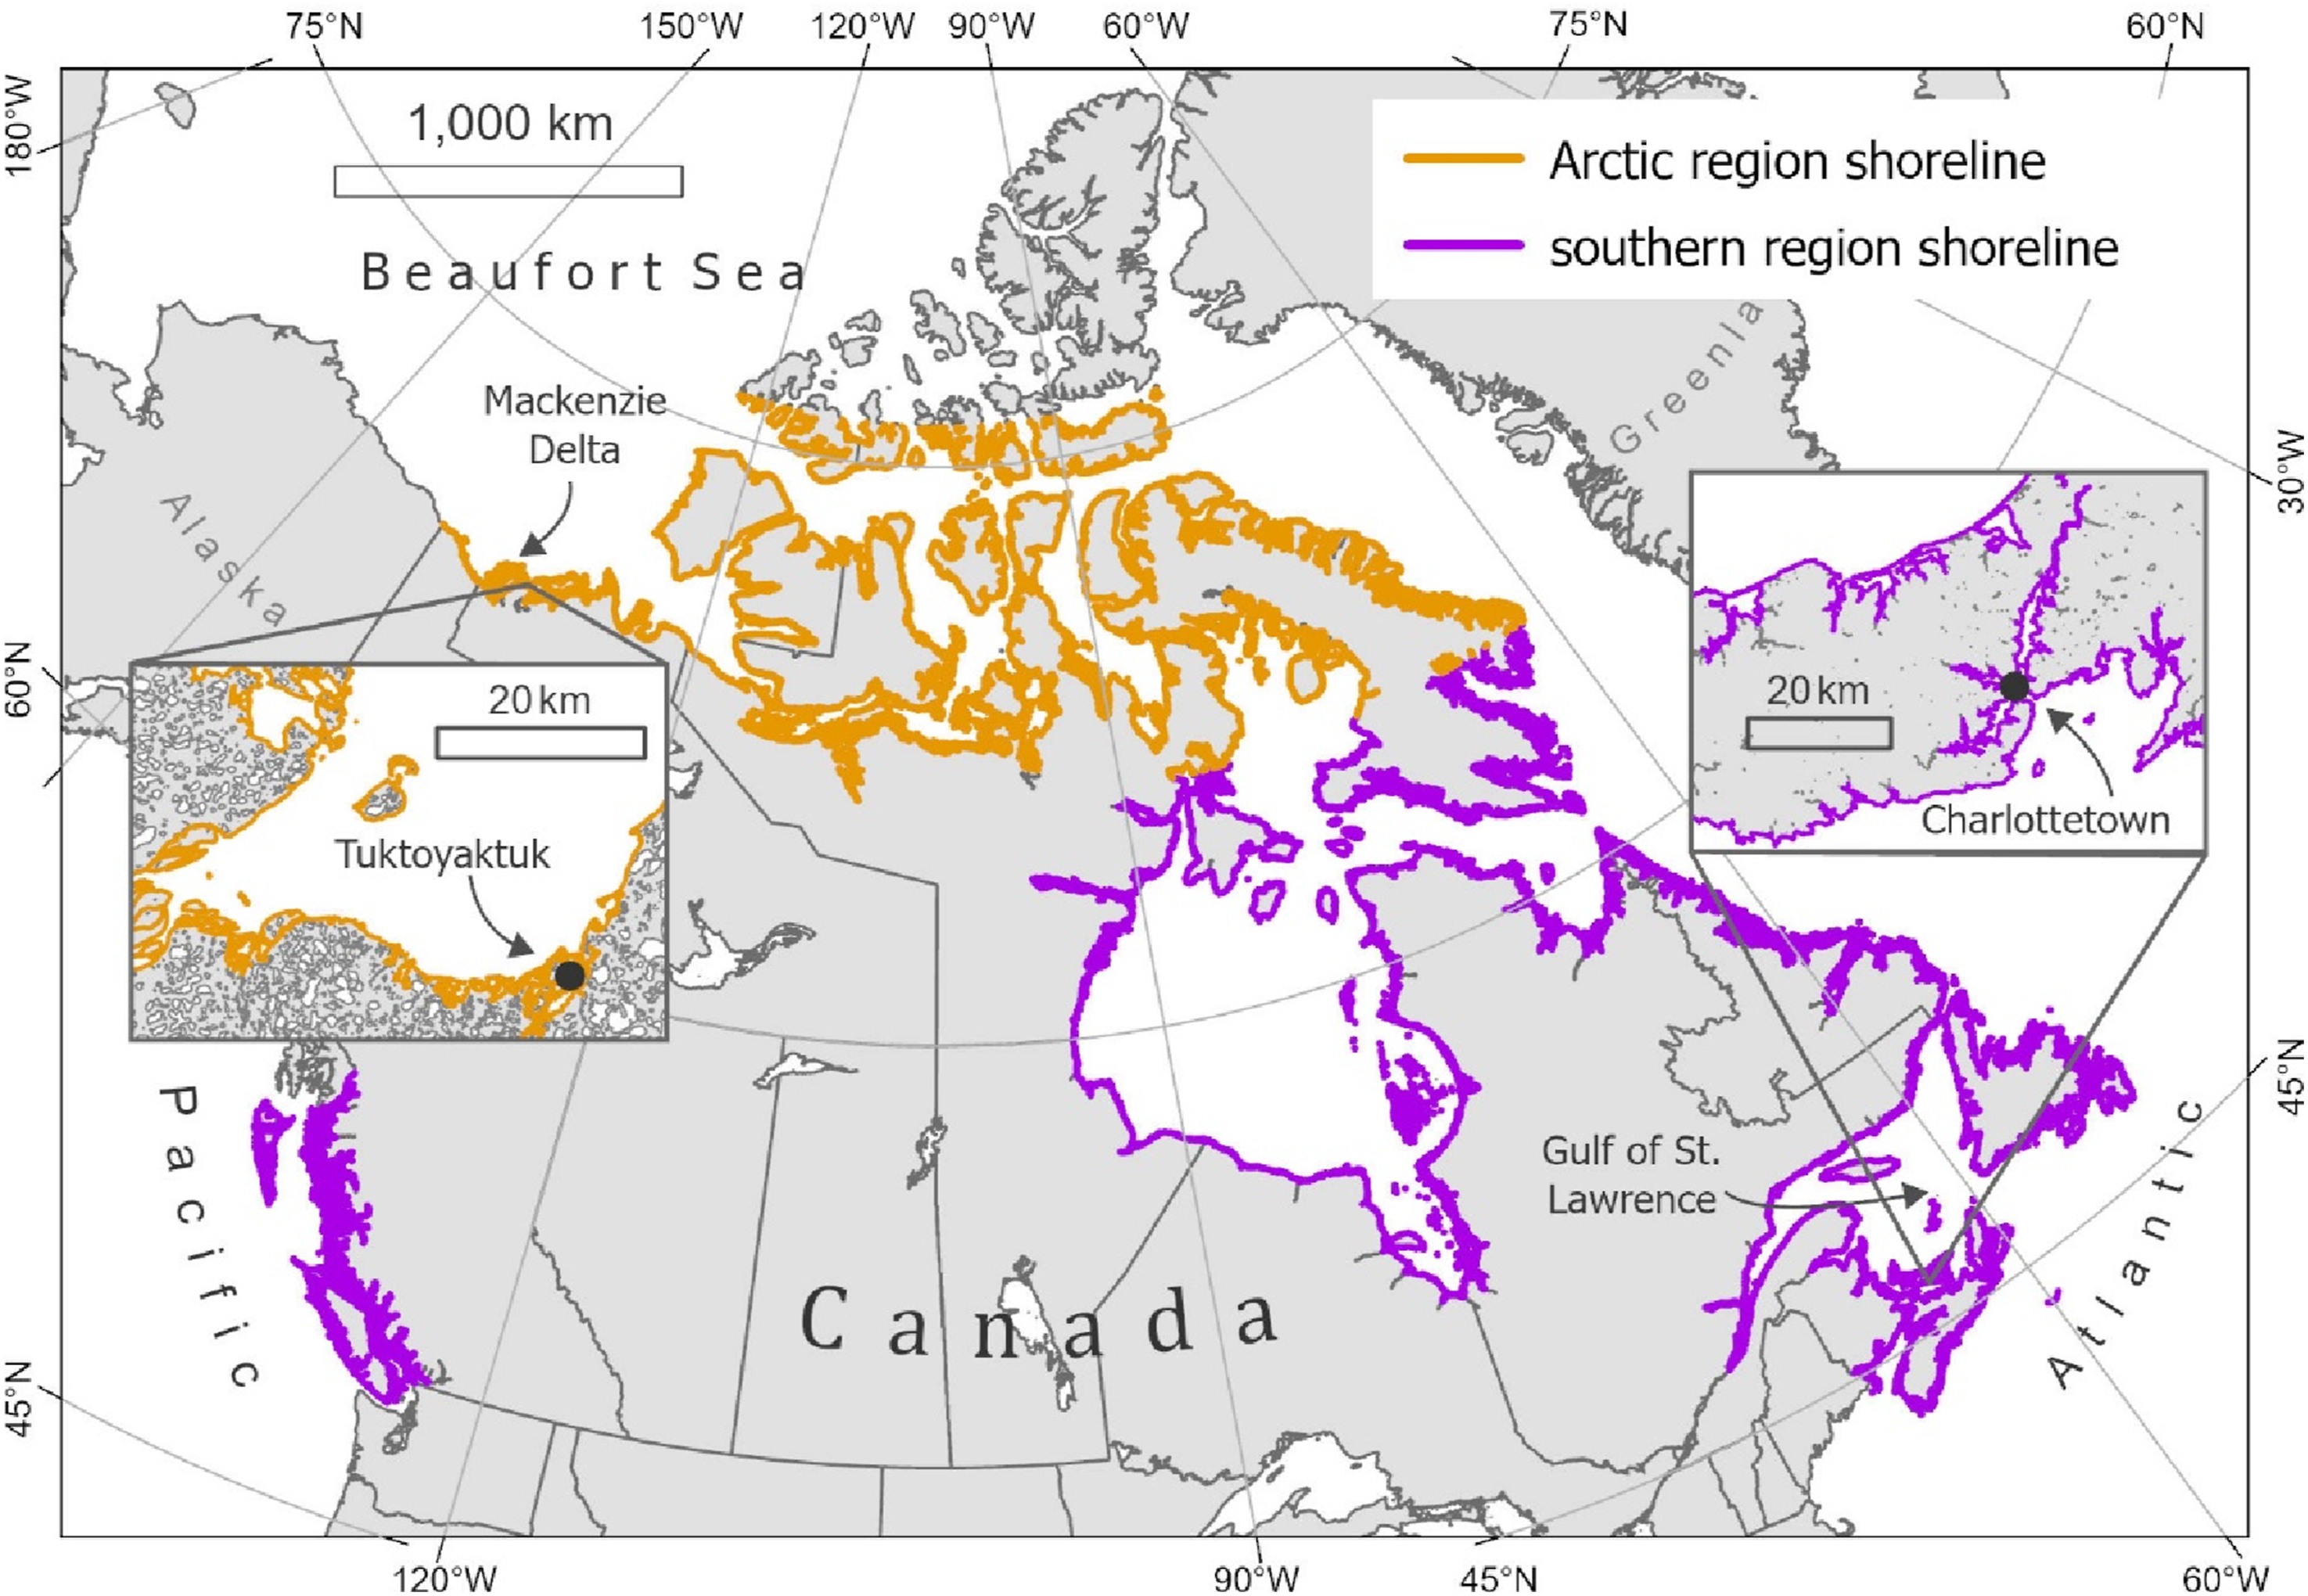
In addition to relative sea-level changes, the impacts of ongoing climate change include changes in wave heights due to a combination of shifting storm tracks and decreased sea ice (Casas-Prat et al., 2024; Collins et al., 2019; Cooley et al., 2022). Most of Canada’s coast is affected by sea ice and some of the lowest latitude sea ice in the world is found in the Gulf of St Lawrence (Figure 1). The roles of sea ice in coastal dynamics are varied and complex (Forbes and Syvitski, 1994; Theuerkauf et al., 2024). Firstly, sea ice can accelerate dynamics through direct advection of sediment and by inducing scour and sediment re-suspension for transport by currents (Barber et al., 2021; Kempema et al., 1989; Reimnitz et al., 1990), meanwhile secondly limiting fetch and the height to which waves can form and attenuating the energy of waves that do form as they pass through sea ice and the nearshore ice complex (Manson, 2022; Squire, 2020; Wadhams et al., 1988) prior to reaching the shore. Where long-term relative sea-level rise and increased wave energy coincide, sea-level and waves force coastal dynamics, suggesting that coastal change can be expected to accelerate in the coming decades (Wright and Thom, 2023). The Arctic appears to be particularly susceptible (Previdi et al., 2021), where accelerated coastal retreat is not only a result of climate change, but also a driver through the release of organic carbon in coastal permafrost (Nielsen et al., 2022) and reduced Arctic Ocean CO2 uptake due to coastal permafrost erosion (Nielsen et al., 2024).
Coastal dynamics have broad consequences for coastal communities, structures and ecosystems (Lemmen et al., 2016). With the potential for increased marine pollution due to increasing ship traffic in the Arctic, helicopter videography is collected in Canada as part of the Shoreline Cleanup and Assessment Technique (SCAT) (ECCC, 2018), but this mapping does not indicate coastal dynamics that affect the persistence and transport of pollutants relevant to cleanup following a contaminant spill (Owens, 1994). Other coastal information includes Canada-wide baseline mapping of marine coastal characteristics in CanCoast2025, allowing the calculation of a revised Coastal Sensitivity Index (CSI) that indicates dynamics (Manson and James, 2025). Sensitivity can be considered the degree to which a system is susceptible either adversely or beneficially to climate-related stimuli (Lemmen et al., 2016) based on physical characteristics. Coasts respond dynamically to meteorological and oceanographic forcing indicated by spatially and temporally varying erosion, accretion and stability, and the CSI is an indicator of how dynamic the shoreline response to forcing will be. Both the SCAT and CanCoast datasets can be enhanced with coastal change information derived from satellite data that provides a direct measure of coastal dynamics. These measurements can be used to calibrate and verify statistical and other modelling approaches to investigating coastal sensitivity by objectively adjusting input weightings, while a sensitivity index from a variety of independently mapped sources can substantiate measurements of coastal change derived from remote sensing, as described here.
Twentieth century coastal change has been studied using historical aerial photography and manual digitizing of shoreline position (e.g. Cameron, 1965; Dolan et al., 1978; Thieler and Danforth, 1994a, 1994b; Solomon, 2005; Eamer et al., 2022). These studies are typically local to regional in scale and are often combined with field studies and regional compilations such as the Arctic Coastal Dynamics (ACD) database (Jones et al., 2020; Lantuit et al., 2012). Combining field and airborne data collection, recent studies have investigated the use of Uncrewed Aerial Vehicle (UAV) imagery and elevation derived from structure from motion or LiDAR to measure dynamics of coastal dunes and other landforms (e.g. Gibbs et al., 2019; Gonçalves and Henriques, 2015; Laporte-Fauret et al., 2019; Whalen et al., 2022). At the national scale, historical Landsat imagery is used to map tide-corrected multi-decadal shoreline change at sub-30 m pixel resolution in Australia (Bishop-Taylor et al., 2021) and globally Landsat has been used to measure rates of change on sandy coasts (Luijendijk et al., 2018). Additionally, spatially explicit coastal erosion and accretion have been generated at the global scale from the Global Surface Water Explorer (GSWE) dataset generated from multi-decadal satellite observations (Mentaschi et al., 2018). In that study, transitions between sea, active zone and land classes were mapped along transects drawn perpendicular to the coastline spaced 250 m apart.
At larger scales, coastal mapping relies on satellite data. The availability of free, continuous satellite data archives going back more than four decades, combined with a growing need to address coastal issues, has motivated the development of several satellite-derived shoreline mapping algorithms in recent years. Vos et al. (2023) benchmarked five presently available algorithms applied to Landsat data over four sandy beach sites with historical in-situ cross-shore transect surveys. The evaluated algorithms extracted shorelines either at-pixel or sub-pixel scales using combinations of water indices, classification and Otsu thresholding methods applied to instantaneous images that were tide-corrected using nearshore topography, or composite images to minimize the effect of tide on mean sea level or high-tide level shoreline position. All algorithms provided horizontal accuracy of roughly 10 m at microtidal sites, and more than 20 m at a high-energy macrotidal site with complex foreshore morphology. They rightly noted that the reliability of Satellite-Derived Shoreline (SDS) positional change relies on its magnitude relative to the precision of instantaneous shoreline extraction, commonly expressed as a signal-to-noise ratio. Over longer time-periods when change is generally greater, positional change trends tend to be clearer, easier to detect and therefore more reliable because the change signal is larger relative to the precision of shoreline extraction.
In recent years, several Landsat-based historical dynamic surface water datasets have been produced at national (Olthof and Rainville, 2022) and global scales (Pekel et al., 2016; Pickens et al., 2020), enabled by cloud computing and freely available Landsat data. Algorithms applied to extract water generally as opposed to coastlines specifically presents an alternative approach to SDS that may be well-suited to study coastal change. Olthof and Rainville (2022) used a generic algorithm originally developed for flood mapping from a range of optical and radar satellite data available during a flood event. Their method classifies each scene using a combination of machine learning trained on permanent land and water targets derived from existing inundation maps, followed by region growing and filtering. Its performance is robust since machine learning classification is trained and applied to each scene and is therefore sensor and calibration agnostic. Further, machine learning is insensitive to errors in training data up to about 30 % (Olthof and Tolszczuk-Leclerc, 2018), which means that extremely rare cases, where large mismatches exist between the inundation product used to select training samples and the classified image, will still generally produce an accurate output as long as differences represent less than 30 %. Accurate land/water image classification should produce reliable waterline locations to monitor coastal change.
These dynamic surface water datasets provide the first opportunity to study large-scale waterline changes along Canada’s coastline due to erosion and accretion under different sea-level trends with unprecedented detail. The objectives of this study are first to map Canada’s marine shoreline in three periods spaced 16 years apart at circa-1987, -2003, and -2019, and validate shoreline consistency, position and changes against the best available, near-coincident reference tide gauge and high-resolution satellite data. Second, we map coastline change between periods to the nearest shoreline pixel and report changes for Canada south of 76° N, and separately in southern and Arctic regions (Figure 1). Finally, we examine relations between coastline changes and coastal sensitivity measured by the CanCoast CSI to begin to investigate the spatio-temporal variability of coastal dynamics in Canada. A 30 m resolution Landsat-based raster shoreline with gridded rates of erosion and accretion is developed that can be used to enhance existing Canadian coastal datasets.
Study areas
For these analyses, we consider a 111,000 km length of Arctic shoreline between 66.5° N and 76° N and the shoreline south of 66.5° N with a length of 206,000 km (Figure 1). The Arctic study region lies completely within the continuous permafrost zone, and approximately 24 % of the backshore is bedrock, whereas 55 % of the southern shoreline has no permafrost and 55 % of the backshore is bedrock. Thick till is found on nearly 45 % of the Arctic shoreline compared to 22 % in the south. Alluvial and organic sediments form less than 3 % of the Arctic and southern shorelines with alluvial more common in the Arctic and Organic more common in the south. Tidewater glaciers and ice shelves comprise approximately 2 % of the Arctic shoreline.
In each of the Arctic and southern regions we select one site for closer examination. The sites were selected based on them being well-studied exemplars in their regions of a particularly sensitive (i.e. dynamic) type of shoreline (Forbes et al., 2014). The southern study site on the North Shore of Prince Edward Island (PEI) consists of characteristic red sandstone or sandy till cliffs with Holocene coastal deposits in beaches, spits, dunes and salt marshes. Offshore sand exists in flood and ebb-tidal deltas, forming a sheet thinning with depth and becoming sparse in approximately 30 m water depth. Relative sea level has been rising at 3.2 mm/yr over the last century and is accelerating. Tides are mixed semi-diurnal with a range of 1.1 m. The climate is cold temperate (Köppen Dfb or humid continental) and the area is affected by tropical cyclones tracking northward along the Atlantic coast and by winter storms whose impacts are ameliorated somewhat by partial sea ice cover between January and April. Storm waves can reach significant heights up to 8 m with periods up to 11 s.
The local Arctic study site is Tuktoyaktuk on the Beaufort Coast adjacent to the mouth of the Mackenzie Delta. The area was exposed by falling sea level prior to the last glacial maximum and permafrost penetrated into thick fluvial and marine sediments to depths up to 700 m before post-glacial transgression. Relative sea level is rising at a rate similar to that of the PEI site (approximately 3 mm/yr). The climate is low-arctic (Köppen ET or polar tundra), and northwesterly storms are common in the June to October open water season, which bring waves up to 4 m height with peak periods up to 10 s. During the rest of the year the shoreline is protected from wave impact by complete sea ice cover, although the annual duration of complete cover is decreasing. The area is microtidal with a range of less than 0.5 m and much of the variability in water level meteorologically forced and storm surges exceeding 2 m are common.
Methods
This study considers the changes in the position of the land-water interface, or shoreline as depicted in planform on a map. Changes in the shoreline position are generally attributed to coastal erosion and accretion, representing the removal and addition of sediment, respectively. Change over the short term can also result from varying tidal height and, over the long term, changing relative sea-level.
Shoreline extraction
Landsat-based, 30 m resolution annual water masks over all of Canada from Olthof and Rainville (2022) were combined to map shoreline position and examine change, representing three separate 5-year time-periods between 1985–1989, 2001–2005 and 2017–2021. Individual time-periods corresponding to median years 1987, 2003 and 2019 spaced 16 years apart were generated from 5 years’ worth of data to ensure a sufficient number of measurements for reliable shoreline extraction and good coverage as far north in the Arctic as possible, since a shorter ice-free season and frequent cloud cover limits the number of valid Landsat observations northward. Landsat data used to generate masks were acquired within a relatively short annual timeframe between the months of June to August inclusively in the high Arctic above 68°, becoming progressively longer to the beginning of April until the end of October in the south below 60° to account for a longer snow-free season. The number of snow and cloud-free annual per-pixel observations varied from approximately 12 along Canada’s most southern coastlines, to as few as 3 in the Arctic Archipelago (roughly 15–60 valid observations over 5-year periods). Each annual mask maps water if detected at a pixel location in any scene acquired in that year, and therefore represents the maximum annual water extent for the whole snow- and ice-free season. Annual masks were combined in 5-year time-periods by calculating the percentage inundation at each pixel location. The coastline was extracted from each 5-year inundation product as the most landward pixel where inundation was 100 %, that is, water was present in all 5 years, to represent shoreline position for that time period. Therefore, shoreline position is mapped as the most landward location where annual maximum ocean water extent was situated in five consecutive years. A recent study by Nylen et al. (2025) also used 5-year time-periods of Landsat to extract the most frequent coastal land cover to map coastal change across the Arctic from 1984 to present.
The CanCoast marine shoreline (Manson and James, 2025) was used to constrain the Landsat shoreline extraction to within a 1 km seaward and 4 km landward buffer of its position. Within this buffer, 5-year inundation was binarized to land and water where inundation was 0 % and 100 %, respectively, and discrete inshore waterbodies smaller than 5000 pixels were removed. A boundary function was applied to this sieved coastline buffer to extract the shoreline, represented as a line with the width of a 30 m pixel. Analyses were limited to south of 76° N where cloud, snow and ice do not preclude the viability of Landsat for shoreline mapping.
Landsat water levels
In order to reliably detect shoreline change, consistent water levels must be mapped to ensure that the signal represents long-term change and not short-term tidal variation. To assess water level consistency in our shoreline products, tide model predictions and observations were downloaded for two stations (CHS, 2022); one in Tuktoyaktuk, Northwest Territories (NWT) in the Arctic and the other in Charlottetown, (PEI) in the south (Figure 1), with complete data for the annual Landsat compositing period in 2023 from June 1 to August 31 in the Arctic, and April 1 to October 31 in the south (Olthof and Rainville, 2022).
Simulations were run for 1 to 12 valid annual Landsat observations by simple random sampling of dates from water height observation data records. While the minimum number of annual Landsat observations is 3 except in rare cases, sampling of as few as one date per year was included to determine the effects of sparse sampling. A first sample was initially randomly selected within the same snow-free season as Landsat at the same latitude, with subsequent samples selected from 8-day intervals from the first assuming two satellites in orbit simultaneously, each with a 16-day revisit. Over the length of the 30 m Landsat record beginning in the early 1980s, there have been between one and three satellites in orbit simultaneously depending on the timing of launch and failure of successive missions. Water heights were obtained from sample dates and Landsat overpass times at each location, and the maximum value was retained representing the maximum annual water extent mapped in individual Landsat masks.
This process was repeated five times to obtain the maximum water extent for individual annual masks input into each 5-year period. Because the final 5-year mask represents water that is present in all annual masks, the lowest water level, or minimum of the five annual maximums, was selected to represent the water level in the 5-year mask. Combining water level measurements into 5-year intervals in this manner was repeated 100 times for each number of valid annual observations from 1 to 12 to assess the variance in sampled water levels due to random Landsat date selection and compositing, both within and between numbers of valid observations. Within number of Landsat sample variance provides statistical information on how variable water level sampling is between nearby pixels in a region, and also between dates within a region that tend to contain a similar number of valid Landsat samples. Between number of annual Landsat samples from 1 to 12 informs the differences in mapped water levels between regions since the Arctic contains fewer per-pixel observations than the south.
Shoreline positional validation
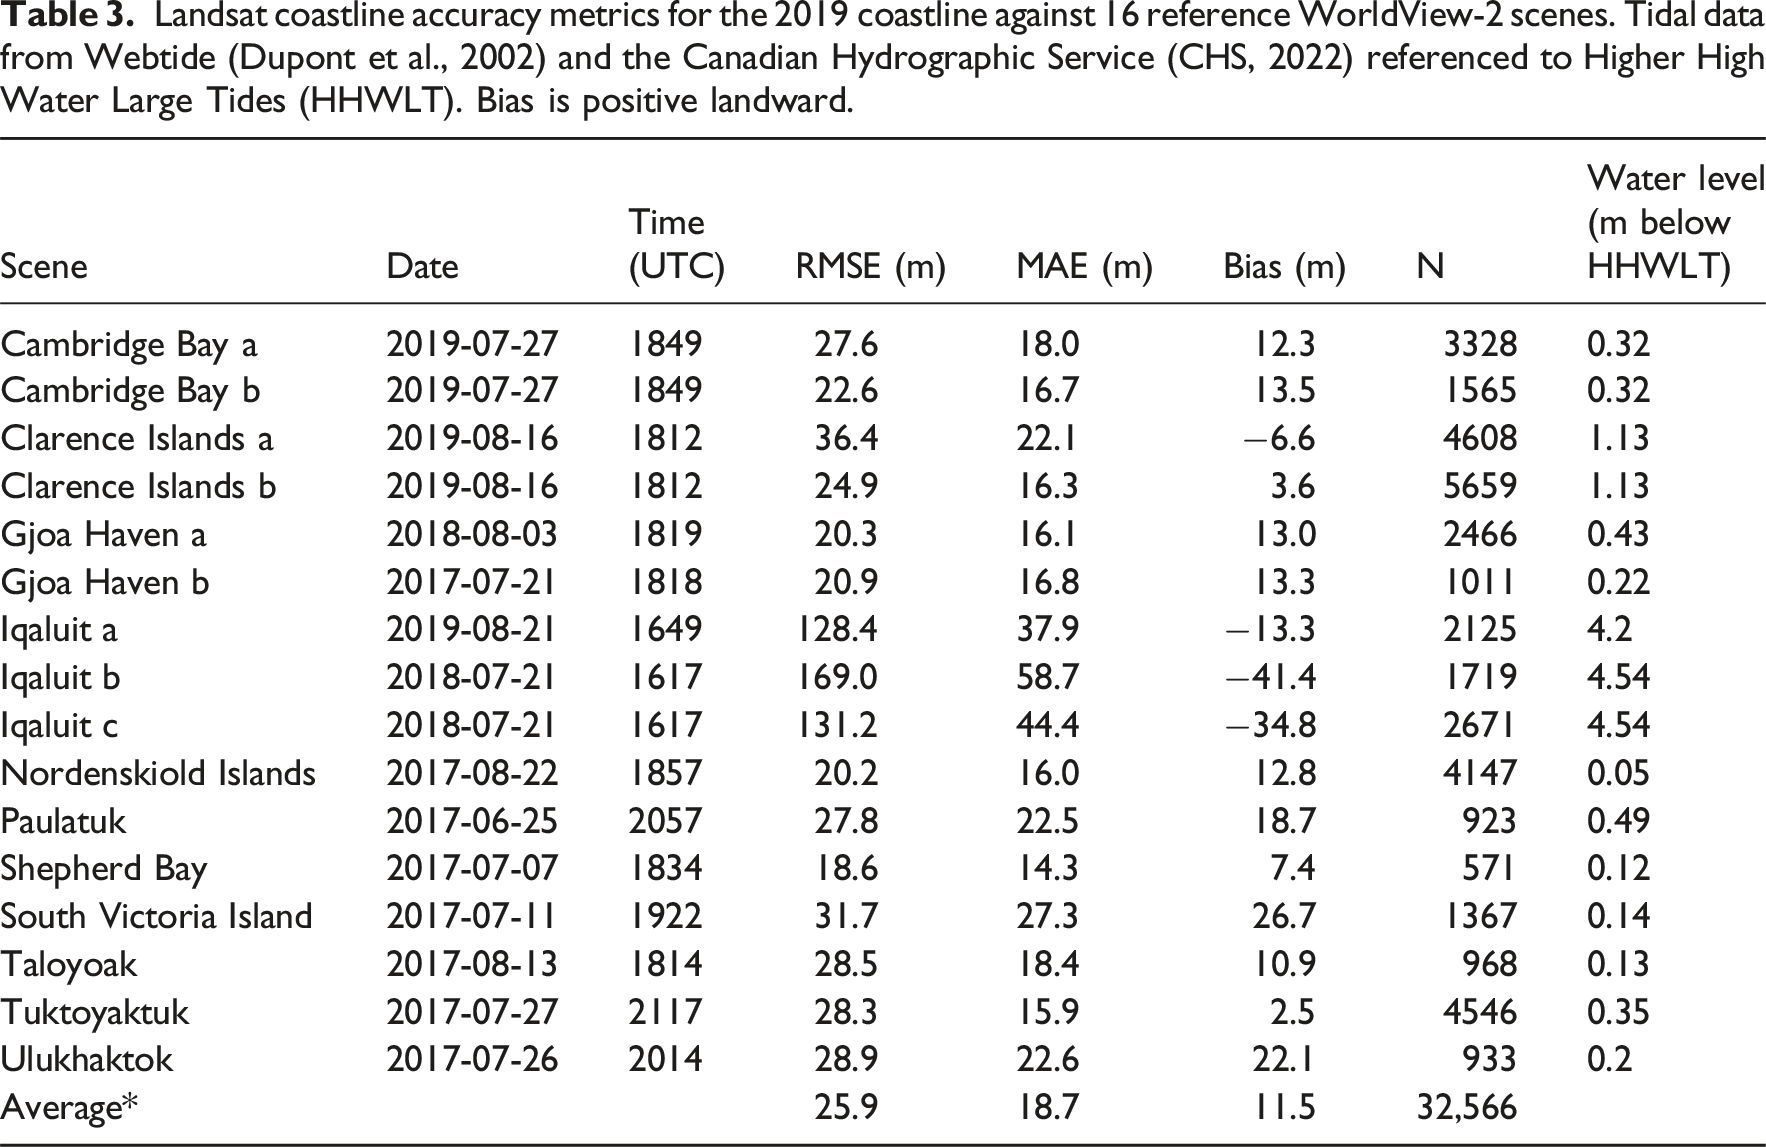
Sixteen orthorectified WorldView-2 scenes acquired on anniversary dates between June 25 and August 22, and years 2017–2019 located over coastal communities in the Arctic (Figure 2) with diverse shoreline characterises (Table 1) were purchased with two-dimensional accuracies of 6.18 m reported by the provider. Images consisted of four spectral bands in visible and NIR wavelengths with a pixel spacing of 0.5 m. Water masks were produced using fully automated methods adapted from Olthof (2019) that were originally developed for operational flood mapping, followed by manual editing to remove omission and commission errors. Coastal waters were identified using the CanCoast shoreline and inland water bodies were removed from masks. The shoreline was delimited as water pixels located adjacent to land with a width of a single 0.5 m cell. Positional accuracy of the 2019 shoreline located beneath individual WorldView scenes was calculated as the nearest-neighbour distance from the centre of Landsat pixels to the centre of WV coastline pixels. Statistics presented in the benchmark study by Vos et al. (2023) were calculated for each scene for comparison to the five methods presented in that study, including mean absolute error (MAE), root mean square error (RMSE) and bias. Location map in Lat/Long Lambert Conformal Conic of 16 WorldView scenes with the number of scenes per location in parentheses used to validate the positional accuracy of the 2019 Landsat coastline. Shoreline descriptions of locations in Figure 2 covered by 16 WorldView images used to validate the positional accuracy of the 2019 Landsat coastline.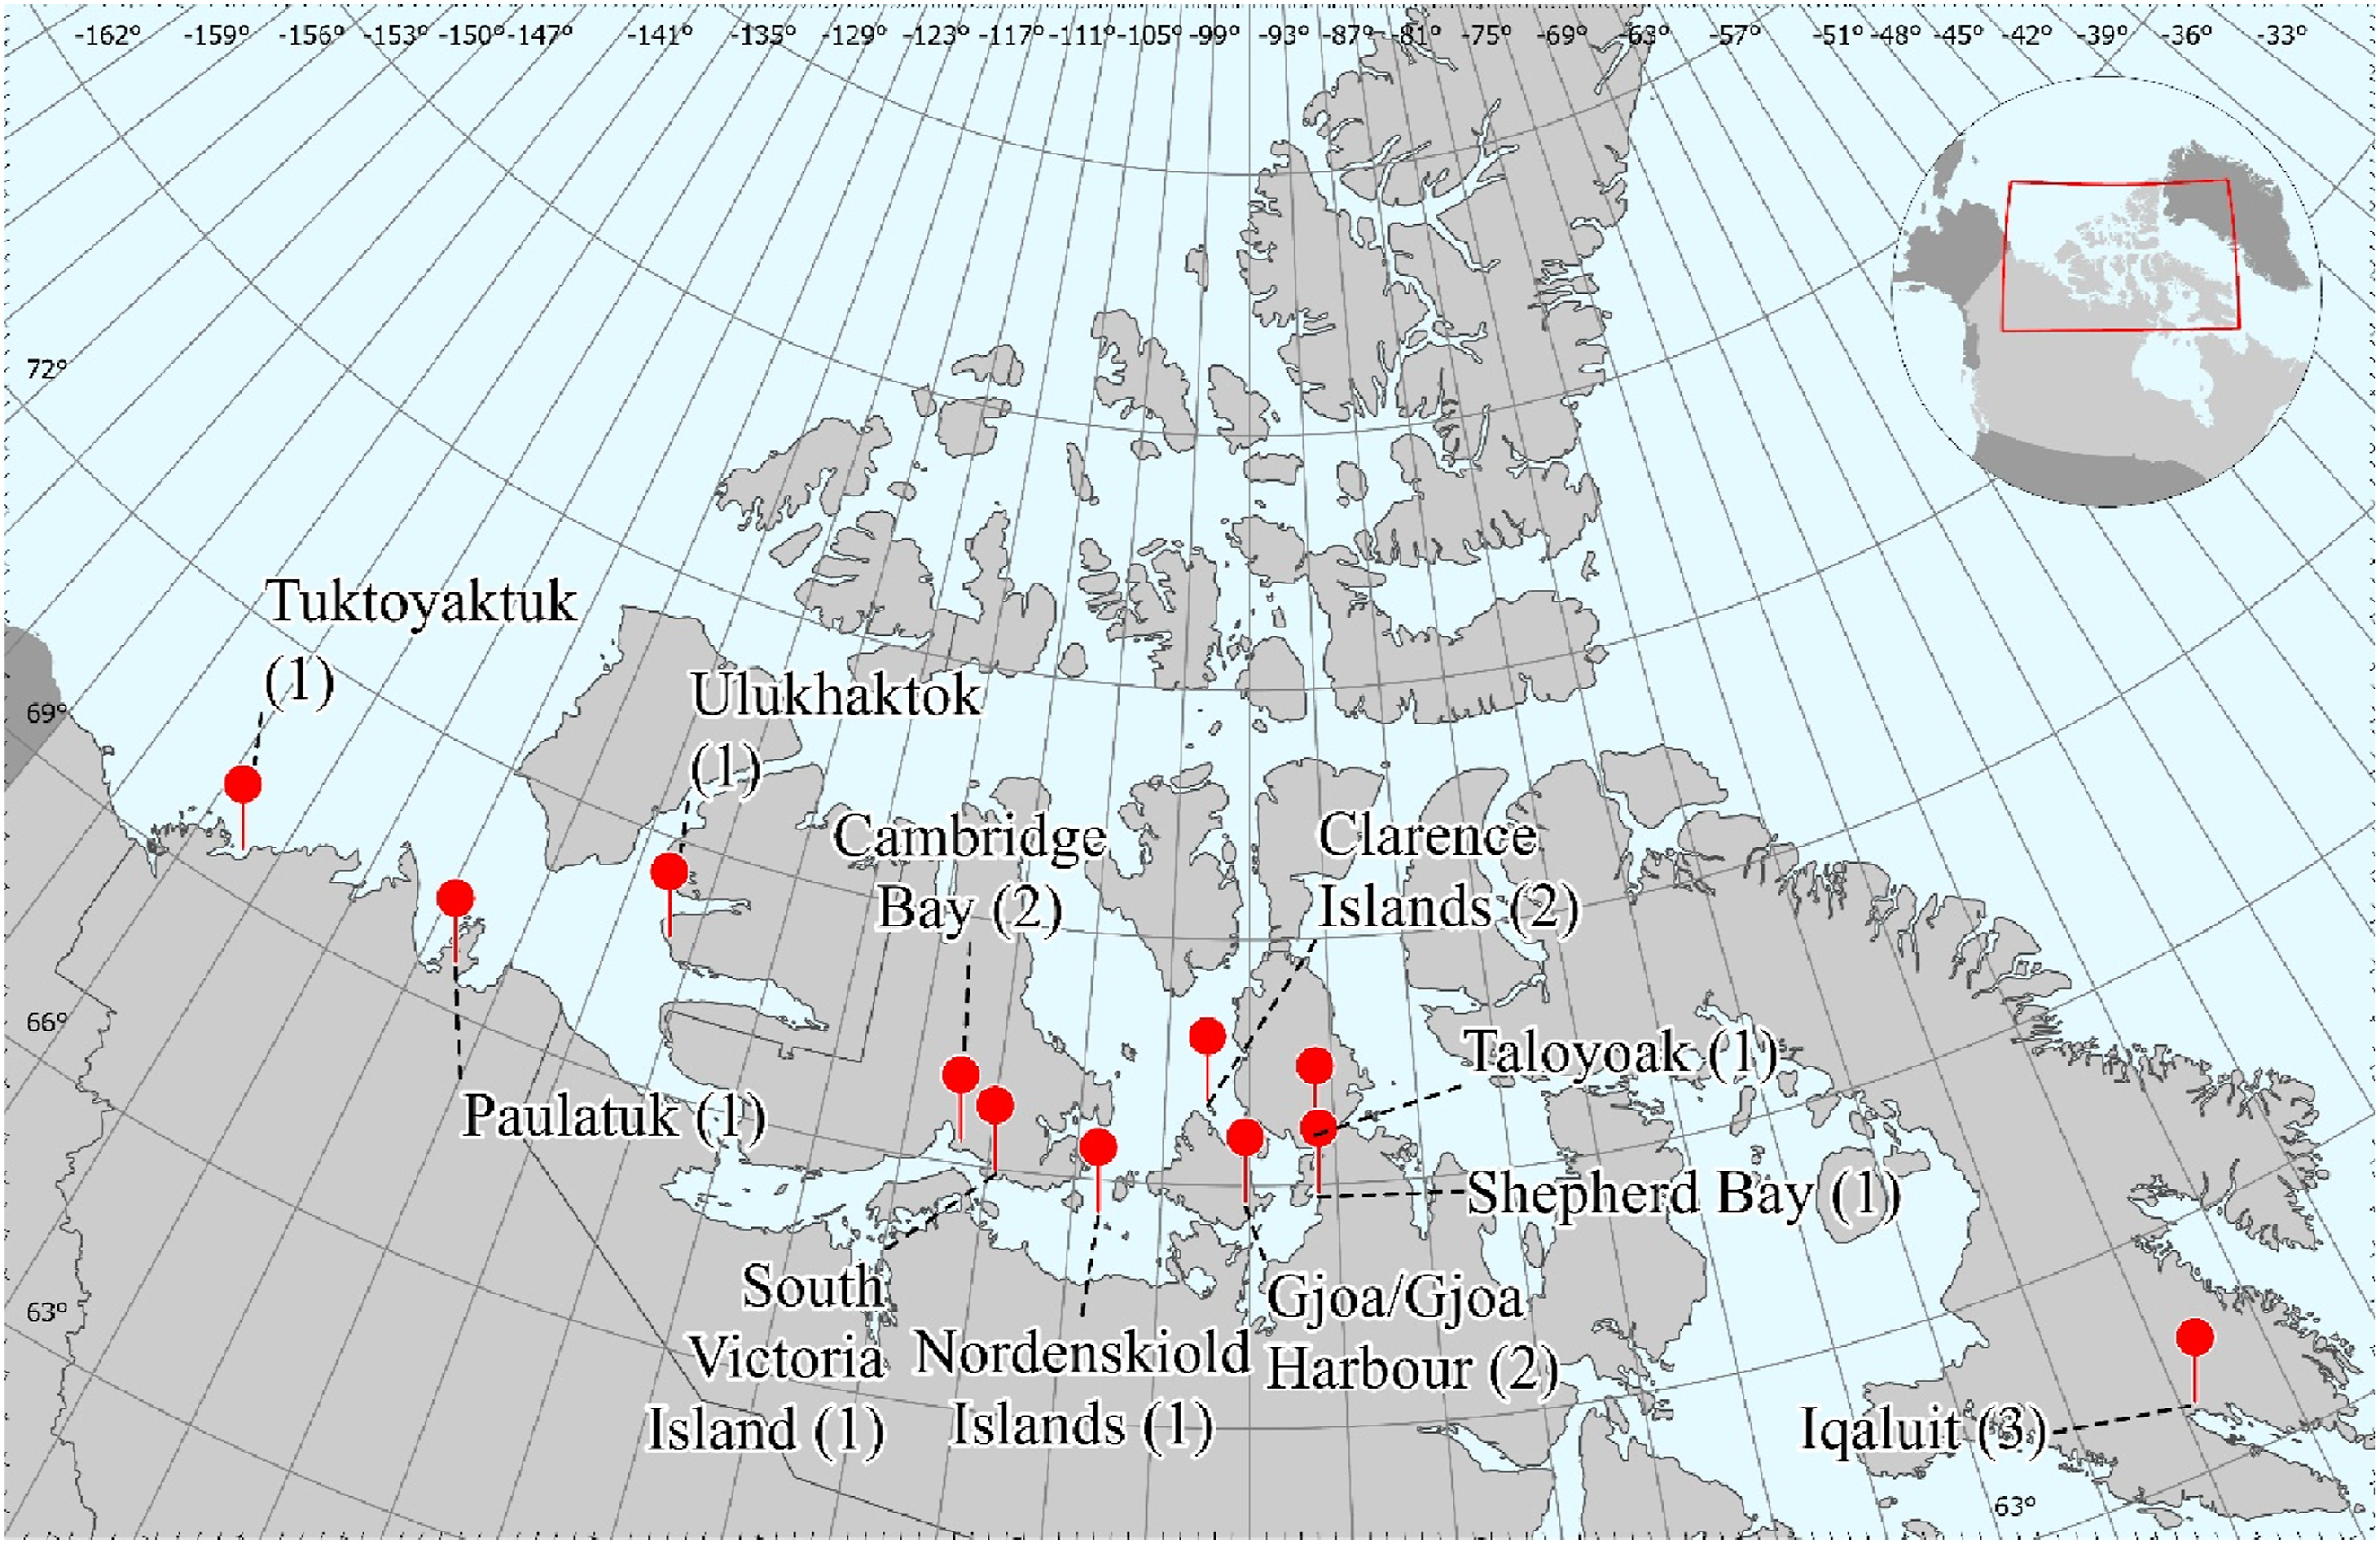
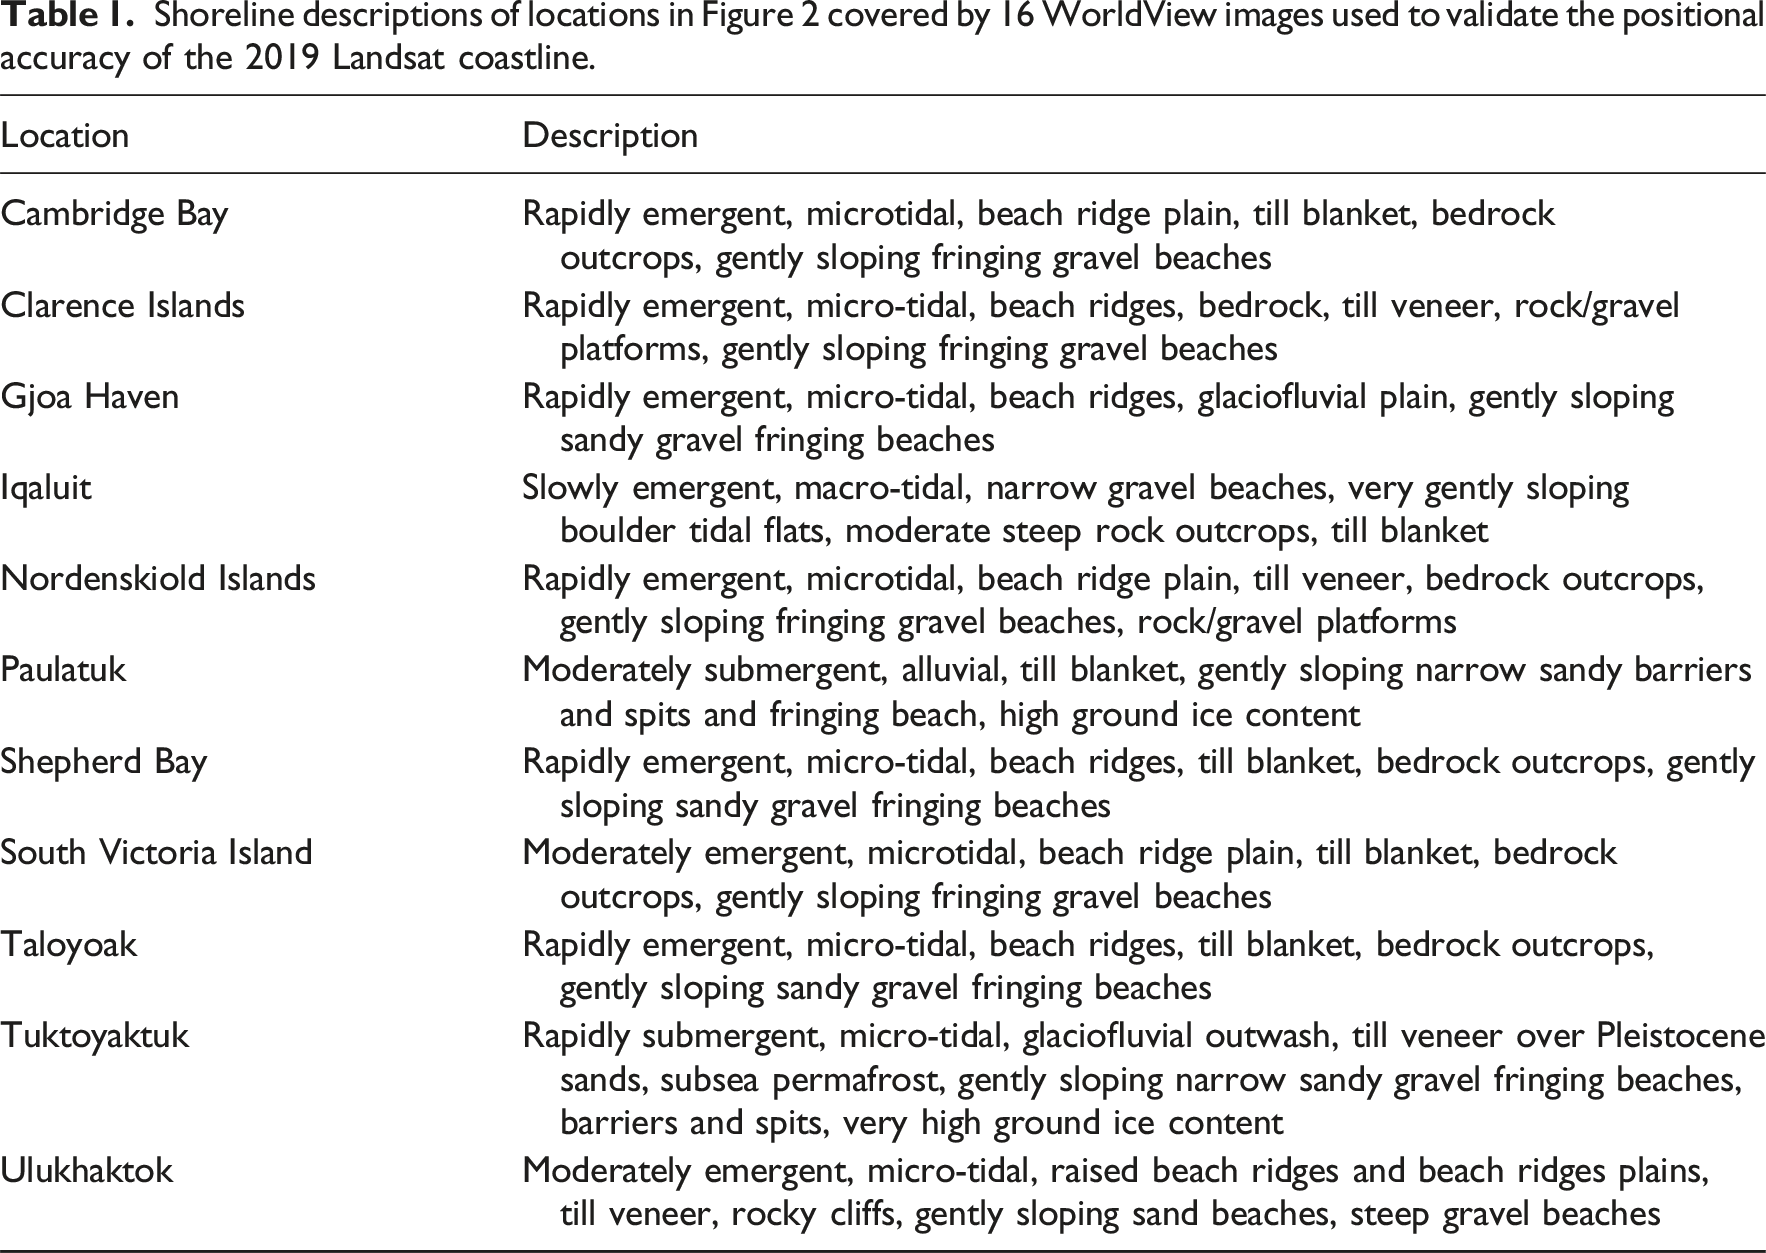
Tide, backshore slope, bathymetry and swash affect the instantaneous coastline position during satellite image acquisition. No tide correction was applied to the extracted coastlines from WorldView due to a lack of historical tide observations from a sparse tide-gauge network in Northern Canada, irregular topography near the waterline and insufficient-quality DEM data. However, CanCoast includes tidal range from published Canadian tide tables (CHS, 2022) defined as the difference between predicted astronomical low and high tide water levels in the absence of meteorological surges. For the locations of the 16 WorldView scenes, 13 are micro-tidal with a tidal range of less than 2.0 m. Twelve scenes were also located along coastlines with very low relief <2.0 m according to the CanCoast relief layer (Manson et al., 2019). A small tidal range decreases the uncertainty of the instantaneous shoreline position, while gentle relief increases it; however, both introduce error when validating Landsat shoreline position with instantaneous shoreline measurement locations.
Shoreline change detection
Amount of shoreline change was mapped onto the 2019 shoreline raster by calculating the per-pixel nearest-neighbour distance from the 1987 and 2003 coastlines, then gridding the magnitude and direction of 1987–2019 and 2003–2019 coastal change with positive values representing shoreline accretion and negative values erosion. Nearest-neighbour will generally calculate change in a direction perpendicular to the coastline where coastlines are roughly parallel, and these changes represent the vast majority based on visual inspection of consecutive shoreline maps. In areas where successive shorelines are not parallel, nearest-neighbour change may not be perpendicular to the coastline and a slight underestimation of positional change may be introduced. Besides being computationally efficient, the nearest-neighbour approach also provides an estimate of the minimum bounding condition of shoreline positional change. Alternatively, transects may be drawn and sampled perpendicular to the coastline as in Mentaschi et al. (2018); however, this approach also has drawbacks due to the fact that transects may not be perpendicular to the local coastline depending on the length used to determine perpendicularity, coastlines may not erode or accrete in a perpendicular direction, under sampling caused by transect spacing, and also superimposition and missing areas between coastal transects that are not parallel (Mentaschi et al., 2018). 1987–2003 shoreline change was mapped the same way onto the 2003 coastline. Changes between 1987–2003 and 2003–2019 accretion and erosion were calculated separately for Canada’s Arctic region from 66.5° N to 76° N, and Southern Canada below 66.5° N.
Extreme change values in the 1 % tails of change distributions were removed prior to calculating regional change statistics. These outliers represent annual rates greater than approximately ±15 m/yr, and were often caused by detected connectivity of ocean to inland waters in one of two dates, leading to the inclusion of nearest-neighbour distances between inland water shorelines and ocean coastlines. This issue was observed in the Mackenzie Delta among a few other locations, where complex channels, numerous coastal mashes and inland lakes lead to an intricate and sometimes irregular coastline. Other times, appearance or disappearance of islands or spits, or simple mapping error in one of two dates led to extreme change distances.
Metrics used to characterize accretion and erosion included the shoreline length of each type of change, the land area gained or lost, and the average rate of erosion or accretion only for pixels representing their respective type of change. For each type of change and region, the number of pixels and the sum of their nearest-neighbour distances, equal to the single-pixel width of the total length of erosion or accretion roughly perpendicular to the shoreline, was calculated. The length of accreting, eroding and stable shorelines was approximated as the number of pixels multiplied by 30 m (the width of a Landsat pixel). The land area gained (or lost) was calculated by multiplying the single-pixel width total accretion (or erosion) roughly perpendicular to the shoreline by 30 m. The average rate of accretion (or erosion) was calculated by dividing the area gained (or lost) by its corresponding shoreline length divided by the number of years. Lengths and areas are expressed in kilometres (squared), while rates of change are expressed in metres per year.
Shoreline change validation
Quantitative validation of Landsat shoreline change was investigated initially against in-situ erosion rates from published, provincial sources. However, the measurement precision of in-situ rates on the order of centimetres per year relative to 30 m Landsat pixels made comparisons somewhat ambiguous. A general agreement in terms of coastline change direction was noted between the two sources; however, rates were sometimes different by orders of magnitude due to factors related to measurement precision discussed later. Instead, a qualitative check was performed by overlaying smoothed Landsat coastline vectors on contemporaneous high-resolution optical imagery in Google EarthTM. Criteria for selecting coastlines to verify Landsat products included the availability of high-resolution optical time-series imagery acquired sometime between 2001–2005 and 2017–2021 over coastlines with significant change so that agreement was unambiguous. These criteria limited the number of examples to the north shore of PEI in southern Canada, and the Beaufort coastline near Tuktoyaktuk, NWT in the Arctic; both regions having high rates of coastal change.
Comparison with a Coastal Sensitivity Index (CSI)
Classes of characteristics used in calculation of the CSI for comparison to change rates derived from Landsat imagery.
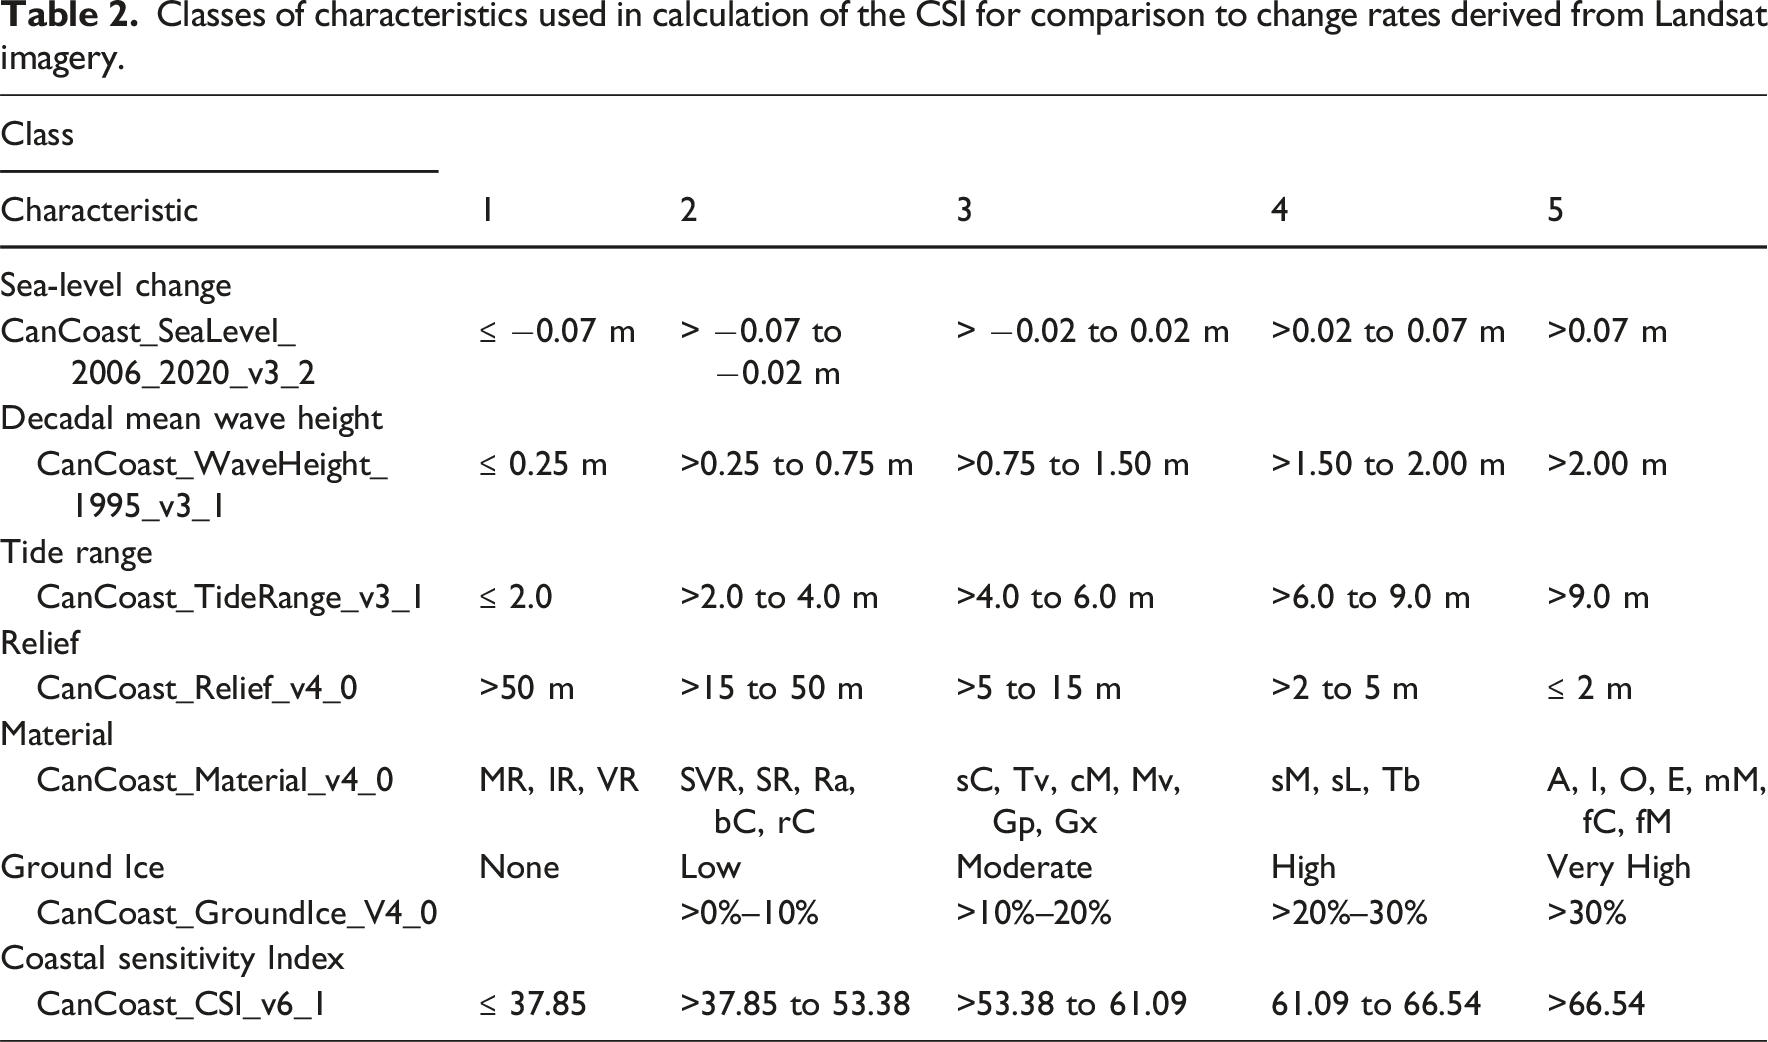
CSI classes were gridded onto the 2019 Landsat shoreline using nearest-neighbour and related to the magnitude of coastal change for the 32-year period from 1987 to 2019. We consider each pixel to be in one of three dynamic states: eroding, where a section of shoreline is retreating landward (negative change); accreting where a section of shoreline is advancing seaward (positive change); and stable, where shoreline movement is undetected in Landsat.
Results
Results are reported for spatiotemporal water level consistency in Landsat, shoreline position and change accuracy assessments, analysis of Landsat-derived coastline changes and comparison of Landsat-derived coastal change with the CanCoast CSI.
Landsat water levels
Mean water levels obtained from 100 simulations ranged from 32 % to 61 % of the maximum level during the sample period for 1 to 12 randomly sampled Landsat dates in Tuktoyaktuk (Figure 3(a)). Ninety-five per cent of simulations generated water levels between 13 cm and 29 cm of the mean, representing 9–20 % of the tide range during the sample period. For Charlottetown, sampled water levels were slightly higher at between 41 % and 85 % of the maximum water level, with 95 % between 27 cm and 77 cm, or 9–25 % of the tide range (Figure 3(b)). Because the number of Landsat samples tends to be higher in the south due to a longer annual compositing period and generally less cloud coverage, it is reasonable to assume 7 or more annual observations per period, giving a 95 % interval of 27 cm and 41 cm, or 9-13 % of the tide range. Water level means and 95 % confidence intervals for 100 simulations per number of annual observations for Tuktoyaktuk (a), and Charlottetown (b), with each simulation generated by random sampling of Landsat observation dates and combined into 5-year intervals following Landsat compositing criteria. Low and high-tide water levels for sampling periods are shown as horizontal blue lines.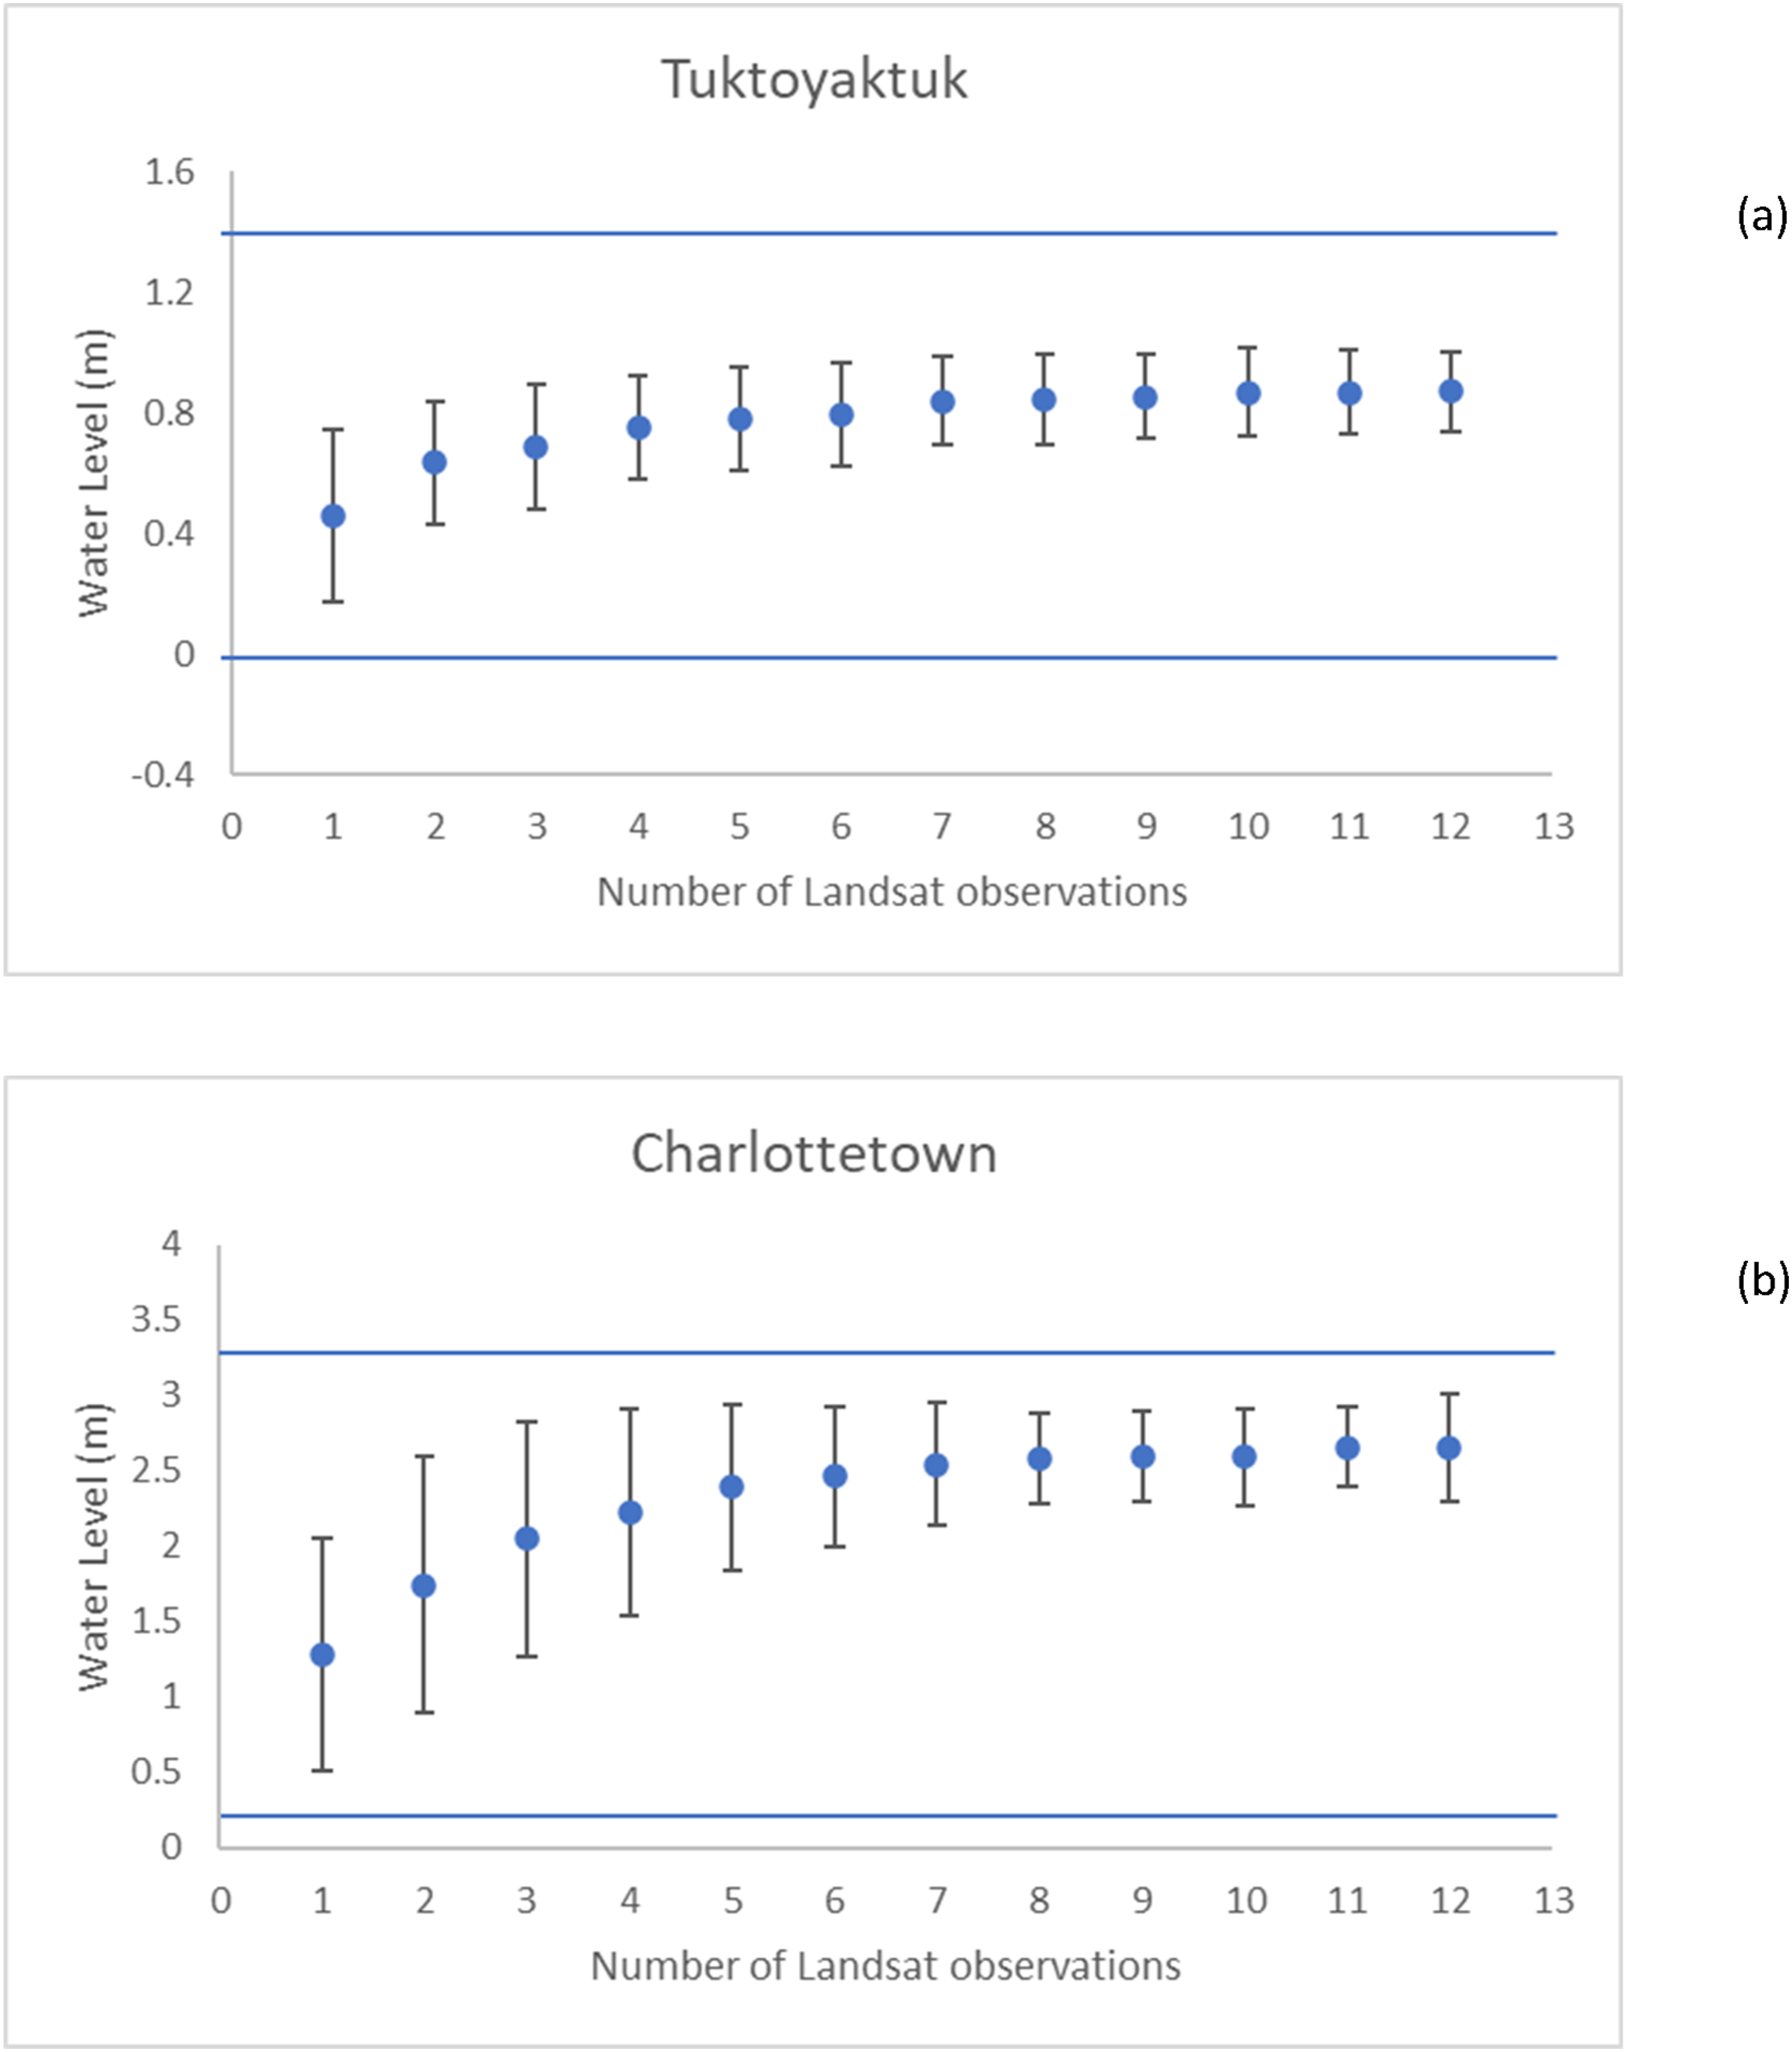
Several shoreline mapping methods and algorithms depend on tidal models (e.g. Bishop-Taylor et al., 2021), and therefore a comparison between errors due to tide modelling and variance due to Landsat sampling for shoreline mapping is warranted. For the 2023 compositing period over Tuktoyaktuk, the mean absolute error (MAE) between tide model predicted and observed tide gauge water levels was 20 cm, which is up to two times greater than the standard deviations of 100 simulations from 1 to 12 observation trials. For Charlottetown, model MAE was lower at 14 cm, which is comparable or slightly higher than the standard deviations of simulations from 7 to 12 observation trials. Thus, annual Landsat compositing and combining into 5-year shoreline masks as in our analysis, generally produces variance that is comparable in the south, and smaller in the Arctic, compared to error introduced by tide modelling.
Shoreline positional accuracy
Landsat coastline accuracy metrics for the 2019 coastline against 16 reference WorldView-2 scenes. Tidal data from Webtide (Dupont et al., 2002) and the Canadian Hydrographic Service (CHS, 2022) referenced to Higher High Water Large Tides (HHWLT). Bias is positive landward.
Shoreline change assessment
Landsat shoreline changes were visually assessed against contemporaneous high-resolution optical imagery in regions where significant changes and drivers are well understood (Forbes et al., 2014). Examples from the Beaufort coast in the Canadian Arctic and the north shore of Prince Edward Island (PEI) in the south show that shoreline change is apparent in both regions, but that greater success in mapping the shoreline is achieved on the north shore of PEI than the Beaufort (Figure 4). Examples of significant coastline change from Landsat overlain on contemporaneous high-resolution imagery from Google EarthTM of the Beaufort coast near Tuktoyaktuk, Northwest Territories (rows (a) and (b)), and the north shore of Prince Edward Island (rows (c) and (d)). Locations are shown in Figure 1. The stepped effect of 30 m pixels in the Landsat coastlines was smoothed to improve visualization. Lat Long, WGS84. See insets in Figure 1 for locations.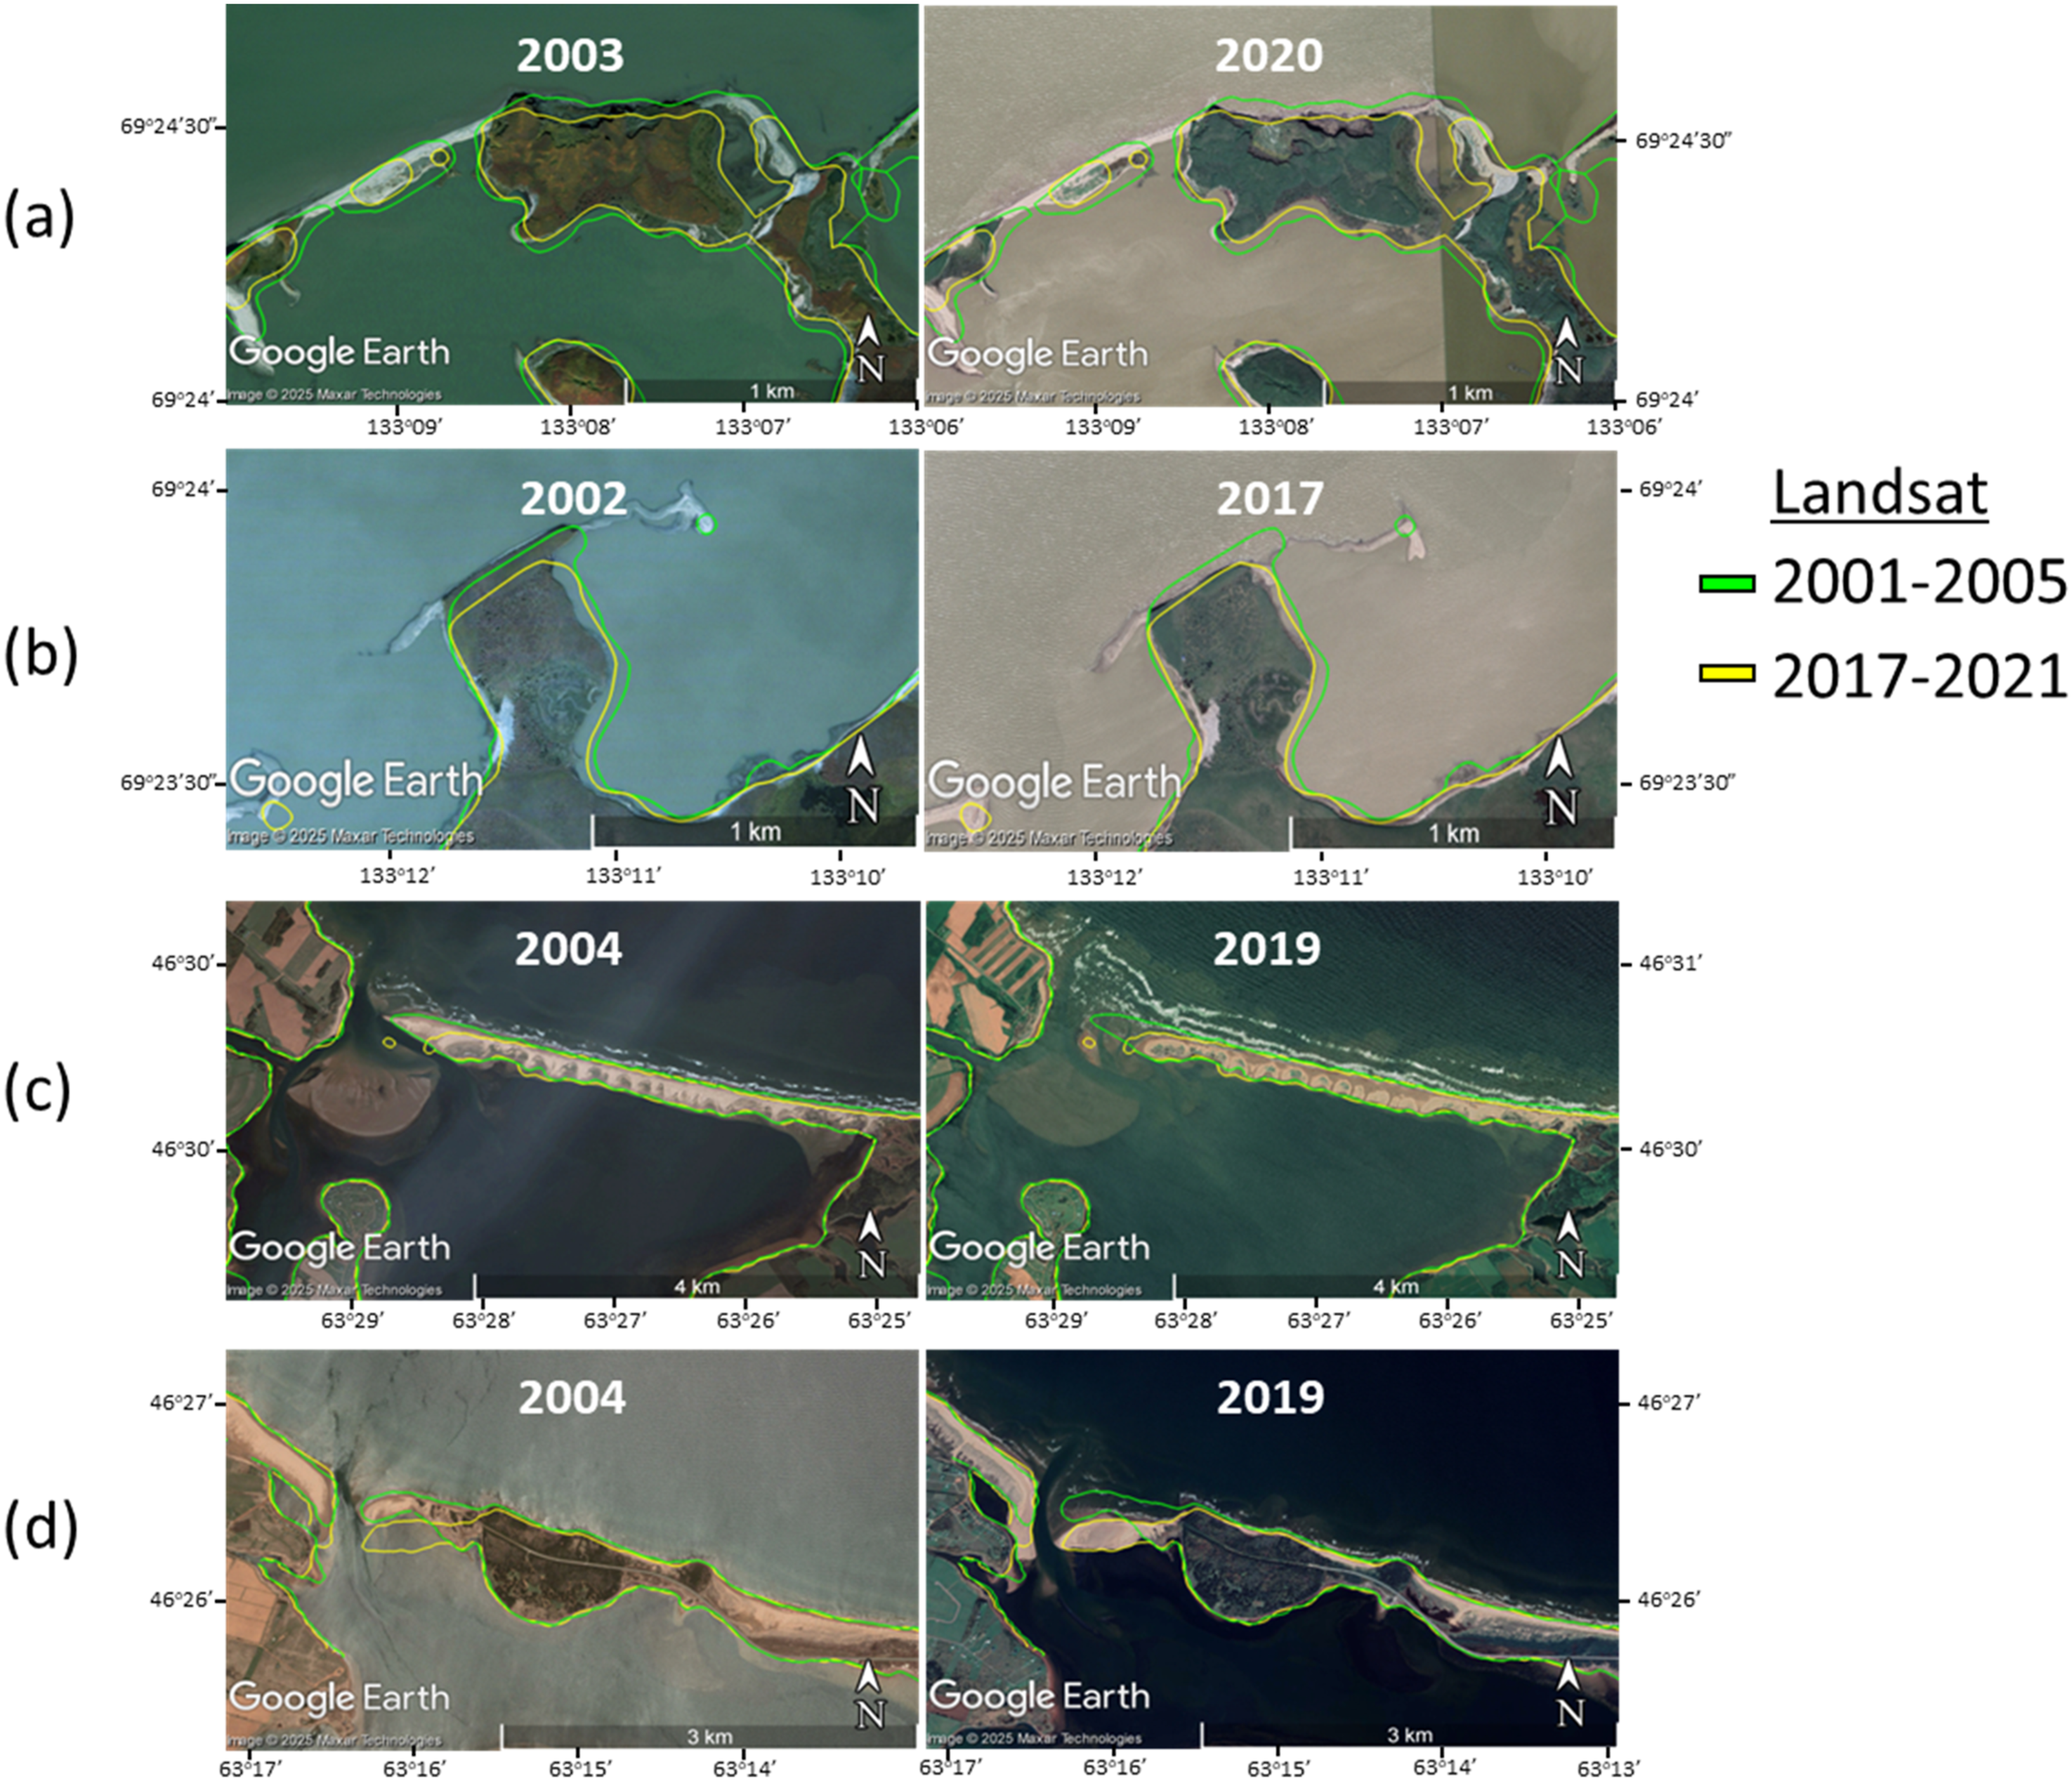
The Beaufort examples are near Tuktoyaktuk and affected by the turbid plume of the Mackenzie River in which coastal waters are optically similar to coastal tundra vegetation and gravel spits (Figure 5). Challenges mapping the coastline from optical imagery are evident with turbid water and wind leading to bright, specular reflectance off waves, causing reduced ability to discriminate between bare land and water. Small land objects such as islands and spits are also sometimes missed in Landsat due to its spatial resolution and mixed pixels that are classified as either land or water. The shoreline is well mapped at higher contrast cliff sections and less well mapped in wetlands and washover channels on barrier beaches and spits. Nevertheless, cliffs in this area are known to erode at mean rates of several metres per year (Whalen et al., 2022), which is reflected in the Landsat shorelines. Coastline mapped in UTM zone 8 along the hamlet of Tuktoyauktuk on the Beaufort Sea with a WorldView-2 scene from July 27, 2017 as background. The Landsat coastline is represented by 30 m wide pixels in blue, with its vector representation joining pixel centres in red. The reference coastline extracted from WorldView is shown in green.
The optical contrast between land and water on the north shore of PEI is considerably higher and both cliff and spit sections of shoreline are well mapped. Intertidal shoals visible in the imagery are not mapped, indicating that the mapped shoreline is at near-high tide. The cliff retreat and spit migration patterns are consistent with anthropogenically influenced tidal inlet dynamics in the area (Forbes and Solomon, 1999) and storm impacts (Forbes et al., 2004).
Change statistics from Landsat coastline change across Canada, and for southern and Arctic regions by time period.
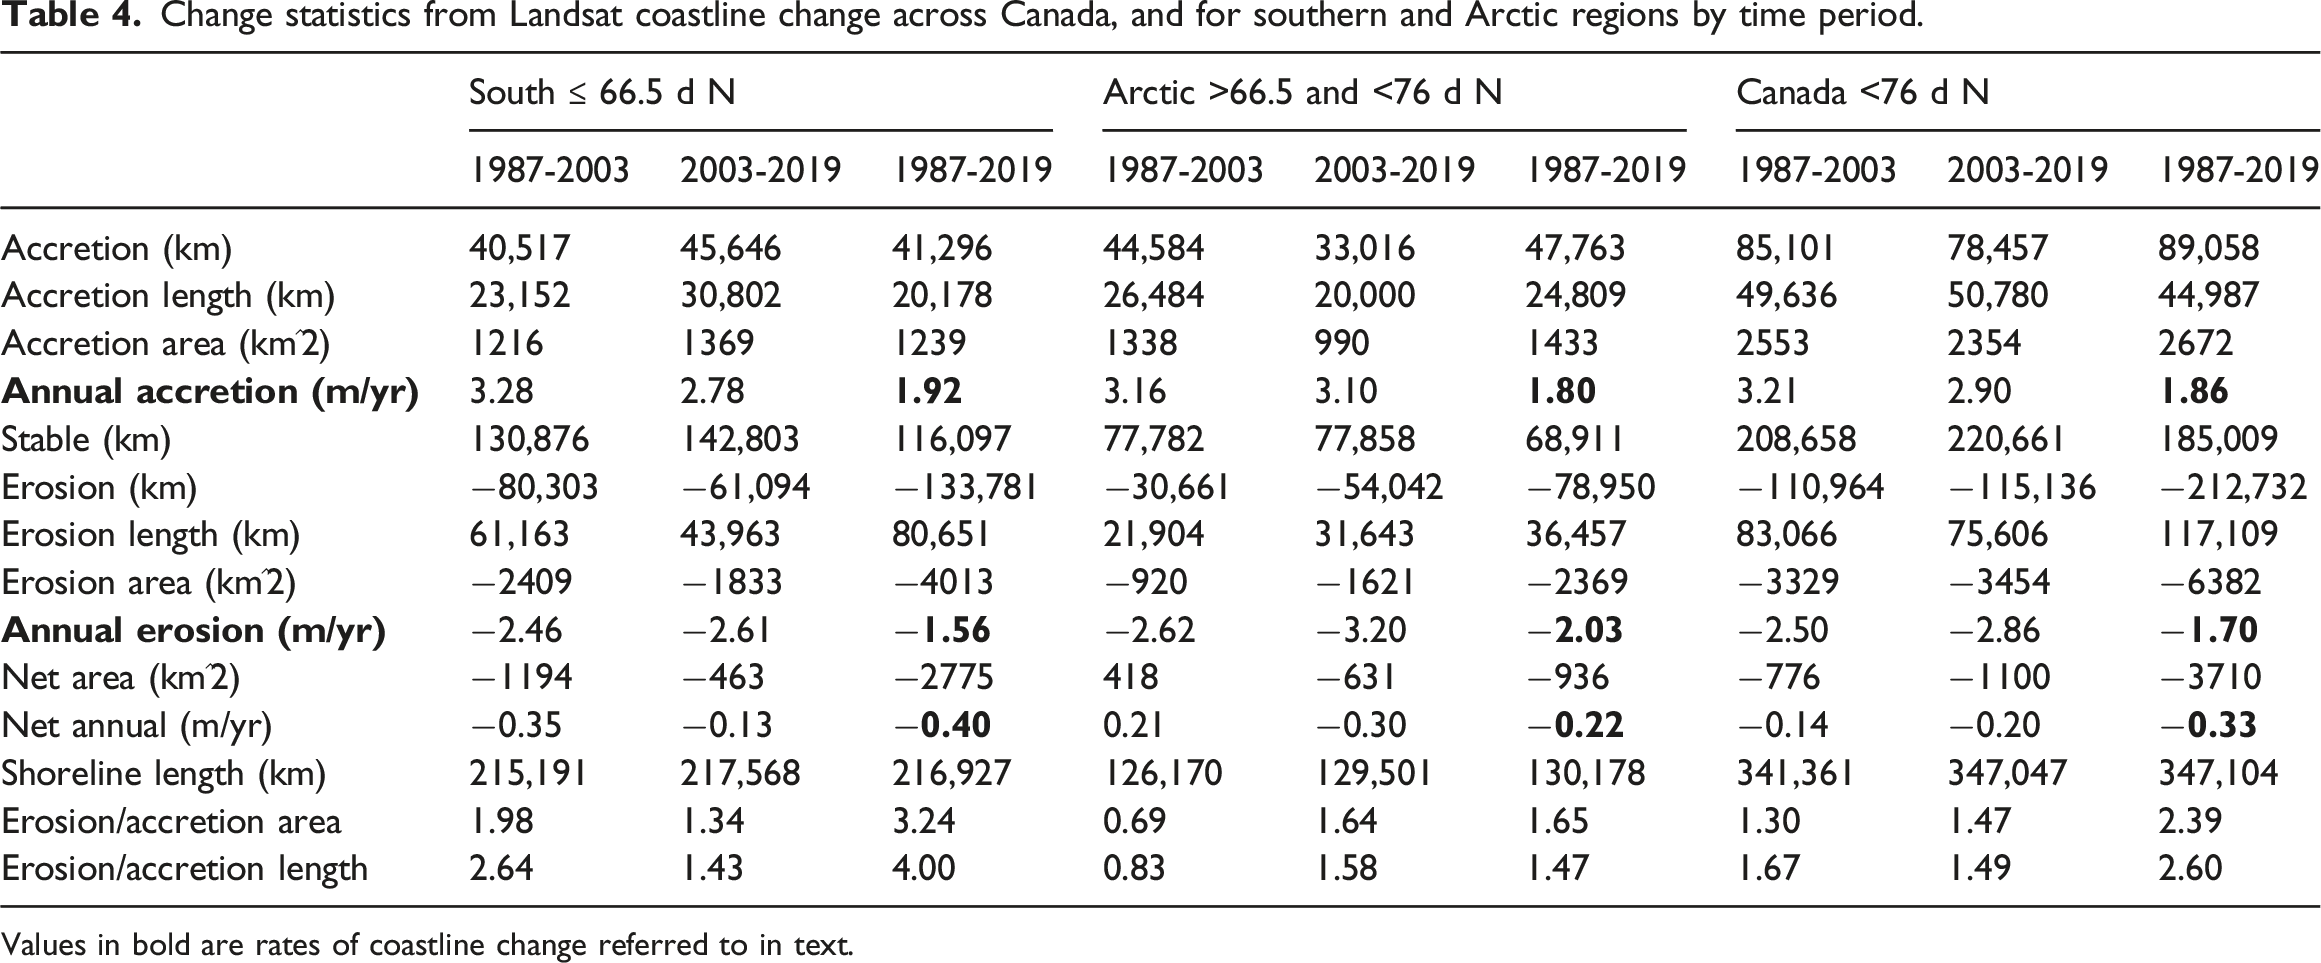
Values in bold are rates of coastline change referred to in text.
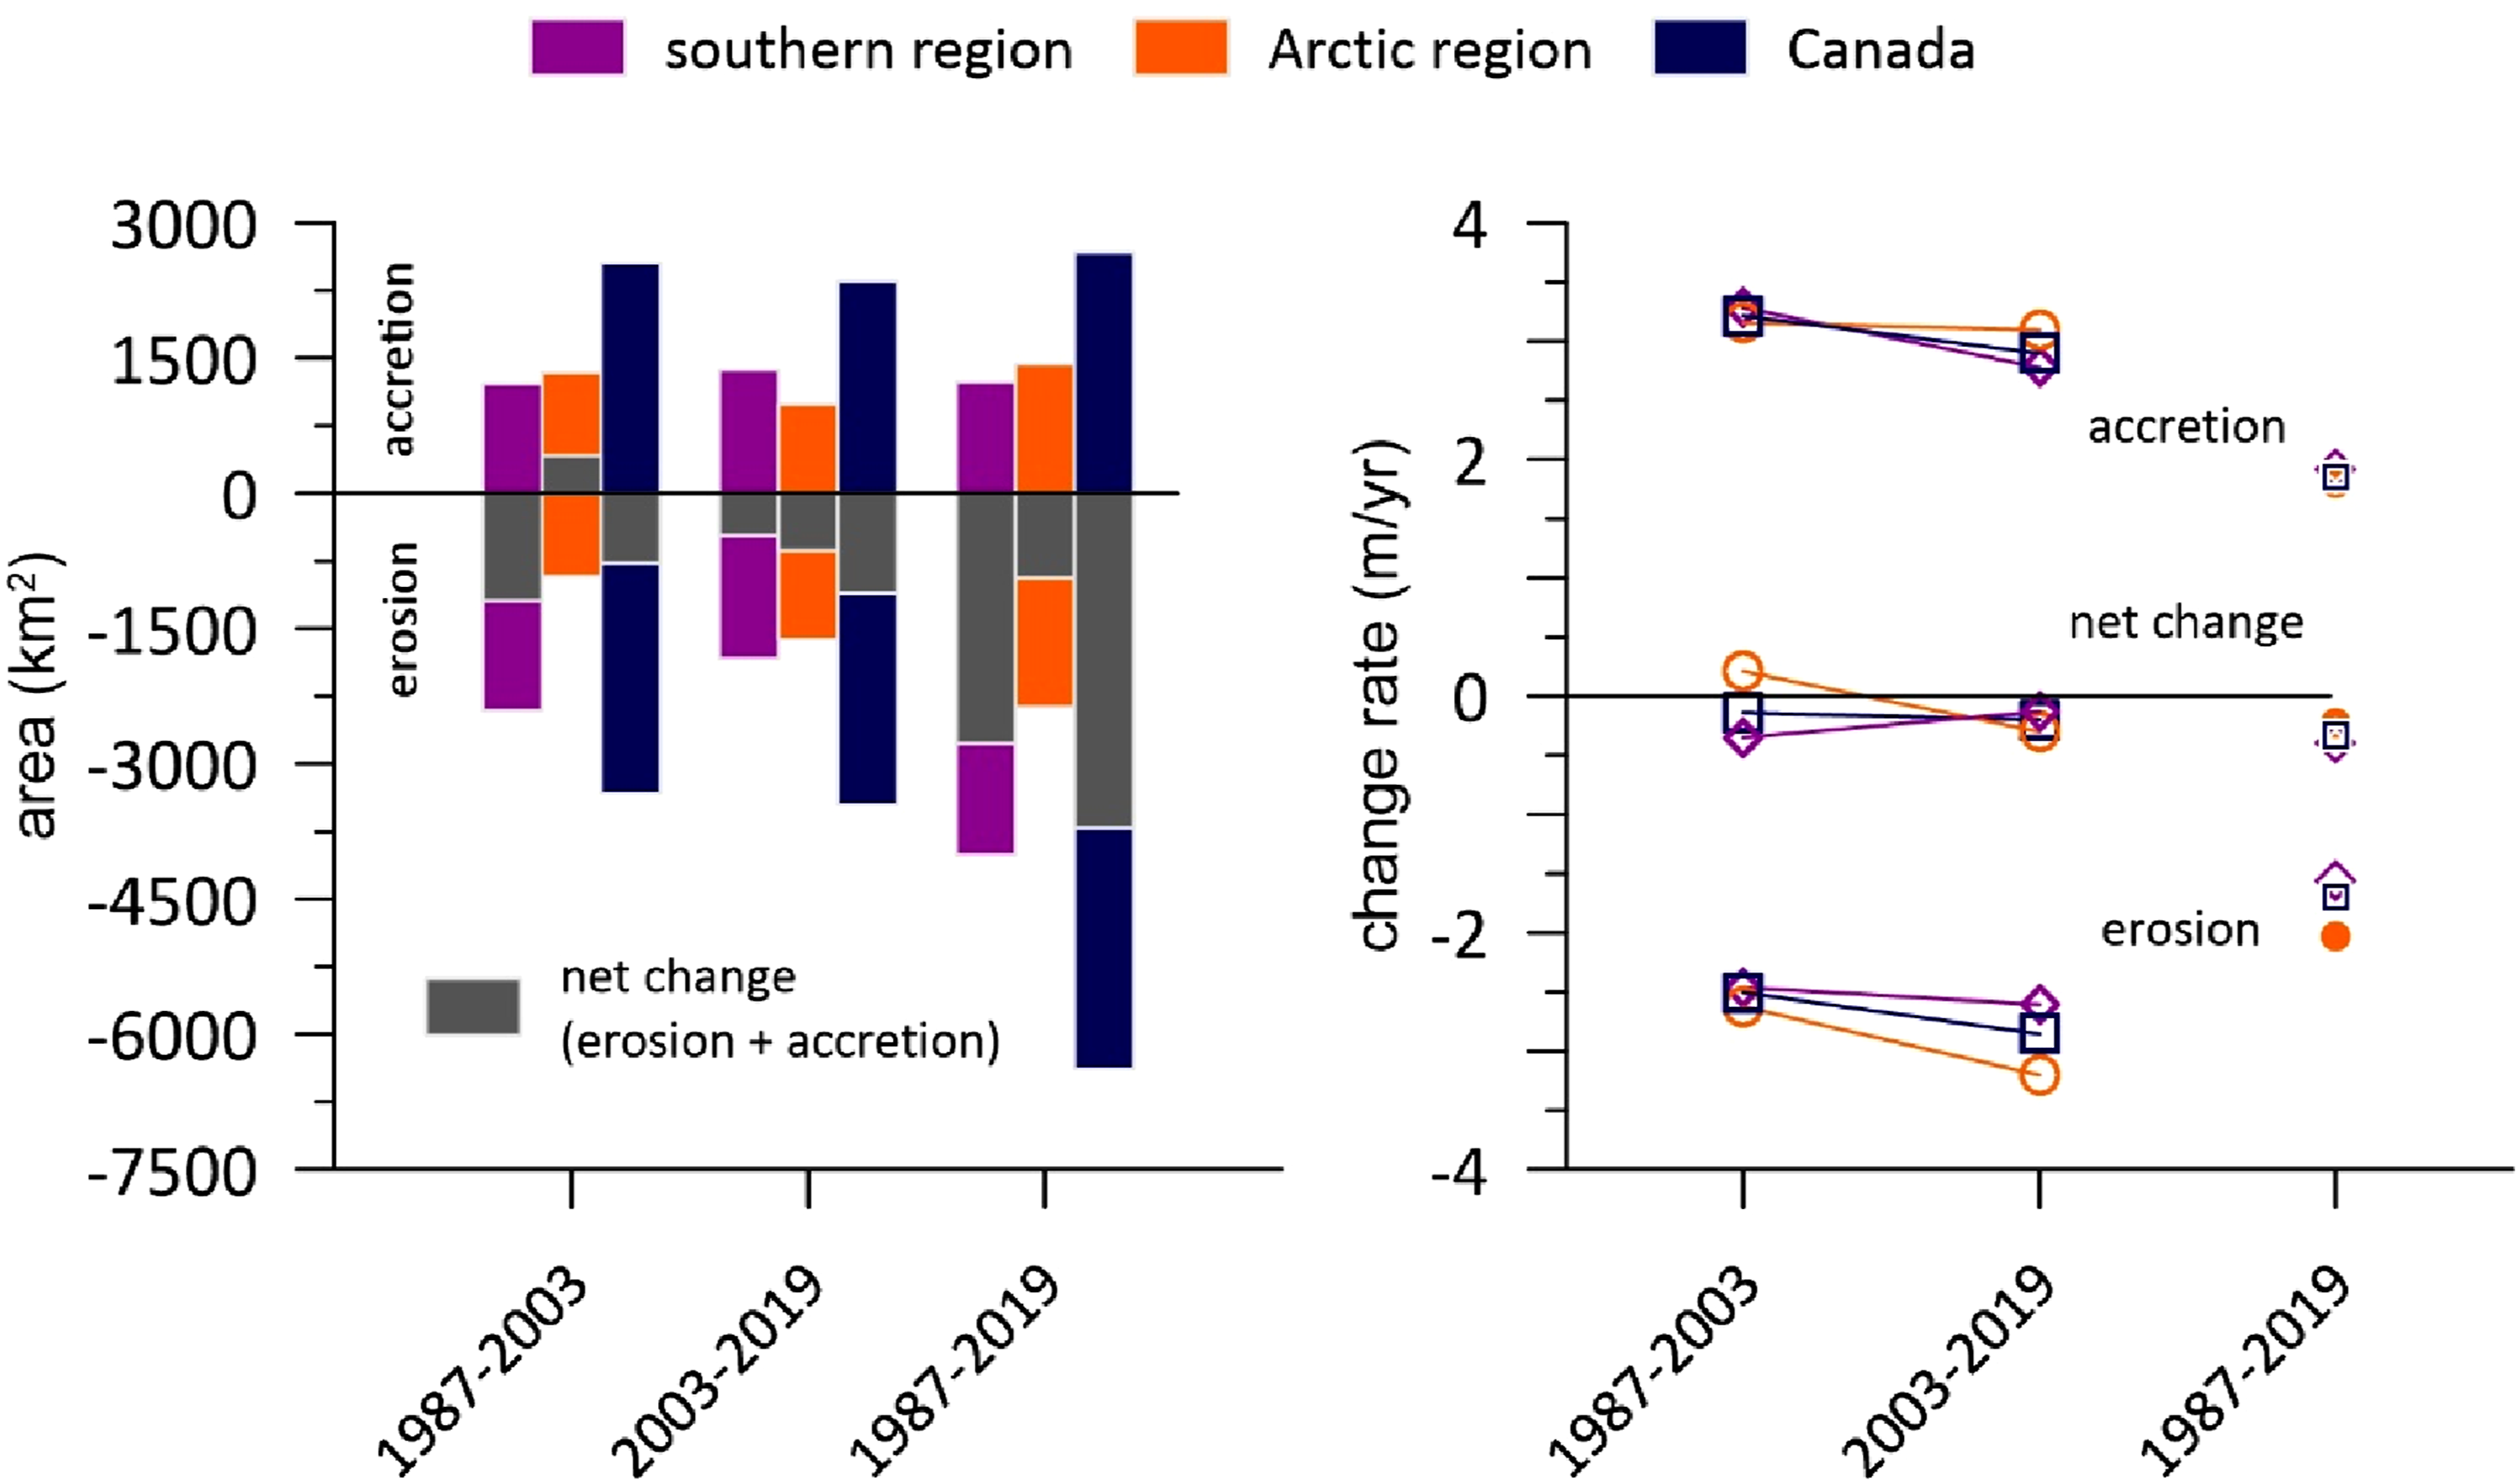
Graphs of data given in Table 4 showing amount by area (left) and rate (right) of accretion, erosion and net change in the three time periods for the southern, Arctic and Canada regions.
In the 16 years between 1987 and 2003 corresponding to the first half of the entire 32-year period, land lost to erosion exceeded land gained by accretion in the south by a factor of 1.98 due to a 2.64 times longer shoreline experiencing erosion despite undergoing a lower average erosion rate. In the Arctic, rates of erosion were below accretion rates, and occurred over a shoreline 0.83 times shorter than the length of accretional shorelines, causing erosion to remove an area 0.69 times the size of land gained by accretion, leading to a 418 km2 net land area gain.
In the following 16-year period from 2003 to 2019, the length and area of accretion increased in the south by 33.0 % and 12.7 %, but decreased in the Arctic region by −24.5 % and −25.9 %, while erosion exhibited opposite trends decreasing in the south (−28.1 % and −23.9 %), and increasing in the Arctic (44.5 % and 76.3 %). In fact, the Arctic region switched from net accretion in 1987–2003 with the whole shoreline experiencing an average change rate of 0.21 m/yr, to net erosion in 2003–2019, losing −631 km2 to erosion with an average shoreline change of −0.30 m/yr in the latter period (Figure 6). While the Arctic erosion area and shoreline length were less than the area and length of accretion in 1987–2003, erosion exceeded accretion by 1.64 times the area and 1.58 times shoreline length in 2003–2019.
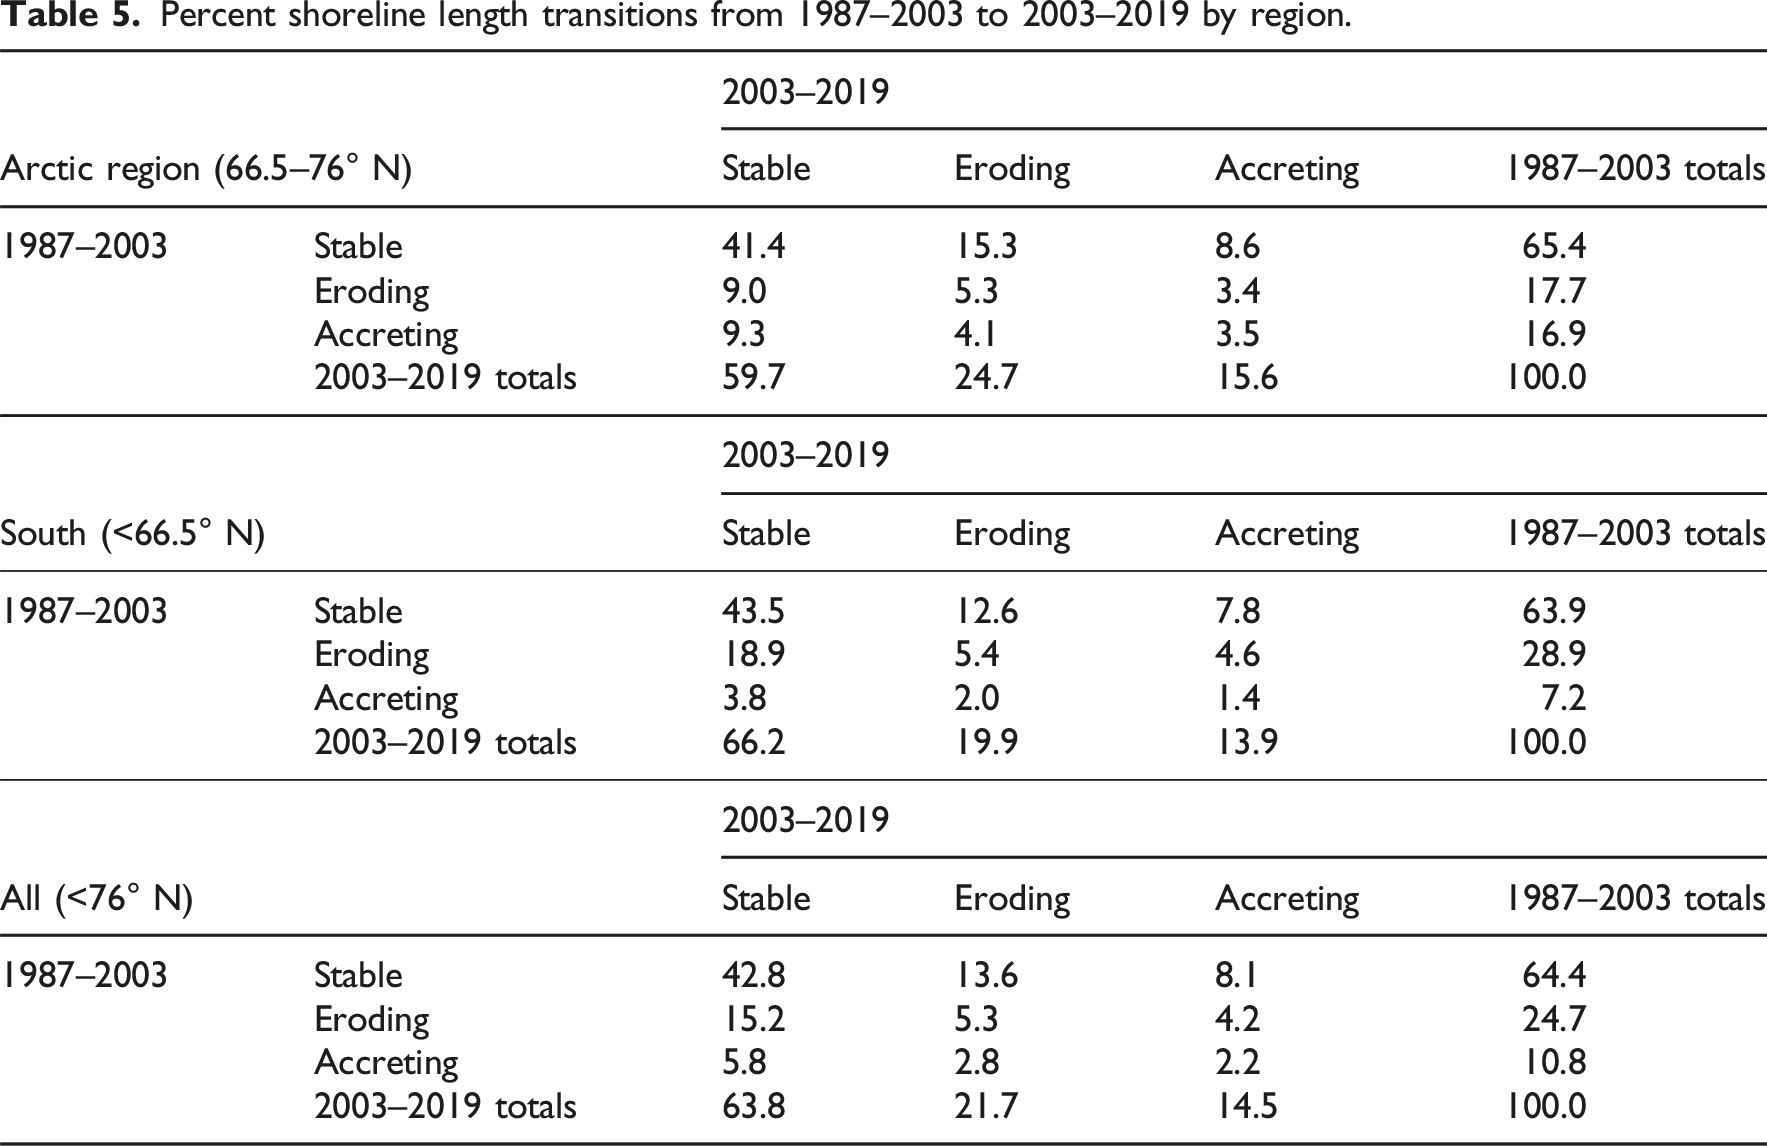
Percent shoreline length transitions from 1987–2003 to 2003–2019 by region.
CanCoast CSI
Once calculated for all of Canada, coastal sensitivity measured by the CSI can be subset into the Arctic and Southern regions (Figure 7). The distributions of both CSIs have a similar median but the Arctic CSI is more left-skewed towards lower CSI values than the southern CSI, likely reflecting the abundance of regressive coarse material shorelines and the reduced wave climate in the Arctic. Distributions of the CSIs for the Arctic and southern regions showing greater skewness towards low CSI values in the Arctic than in the south.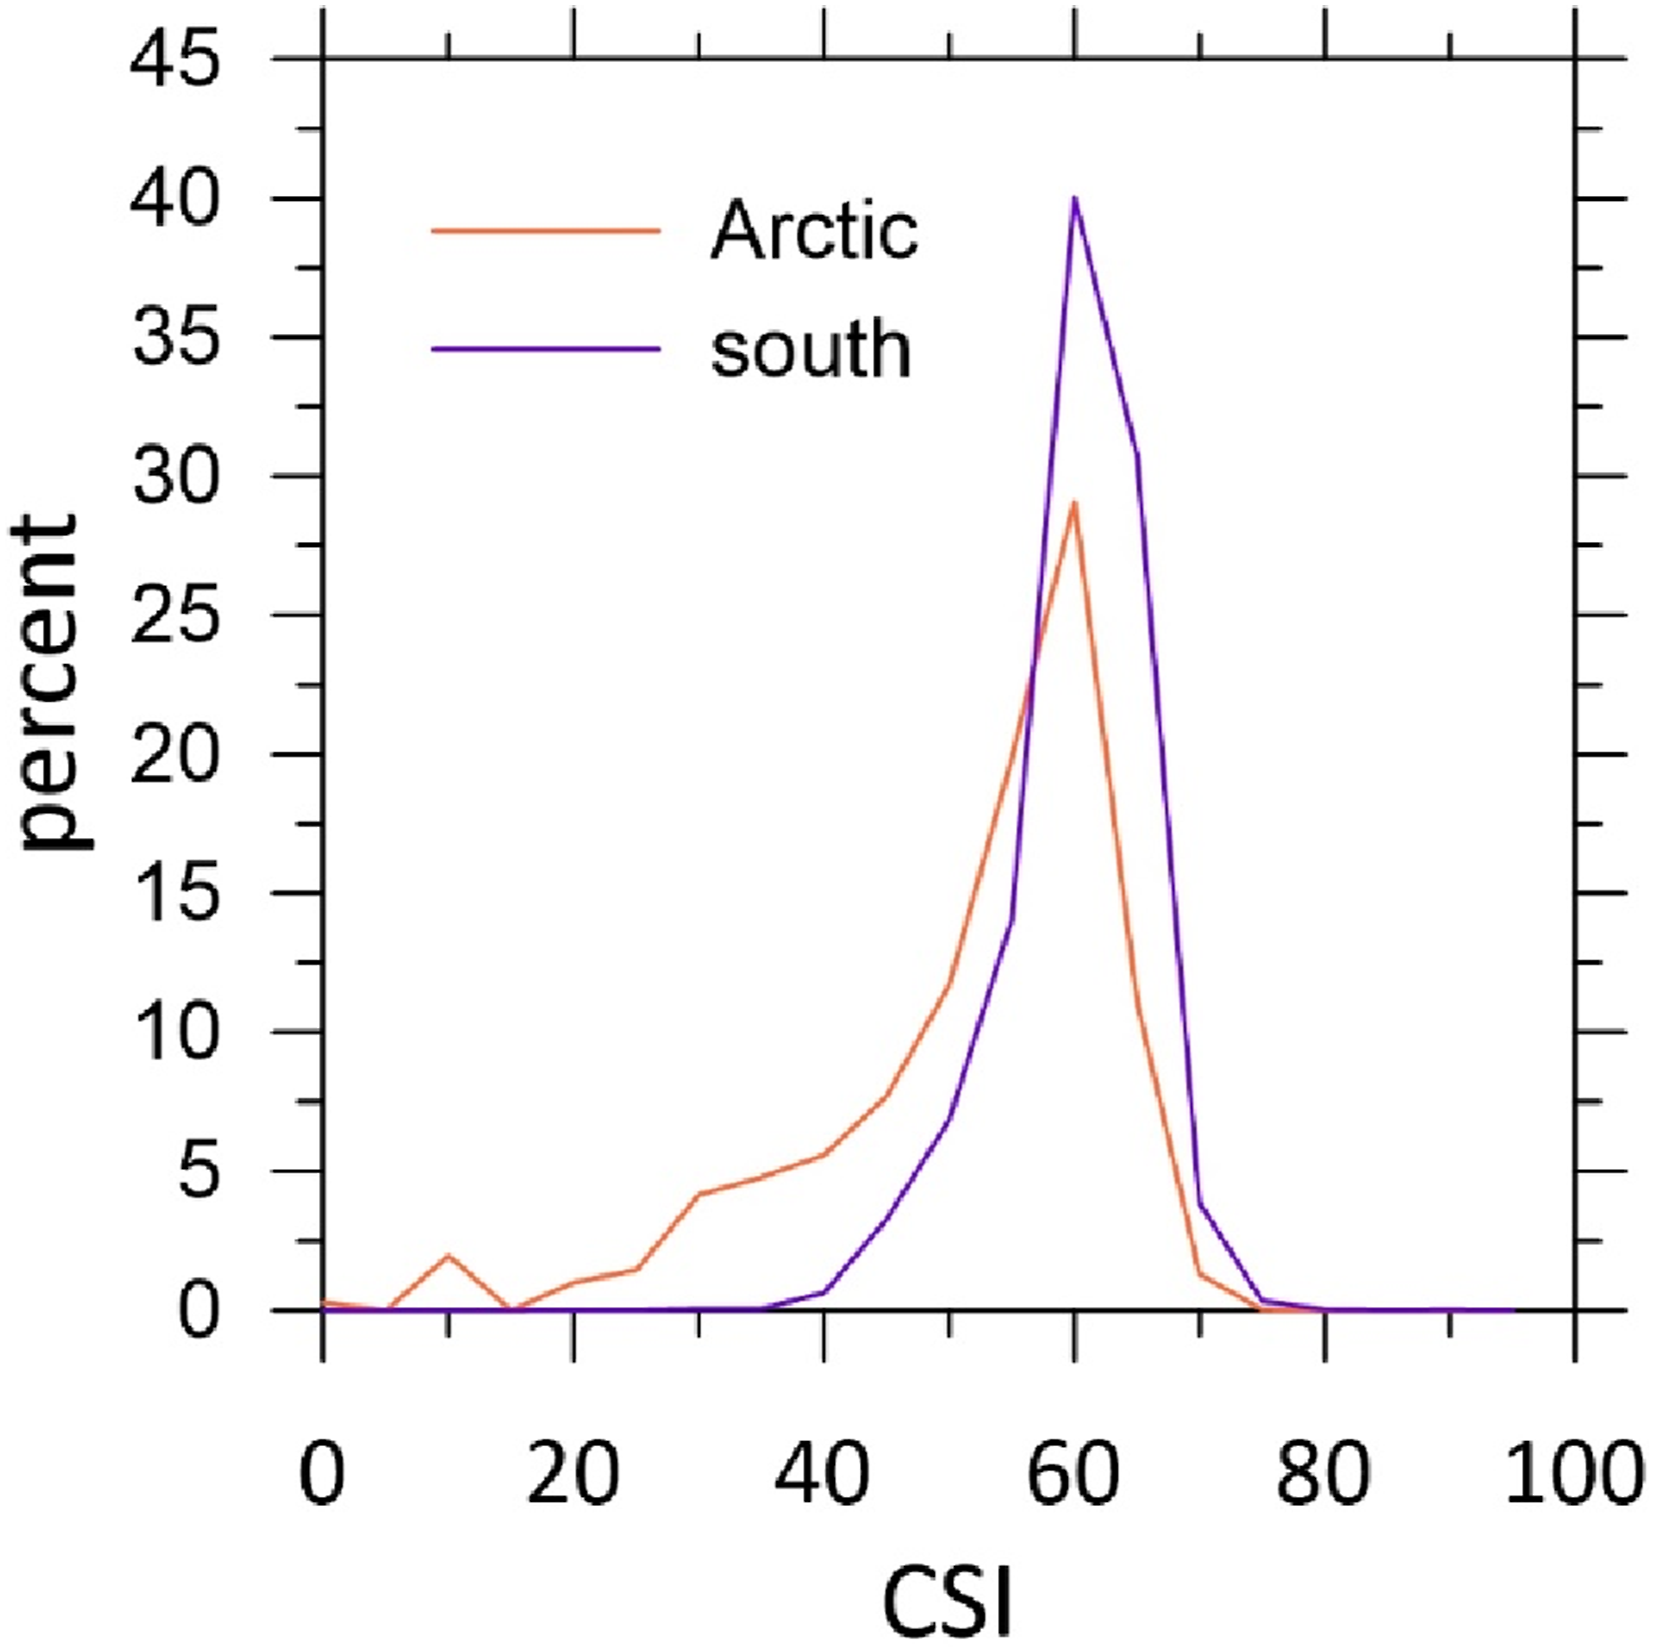
Kendall correlation gives a non-parametric measure of the strength of a monotonic relationship between two variables when at least one is ordinal. In this study, Kendall correlation of the percentage alongshore lengths of accreting, eroding, and stable shorelines and CanCoast CSI classes gave statistically significant (p < 0.1 or p < 0.05) absolute values of Kendall’s Tau of either 0.80 or 1.00, depending on whether the lengths were perfectly ordered with sensitivity, or one value was out of order. The relationships between CSI and lengths of 1987 to 2019 eroding and stable shorelines are significant at p < 0.1 in the Arctic, southern regions and all of Canada south of 76° N (Figure 8). In both the Arctic and southern regions, the CSI and length of stable coastline are significantly negatively correlated, since areas with greater coastal sensitivity to climate forcing are expected to be more dynamic. Accretion and the CSI are only significantly correlated in the south. We postulate that processes in the Arctic not occurring in the south are obscuring the relationship between Arctic accretion and the CSI. One possible process may be that apparent accretion is occurring as shoals emerge in areas of low CSI experiencing relative sea-level fall, but this is not supported by the relatively low accretion in Arctic CSI class 1 (Figure 8), except when considering that Class 1 includes steep fjord cliffs where successive shorelines would not likely show emergence in planform. Differing permafrost (particularly ice in permafrost), sea ice, sea level and materials between Arctic and southern regions undoubtedly contribute to different responses of Arctic and southern shorelines to forcing; it is very likely that the relative importance of these factors varies within the broad regions considered here, and further discrimination into smaller geomorphological regions may help explain the relationships between expected dynamics and measured change. Graphs of alongshore lengths of accreting, eroding and stable shorelines in each class of the CSI for southern and Arctic regions and Canada south of 76 ° N in the period 1987 to 2019. Numbers at top of bars give percentage of the total shoreline length in each class, and inset tables give Kendall correlation coefficients. Only significant correlations are shown. *p < 0.1 **p < 0.05.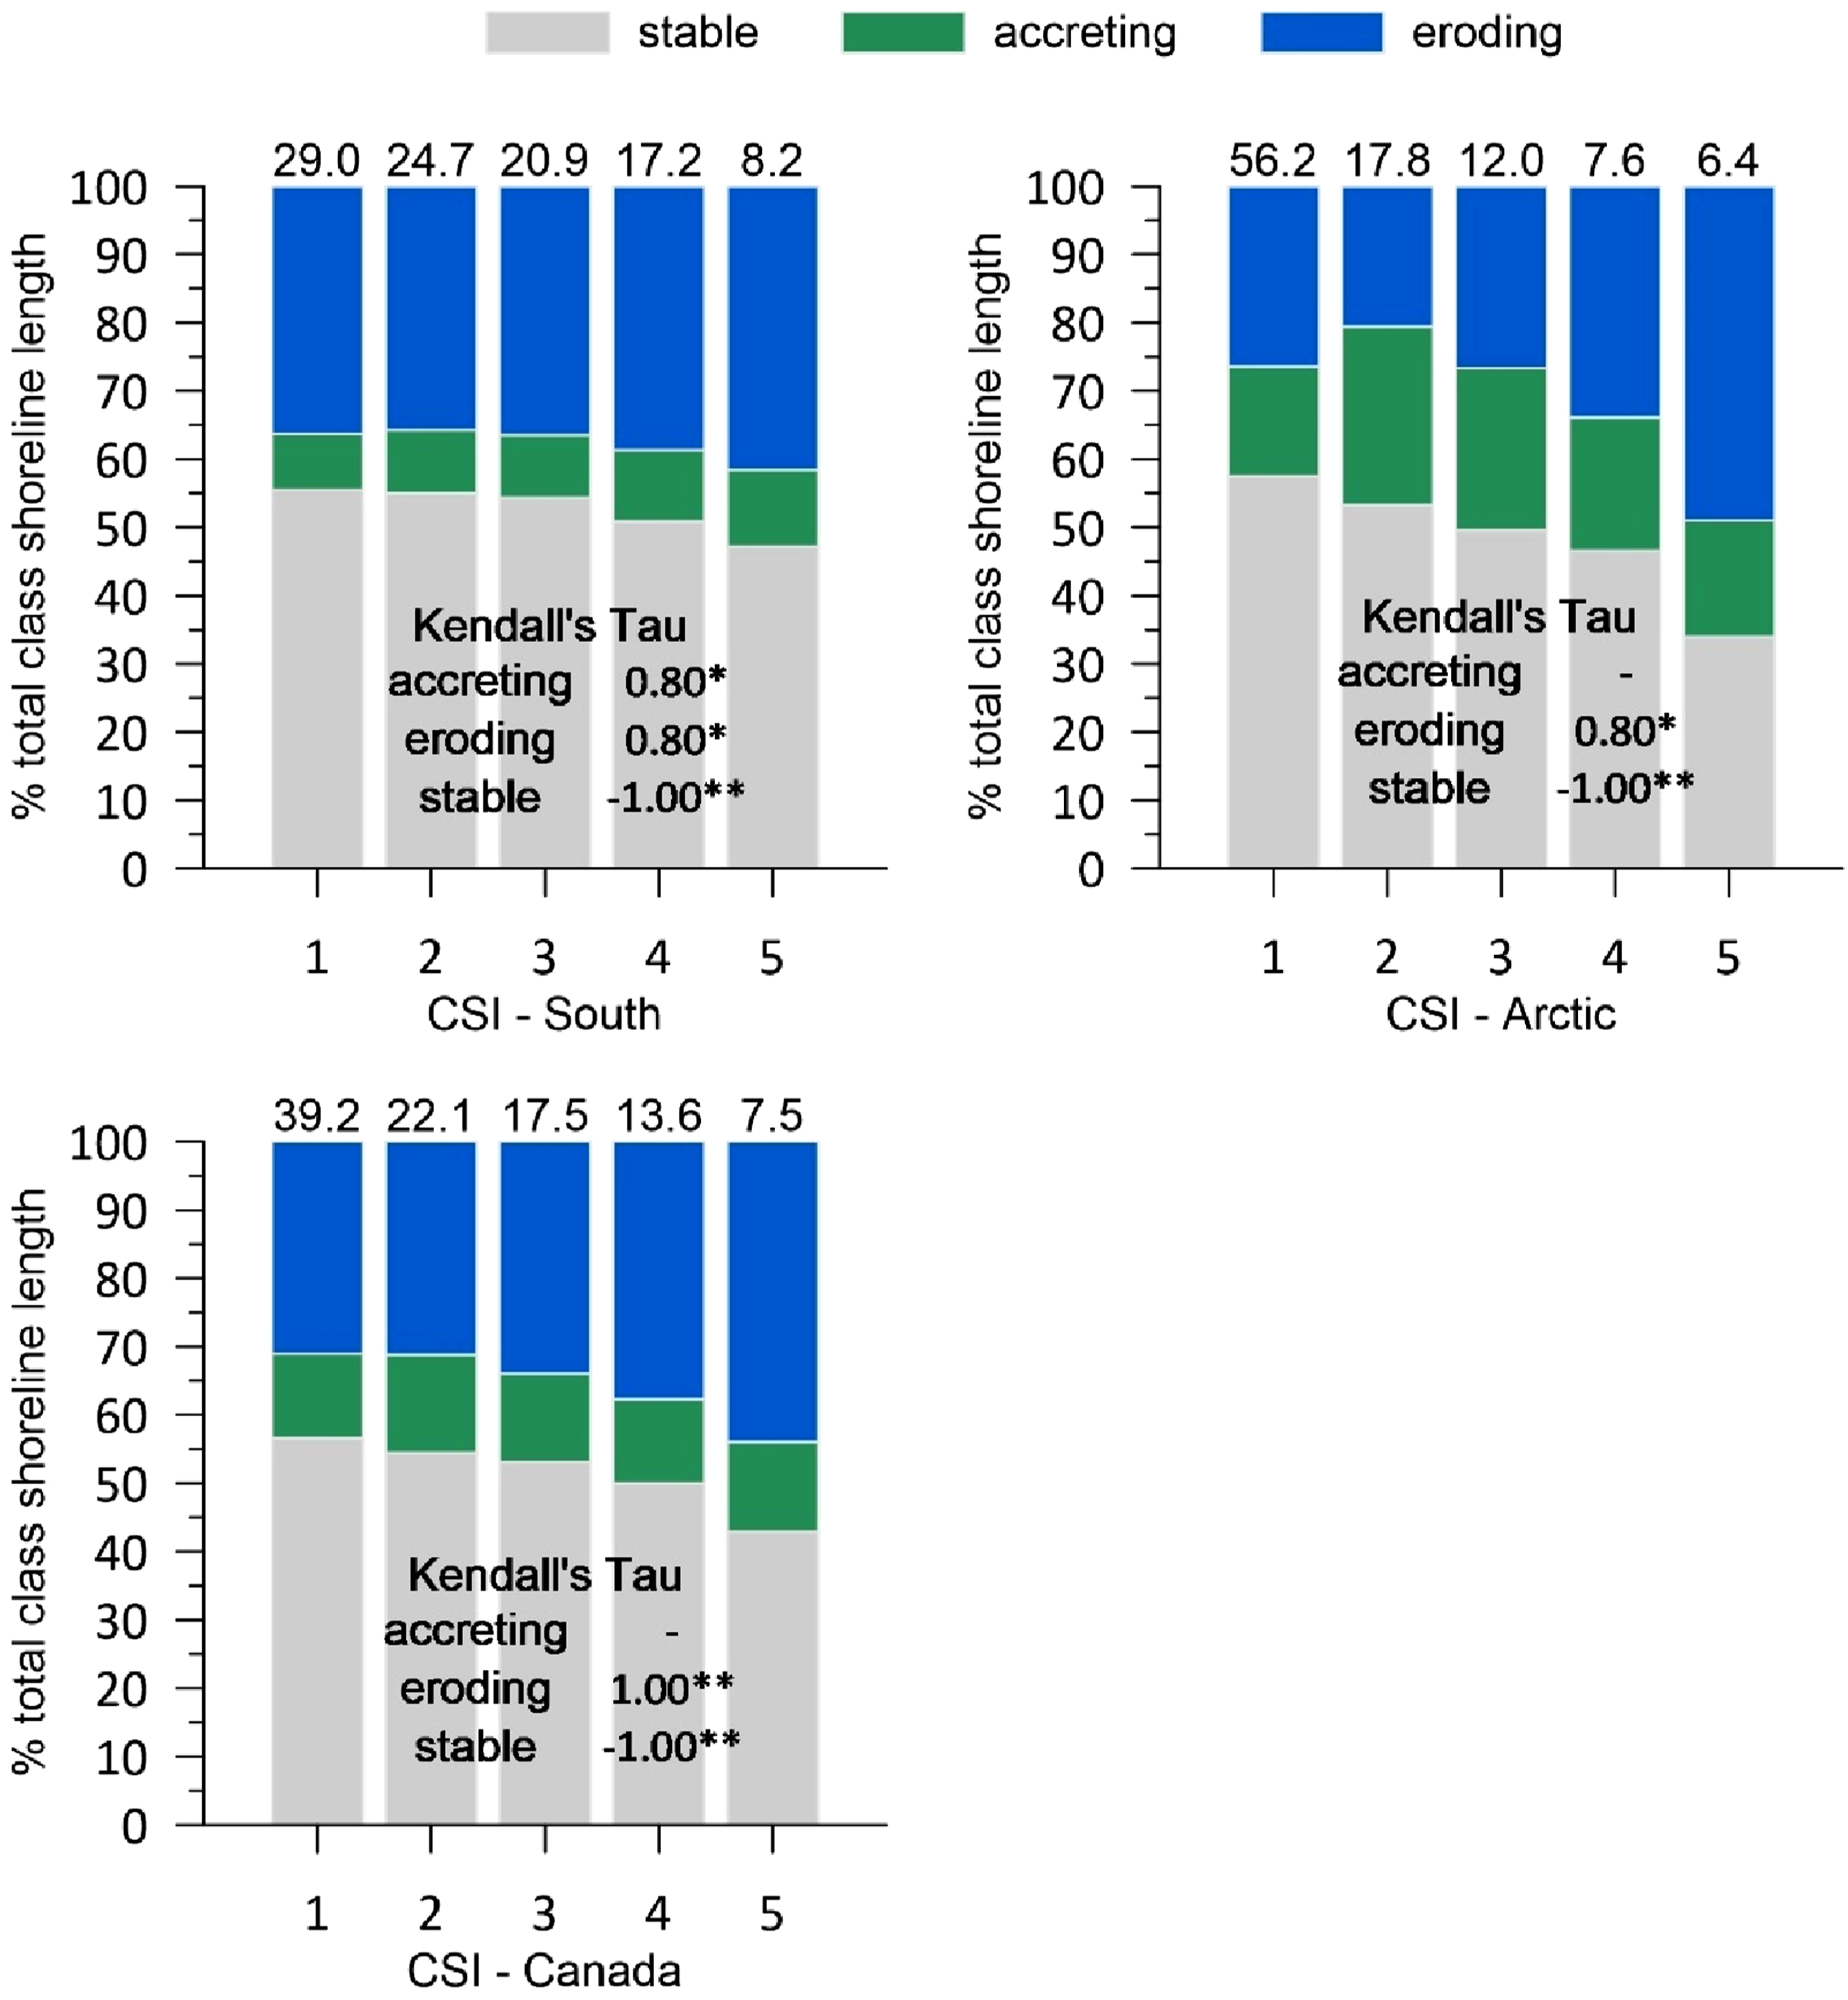
Discussion
Landsat water levels
Random clear-sky Landsat observations were combined to produce maximum water extents in annual masks from Olthof and Rainville (2022), and consensus water masks were generated from 5 consecutive annual masks to map shorelines in the current analysis. According to simulations, this method of generating shoreline products samples consistent water levels required to reliably detect change. Astronomical tidal range is nearly an order of magnitude greater at Charlottetown than Tuktoyaktuk while storm surge heights are similar, meaning that relative to astronomical tide, the meteorological effects on water levels are greater at Tuktoyaktuk compared to Charlottetown. This may be a contributing factor to higher tide prediction error in the Tuktoyaktuk region, but even for a more ideal case, simulations show that variance due to Landsat sampling and compositing is equal to or less than errors due to tide modelling for two stations in Arctic and southern Canada. Thus, caution must be used when relying on tide models for sampling, shoreline mapping and validation, and different Landsat compositing methods may be preferred to ensure consistent water levels in shoreline maps.
Simulations also reveal a bias toward higher mapped waterlines in the south compared to the Arctic, since water levels from sampling simulations were found to be relatively higher at Charlottetown (41–85 % of maximum water level) compared to Tuktoyaktuk (32–61 % of maximum) for 1–12 random Landsat observation dates. Differences in the length of annual compositing periods between regions may be a contributing factor to this discrepancy. A thorough analysis of the effects of Landsat sampling and compositing may be warranted by testing different methods in more, diverse environments; however, ultimately this is limited by sparse and incomplete tide gauge records, especially in the Canadian Arctic, and is beyond the scope of this paper.
Shoreline positional validation
The dynamic surface water dataset and approach used to extract shorelines is also suitable to map waterline position based on accuracy metrics obtained against WorldView water masks compared to benchmark results in Vos et al. (2023). While difficult to make exact comparisons, the site in Vos et al. (2023) that compared well to results from 13 of 16 scenes excluding the macrotidal Iqaluit site, was Truc Vert that has a sandy, shallow sloping beach, which should provide good contrast with water compared to variable shoreline materials across the 13 WorldView scenes. However, the tide range was less for all 13 scenes by a little more than a metre compared to Truc Vert, and all had shorelines with shallower slopes. Despite differences, Truc Vert had RMSE errors less than one pixel for four of five (80 %) algorithms tested, while we obtained RMSE errors of one pixel or less for 11 of 13 scenes (85 %) excluding the three macrotidal scenes.
Shoreline change
The Landsat shoreline change analysis suggests that in the 16 years corresponding to the first half of the 1987–2019 period, shoreline change was primarily due to erosion in southern Canada both in terms of the length of coastline affected as well as erosion rates along erosional shorelines. However, accretion was dominant in the Arctic region, leading to a net land area increase. In most areas in Canada except where directly influenced by rivers, materials at the shoreline are reworked glacial deposits and as they are reworked, both erosion and accretion can occur. At the mouth of rivers, delta progradation and accretion occur due to the deposition of sediment transported from upstream, and in the Arctic potentially from thermal denudation inland (Irrgang et al., 2022). There is evidence of enhanced atmospheric warming-induced permafrost thaw and precipitation extremes that have led to increased erosion of thermokarst landscapes and release and mobilization of sediments into rivers (Zhang et al., 2022). For example, Doxaran et al. used 2003–2013 MODIS ocean colour data to show a 33–71 % increase in the concentration of suspended sediments in the MacKenzie Delta flowing into the Beaufort Sea. While river sediments may account for Arctic coastline accretion locally, widespread accretion may be due to the fact that more than 80 % of Arctic coastlines below 76° N exhibited relative sea-level fall of 2 cm or more between 2006 and 2020 due to isostatic rebound that exceeded sea-level rise.
In the following 16-year period from 2003 to 2019, erosion length and area decreased in southern Canada while accretion increased. Despite this, erosion remained dominant in the south, causing a smaller but consistently decreasing net land area compared to 1987–2003. In the Arctic however, erosion area and length increased by nearly 50 %, while accretion decreased by 25 %, causing Arctic coastlines to switch from net accretion to net erosion. There is strong evidence that suggests accelerating erosion along Arctic coastlines is the result of climate warming, especially along permafrost coastlines due to permafrost thaw and melting ground ice (Jones et al., 2020), but also due to a shortening ice-free season causing increased wave fetch, height and duration (Reguero et al., 2019; Young et al., 2011), leading to thermal ablation. Climate warming is amplified in the Arctic, with a mean annual temperature increase of 2.7°C in the 46-year period between 1971 and 2017 (AMAP, 2019). Several sites along permafrost coasts have experienced increasing erosion rates over the same period (Jones et al., 2020). While much of the Canadian Arctic coastline is rising due to ongoing glacial isostatic adjustment (postglacial rebound), which in the absence of other factors would lead to coastline accretion, it appears that coastline positional changes are becoming increasingly dominated by factors related to climate change, leading to more coastal erosion.
Landsat provides the most detailed, continuous satellite data record available to study multi-decadal coastal dynamics at national to global scales. Well-calibrated 30 m resolution data from the mid-1980s to present are provided free to the public by the USGS through several platforms, making these data accessible for coastal change studies. A consistent data record suggests that measured changes will be reliable as long as the number of pixels sampled remains relatively constant between periods. The 32-year timespan in the current study suggests that a mean annual rate of 0.94 m/yr coastal change should produce a detectable, 1 pixel change over the entire 32-year period. A minimum rate for detectable change may be much less than this due to mixed pixels and classification errors and may also cause large differences between Landsat derived and in-situ rates of coastline change. For example, a mixed pixel with 49 % water fraction will be classified as land in a binary land/water classification in the absence of error. If the water fraction increases by 2 % to 51 %, the pixel will be detected as water under the same classification conditions. While Landsat suggests a one pixel or 30 m coastline accretion in this extreme case, real in-situ change could be as little as 2 % or 60 cm. Both Landsat and reference data are consistent in direction; however, the Landsat change is 29.4 m more, or 50 times greater than real, in-situ change. In practice, these kinds of mis-classification errors may generate erroneously large shoreline changes of both accretion and erosion locally; however, regional means are expected to be valid.
Despite an overall agreement in change direction, the effects of Landsat measurement precision and classification error undoubtedly lead to differences between Landsat and published coastal change rates described and reported earlier. The interplay of classification error and measurement precision is difficult to quantify since both are dependent on several factors including image quality, water depth and turbidity, shoreline material and aquatic vegetation, among other factors. Based on in-situ rates of coastal change, the Landsat record is becoming sufficiently long to reliably detect change in many locations at the pixel scale, while several coastline mapping algorithms detect shoreline positions at sub-pixel scale (Bishop-Taylor et al., 2021; Vos et al., 2023), further enhancing precision and minimum detectable change. To-date, rates of coastline change have been reported over a range of scales from local, point-based to long continuous coastlines in the ACD, leading to apparent differences and ambiguity in coastal change over a given segment. Reliance on satellite data such as Landsat provides a consistent 30 m resolution for reporting coastal change that can be aggregated to coarser resolutions, enabling precise segmentation into coastlines with similar behaviour and reporting of coastline change at arbitrary lengths and scales.
The significant agreement between the dynamic tendency of shoreline response as inferred from the CSI with measured erosion, accretion and stability from Landsat is broadly indicative that valuable information on the response of shorelines to changing climate can be obtained from Landsat shoreline mapping. In a coarse regional analysis, important differences between Arctic and southern shorelines are shown to be significant, and complex. The left-skewed distribution of the Arctic CSI likely shows the preponderance of low sensitivity and stable shorelines in the largely regressive Arctic not found in the predominantly transgressive south. Yet the stability of Arctic shorelines decreases more rapidly as sensitivity increases such that the dynamic response of sensitive Arctic shorelines is larger than those in the south. This suggests the presence of ground ice in the Arctic, even when viewed as a region, is a critical component in the morphologic response of Arctic shorelines. Whereas the majority of Arctic shorelines respond less dynamically, highly sensitive shorelines in the Arctic have a more dynamic response, particularly in terms of erosion, compared to those in the south.
Factors affecting coastline change transitions
Forcing of coastal change has been shown to be influenced by superimposed multi-year to multi-decadal cycles such as the El Niño Southern Oscillation and Pacific Decadal Oscillation (Barnard et al., 2015; Heathfield et al., 2013), the North Atlantic Oscillation (Vespremeanu-Stroe et al., 2007; Philips et al., 2012), and the Arctic Oscillation (Nielsen et al., 2022), and sub-decadal variability in Atlantic coastal sea levels have been linked to variability in the Atlantic Meridional Overturning Circulation (Ezer et al., 2013). When using only two change rates to calculate acceleration or deceleration, the result can be greatly affected by the start and end times of the measurements in the cycle. Acceleration may be measured when the first measurement is in a low part of the cycle and the second in a high part, while deceleration of change may be measured in the reverse case. The 16-year time period probably ameliorates the influence of sub-decadal cyclicity, but greater confidence in change acceleration or deceleration would be provided by higher temporal resolution measurements to identify nonlinear changes and quantify the variability due to superimposed cyclicity.
Larger rates of coastal change are found over individual 16-year periods compared to the entire 32-year period (Table 4). This is likely caused by the fact that a lower minimum rate is detectable over the 32-year period compared to each 16-year period, thereby reducing the average 32-year change rate. For certain parameters, one might expect change to be cumulative so that change over the whole 32-year period represents the sum of individual changes over consecutive 16-year periods; however, this assumption does not account for shorelines switching between erosional, accretional and stable states. For example, according to the transition matrix in Table 5, 4.1 % of Arctic coastlines switched from accretional to erosional, while 3.4 % changed from accretional to erosional over consecutive 16-year periods. An analysis of historical shoreline positions in the UK by Burningham and French (2017) noted a similar result in conventional coastal change detection as applied to a dataset spanning 135 years. Over decades and centuries, linear, regionally coherent trends were disrupted and even reversed in many cases. The emergence of non-linear trends underscores the value of the Landsat archive’s relatively long temporal coverage as well as its shortcomings, and the need to analyse and compare epochs internally.
Burningham and French’s (2017) work also examines the complex interactions between oceanic, anthropogenic and geological drivers that are difficult to interpret without including a shallow marine perspective which would consider subaqueous migration of sediment. Within the scope of Landsat-derived surface water mapping, change in sediment budgets and regimes of littoral drift can only be understood in their effect on the observed coastline position; the impact of climatic or meteorological drivers on these systems are therefore even more difficult to infer. Vos et al. (2023) make similar concessions for the uncertainties of wave runup and ocean oscillation, as the instantaneous state of a wave at the time of imaging cannot be known, which is supported by results of the application of wave correction in their benchmark study that produced variable results. Lantuit and Pollard (2008) noted in their study of Herschel Island how the emergence of thaw slumps accelerated local erosion – another factor that is difficult to predict. An analysis of coastal change in the Arctic must also contend with sea ice as well as ground ice; Solomon (2005) called attention to a lack of understanding of the role of sea ice in his study of the Beaufort-Mackenzie region, although an earlier report by Owens (1994) established that sea ice in the Arctic limits fetch distance and therefore the magnitude of shoreline change. As Burningham and French (2017) concluded, subaerial change detection is a single approach with limitations that other fundamental data can help mitigate.
Conclusions
Landsat provides the most detailed, extensive and continuous satellite data record available to study coastal dynamics at national to global scales. As the record covered by 30 m Landsat now exceeds 40 years in duration, its spatial resolution has become increasingly suitable for detecting the magnitude of shoreline positional change observed in many locations in Canada. The suitability of Landsat to characterize coastal dynamics and address information needs for ocean spill cleanup, infrastructure and ecosystem vulnerability, and climate change has motivated the development of a number of shoreline extraction algorithms. This study demonstrates that while generic water mapping algorithms and products may not be optimized for coastal applications, many are publicly available and are reliable for detecting shoreline positional change using the approach presented here according to simulation, validation of our products and compelling agreement with the CanCoast CSI.
This study suggests that coastal erosion is increasing along all of Canada’s coastlines south of 76° N, but most importantly, Arctic coastlines in Canada between 66.5° N and 76° N have recently switched from net accretion due to widespread land uplift caused by glacial isostatic adjustment and low wave energy, to net erosion as climate forcing appears to begin to dominate coastal processes. While many studies have reported or projected increasing coastal erosion in the Arctic (Barnard et al., 2015; Jones et al., 2018; Irrgang et al., 2022; Nielsen et al., 2022), to our knowledge, this is the first study to demonstrate that this is occurring at such a large scale and is explained in part by differences between coastal dynamics and sensitivity in the Arctic and southern regions. An implication of this switch from net accretion to erosion along Canada’s Arctic coastlines is enhanced positive feedback on climate, leading to higher rates of coastal change in the future (Nielsen et al. 2022, 2024). Extension of this analysis to the global scale using reliable surface water datasets and methods will provide a complete picture of global coastal change, while closer investigation of coastal regions defined by post-glacial histories experiencing significant vertical land motion and abundant postglacial sediments will help elucidate regional variability in coastline morphodynamics and change.
Footnotes
Acknowledgements
We thank Jordan Eamer for a helpful review and comments on a draft of this manuscript.
Funding
The authors disclosed receipt of the following financial support for the research, authorship, and/or publication of this article: Funding was provided under Canada’s Ocean Protection Plan 2.0 by Transport Canada. Support for CanCoast was provided by the Natural Hazards and Climate Change Geoscience Program of Natural Resources Canada.
Declaration of conflicting interests
The authors declared no potential conflicts of interest with respect to the research, authorship, and/or publication of this article.
Data Availability Statement
Datasets are available from the corresponding author upon request, and will be made publicly available through Open Data Canada.