
Abstract
Slackwater deposits representing past flood events provide a robust means to extend systematic gage records further back in time, place historic floods in a longer-term context, and reduce uncertainties in flood hazard analysis. The identification and application of slackwater deposits in riverine paleoflood hydrology has traditionally been limited to arid bedrock-controlled environments and periglacial environments. In this study, we utilize methods developed in humid alluvial settings and apply them to slackwater deposits, one of the first studies to do so. This novel approach uses sediment texture and geochemistry to distinguish slackwater deposits from in situ material in a temperate alluvial setting. We identify multiple slackwater deposits in two rock shelters situated on bluffs adjacent to the lower Ohio River. Flood age estimates are based on optically stimulated luminescence (OSL) dating, and discharge estimates are based on a 1D HEC-RAS model. The uppermost slackwater deposit at both sites corresponds to the AD 1937 historic flood of record (∼31,400 m3/s), while another slackwater deposit identified only at the lower elevation site corresponds to a paleoflood that occurred around AD 1650 with a discharge of ∼23,900 m3/s. Our findings imply that the AD 1937 flood represents the largest magnitude flood on the lower Ohio River in at least the last 400 years. Inclusion of the paleoflood into a flood frequency analysis for the Ohio River at Louisville reduces uncertainties in large flood quantiles by ∼50%.
Introduction
Riverine flooding causes millions of dollars of damage annually, and conventional estimates of flood hazard are limited by the short timescale of systematic discharge records (England et al., 2019). Reconstructing past flood occurrence and magnitude using paleofloods is a valuable tool to reduce the uncertainty of extreme flood probabilities in frequency analysis, and to place recent floods in a longer historical context (Baker, 2008; Toonen et al., 2015).
Paleofloods represent past or ancient floods that were not recorded by direct measurement, observation, or other documentation (Baker, 2008). One method of paleoflood analysis involves the use of slackwater deposits adjacent to the river channel. These slackwater deposits record evidence of individual floods (Baker et al., 1983; Kochel and Baker, 1982) and form when fine-grained sediments settle out of suspension in backwater areas or eddy zones where flow velocity is reduced. The elevation of a slackwater deposit may be used to estimate paleoflood stage and paleo-discharge using a hydraulic model (Harden et al., 2020). The identification and application of slackwater deposits has typically been limited to confined bedrock-controlled rivers in arid environments, where layered sequences of these deposits in bedrock canyons record a series of paleofloods (Baker, 1987; Kochel and Baker, 1988). Slackwater deposits have also been identified and used in periglacial environments to reconstruct the size of glacial outburst floods. Jökulhlaups in Iceland and outburst floods from Glacial Lake Missoula on the Columbia River have been recorded in sedimentary archives and add to our understanding of slackwater deposition over millennial time scales (Alho et al., 2007; Carrivick et al., 2004; Larsen and Lamb, 2016; Van der Bilt et al., 2021). In addition, slackwater deposits along the Tennessee River identified recently by Harden et al. (2020) demonstrate the potential for robust reconstructions of flood discharges in temperate alluvial settings, where caves, alcoves, bedrock ledges, and large colluvial boulders at multiple locations provide a suitable environment for slackwater accumulation and preservation (Harden and O’Connor, 2017).
Here, we extend the application of slackwater paleoflood hydrology to the lower Ohio River, the largest tributary by discharge of the Mississippi River. Flooding along the Ohio River has major economic and societal repercussions, as the river represents a major corridor for shipping and industry (Smith and Katz, 2013). Given the potential for slackwater deposits to be preserved in temperate alluvial settings, this study builds on the approach of Harden and O’Connor (2017) to: (i) identify slackwater deposits on the lower Ohio River, (ii) place large historic floods on this river in broader temporal context, and (iii) recalculate flood frequency analyses using paleoflood data developed in this study to reduce uncertainties in extreme flood probabilities on the Ohio River near Louisville, Kentucky. Our work represents an advance in the identification of slackwater deposits in temperate alluvial settings and provides constraints on extreme flood probabilities for one of the largest rivers in North America.
Hydrology
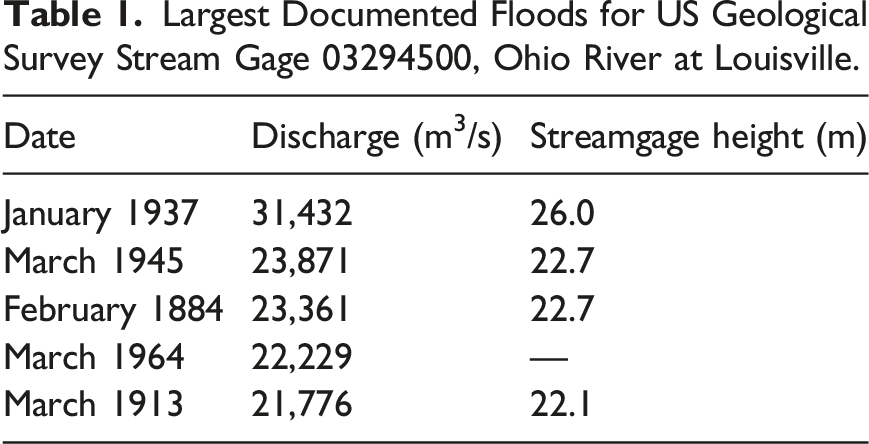
Largest Documented Floods for US Geological Survey Stream Gage 03294500, Ohio River at Louisville.
Study location
Our study focuses on Buzzard’s Roost Recreation area located in southern Indiana and encompasses a steep bluff along a meander of the lower Ohio River 100 km downstream of Louisville, Kentucky (Figure 1). This reach of the Ohio River is characterized by an incised channel bounded by bluffs that reach ∼30 m above bankfull stage. These bluffs consist of limestone and sandstone and contain ledges, rock shelters, and caves that present potential sites for the accumulation and preservation of slackwater deposits. There is one small ephemeral stream in the area of Buzzard’s Roost. The stream empties into a large basin on a steep slope, making it unlikely to back up into the cave site, so it is not considered in this study. Bedrock underlying this area is characterized by Mississippian shale, sandstone, and micritic and skeletal limestone from the West Baden Group and the Stephensport Group (Gray et al., 1987). Throughout the Pleistocene era, successive ice-sheet advances and retreats shaped the Ohio River valley between Cincinnati, Ohio to Louisville, Kentucky and diverted drainages into it (Ray, 1974). During glacial periods, the lower Ohio River was an outwash channel that served to rework and transport sediments eroded by the ice sheet. During interglacial periods, the Ohio River incised into older alluvial deposits and underlying sedimentary rocks (Ray, 1965). Lateral migration of the lower Ohio River is limited at present due to its incision into underlying bedrock (Bird et al., 2019). The contrast between local bedrock and sediment transported is significant because study site bedrock is mostly limestone and sandstone while river sediment contains sediment from the Grenville and Appalachian orogens upstream combined with Pleistocene glaciations (Benke and Cushing 2005). The steep topography of our study area makes it an ideal location for the deposition, preservation, and identification of slackwater deposits. Ohio River basin and the location of the field site (Buzzard’s Roost) and river gaging station (Louisville) on the Ohio River used in this study. The shaded area shows the Ohio River basin and the dark line is the main stem of the Ohio River. Streamflow is from right to left.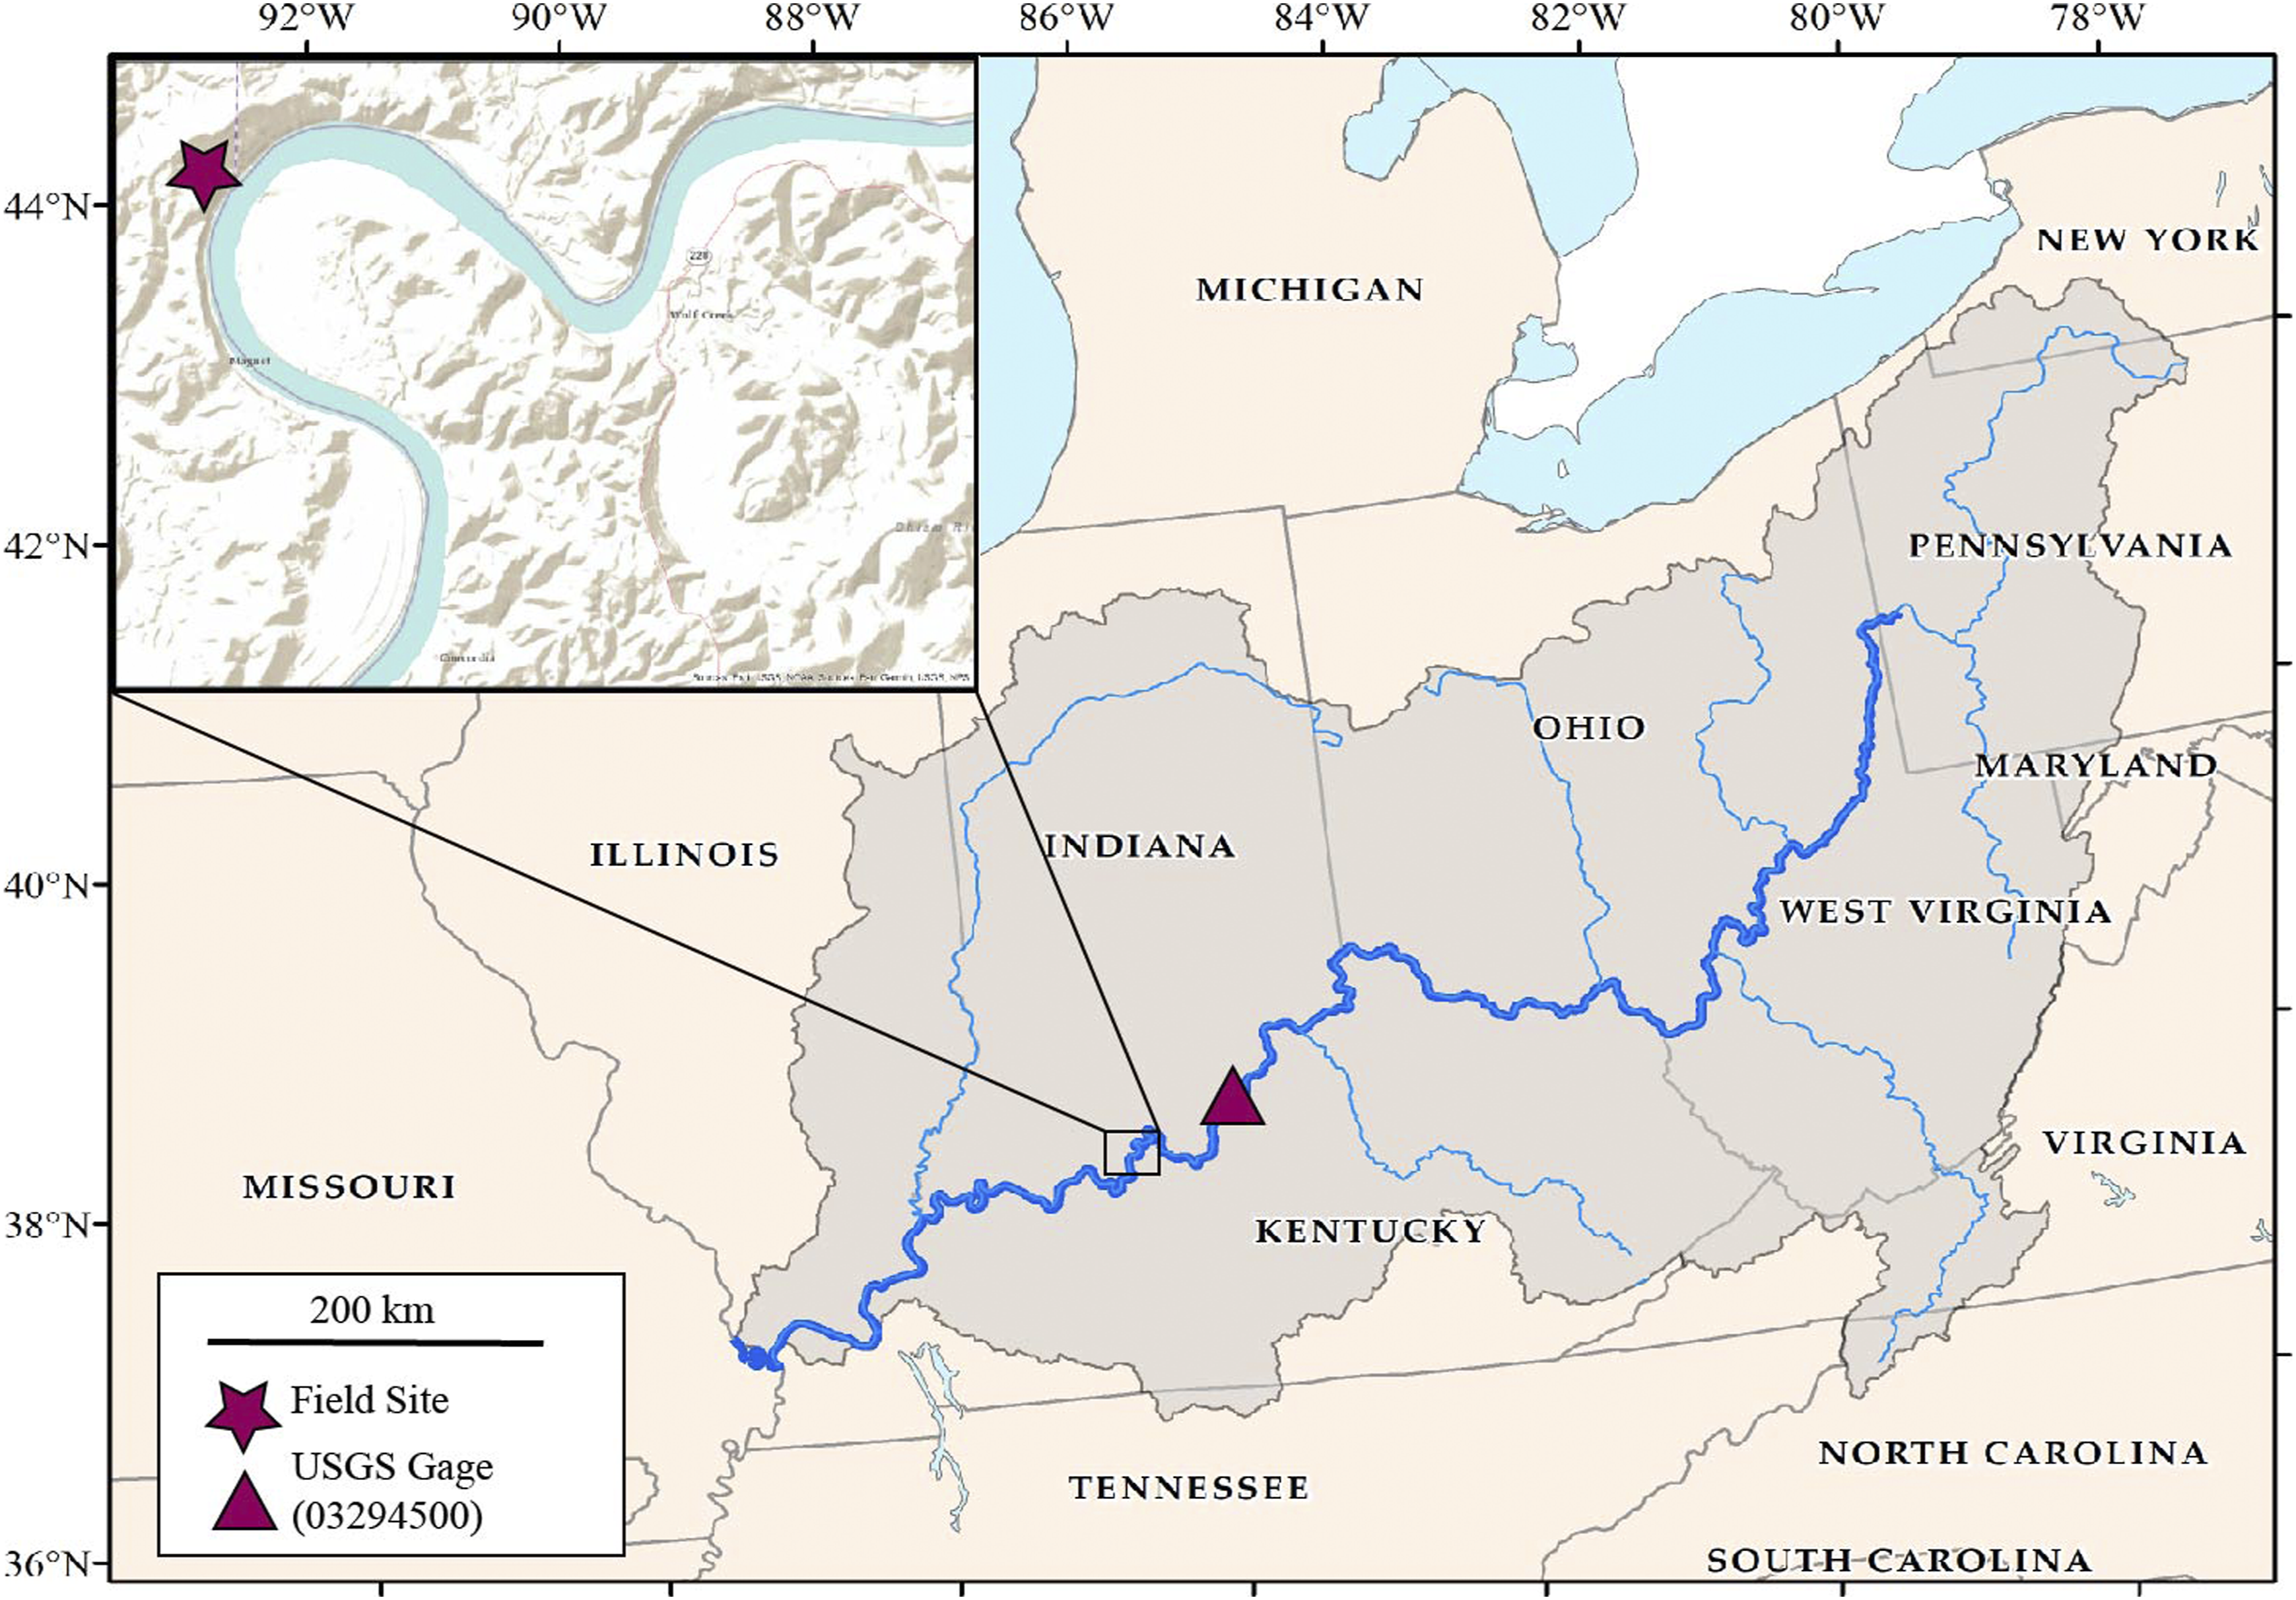
Methods
The primary motivation for this study is to develop paleoflood data for low-probability floods from the late Holocene and use that data to improve flood hazard assessments for the lower Ohio River. We also aim to further develop techniques to identify slackwater deposits in temperate alluvial settings. To meet these objectives, we followed the methods described below.
Hydraulic model
To link river discharge to river stages, we use the Ohio River Community HEC-RAS Model, a joint effort between the US National Weather Service (NWS), Ohio River Forecast Center (OHRFC), and the US Army Corps of Engineers (USACE) that developed a 1D unsteady flow model for the mainstem of the Ohio River comprising over 2800 cross-sections spanning ∼2000 km of river reach (Adams et al., 2010). The downstream boundaries are Chester, Illinois, and Carruthersville, Missouri, while the upstream boundaries include the Braddock Lock and Dam, West Virginia. The model includes 23 locks and dams, levees, bridges, and storage area connections, and its cross-sections extend to the 500-year floodplain limits (Adams et al., 2010). Model topography and bathymetry is based on a USGS 10 m digital elevation model, lidar data, and bathymetric and in-channel cross sections from the USACE. The Manning’s n value for our study area is 0.021 and 0.21 for the riverbanks. The model is fully georeferenced to the NAVD 88 datum in compliance with current technical guidance. We use the Ohio River Community HEC-RAS Model to estimate flood stages in our study area for flood discharges associated with large floods including 1937, 1945, 2011, and bankfull (31,400 m3/s, 23,900 m3/s, 18,200 m3/s, 5600 m3/s, respectively). Lowhead dams and locks on the Ohio River were not removed for estimation of paleoflood magnitudes because the low profiles of these engineered features exert minimal influence on channel hydraulics during extreme floods. The primary purpose of the locks and dams on the Ohio River is to maintain a reliable and navigable channel for vessels because of their structure they do not prevent flooding. In some sections of the river, they can influence the water level to a small extent, but they will not impact extreme flood events such as the 1937 flood. The earliest locks and dams were constructed in the mid-1800s, and then more were added and old ones replaced in the early to mid-1900s (Oxx, 1935). As the cross sections in this model encompass our study area, these modeled estimates of flood stages were used to guide our field sampling at various elevations along the bluff. The river channel is assumed to be stable for all simulated floods because lateral migration and bed elevation change during the late Holocene is minimal in this area. After the Ohio River established a meandering channel and then incised its floodplain, it has been stable with only 1 m of aggradation per 1 ka for the last 4 ka (Counts et al., 2015), with limited area to move around in.
Field sampling
Sediment samples for this project were collected by digging soil pits in rock shelters, caves, and small alcoves on the bluff at various elevations above the Ohio River. Based the elevation of peak stages using hydraulic model simulations of major historical floods, we identified potential locations for sampling on the bluffs at Buzzard’s Roost Recreation Area (Figure 2). Initial field work was conducted in March 2020, with subsequent sampling in June and November 2021. Although multiple locations were scouted, all samples presented in this study are from sites in Buzzard’s Roost Recreation area (58.11,713°N, 85.46,616°W) near Leavenworth, Indiana (Figure 1). This area provided the best conditions for deposit preservation. Two sites were mainly used for sedimentary analysis, here named BUZZ1 and BUZZ2. BUZZ1 (131 m asl) is a pit located under a sandstone ledge along the trail to the river. BUZZ2 (128.4 m asl) is a pit ∼10 m from BUZZ1. BUZZ2 was dug in a cave site located below a small ephemeral stream. Modern river sediment was sampled from the river by wading into the river and collecting bed load sediments from the bottom of the river. At each sampling location, stratigraphy was described in terms of color, texture, sorting, grain mineralogy, presence of organic material, structure, and other notable features. Sediment samples were collected for each stratigraphic layer identified in the field, as well as additional sampling around notable features including suspected slackwater deposits. In total, 18 samples were taken across all sites, with nine from BUZZ1 (ledge site), seven from BUZZ2 (cave site), and two from the river. These samples were transported back to Northeastern University and used for laboratory measurements of grain size and mineralogy that form the basis for the differentiation of slackwater (SW) deposits from in situ (IS) sediments. Samples for OSL dating were taken by pushing PVC tubes horizontally into targeted layers. Field sites and hydraulic model output: (a) Cross-section from HEC-RAS model at Buzzard’s Roost Recreation Area showing flood stages and associated discharges. Inset shows (b) site photograph of BUZZ1; (c) site photograph of BUZZ2; (d) inset of field site area with location of cross section on the lower Ohio River.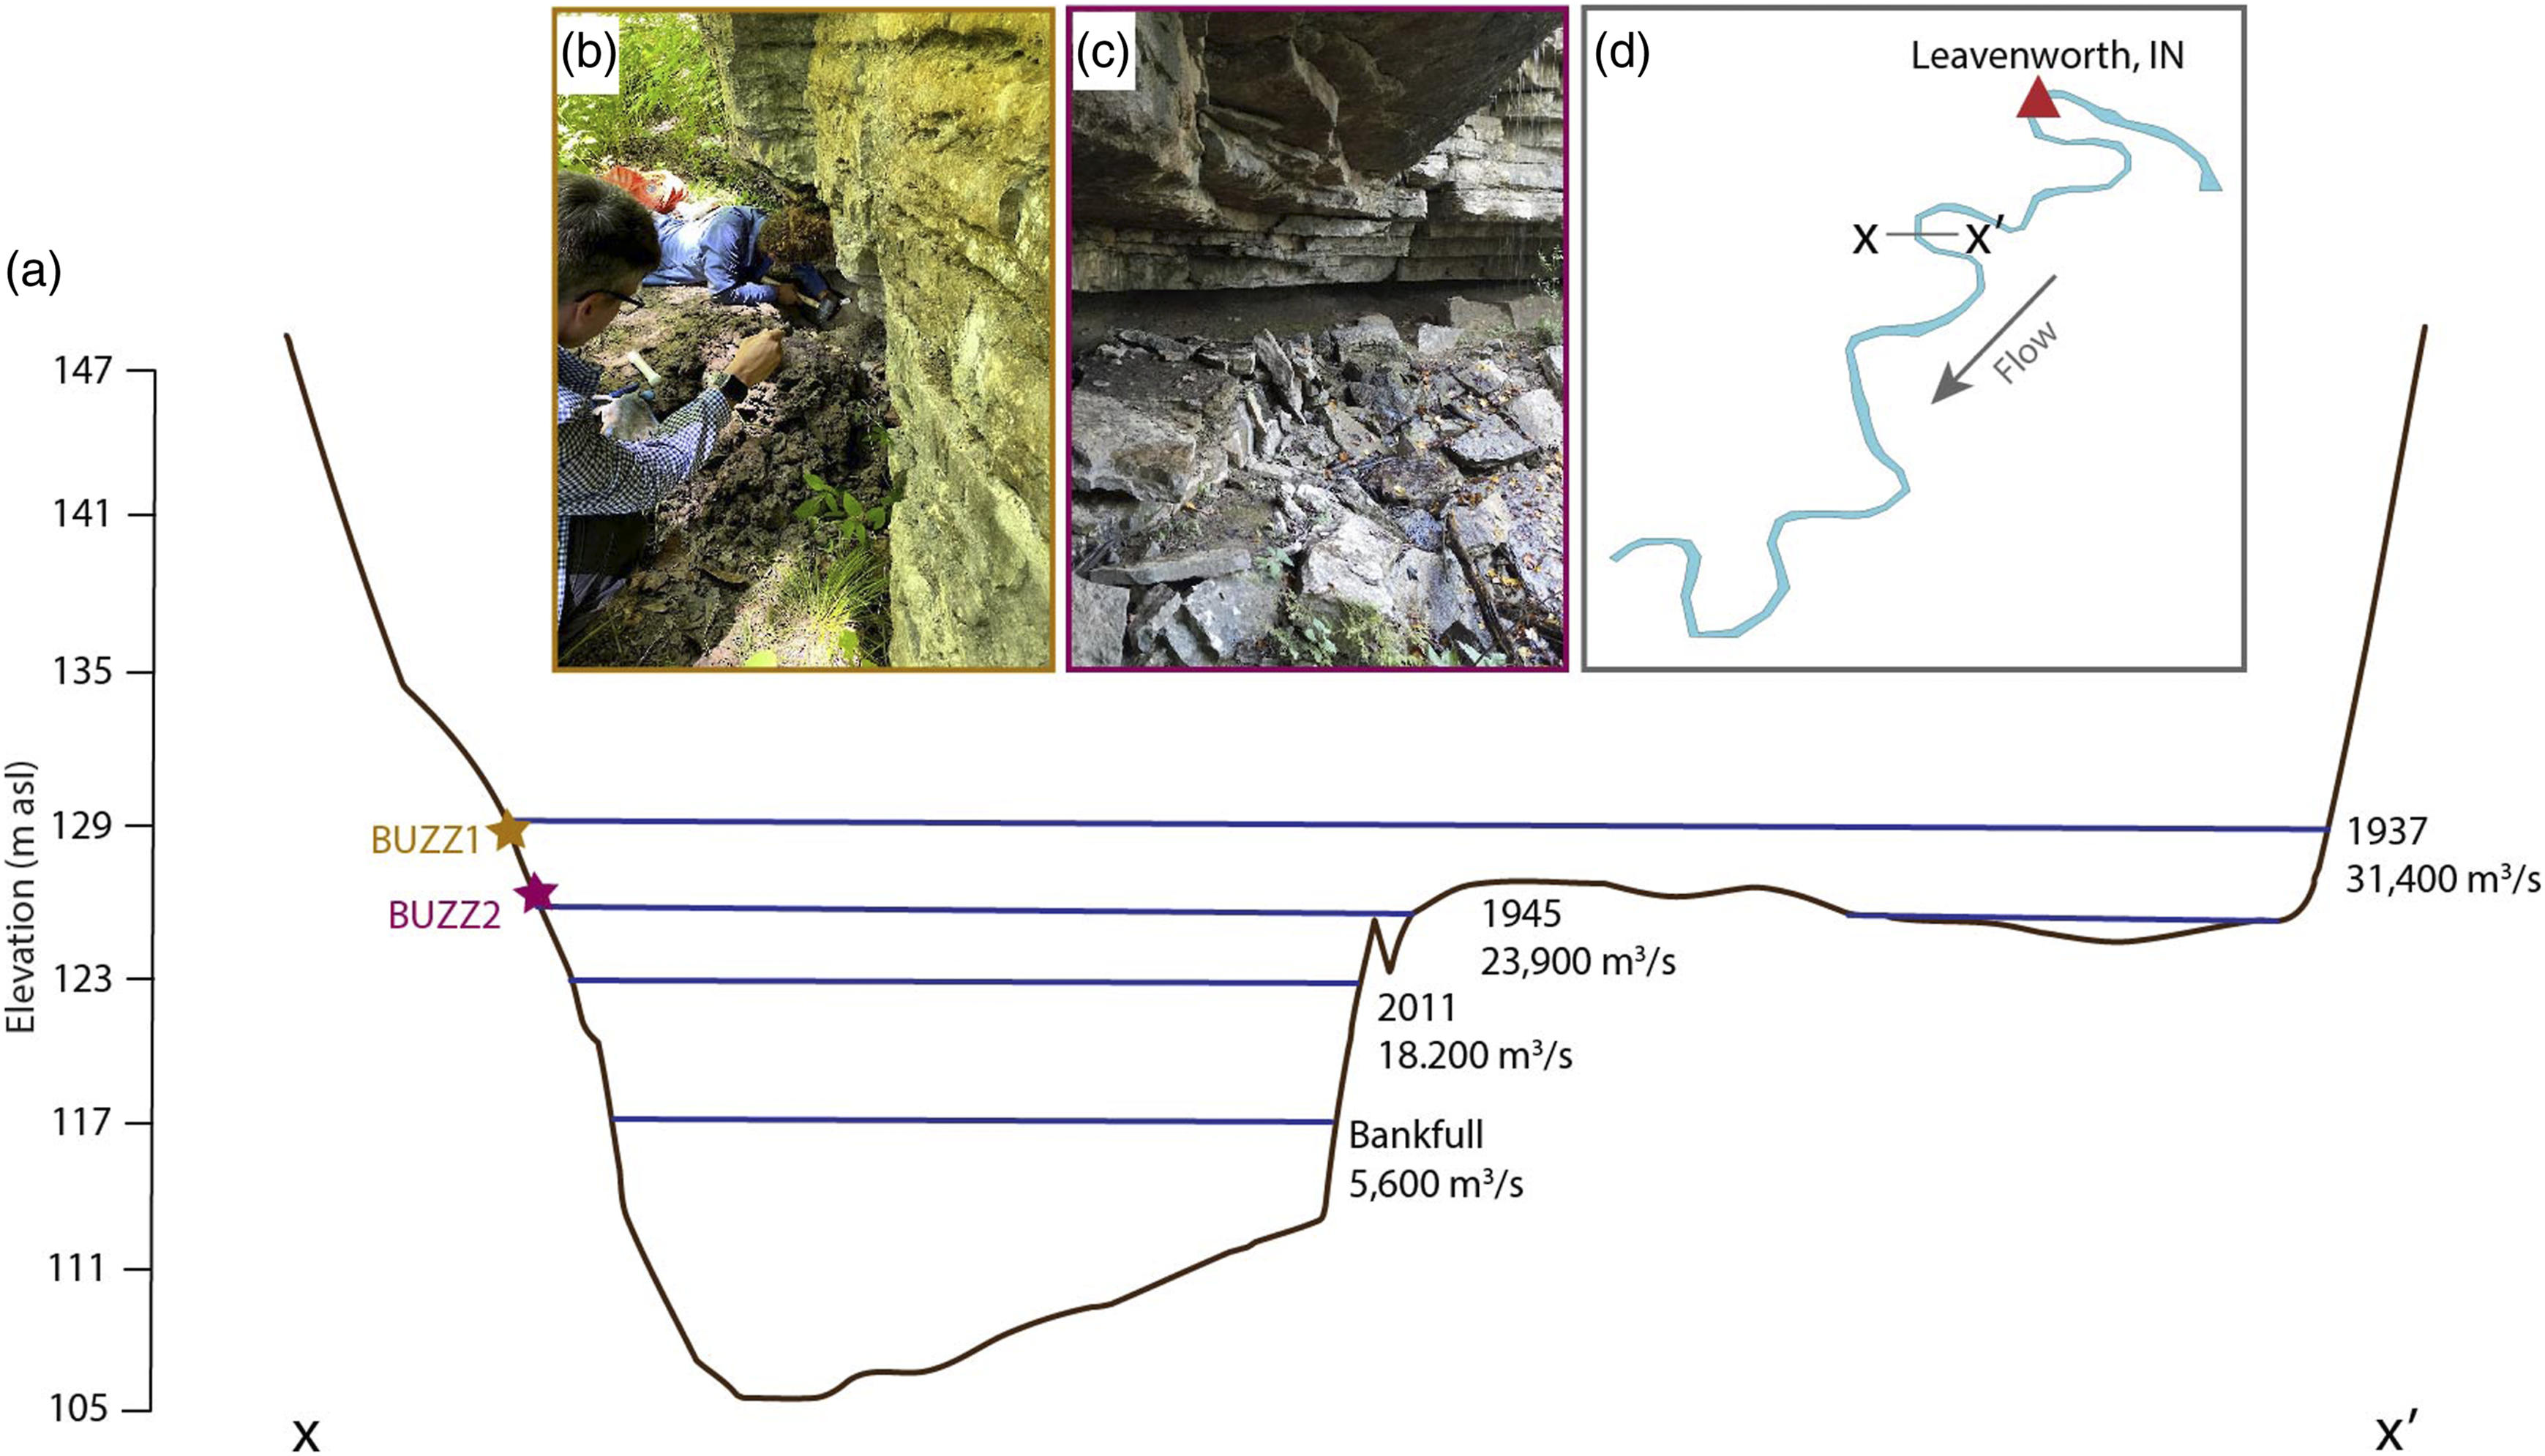
Grain-size analysis
Grain-size samples were taken from sample bags in 1 cm3 increments for each sample collected in the transects. Samples were successively pre-treated with 10 mL 30% H2O2 to remove organic matter and with 0.5% sodium hexametaphosphate (NaPO3) to disperse the sample. Grain-size distributions in the 0.001–3500 um range with 75 classes were analyzed using a Malvern Mastersizer 3000 LV laser diffraction particle size analyzer at the Northeastern University Marine Science Center. Each sample was measured three times and checked for consistency prior to calculating the sample mean for each class range.
X-ray diffraction
We use X-ray diffraction (XRD) to understand the mineral composition of our samples, specifically to differentiate local mineralogy from in situ weathering from the mineralogy of sediments transported by the Ohio River. In some cases, slackwater mineral assemblages determined by XRD are typical of a particular region (Curry and Grimley, 2005) and river sediment (Maity and Maiti, 2016; Karikalan et al., 2020). Mineral ratios in sedimentary beds are diagnostic for different source areas and transport in catchment areas (Maity and Maiti, 2016). The samples were disaggregated manually with a mortar and pestle. Coarse-grained samples were reduced to silt size which optimized the grain sizes of crystallites for XRD. X-ray diffraction peak heights were determined from aggregate slides of 18 samples using a Rigaku Miniflex 600 diffractometer located at Northeastern University and corrected by the peak intensity factors (Hughes et al., 1994). Peak heights for common phyllosilicates, carbonates, and silicates in the clay were measured at fixed 2θ positions. 2θ in XRD is the total change in the angle of the electromagnetic wave. We then used a principal components analysis (PCA) with the mineral peaks matrix for all samples to determine a mineralogical fingerprint in each deposit, and to identify slackwater deposits by similarity in mineral makeup to river sediment mineralogy.
Age dating
We use quartz OSL dating to estimate the ages of slackwater deposits. OSL uses environmental radiation energy stored within mineral crystals in the form of trapped charges to determine the time since light exposure before their last burial. The light exposure resets the OSL clock by evicting electrons trapped in the light-sensitive traps (Aitken, 1998; Rhodes, 2011). OSL dating is commonly used in paleoflood studies to estimate the ages of floodwater deposits, including slackwater (Baker, 2008; Huntley et al., 1985; Liu et al., 2020; Muñoz et al., 2018).
Analytical OSL Data.
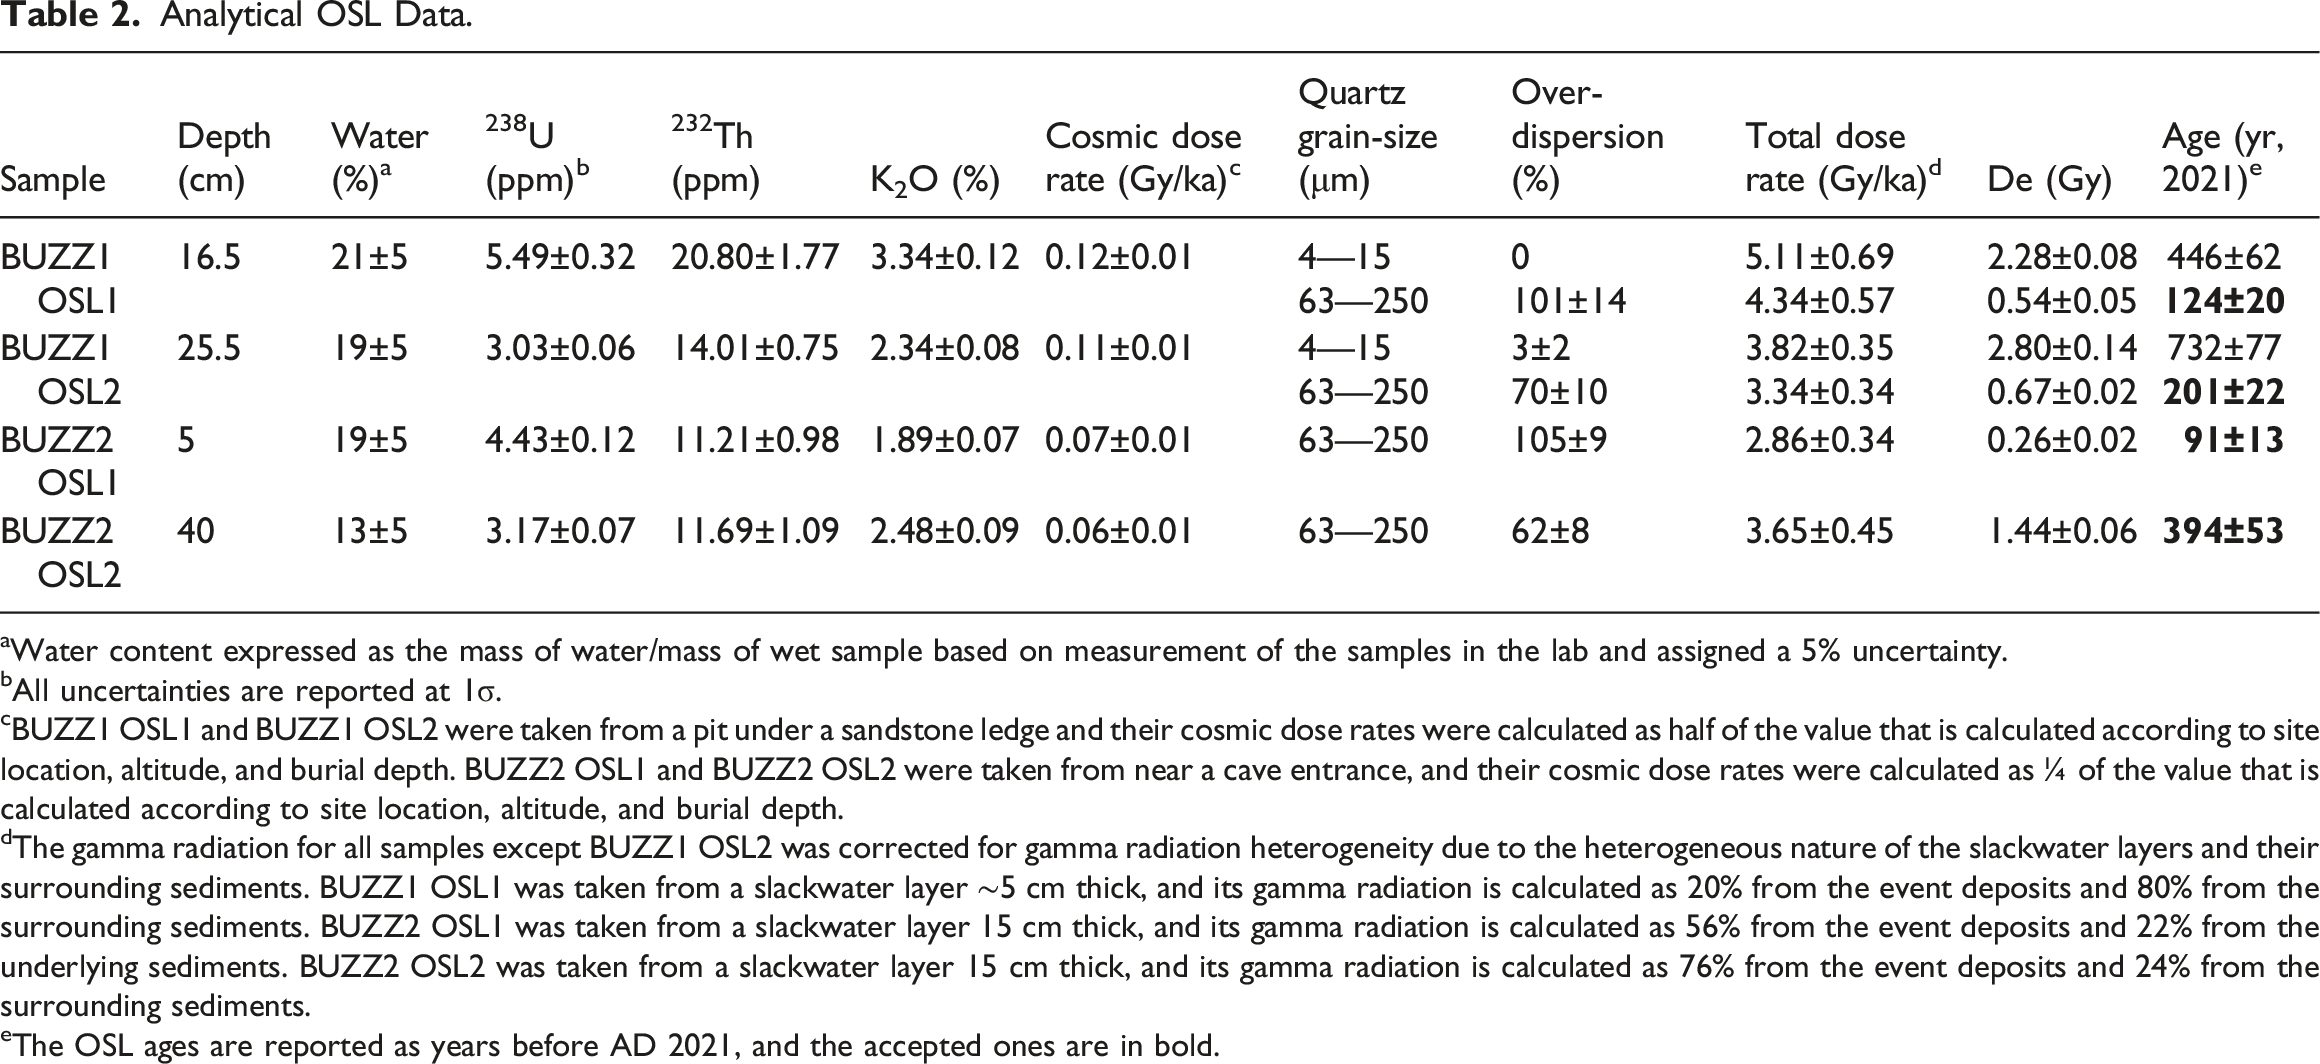
aWater content expressed as the mass of water/mass of wet sample based on measurement of the samples in the lab and assigned a 5% uncertainty.
bAll uncertainties are reported at 1σ.
cBUZZ1 OSL1 and BUZZ1 OSL2 were taken from a pit under a sandstone ledge and their cosmic dose rates were calculated as half of the value that is calculated according to site location, altitude, and burial depth. BUZZ2 OSL1 and BUZZ2 OSL2 were taken from near a cave entrance, and their cosmic dose rates were calculated as ¼ of the value that is calculated according to site location, altitude, and burial depth.
dThe gamma radiation for all samples except BUZZ1 OSL2 was corrected for gamma radiation heterogeneity due to the heterogeneous nature of the slackwater layers and their surrounding sediments. BUZZ1 OSL1 was taken from a slackwater layer ∼5 cm thick, and its gamma radiation is calculated as 20% from the event deposits and 80% from the surrounding sediments. BUZZ2 OSL1 was taken from a slackwater layer 15 cm thick, and its gamma radiation is calculated as 56% from the event deposits and 22% from the underlying sediments. BUZZ2 OSL2 was taken from a slackwater layer 15 cm thick, and its gamma radiation is calculated as 76% from the event deposits and 24% from the surrounding sediments.
eThe OSL ages are reported as years before AD 2021, and the accepted ones are in bold.
Flood Frequency Analysis
Two different flood frequency analyses were computed based on USGS gage data for the Ohio River at Louisville (gage ID 03294500) and the paleoflood data developed in this study. One flood frequency analysis used only the systematic and historical peak record at the Louisville gage. The other flood frequency analysis included the gaged and historical records plus the paleoflood data developed in this study, for which we assumed no floods had happened over the paleoflood period that exceeded the paleoflood magnitude. For both analyses, we use a Generalized Extreme Value (GEV) distribution because it fits the average statistical properties of annual maxima records throughout the United States (Vogel and Fennessey, 1993; Vogel and Wilson, 1996). A GEV distribution was fitted to the peak flow data through a maximum likelihood estimator algorithm, and we computed 95% confidence intervals for the flood frequency curves through the covariance matrix of the fitted model parameter.
Results
Hydraulic Modeling
Hydraulic model simulations of major historical floods were used to identify locations for sampling at Buzzard’s Roost Recreation Area (Figure 2). We focused our analyses on two sites, named BUZZ1 and BUZZ2. BUZZ1 requires a flood stage of at least 131 m asl, at least 12.8 m higher than bankfull water surface elevation (bankfull elevation 118.2 m asl) to be inundated. This river stage is attained at a discharge of ∼31,400 m3/s. BUZZ2 site sits 2.6 m below the elevation of BUZZ1 and requires a flood stage of at least 128.4 m asl, or 10.2 m above bankfull stage or a discharge of ∼23,900 m3/s for inundation.
Stratigraphic profiles
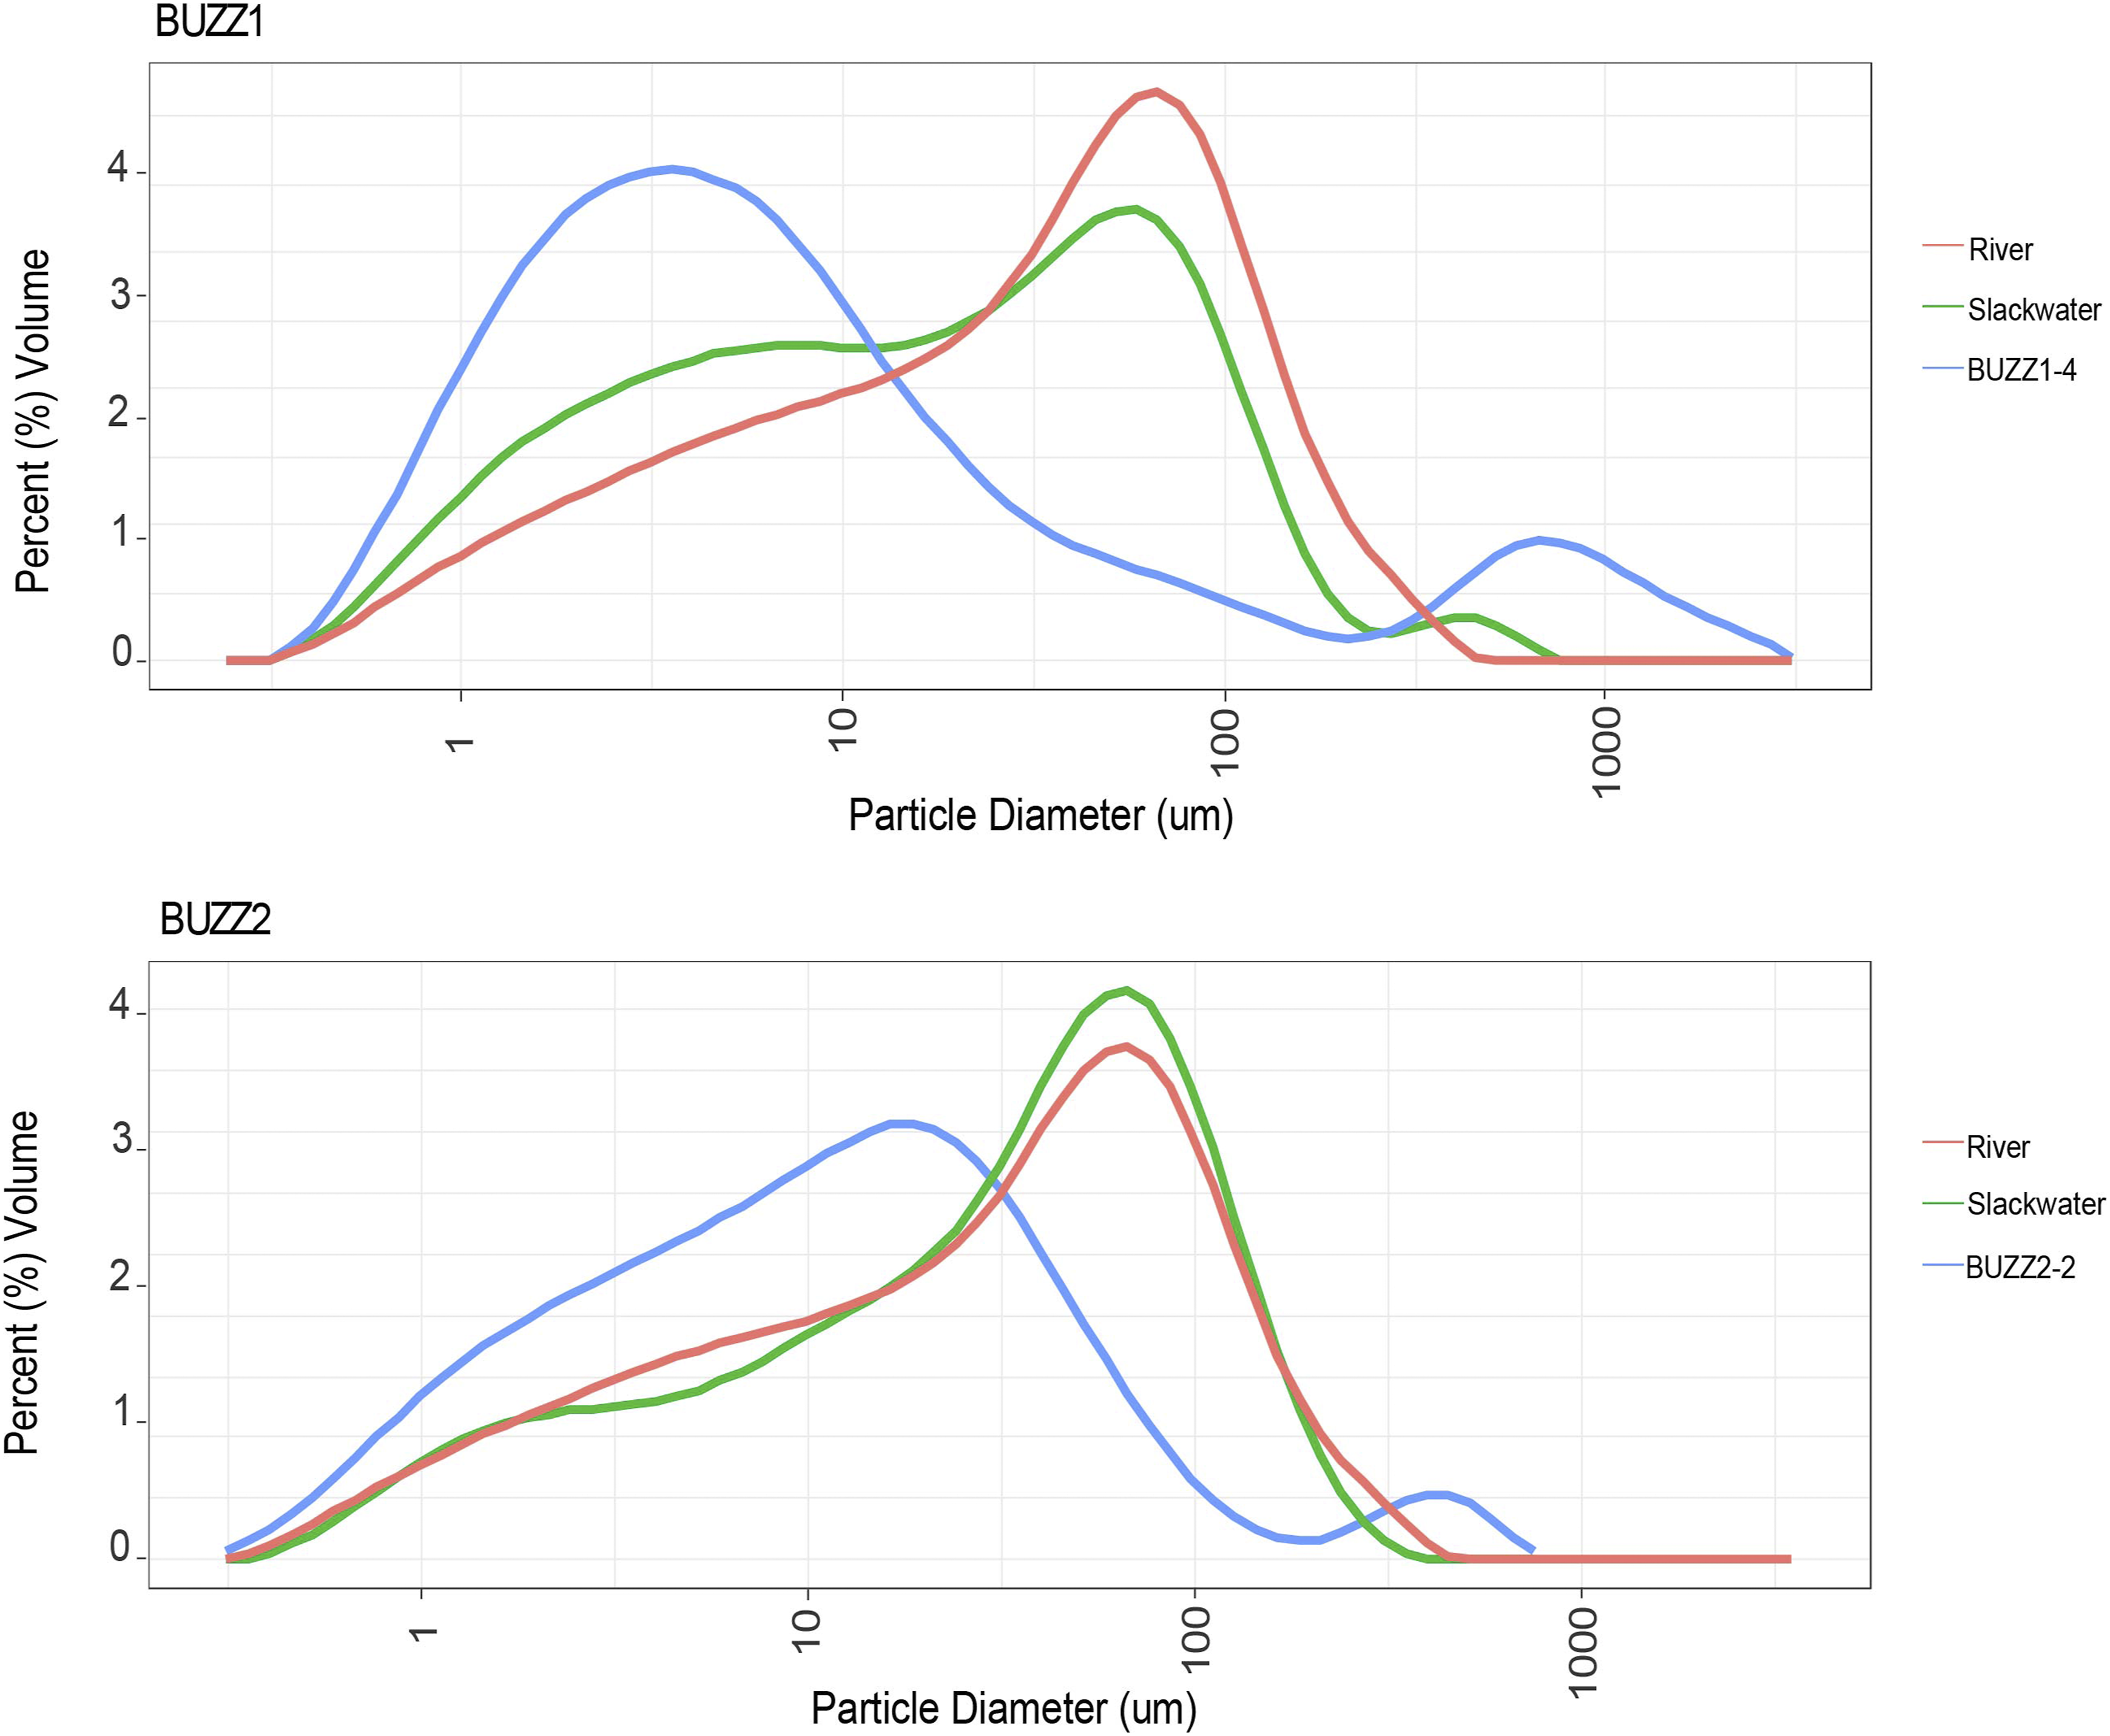
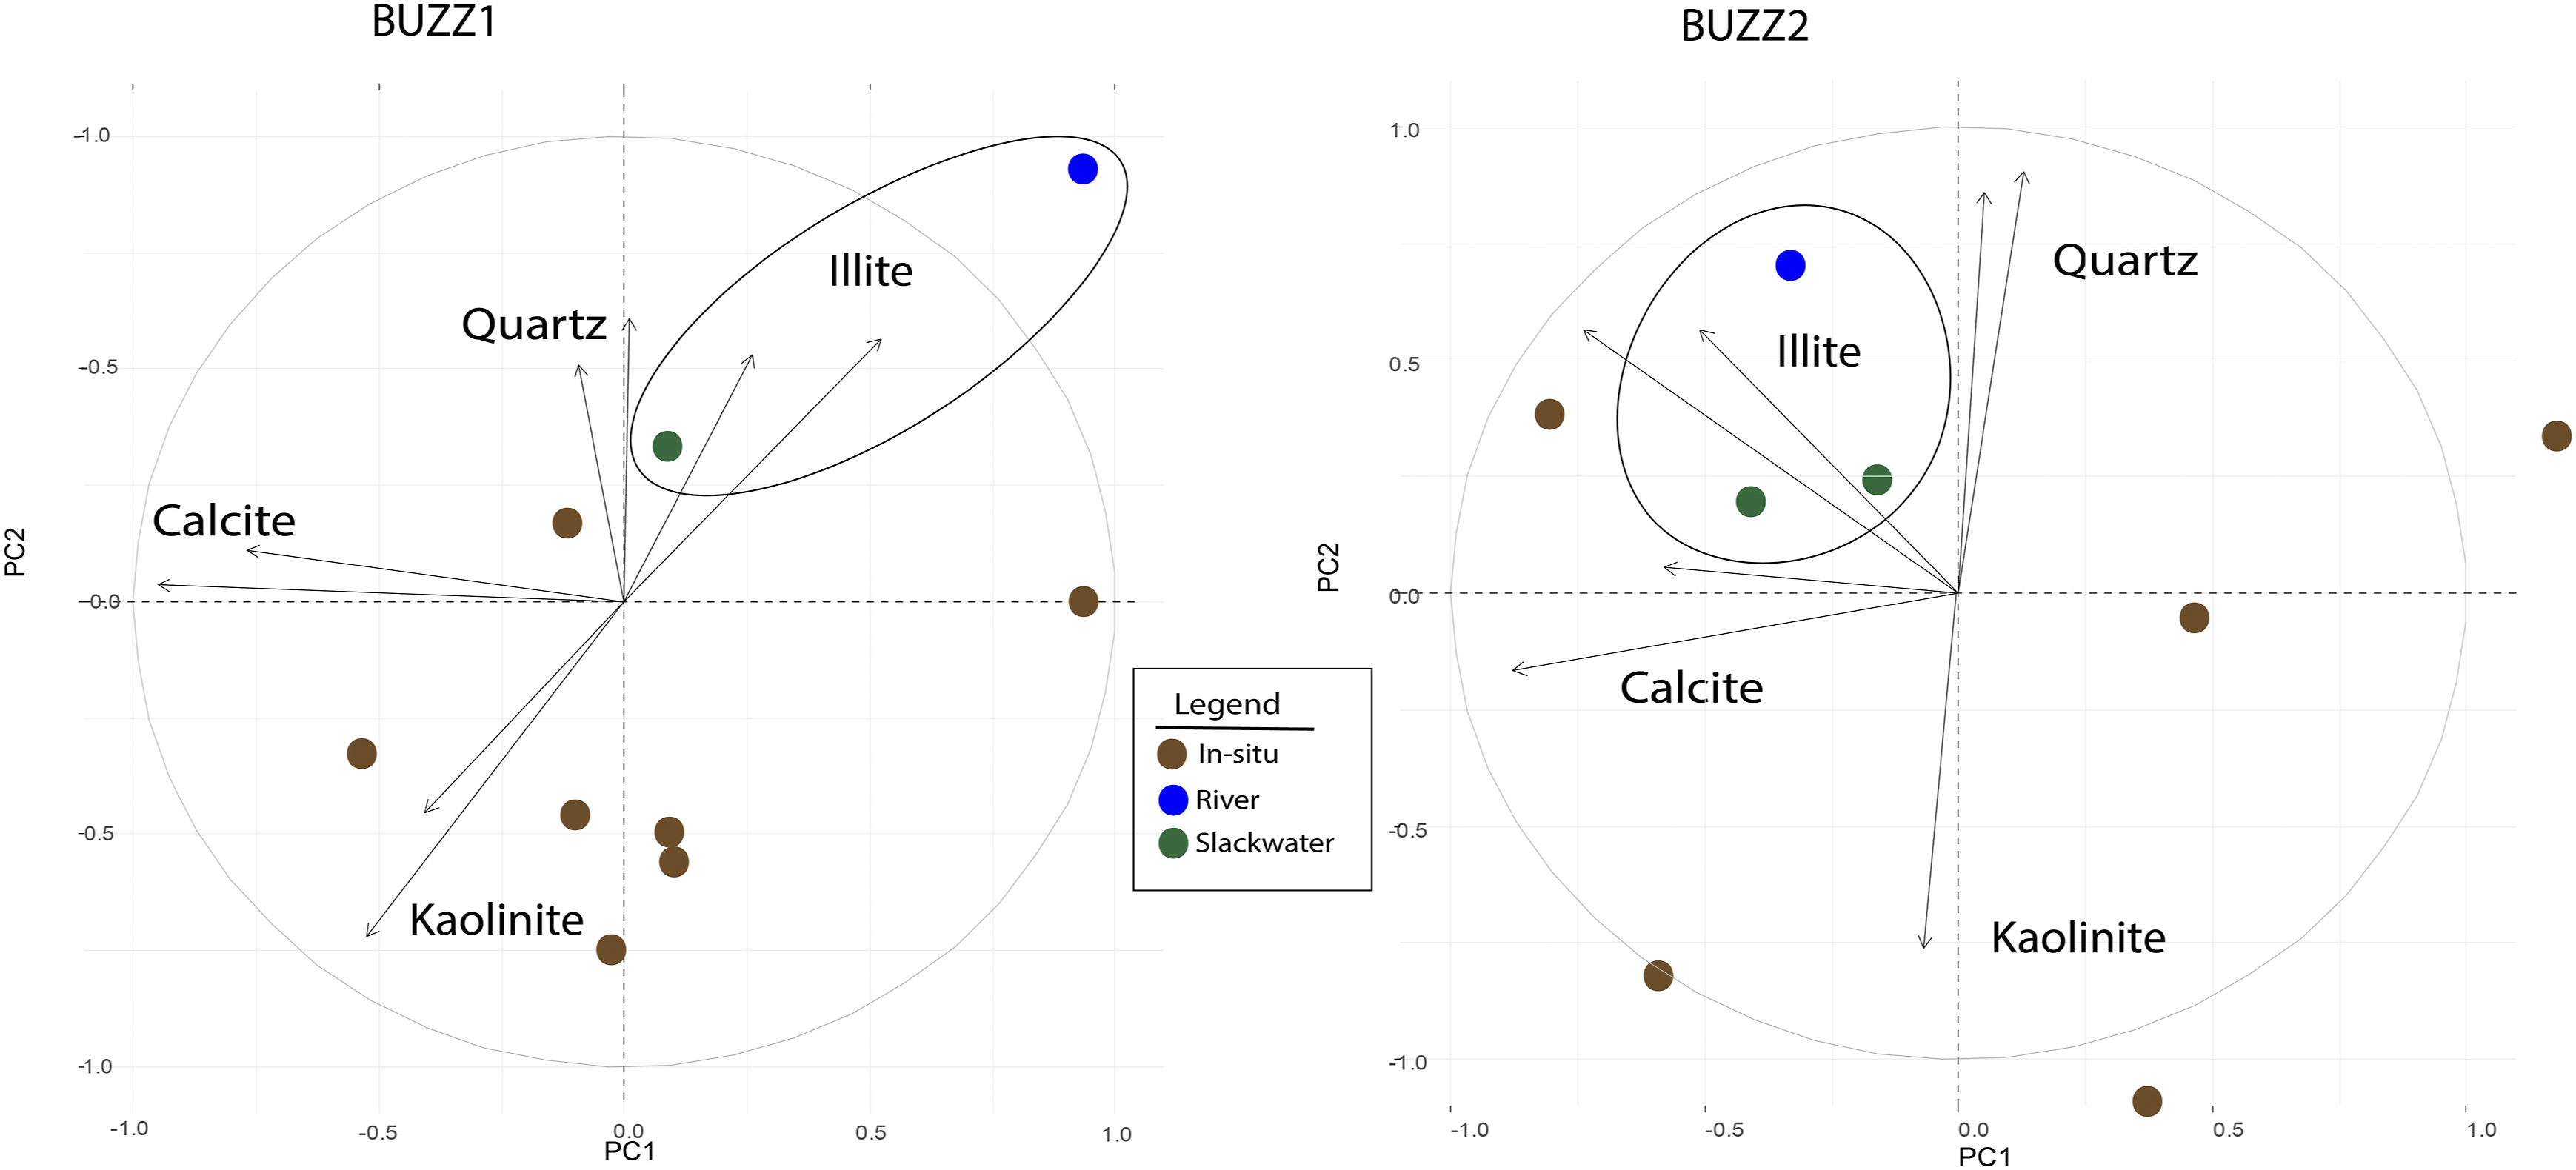
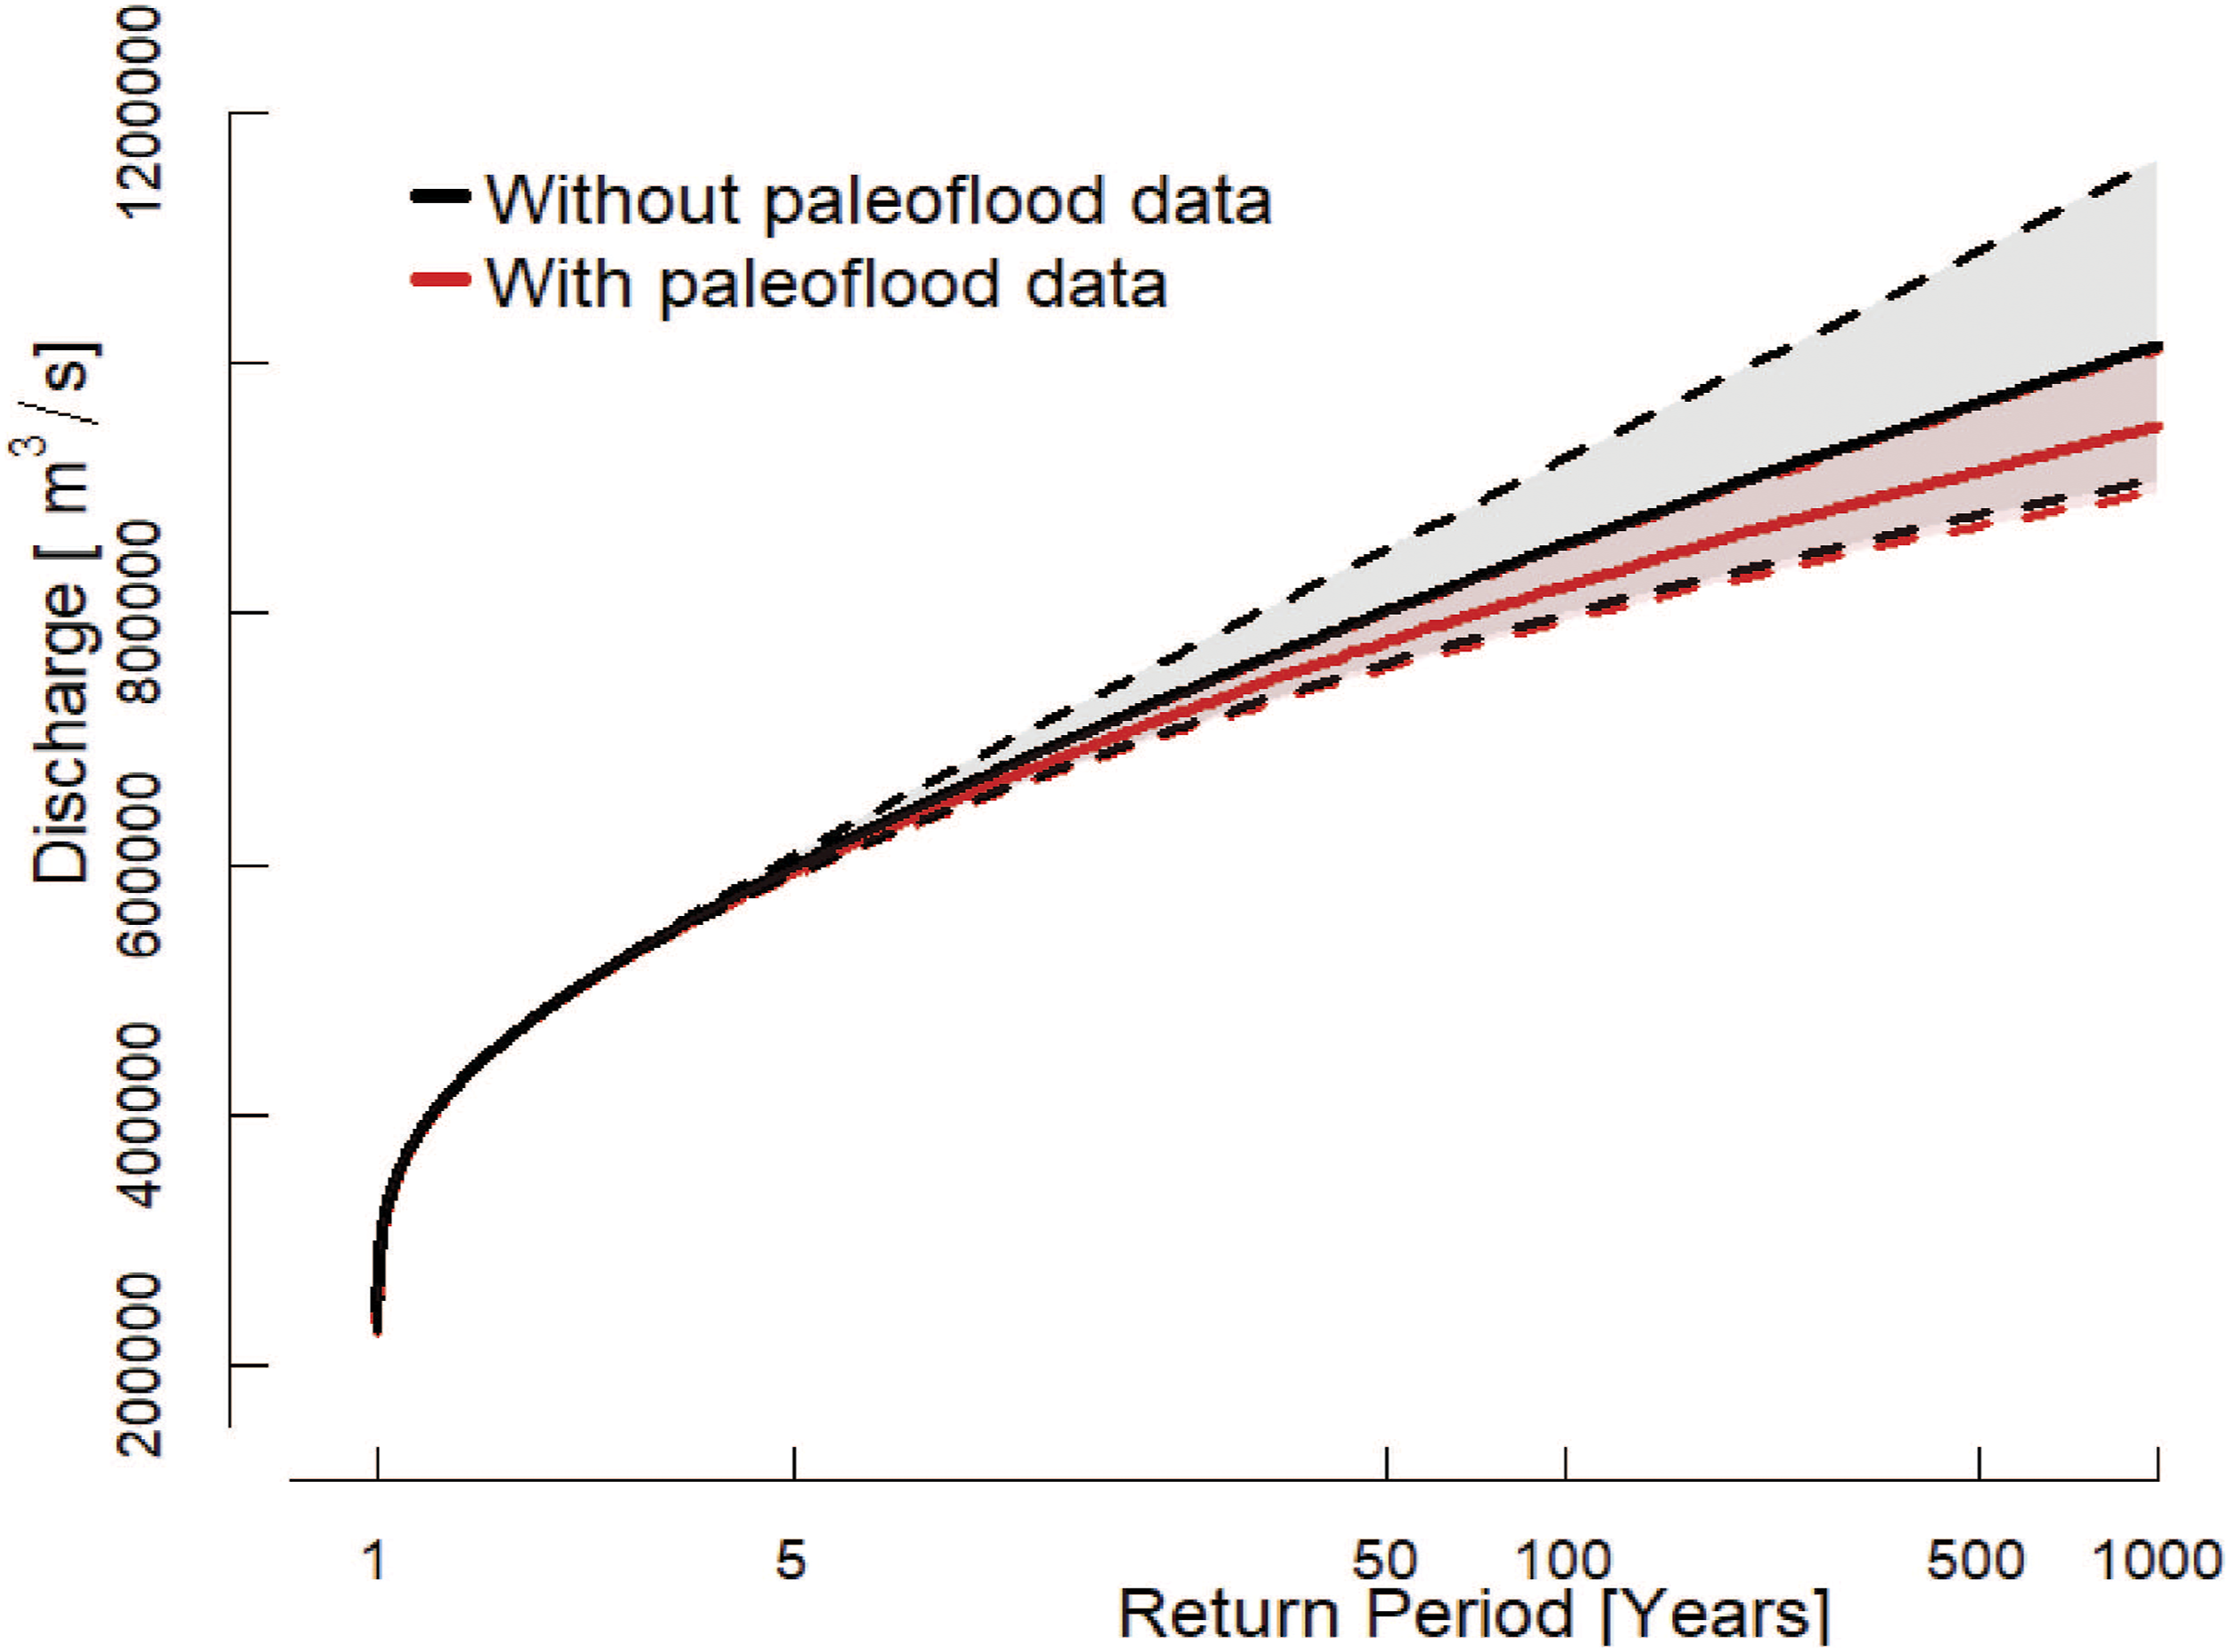
At both sites, we initially identified potential slackwater deposits based on sediment characteristics in the profile such as sediment color and texture (Figure 3). Additional laboratory analyses, including grain size, mineralogy using XRD, and OSL, were used to test the initial field-based hypotheses describing the origin of potential slackwater deposits (Figures 4–6). Using PCA analysis of mineralogy, we show that modern river sediment and flood slackwater deposits carry more non-expanding clay minerals (illite) than the locally derived in situ sediment. The in situ sediments are primarily composed of calcite and quartz from nearby limestone and sandstone. Stratigraphic profiles of BUZZ1 and BUZZ2 sites document the presence of distinct strata composed of light brown, well-sorted medium sands that are hypothesized to represent potential slackwater deposits (Figure 3). Pit depths, grain-size, and OSL dates from Buzzard’s Roost sites. Two sites are shown, BUZZ1 and BUZZ2 along with their distinct sedimentary sections which are labeled. Grain-size including D10, D50, and D90 are shown along stratigraphy. OSL dates including 1σ uncertainty are labeled at the depth at which they were taken. Grain-size distribution end members from BUZZ1 and BUZZ2 grouped by samples hypothesized to be slackwater deposits (green), samples from the Ohio River bed (red), and samples of local in situ material (blue). PCA biplot of BUZZ1 and BUZZ2 XRD data. All samples from sections are labeled by dots, and colors distinguish whether the sample is locally derived (in situ) or derived from the river (slackwater or river). Circles show the separation of river and slackwater samples plotting in the same quadrant from similar mineralogy signatures. Discharge associated with different flood return periods for a flood frequency analysis with a GEV distribution using only instrumental data (black line, shading is 95% confidence interval) and using one paleoflood event to supplement the instrumental record (red line, shading is 95% confidence interval).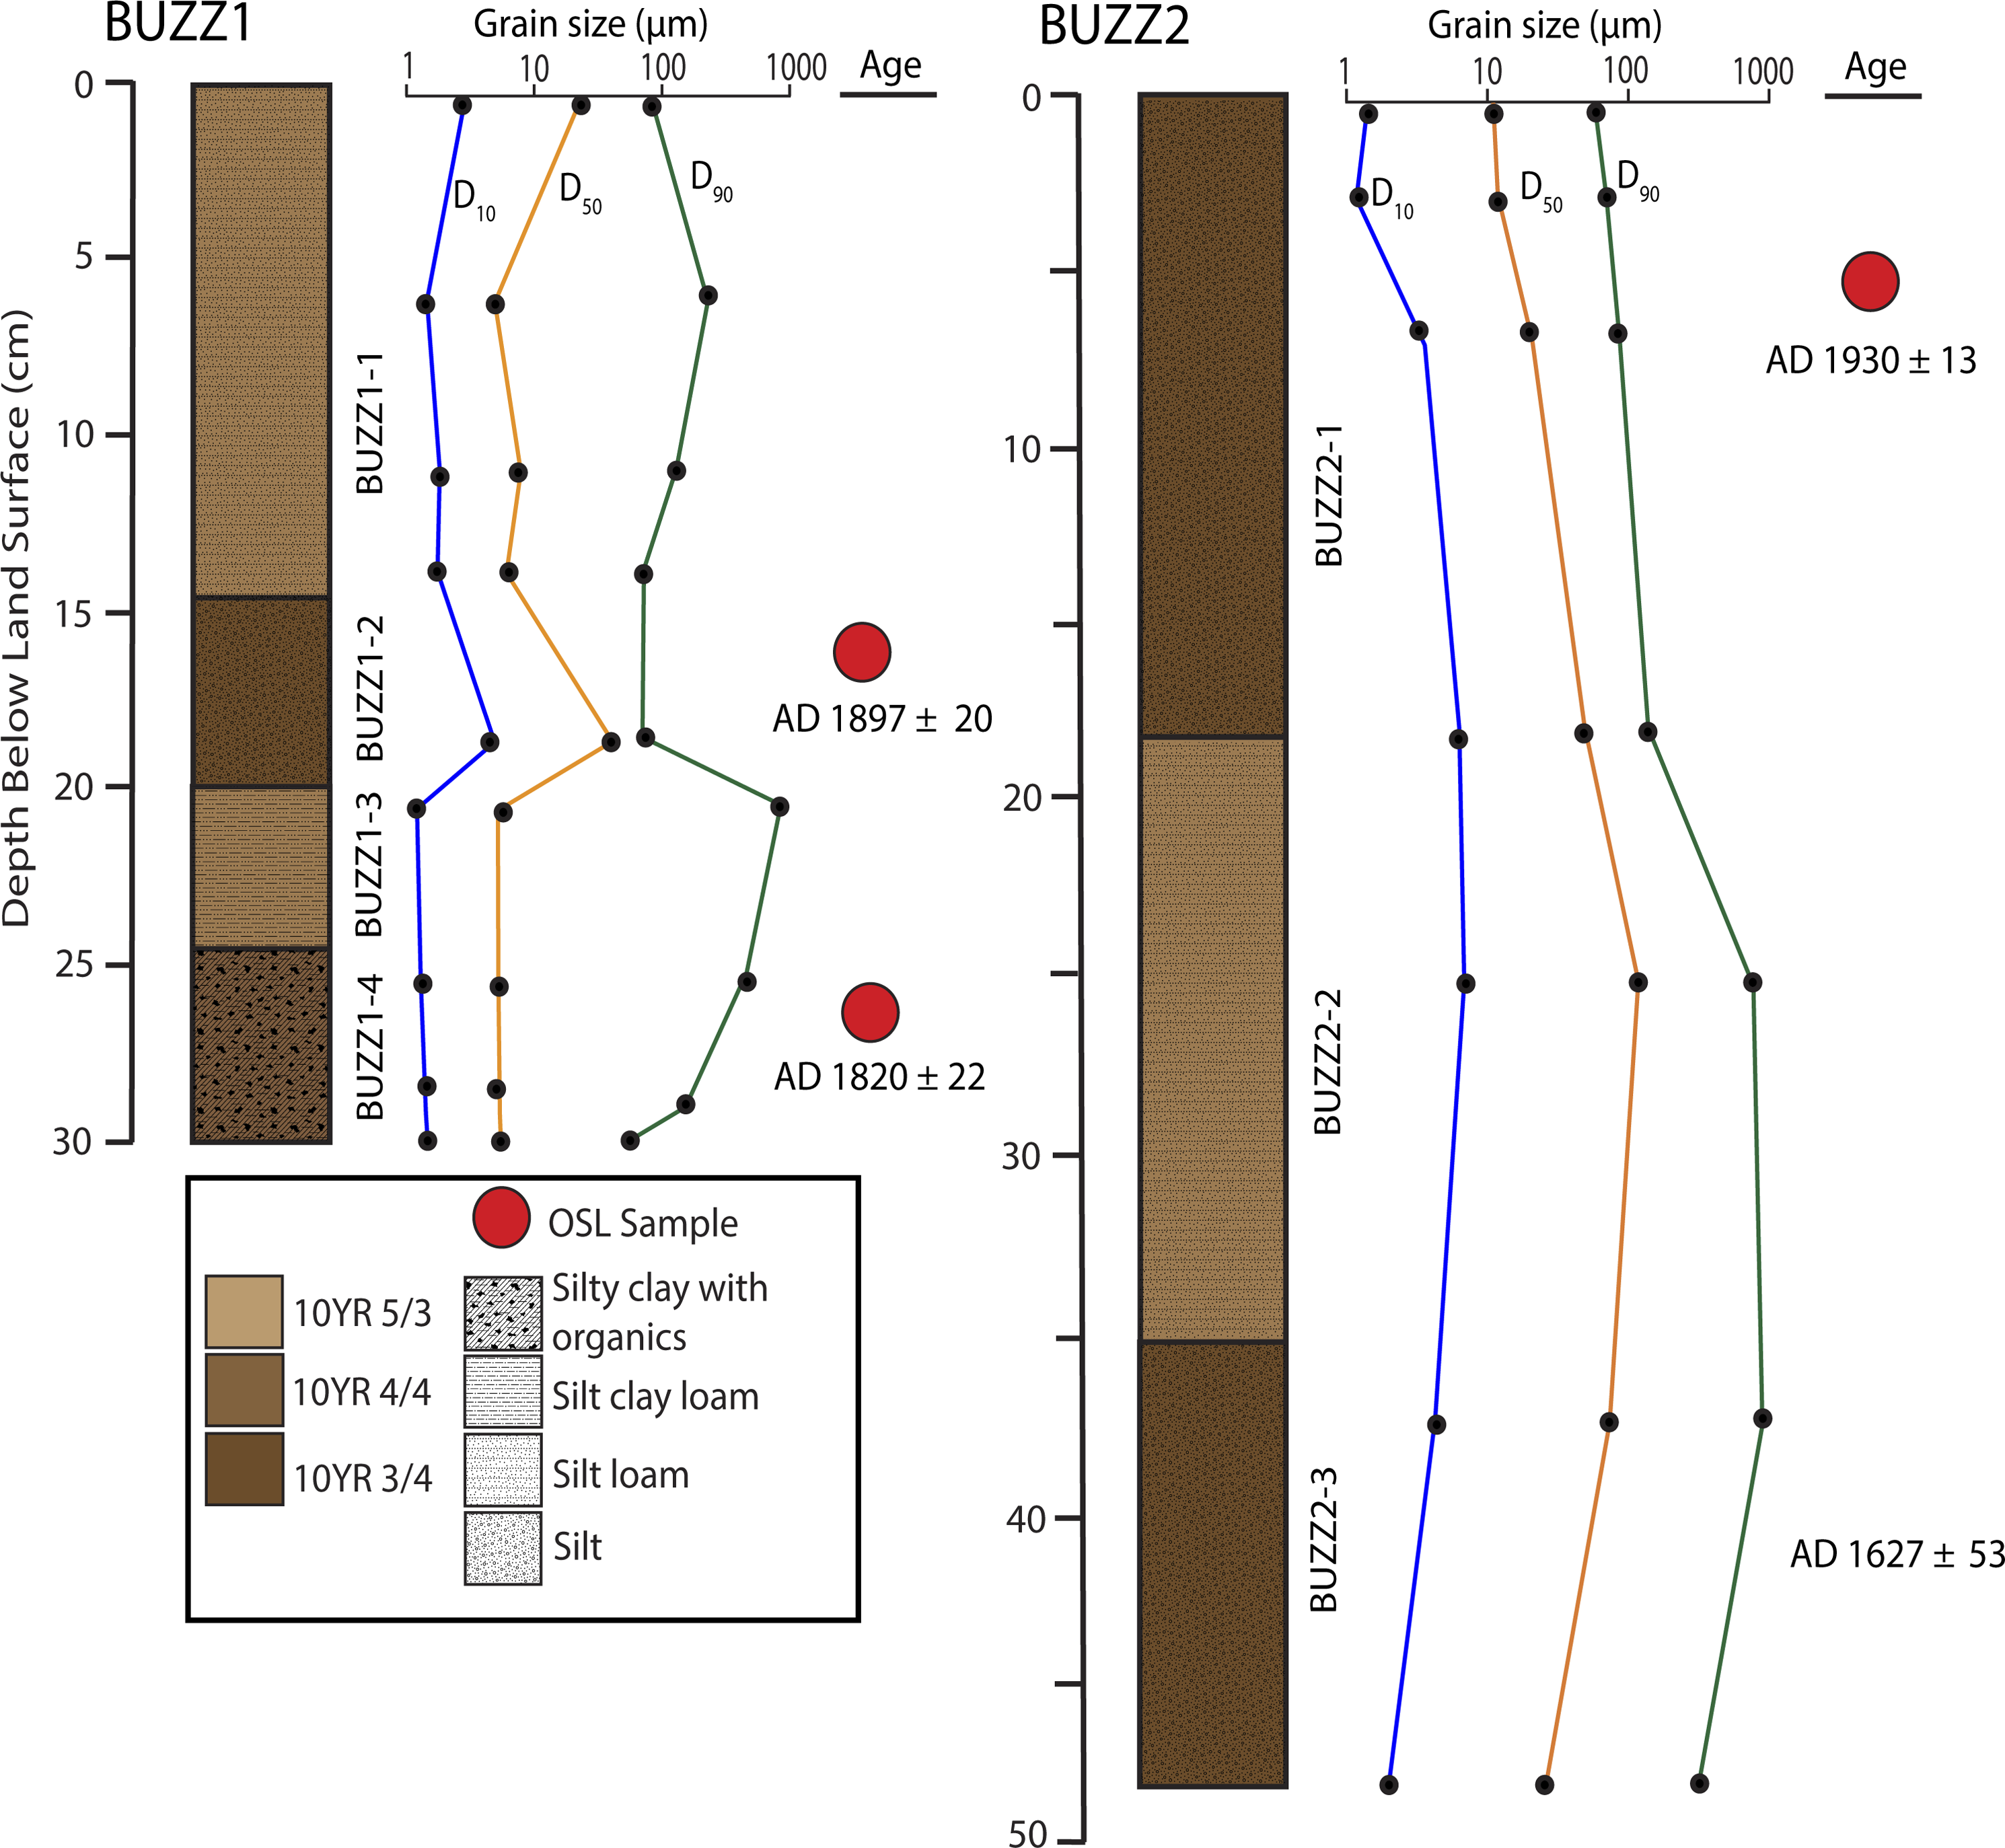
OSL Data
The sand-sized quartz data show wide D e distributions and overdispersions (OD) >60% (Table 2; Supplementary Figure 1), indicating that the OSL clock was not sufficiently reset in all the quartz grains. Therefore, a minimum age model (MAM, Galbraith et al., 1999) was used with a σ b value of 10% to obtain the sample burial dose D e for age calculation (cf. Chamberlain et al., 2018). BUZZ1 OSL1 and BUZZ2 OSL1 have OD values >100%, indicating very poor clock resetting (cf. Arnold et al., 2009). As a result, only 9/53 (17%) of accepted Des for BUZZ1 OSL1 and 12/73 (16%) for BUZZ2 OSL1 agreed with their respective MAM Des (Supp Figure 1), which is typical for young poorly reset sediments. The MAM De in these cases is more likely an estimate of the upper limit than the mean of the burial dose of the sample (Arnold et al., 2009; Shen and Mauz, 2012). In contrast, BUZZ1 OSL2 and BUZZ2 OSL2 have much higher proportions of accepted Des agreeing with their respective MAM Des that most likely represent an estimate of the mean burial dose.
The ages obtained with the sand-sized quartz are much younger than those of the silt-sized quartz (Table 2), indicating that the latter is affected by insufficient OSL resetting and thus not further discussed.
BUZZ1 Site
BUZZ1 is a 31 cm pit located under a ledge composed of interbedded limestone and sandstone and is situated 2 m higher than BUZZ2. BUZZ1 is divided into four sections, BUZZ1-1 through BUZZ1-4. The top section of BUZZ1 (BUZZ1-1; 0–14 cm) consists of loose light brown (10YR 5/3) silt loam with a high concentration of organic material, consistent with material deposited as a result of slope wash and local erosion. Below this section, BUZZ1-2 (14–19 cm) is also comprised of silt loam with a reddish-brown color (10YR 3/4), flecks of mica, a low content of organic material, and is hypothesized to represent a slackwater deposit. The lowermost sections, BUZZ1-3 (19–26 cm) and BUZZ1-4 (26–31 cm), are composed of organic-rich poorly sorted silt clay loam and silty clay with organics, likely representing deposition from slopewash and erosion of local rocks. Their colors are 10YR 5/3 and 10YR 4/4 respectively. Two OSL dates, collected in BUZZ1-2 (16.5 cm) and in BUZZ1-4 (25.5 cm) returned ages and 1σ errors of AD 1897 ± 20 and AD 1820 ± 22, respectively. The BUZZ1-2 slackwater deposit represents a very large historic flood > 31,400 m3/s its OSL age is likely an estimate of the upper age limit of the event as noted above. Thus, the most likely corresponding flood is the 1937 flood of record. No other flood deposits were recorded at this site, implying that there have been no other floods large enough to inundate this site since the early 19th century.
BUZZ2 Site
At our second site, BUZZ2, the 47 cm profile is divided into three sections named BUZZ2-1 through BUZZ2-3 (Figure 3). The upper section of BUZZ2-1 (0-18 cm), we identified a potential slackwater deposit composed of reddish (10YR 3/4) silt with low organic content. Below this section, BUZZ2-2 (18–35 cm) consists of brown (10YR 5/3) silt loam and likely represents in situ weathering of overlying rocks in the cave. The lowermost section, BUZZ2-3 (35-47cm) consists of well-sorted silt loam with low organic content and a reddish color (10YR 3/4), likely representing another slackwater deposit. Two OSL dates, collected in BUZZ2-1 (5 cm) and in BUZZ2-3 (40 cm), returned ages and 1σ errors of AD 1930 ± 13 and AD 1627 ± 53, respectively. The upper slackwater deposit (BUZZ2-1) represents at least one large historic flood > 23,900 m3/s and its OSL age is probably an estimate of the upper age limit of the event. Thus, the corresponding flood is likely the 1937 flood of record and/or the large flood in 1945 (23,900 m3/s). The lower slackwater deposit (BUZZ2-3) represents a prehistoric flood of a comparable magnitude.
Grain-size and mineralogy
Grain-size distributions of samples collected from BUZZ1, BUZZ2, and the bed of the lower Ohio River differentiate in situ sediments from slackwater deposits sourced from the Ohio River basin (Figure 3, Figure 4). At both BUZZ1 and BUZZ2, two distinct grain-size distributions are present: (1) samples with higher proportions of clay and silts and a median grain-size ∼12 μm associated with sections BUZZ1-1, BUZZ1-3, BUZZ1-4, BUZZ2-2 interpreted as being the result of in situ weathering, and (2) samples with a higher proportions of coarse silt and sand and/or a median grain-size ∼25 μm associated with sections BUZZ1-2, BUZZ2-1, and BUZZ2-3 hypothesized as being slackwater deposits (Figure 3. The grain-size distributions associated with slackwater deposits are similar to samples collected from the bed of the lower Ohio River at Buzzard’s Roost, which have a median grain size of 37 μm (Figure 4). These grain-size distributions support the hypothesis that inferred slackwater deposits reflect deposition of Ohio River sediments during a flood and show that the slackwater deposits are texturally distinct from material produced by in situ weathering of local bedrock.
The mineralogy of sediment samples from our two stratigraphic profiles further supports our hypothesis that distinct layers in BUZZ1 and BUZZ2 are slackwater deposits that formed through extreme flooding of the Ohio River (Figure 5). A principal components analysis (PCA) of XRD samples from (a) BUZZ1 (n=9) and (b) BUZZ2 (n=7) document the distinctive mineralogy of slackwater samples. At both sites, the first principal component (PC1) accounts for ∼40% of the variance and corresponds to the amount of calcite present in samples sourced from the limestone of the West Baden Group in this area. The second principal component (PC2) accounts for ∼20% of the variance and reflects the relative contributions of quartz and clay minerals (e.g., illite, muscovite, and biotite), consistent with sandstone from the West Baden Group and glacial deposits from further upstream. The mineralogy of samples from Ohio River sediment and slackwater deposits are similar and contain higher amounts of quartz and illite. The background sediments, in contrast, span a wide range of mineralogies but generally contain higher amounts of kaolinite and calcite from surrounding rocks. The mineralogical consistency between the river and inferred slackwater deposits, and their contrast to other samples in our sites, provide further support for our hypothesis that the slackwater samples represent deposition of sediments transported by the Ohio River during extreme floods.
Flood chronology and frequency analysis
Information from Buzzard Roost sites along the Ohio River, including geochronology, hydraulic modeling, geochemical analysis, and stratigraphy were synthesized into an overall chronology of large floods. Between the two primary sites examined; we infer one distinct prehistoric flood recorded by the paleoflood stratigraphy over the last ∼400 years in addition to the historical 1937 flood of record. Overall, the paleoflood chronology was inferred from relating floods at each site based on elevation, deposit characteristics, and associated discharge estimates. The discharge values assigned for the paleoflood are based on the elevation of that paleoflood’s highest inferred occurrence and the local stage-discharge relation calculated from hydraulic modeling. The timing of the newly identified paleoflood, as well as historical flood, is based on geochronology and stratigraphic correlations. The total stratigraphic record extends 400 years as indicated by age from OSL dates at the Buzzard’s Roost sites. Between the two sites, two large floods of 23,500 m3/s or greater have been recorded over the last 400 years. One large flood dating to the early 20th century likely represents the flood of record in AD 1937 and is found at both sites (Figure 2(a)). Another paleoflood deposit we identify is not in the historical record but may represent the AD 1650 flood recorded along the Tennessee River (Davis et al., 2019; Harden et al., 2020). The discharge for this flood was also above 23,500 m3/s but less than 31,400 m3/s as it was only found at the lower elevation site, BUZZ2.
A flood frequency analysis for the lower Ohio River at Louisville (USGS gage 03294500) that includes the paleoflood data described above reduces the estimates and associated uncertainties of upper flood quantiles when compared to a flood frequency analysis using gage and historical data alone (Figure 6). Inclusion of the AD 1650 paleoflood reduces the estimate of the 100-year flood (Q100, 1% annual exceedance probability) from 24,200 m3/s (95% confidence intervals, CI: 22,700 m3/s to 26,200 m3/s) to 23,300 m3/s (95% CI: 22,500 m3/s to 24,200 m3/s), amounting to a 53% decrease in uncertainty. The reduction in uncertainty is greater for larger flood quantiles, with the inclusion of the paleoflood reducing the estimate of the 500-year flood (Q500, 0.2% annual exceedance probability) from 27,500 m3/s (95% CI: 24,600 m3/s to 27,400 m3/s) to 25,900 m3/s, (95% CI: 24,600 m3/s to 27,300 m3/s), or a 55% decrease in uncertainty.
Discussion and Conclusions
Our work provides the first evidence of slackwater deposits on the Ohio River, building on prior work by Harden and O’ Connor (2017) and Harden et al. (2020) demonstrating the potential for slackwater deposit preservation in temperate alluvial settings. In total, we identify three slackwater deposits at two sites based on the unique texture (Figure 4) and mineralogy (Figure 5) of sediments mobilized and deposited by extreme floods. One of the slackwater deposits, found at the highest elevation site (BUZZ1), dates to AD 1897 ± 20 (1σ) and likely represents fluvial sediment deposited by the 1937 flood of record on the lower Ohio River. We identify one other large flood at the lower elevation BUZZ2 site in addition to the 1937 flood (AD 1930 ± 13 years), which dates to AD 1627 ± 53 (Figure 3). The timing of the older flood deposit (∼AD 1650) corresponds to an extreme flood identified by Harden et al. (2020) and Davis et al. (2019) on the Tennessee River, a tributary of the Ohio River. Along the Tennessee River, the discharge estimated for the AD 1650 flood is 31,600 m3/s (Harden et al., 2020). We examined multiple locations at higher elevations than the BUZZ1 site but did not find evidence for slackwater deposits at those sites.
Our work demonstrates that the AD 1937 flood was the largest flood of at least the last 400 years. Prior work examining late Holocene hydrologic variability in the Ohio River basin, and the broader Mississippi River basin, shows that river flow and flood hazard has increased over the last millennium as a result of ocean-atmosphere variability and land use change (Bird et al., 2019; Lombardi et al., 2020; Muñoz et al., 2018; Wiman et al., 2021). A record of sedimentation rates in a floodplain lake on the lower Ohio River, for example, implies that streamflow decreased between AD 350 to AD 1150, and then increased towards the present (Bird et al., 2019). On the lower Mississippi River, changes in river morphology similarly imply that low recurrence interval floods decreased in magnitude during the Medieval era (AD 1000 to 1200) and then increased towards the present (Wiman et al., 2021). The trend towards increasing flood frequency and magnitude on the lower Mississippi River is also supported by an event-based paleoflood reconstruction spanning the last 500 years (Muñoz et al., 2018). The slackwater deposits described in this study extend event-based estimates of Ohio River floods back to the early 17th century and imply that the AD 1937 flood was the largest by magnitude within that period. Given the regional aridity and reduced streamflow of the Medieval era observed in other paleohydrological records (Bird et al., 2019; Wiman et al., 2021), it is possible that the AD 1937 flood represents the largest flood of the last millennium.
Additional surveys using the techniques described in this study could be used to identify older slackwater deposits, and other slackwater sites on the Ohio River to build up a network of paleoflood deposits and further extend the paleoflood record for the lower Ohio River. Our use of sediment texture and geochemistry to identify slackwater deposits represents an advance for paleoflood hydrology, and opens the door to developing robust slackwater-based paleoflood records in other temperate alluvial settings.
Our study provides an example of how paleofloods can be used to reduce uncertainties in flood hazard analysis, particularly for large flood quantiles that are often poorly represented in instrumental gage records (Harden et al., 2011; Hosman et al., 2003; O’Connor et al., 2014). On the Ohio River, systematic stream gage measurements began in 1928 at Louisville, with historic records reported and estimated back to AD 1832. By including the AD 1650 paleoflood in a flood frequency analysis, the 95% confidence intervals in the recurrence periods of extreme floods on the lower Ohio River are, in general, reduced by ∼50%, constraining the recurrence discharge of a, for example, 1000-year flood (Q1000) from 23,500–36,200 m3/s using only to the gaged and historical records to 25,400–28,600 m3/s.
The synoptic climatology of the AD 1937 flood is similar to other large floods on the lower Ohio and Mississippi Rivers (Lott and Myers, 1956; Smith and Baeck, 2015), implying that the event does not represent a secondary population of floods. Greenhouse forcing is projected to increase precipitation extremes over the Ohio River basin and other basins in temperate eastern North America (Dunne et al., 2022; Schneider et al., 2017; Vose et al., 2014), while land use and river management may exacerbate or ameliorate flood hazard (Bird et al., 2019; Gupta et al., 2015; Muñoz et al., 2018; Wheater and Evans, 2009). Therefore, flood risk assessments must consider the potential for non-stationarity over the coming decades, and include statistical techniques to account for this. Yet, robust paleoflood estimates will remain critical in placing historical floods in a broader temporal context and examining the sensitivity of river discharge to changes in climate.
In short, our study documents multiple slackwater deposits from large floods of the Ohio River and demonstrates that robust slackwater-based paleoflood records can be developed for temperate alluvial river systems where pedogenesis can obscure stratigraphic contacts. We use grain-size analysis and XRD paired with statistical analyses to identify and differentiate slackwater deposits from in situ material. Together with other regional paleohydrologic records, our work implies that the AD 1937 flood likely represents the largest flood event of the last ∼1000 years or more. Ultimately, our findings constrain flood hazard assessments for one of the largest rivers in North America, and our study provides techniques for the identification of slackwater deposits that can be applied on other temperate alluvial rivers. Paleoflood records can be added to flood frequency analyses to narrow uncertainty and help enhance our understanding of future flood hazard and risk.
Supplemental Material
Supplemental Material - Large floods on the lower Ohio River inferred from slackwater deposits
Supplemental Material for Large floods on the lower Ohio River inferred from slackwater deposits by Charlotte Wiman, Tessa Harden, Zhixiong Shen, B. Brandon Curry, Joeri B Reinders, R Edward Beighley and Samuel E Muñoz in Progress in Physical Geography: Earth and Environment
Footnotes
Acknowledgements
We are grateful to members of the Earth Surface Systems Lab for their help in field work and lab work on this project, particularly Brynnydd Hamilton and Michelle O’Donnell. We thank Dr. Justin Ries at Northeastern University for the use of the XRD. We also thank two anonymous reviewers and Heather Bervid (USGS) for their helpful feedback on earlier versions of this manuscript. This work was also partially funded by a Geological Society of America John T. and Carol G. McGill Research Award. The data are available on the National Climatic Data Center (![]() ).
).
Declaration of conflicting interests
The author(s) declared no potential conflicts of interest with respect to the research, authorship, and/or publication of this article.
Funding
The author(s) disclosed receipt of the following financial support for the research, authorship, and/or publication of this article: This work was supported by the National Science Foundation (EAR-1804107, EAR-1804799, EAR-1833200).
Supplemental Material
Supplemental material for this article is available online.
References
Supplementary Material
Please find the following supplemental material available below.
For Open Access articles published under a Creative Commons License, all supplemental material carries the same license as the article it is associated with.
For non-Open Access articles published, all supplemental material carries a non-exclusive license, and permission requests for re-use of supplemental material or any part of supplemental material shall be sent directly to the copyright owner as specified in the copyright notice associated with the article.