
Abstract
Modern urban climatology is a part of boundary-layer climatology with a focus on the urban effects on the atmosphere. The best known of these effects is the urban heat island (UHI), which has been a subject of study for more than 200 years and may be categorised into air, surface and substrate types. Progress on this topic has occurred in various phases associated with theoretical developments, improvements in technology (instruments and computing) and study design, to isolate the causative drivers. The history of the field can be categorised into response-based (descriptive) and process-based (analytic) periods associated with hypothesis generation and testing, respectively. Myrup’s paper on simulating the UHI, published in 1969, is at the forefront of this shift in approach and is the first application of numerical modelling to the topic. Its computational methods place the UHI within the context of the surface energy budget and the exchanges of energy, urban characteristics, and the substrate as well as overlying air. The paper is a classic that had considerable impact on the approach that geographical climatology took to examining the UHI; however, it is not without its limitations Careful reading of Myrup's work provides insights into how the field has evolved in the last 50 years. In particular the recurring issues associated with conceputalising the urban thermal effect and challenge of comparing models results with field observations. Remarkably, key urban climate questions on how to cool cities, how to plan cities for future climate, and the factors that impact UHI are still being studied, albeit with more sophisticated models. A numerical model of the urban heat island is part of a rich literature on the UHI that illustrates the development of the urban climate science that deserves to be read and cited.
I Introduction
Urban climatology (UC) has historically been associated with geographical research mainly because climates of cities represent clear evidence of anthropogenic impact on the natural environment (Landsberg, 1956). Of these impacts, the urban heat island (UHI) has been the most researched. In fact, the theoretical and technical development of modern urban climatology can be tied closely to the history of its study. In this respect, UHI research can be crudely categorised into pre- and post-1970 periods. In the earlier period research relied on observations of air temperature near the ground, that were mapped and matched to urban land-cover to generate explanatory hypotheses. By comparison, in the later period, research focussed on measuring and simulating energy exchanges in controlled settings to test hypotheses (Mills, 2014). In this paper, we revisit a classic paper by Leonard O. Myrup (1969) that marks a clear divide between these two periods. This work describes the first application of a numerical model to simulate the UHI; in doing so, Myrup applies boundary-layer theory to an abstracted description of the city. Despite some flaws it is an exemplar of scientific reasoning and set the bar for much of the UHI work that followed. In the following, we provide a historical context for Myrup’s paper, describe the work it contains, assess its impact and evaluate its relevance to current research. We have used italics when directly quoting Myrup.
II A brief history of UHI studies
The urban heat island (UHI) describes the city’s effect on the temperatures of the surface, substrate, and atmosphere (Oke, et al., 2017). From its beginnings, the UHI was recognised as the outcome of altered surface-air exchanges due to changes to the natural landscape (urban land-cover) and the addition of heat energy by human activities (urban land-uses). In essence, the causes of the UHI were attributed chiefly to four characteristics of cities: land-cover, or the impervious surface fraction; construction fabric and its thermal and radiative properties; the three-dimensional urban form; and the addition of heat energy by humans and their activities (anthropogenic heat source). The impacts of these characteristics on the different UHI types depend on the background regional weather conditions and topography where the city is located.
The atmospheric UHI is categorised into the canopy-level (CUHI), and boundary-layer (BUHI) heat islands identifying the urban effect on air temperature below and above roof height, respectively. The best studied of the UHI types are those of the surface (SUHI) and CUHI, which have overlapping but distinct histories. The canopy-level UHI has been a subject of scientific study for over 200 years and has been observed using in situ thermometers exposed to the near-surface atmosphere, which places the instrument below roof-level (that is, within the urban canopy). These observations have been made at fixed and mobile stations and the magnitude of the CUHI is assessed by comparing temperatures over the urbanised landscape with the non-urban (natural) surroundings. By comparison, there have been few observational studies of the BUHI partly due to the difficulty of situating instruments in this layer. By comparison, the SUHI has been a subject of observational study since thermal satellite data became available in the late 1970’s (e.g., Matson et al., 1978). Research on the SUHI is closely linked to the evolution of satellite-based Earth Observation Systems (e.g., Landsat) in the mid-1970s (Voogt and Oke, 2003), which has increased considerably since 2000 as satellite data and analytical tools have become widely available (Zhou, et al., 2018).
Until Myrup’s paper, the common way of conducting a UHI study was to measure the air temperature near the ground (within the UCL) and compare urban with rural (natural) values. This was done using fixed stations following a methodology established by Howard (1833) or using mobile stations to record the detailed spatial variation across the urbanised landscape (Sundborg, 1950). By the 1960s the basic description of the CUHI was complete. Under ideal weather conditions (clear sky and low winds) the typical pattern consists of increasing air temperatures from the urban-rural edge to the city centre (forming the shape of an island); this pattern emerges as air movement ‘smooths’ the effects of diverse underlying surfaces. Its magnitude is greatest at night, which indicates that it is an outcome of differences in rural and urban cooling rates. By contrast, observations of the SUHI had to wait until the development and deployment of thermal infra-red sensors In most SUHI studies these data are obtained from satellites, which have a near vertical view of the urban landscape (roofs, streets, car parks, etc.). The SUHI, when mapped, displays a spatially heterogeneous pattern dominated by different surface types and is strongest under clear and calm conditions during daytime especially. It is a product of differential heating driven by solar energy.
For much of the history of CUHI (and one that was repeated with the SUHI), research consisted of observations, associations with land-cover/land-use classes and generating hypotheses on the causative factors (Stewart and Mills, 2021). A major step towards a modern science was the adoption of boundary-layer concepts as a framework for exploring the drivers of the UHI. Myrup’s paper is the first to apply this framework in a numerical modelling study of the UHI; this work established a research path that many would follow. The foundation of his paper is based on the surface energy budget (SEB), which expresses the conservation of energy at a surface

Applying boundary-layer (BL) theory (as described above) to cities is fraught with issues, mainly because of the heterogeneity of the urban surface, which impedes the formation of a simple boundary-layer. Grappling with this issue was a central objective of field studies since the 1980s that used eddy correlation instruments (not available beforehand) on tall towers to measure the SEB components over different urban landscape types (Grimmond, 2006). This work revealed a deep roughness sub-layer within which the UCL is immersed so that the BL relations described above apply well above roof-height (Oke et al., 2017). Urban climate research within the UCL required a different approach to capture micro-scale processes such as shadowing, multiple radiation exchanges between facets, and heat transfer from building interiors. The adoption of the city street (urban canyon) as a template for measuring (Nunez and Oke, 1977) and modelling (Terjung and Louie, 1973) these processes was central to understanding the development of the CUHI. The later development of the Local Climate Zone typology (Stewart and Oke, 2012) provided a local-scale context for land-cover controls on the CUHI magnitude.
At the time of Myrup’s paper, the distinction between the boundary-layer and canopy-layer environments had not been clarified (Oke 1976). However, it is important to note that the body of UHI observations available was based on measurements made within the UCL. The magnitude of this CUHI was shown to be largest at night under calm and clear weather conditions when the urban facets (walls and streets) and adjacent air cooled slowly.
III A numerical model of the UHI
Myrup asks whether the microclimate can be rationally planned and controlled through a set of questions, such as: How large can the urban heat island effect be expected to be? What are the dominant causes of the urban temperature excess? To answer these questions, he develops a one-dimensional surface energy budget (SEB) model, which is applied to a notional city located at 38.5° N, 121.7° W (corresponding to the location of Davis, California). It is implemented on an analogue computing machine (the Electronics Associates Inc., TR10). Myrup’s paper outlines the model and its assumptions, derives results, examines its sensitivity to model parameters and evaluates the model simulations against UHI observations.
3.1 The model
The terms of the SEB are simulated at a plane located at the roughness length (z0) using the assumption of horizontal homogeneity and the equivalence of the turbulent exchanges. The radiative terms are obtained using solar geometry, albedo and the net longwave radiation is treated as constant. Once the boundary conditions are provided - windspeed, air temperature and humidity at the top, and soil temperature at the base - there are just two unknowns: surface temperature (T0) and humidity (q0) at the height z0. Humidity is expressed as a function of the T0: if the air is saturated, then q0 is the saturated value; over an unsaturated canopy relative humidity (RH) is used. In these circumstances the value of T0 that ‘solves’ equation (1) is obtained by iteration. Importantly, the canopy air temperature (below z0) is treated as isothermal so that T0 at z0 is equal to the ground surface temperature.
The model is applied to a hypothetical city of 100 km2, with a mixture of dry surfaces and freely transpiring canopies; the RH expresses the fraction of the city occupied by the canopy. In the absence of data on the physical characteristics of cities, Myrup treats the city substrate as concrete with a constant temperature at 20 cm, and assigns the upper boundary where ambient meteorological conditions are fixed to 300 m. To account for energy added by human activities, Myrup adds 35 Wm-2 to the simulated Diagram illustrating the setup used by Myrup (1969). The city is described as a concrete slab and the presence of buildings is included as surface rougness length (z0). The structure of the model has upper (300 m) and lower (-0.2 m) boundary conditions and the wind profile of the atmosphere is described with a log profile (neutral). The layer between the ground (concrete) and the roughness length (0m to z0) is isothermal, such that obtaining the air temperature at z0 is also the surface temperature at the ground. The thermal memory in the model is provided by heat storage in the concrete slab.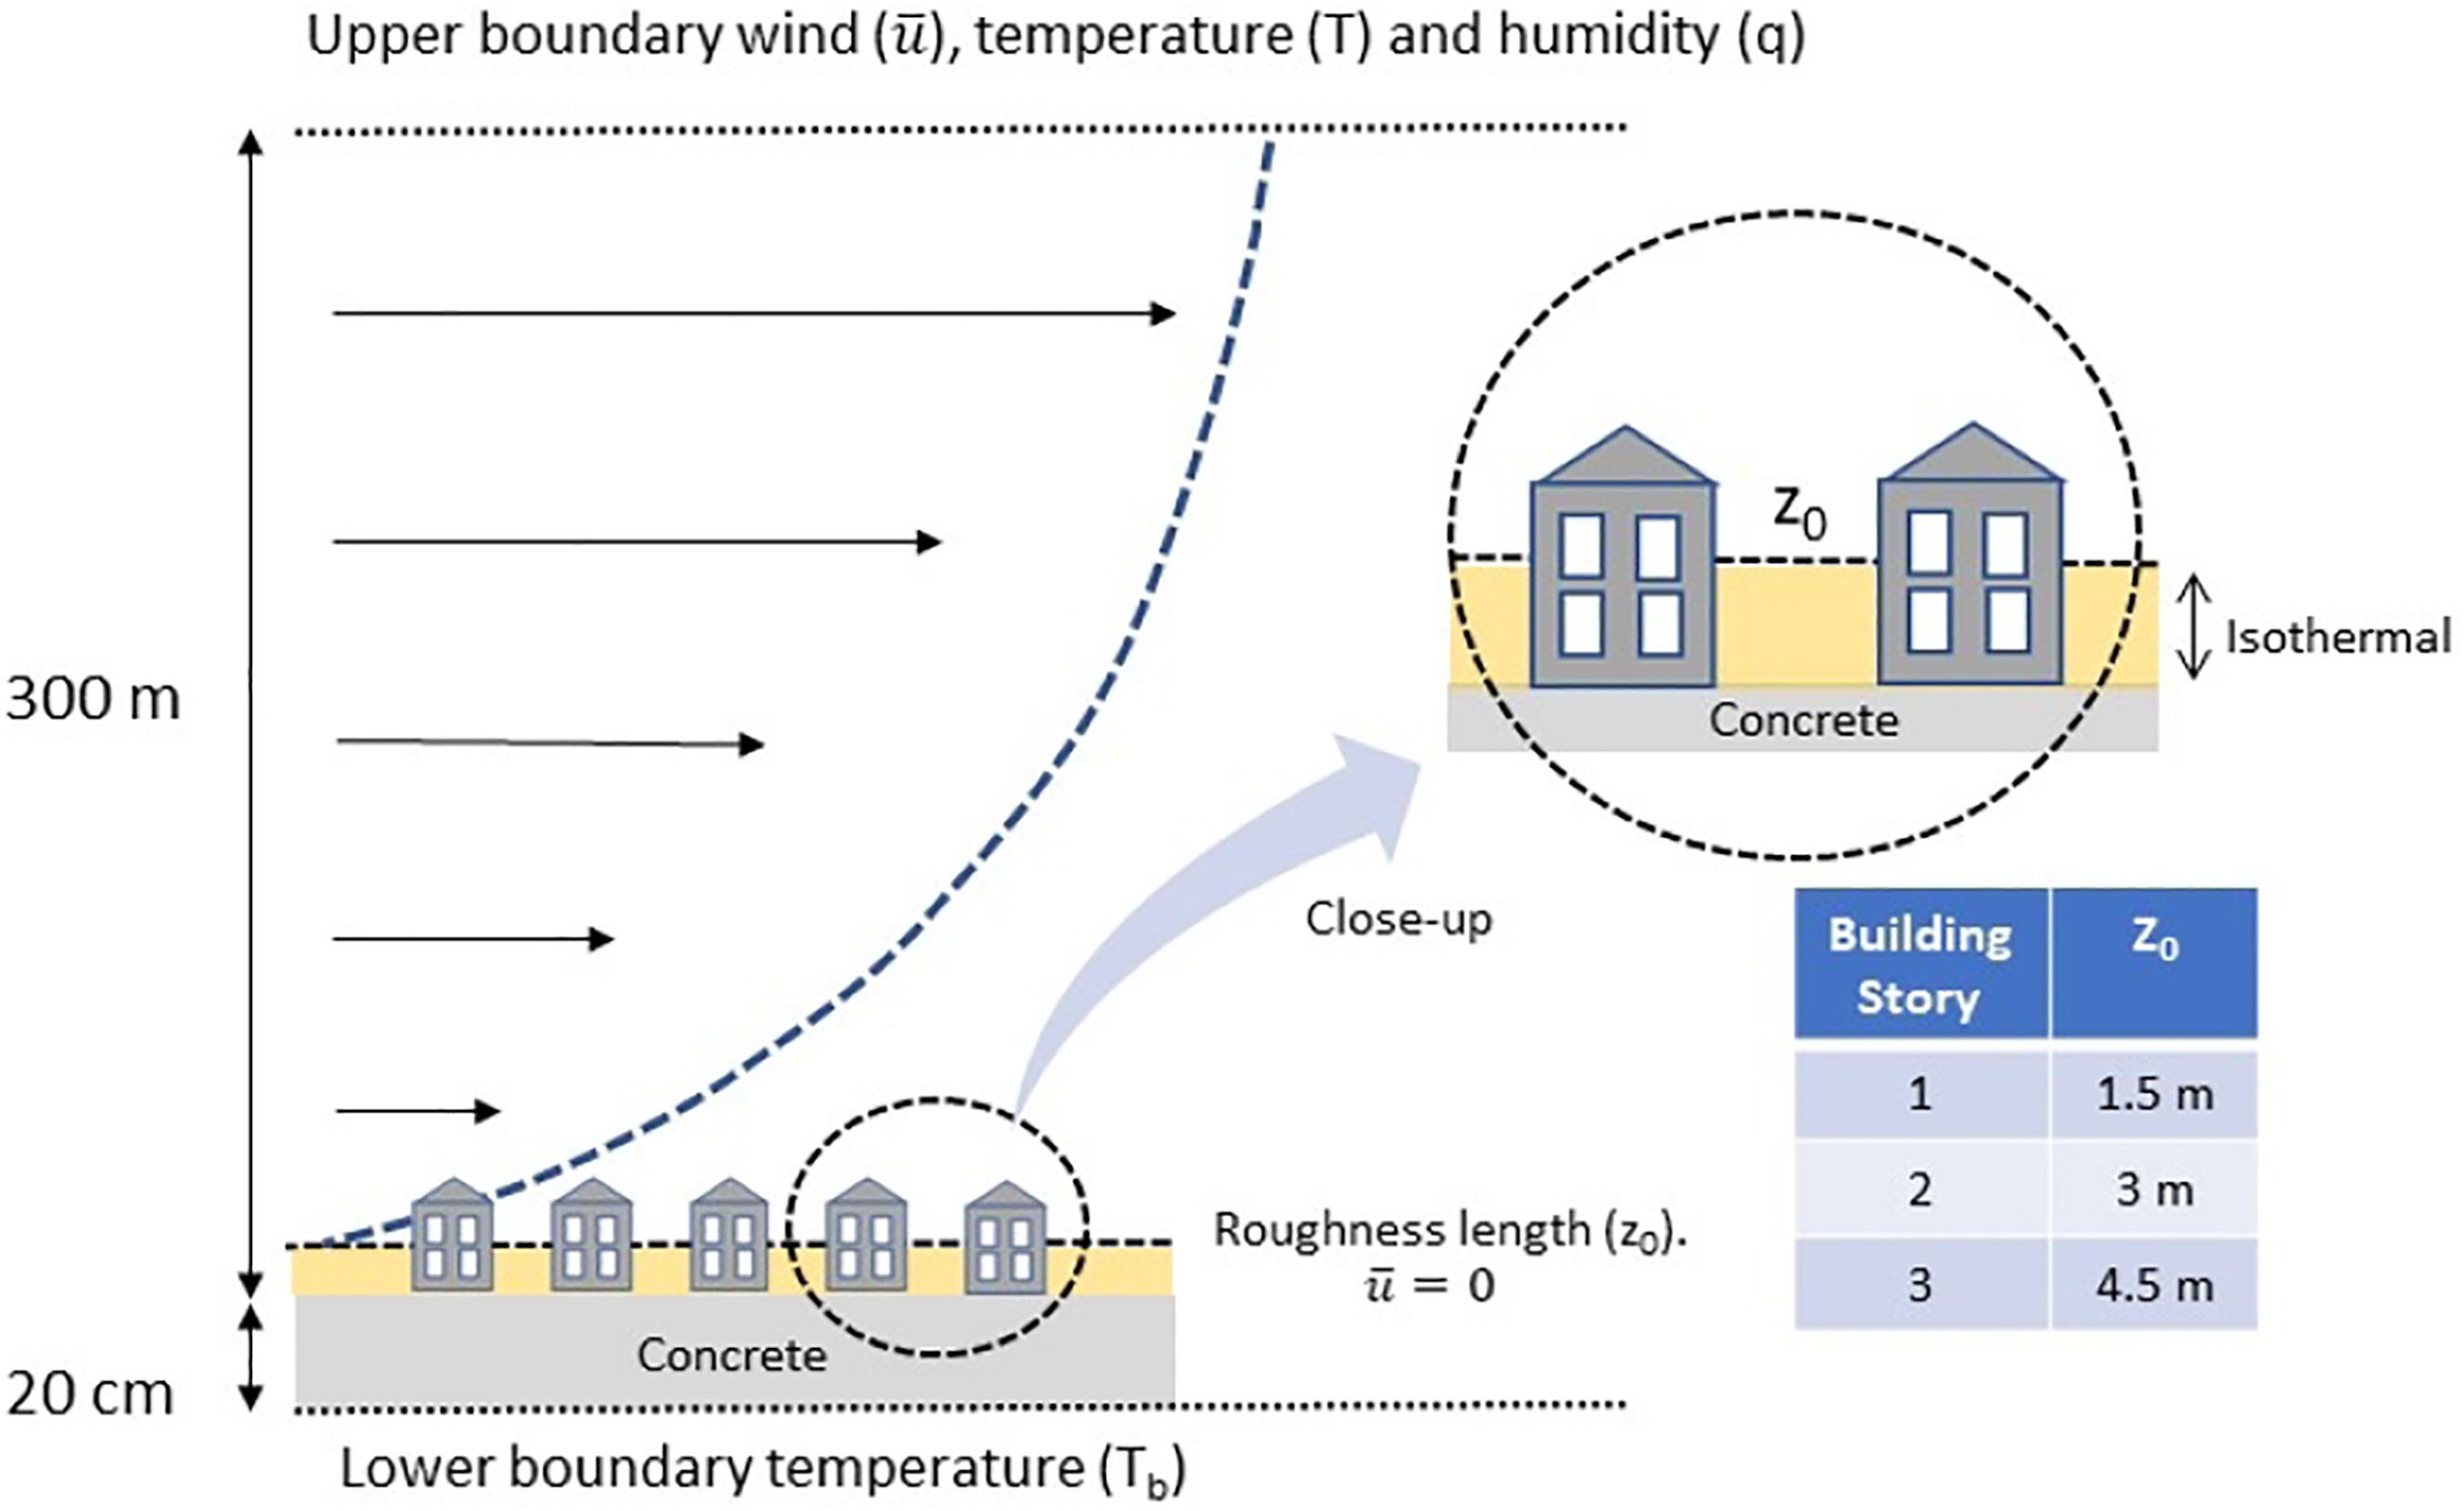
3.2 Results
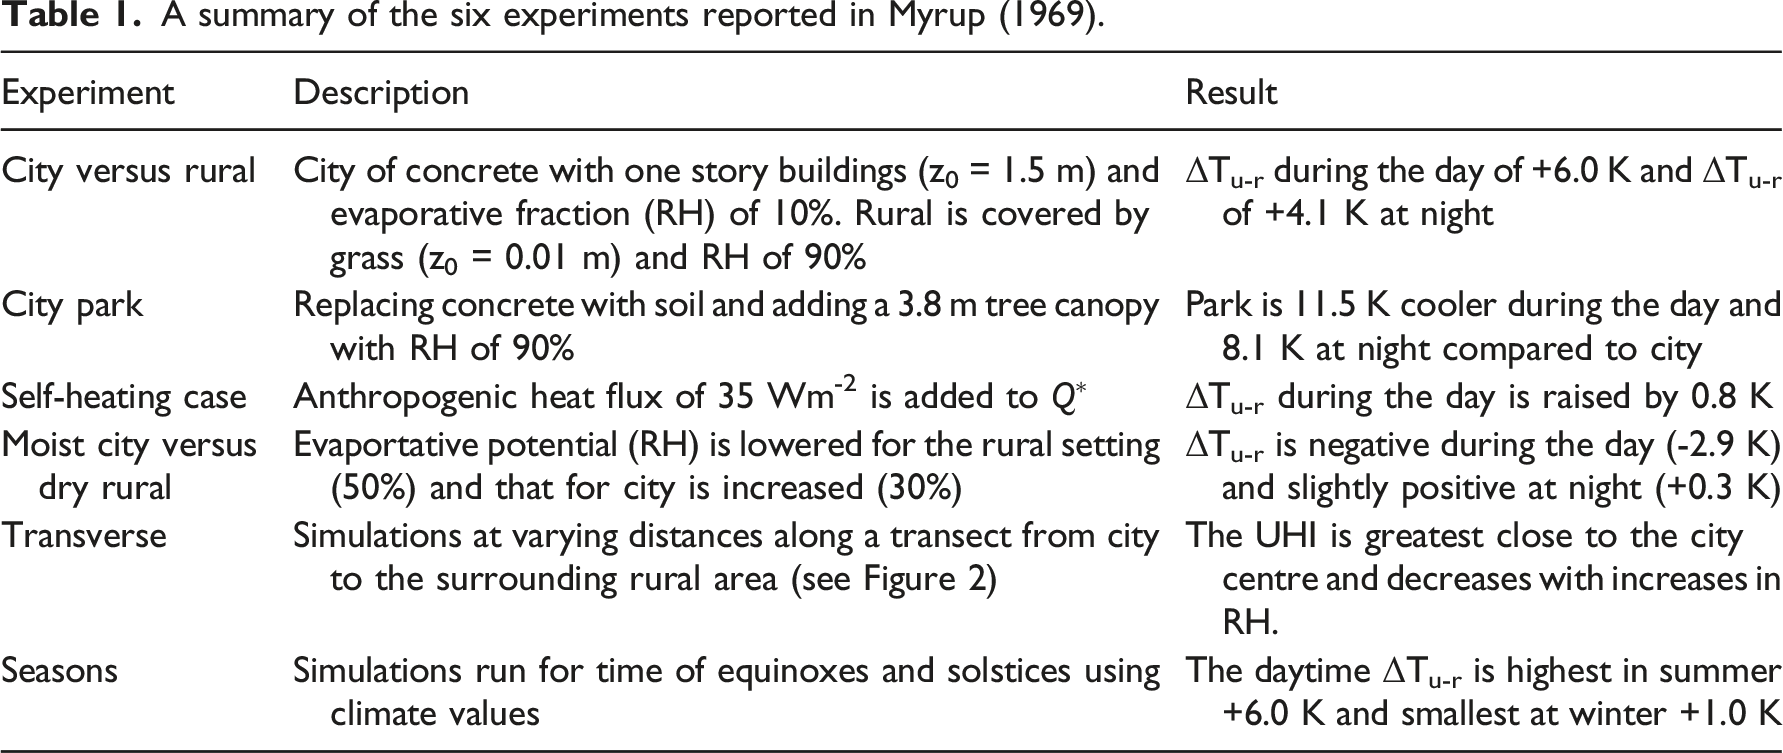
A summary of the six experiments reported in Myrup (1969).
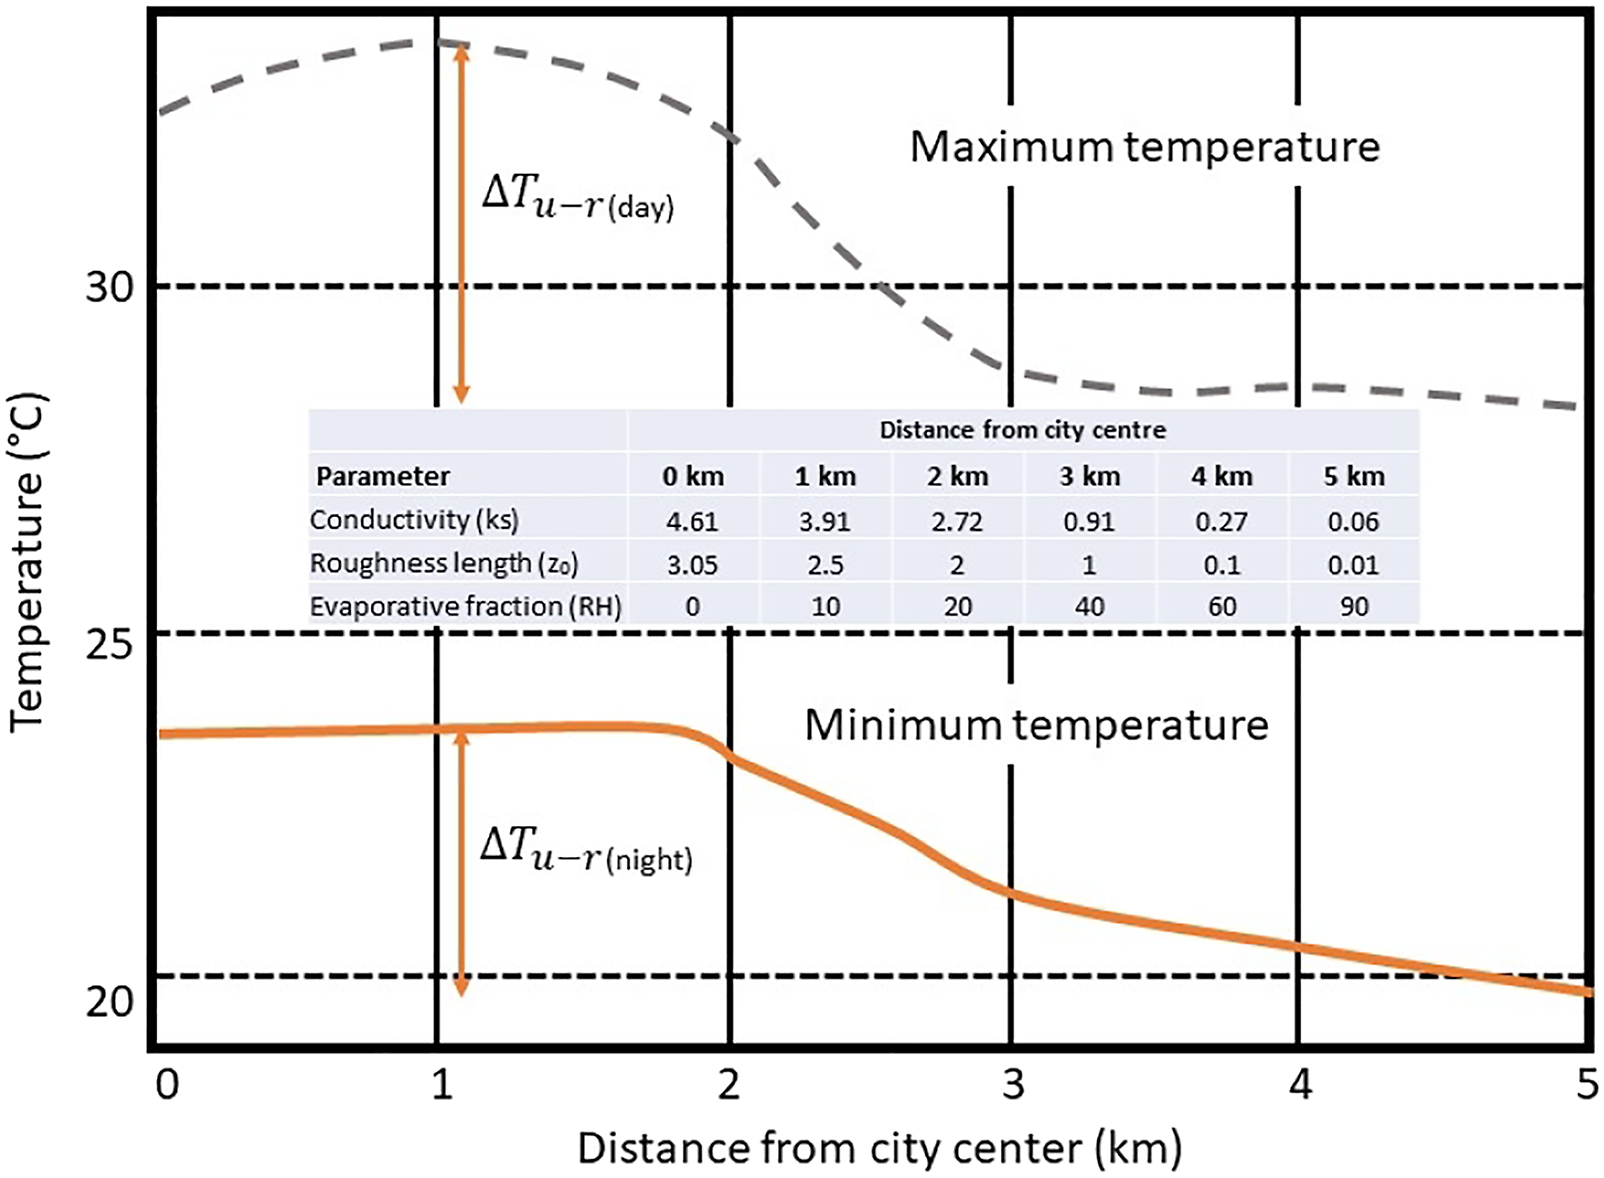
Simulated temperature (T0) along a transect from the city centre to the rural outskirts at the time of the summer solstice. The various surface, atmopsheric and substrate parameters chosen for this calculation are given in Table 1. Redrawn from Figure 6 in Myrup (1969).
IV Synthesis
Myrup’s paper had several objectives, one of which was to form the simplest possible set of equations which still retained the essential physics of the atmospheric surface layer but which also could be conveniently solved with the use of a small computer in the classroom or laboratory. In this respect, the paper was a great success and had considerable influence on those that followed. At the time of publication, there were few active researchers in UC and a relatively small number of publications in the field. Not surprisingly, then, most urban climatologists working in the Anglo-American world from the 1970s onwards would have had a shared reading list that included Myrup’s paper. While its citation history has been modest (about 400 based on GoogleScholar), it was referenced by an important set of papers published throughout the 1970s that set the stage for the devlopment of a modern science with a strong theoretical grounding and predictive capacity. In modelling research for example, it is referenced by Outcalt (1972), who developed a similar model for a digital computer that was used for teaching, by Terjung and Louie (1973) who introduced the complexity of radiation exchanges within streets, and by Delage and Taylor (1970) who connected the UHI at the surface to thermal circulation in the urban boundary-layer.
A primary motivation for the research described in the paper was frustration at the existing UHI literature (the complete absence of numerical estimates of the order of magnitude of the suggested mechanisms is striking). Myrup’s organization of the simulations to examine the contributions of the various drivers is insightful. He concludes that the important parameters which determine the size of the heat island effect are the reduction of evaporation in the city, the increased roughness of the city, the thermal properties of the building and paving materials, and wind speed. Overall, reduced evaporation dominates during the day while the thermal properties of the substrate dominate at night, other factors being equal… Self-heating (that is, the 35 Wm-2 added to Q* to represent the anthropogenic heat flux) is probably not an important contributor. Each of these conclusions have been verified by subsequent observational and modelling work. Moreover, he cleverly links the 1D model to a simple urban land-use model (the transverse experiment) to hypothesise the development of a daytime warm annulus at a distance of 1 km from the city centre (Figure 2); this is a real but rarely reported feature of heat islands.
Myrup’s paper also proved prescient in its evaluation of key questions that are still relevant; two of the questions posed were: Are there engineering techniques which could be employed to reduce the heat island? Could cities of the future be planned to eliminate the heat island? His sensitivity analysis indicated that a critical threshold of 20–30% for the evaporative fraction of a city is needed to offset the magnitude of the UHI significantly (Figure 2). In fact, he suggests roof-top parks (a very modern idea) as a feasible way of modifying existing cities. This role of evaporation as a UHI mitigation tool is prognostic of later work on Bowen ratios and urban cooling, and it aligns closely with tree canopy targets that are set for many mid-latitude cities.
Overall, Myrup concludes that probably the outstanding failure of this model is the fact…that the heat island is calculated to be largest during the day while all observations indicate that the temperature excess is actually largest at night. He suggests that the ‘blanket effect’ of air pollution and/or the changed nature of turbulence at night could explain this discrepancy. However, Myrup does not consider the mismatch between his simulations of T0 at z0 (Figure 1) and the CUHI observations he uses to evaluate the model. His model does not account for the urban canopy and the micro-scale processes that regulate night-time cooling; instead he treats the space between the ground and z0 as isothermal. In fact, Myrup’s model, which treats the urban surface as a rough concrete ‘slab’ is a much better fit to the SUHI as seen from above; the simulated UHI is closer (in terms of relative magnitude and timing) to the satellite observed SUHI, which were not available until the mid-1980s. The confusion of scales and of surface and air UHIs, as shown by Myrup’s work, has been a persistent issue in urban climate science that has delayed its progress.
V Conclusion
Myrup’s paper is a classic in urban climate science for several reasons. First, it married boundary-layer theory to newly accessible computing technology and provided an alternative methodology for exploring climates near the ground. Second, it shifted the foci of UHI studies from the response (temperature) to the responsible processes (energy exchanges), and from the specific city case-study observations to generic urban settings. Given the expense and difficulty of measuring energy exchanges, the ability to simulate those same exchanges opened up new avenues of enquiry. Third, he placed the UHI within a framework that permits analysis of cause and effect and this allowed him to make statements on how to mitigate UHI magnitude. Fourth, he identified some key weaknesses in the field at the time, such as the need for data on cities to provide values for model parameters. The lack of useful urban information has been a continuing problem for the development of the science and has hindered productive application of models to new places (Ching et al., 2018). However, the paper also has flaws that could have been addressed in his discussion. In partcular, the failure to acknowldge the role of the UCL in limiting nighttime radiative heat loss, slowing urban cooling and creating the UHI is notable; this was already a widely proposed hypothesis on the causes of the UHI (Howard, 1833).
A numerical model of the urban heat island is part of a rich literature on the UHI that illustrates the development of the urban climate science that deserves to be read and cited (Stewart, 2019). This literature charts an uneven path to progress as researchers tried to grapple with the compelexities of the urban environment. Awareness of this history is well worth the investment by new researchers: it can help them to avoid making mistakes that impede scientific investigation of the UHI, and that cause miscommunication among allied fields, such as urban planning and design.
Footnotes
Acknowldgements
Declaration of conflicting interests
The author(s) declared no potential conflicts of interest with respect to the research, authorship, and/or publication of this article.
Funding
The author(s) disclosed receipt of the following financial support for the research, authorship, and/or publication of this article: Niyogi acknowledges John E. "Brick" Elliott endowment at the University of Texas, U.S. NSF OAC- 1835739, and NASA IDS 80NSSC20K1262, and 80NSSC20K1268