
Abstract
Gully erosion can reach alarming dimensions, and in several cases contributes significantly to soil loss and sediment yield in catchments. The studied example is one of the largest known gully networks in the world (its surface area is approximately 0.5 million m2 and volume 5 million m3), more than twice as large compared to the largest gullies described in peer-reviewed literature. To improve gully management strategies, it is not only critical to understand the factors that lead to erosion, but also to identify the extent of in-channel erosional and depositional features. Few studies consider in-channel patterns of erosion and deposition within gully systems. This study utilises a fixed-wing Unmanned Aerial Vehicle (UAV) and Structure-from-Motion (SfM) photogrammetry to create a high resolution orthomosaic and Digital Surface Model (DSM) to determine the position and spatial extent of erosional and depositional features within a large gully network in South Africa. Formation of such a large gully in relation to a relatively small drainage area is unusual but can be explained by the presence of dispersive soils and regional landscape incision. Longitudinal and cross-sectional profiles indicate that the gully network consists of three channel types (i.e. V-shaped, U-shaped and trapezoidal), each with a unique combination of erosional and depositional features. This study demonstrates the value of identifying and mapping of intra-gully features to better understand sediment transfer within the gully network to implement appropriate restoration strategies, which in this instance should focus on depositional zones to enhance channel decoupling.
Introduction
Once initiated, gullies can expand into large networks that contribute significantly to soil loss, causing an increase in hydrological and sediment connectivity within a catchment resulting in the sedimentation of rivers and reservoirs (Boardman et al., 2019; Castillo and Gómez, 2016; Poesen, 2018; Vanmaercke et al., 2016). Although it is imperative to remediate these problems, it is usually not feasible to rehabilitate large gully systems with expensive physical structures at a catchment scale. It is more practical to formulate preventative measures and to target areas with recovery potential that can demonstrate short-term improvements and positive impacts at low cost (Frankl et al., 2021). For example, the expansion of actively eroding headcuts or sidewalls need to be minimised with site-specific structures, while intact areas that retain water and sediment within or between gully interfluves should be supported or improved (Sandercock and Hooke, 2011; Wilkinson et al., 2014). According to Poesen (2011), if we want to improve gully management strategies we need to understand, not only the extent of intra-gully erosion features (such as eroding gully head, bed and/or sidewall), but also the extent of depositional areas (such as gully outlet, fan and/or vegetated areas). This is significant since intra-gully features exert a primary control on the erosion rate and transport of sediment through a gully network (Grieve et al., 2016).
Although a number of studies include evaluations of gully dimensions (such as length and cross-sections), few studies consider in-channel patterns of erosion and deposition within gully systems (Castillo and Gómez, 2016; Poesen, 2018); especially for large gully systems (Fuller et al., 2020; Imwangana et al., 2015). Wasson et al. (1998) assessed the spatial patterns of bed material in channels by means of field mapping and historical analysis. Another example is the use of spatially distributed models such as SEDNET that routes sediment to and within channels using sediment transport capacity equations (Wilkinson et al., 2014). However, there are still no validated gully erosion models available (Poesen, 2018). Spatially distributed models that consider gully processes usually have low model accuracy, high data demands and are limited to small (region-specific) research catchments (Poesen, 2018). Another approach is the use of Digital Surface Models (DSMs) to measure gully dimensions, but very high resolution (∼10 cm) data are needed to elucidate in-channel features such as collapsed sidewalls (Betts et al., 2003; Fuller and Marden, 2008). The application of remote sensing techniques and GIS tools have contributed significantly to produce high resolution datasets, for example, using satellite images, aerial photos, LiDAR data and terrestrial laser scanning (e.g. Taylor et al., 2018). However, acquisition of high-resolution data can be costly and time consuming (Glendell et al., 2017). Image-based modelling is a cost-efficient and rapid method to quantify gully morphology from photographs taken in the field (e.g. Frankl et al., 2015; Gómez-Gutiérrez et al., 2014) but have limited spatial coverage and can be hindered by the remoteness and terrain complexity of large gullies.
The advent of Unmanned Aerial Vehicle (UAV) technologies offer considerable potential for meeting the abovementioned requirements (e.g. Castillo et al., 2015; Koci et al., 2020; Pérez and García, 2017; Wells et al., 2017). Recent improvements include integrated UAVs utilizing photogrammetric payloads and Structure-from-Motion (SfM) stereographic software (Wells et al., 2017). Structure-from-Motion techniques offer a cheaper alternative to LiDAR, with accuracies that are similar or superior to LiDAR in some cases (e.g. Castillo et al., 2012; Gómez-Gutiérrez et al., 2014). Overlapping images with sub-centimetre resolution can be obtained to create high resolution DSMs of gullies (Eltner et al., 2016). Such high resolution DSMs can perform reproducible measurements of the geometry of gullies to determine small-scale features within gully channels such as headcuts, flutes and collapsed sidewalls (Ferrer et al., 2017). Stöcker et al. (2015) measured gullies by the synergetic application of UAV and ground photogrammetry, whereas Peter et al. (2014) used UAV photogrammetry in synergy with rainfall simulations. Glendell et al. (2017) tested UAV-derived DSMs to quantify volumetric soil loss from gullies where ground assessment would have been hindered by the remoteness and complexity of the terrain. Riddle et al. (2018) used an UAV to obtain a better understanding of a large gully in South Africa, including erosional and depositional areas before and after an erosion event. Anders et al. (2013) applied UAV-derived DSMs to assess the geometry of in-channel features, making it possible to assess and quantify erosional and depositional features.
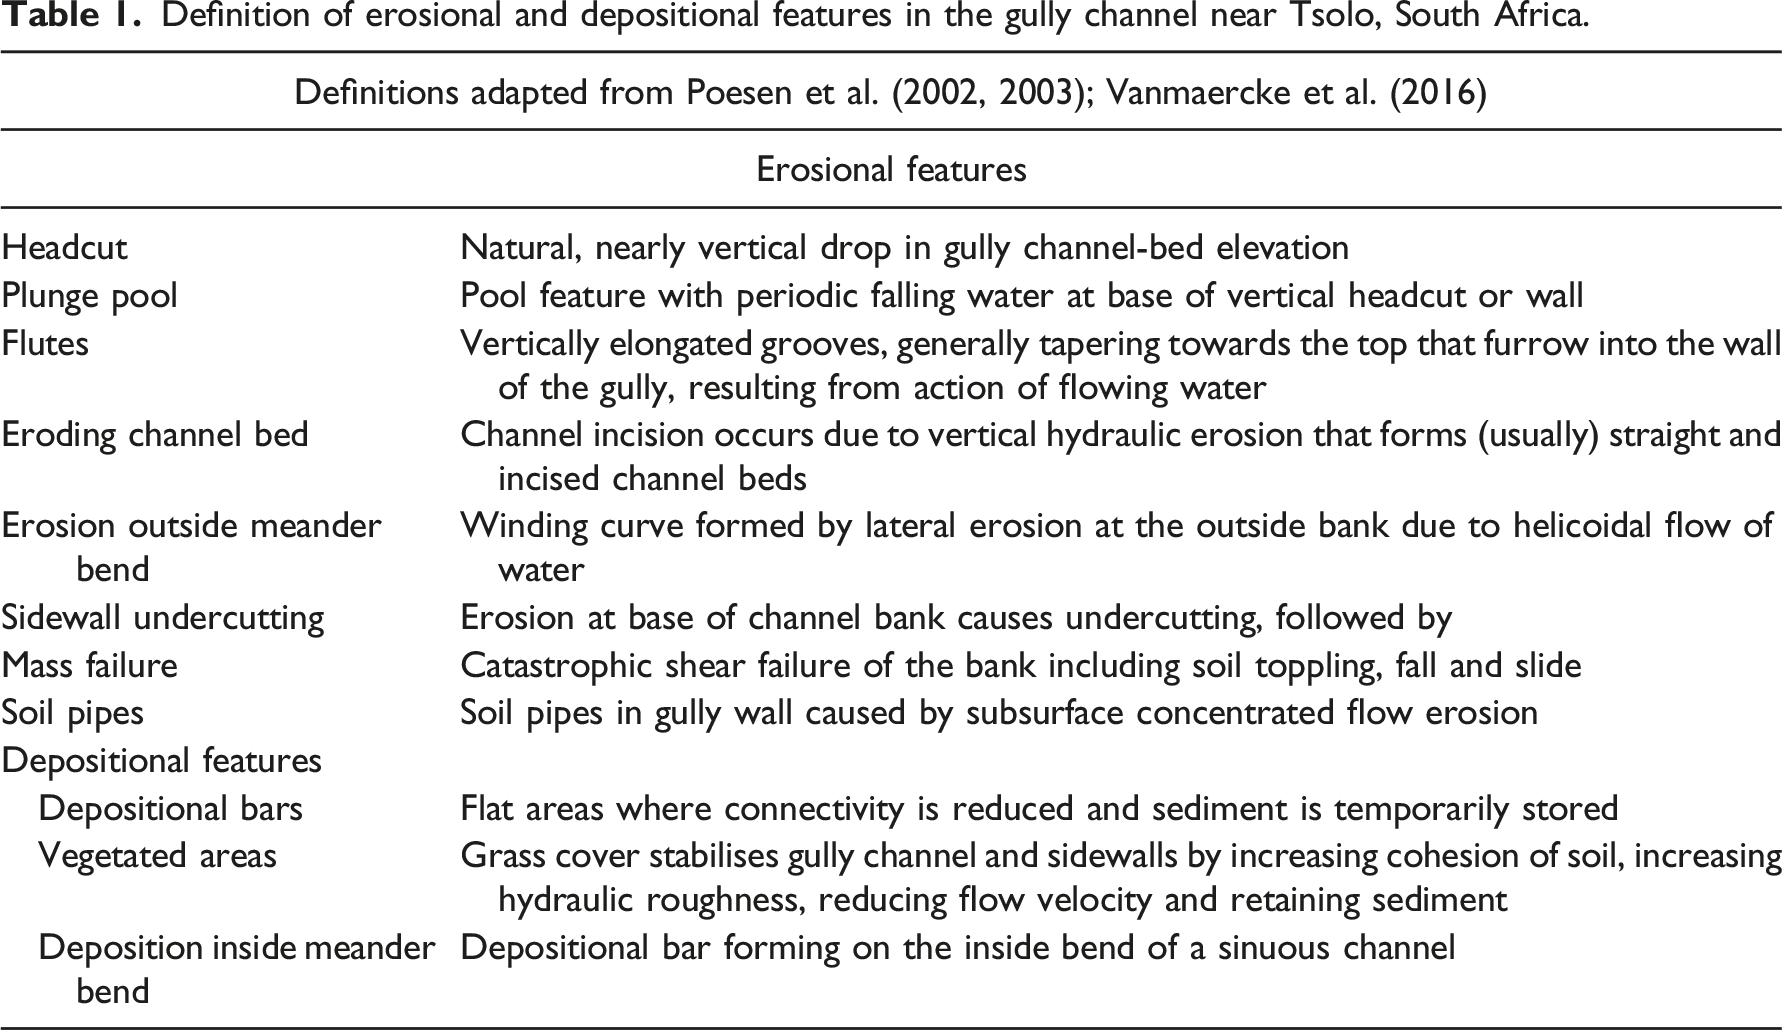
Assessment of erosional and depositional features in large gully networks, however, remains a major challenge. Not only can they be vast and complex, these intra-gully features are driven by a large number of in-channel sub-processes that interact (Casalí et al., 2009; Sidorchuk, 2006). In-channel gully erosion features include head cuts, plunge pools, eroded channel bed, soil pipes, flutes, undercut channel side walls and mass failure, whereas deposition occurs at vegetated areas with low gradients and/or inside meander bends (Poesen et al., 2002, 2003; Vanmaercke et al., 2016). According to Poesen et al. (2018), features controlling the activity or stability of gully channels requires further research. In this context, the aim of the study is to determine the dimensions of a large gully network in South Africa and to map the position and extent of erosional and depositional features where sediment is generated and deposited within the gully, respectively. This study utilises a fixed-wing UAV and SfM photogrammetric software to create a high-resolution DSM of a gully network in the Tsitsa River Catchment in South Africa which is 5 km long from head to toe. According to our knowledge, the gully network is among the largest in the world compared to gullies documented in other studies (Glendell et al., 2017; Imwangana et al., 2015; Marden et al., 2018; Vanmaercke et al., 2016). Not only is it large, all the processes mentioned above occur within its channels. From a practical perspective, this gully has been selected for study as it is located, together with thousands other large gully networks, in the Tsitsa River Catchment where water resource development is planned (Parwada and Van Tol, 2017). Two multipurpose dams (irrigation, municipal water and hydropower) are planned on the Tsitsa River because it is nested in the only large river network in South Africa without a dam. However, Le Roux (2018) predicted relatively short life expectancies (55 and 43 years, respectively) of these future dams since gullies feed significant amounts of sediment into the river network. Furthermore, the gully network is a geomorphological hazard that threatens the safety and livelihoods of the local community (steep high walls, loss of farmland and damage to property).
Site description
The expansive gully network is located near the town Tsolo in the Tsitsa River Catchment in the Eastern Cape Province of South Africa, 30° 13′ 46'' south and 28° 40′ 06'' east (see Figure 1). The gully network is oriented southwest to northeast, nearly 5 km long which is up to 233 m wide and 15 m deep in some places. It is located in a relatively small catchment (5.4 km2) and surrounded by gentle slopes. The gully network drains into the Ncolosi River, a tributary of the Inxu River, which is a tributary to the Tsitsa River and larger Mzimvubu River (Figure 1). Climate is characterised as semi-arid with a mean annual rainfall of 625 mm of which approximately 80% is recorded in the summer season extending from October to March (ARC Climate Database, 2012). Vegetation consists mainly of grassland, with narrow bands of Bushveld dominated by Vachellia thorn trees (Mucina and Rutherford, 2006). Most of the area is used for extensive communal grazing and low-density housing. The geology of the gully catchment consists of a succession of red mudstone, greenish–grey mudstone and fine to medium grained sandstone of the Tarkastad Formation (Karoo Supergroup) of Triassic age (Council for Geoscience, 2007). Karoo dolerite dykes are also present (where barriers or walls of resistant dolerite intrude the soft mudstones). Soils derived from mudstone formations are typically duplex soils that are highly erodible with widespread gully erosion (Du Plessis et al., 2020; Parwada and Van Tol, 2017). Duplex soils are classified as Planosols by the FAO International Soil Classification System. More detail on these soils is provided in the Discussion Section. Location of: (a) the Tsitsa River Catchment in South Africa, (b) gully network and proposed dams.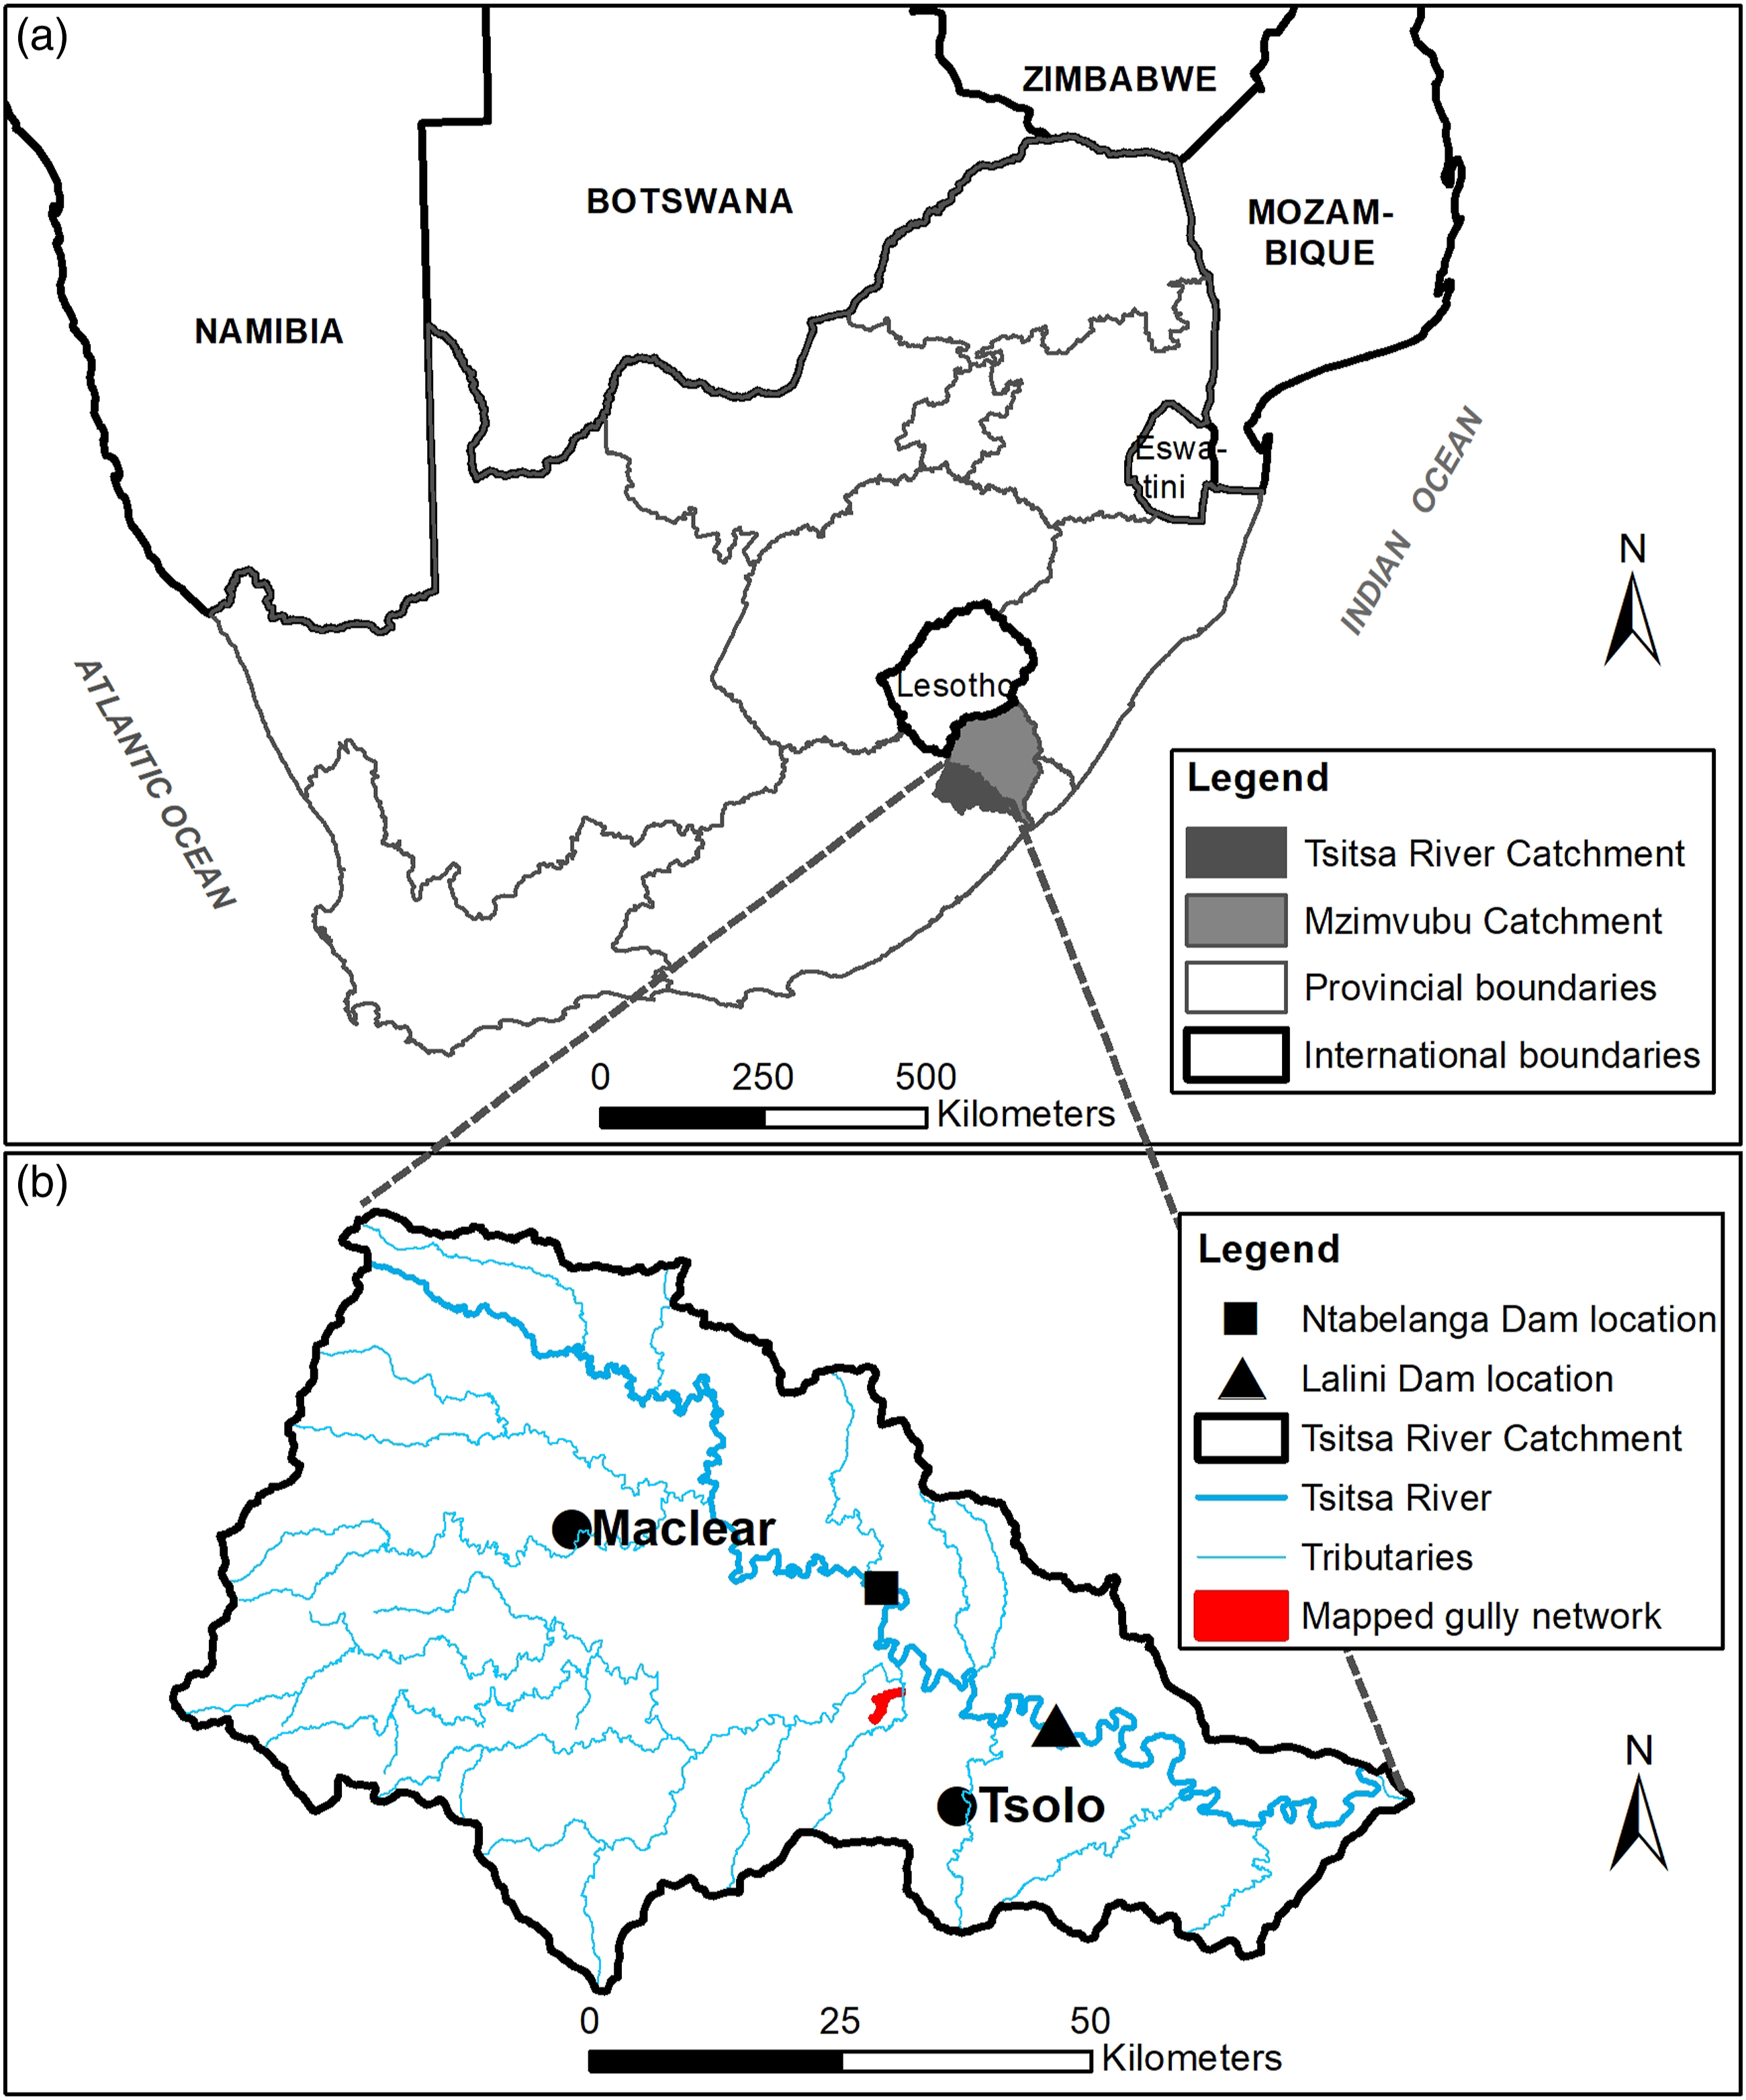
Methodology
Gully network dimensions and in-channel mapping were based on UAV photography similar to other studies (e.g. Glendell et al., 2017; Wells et al., 2017). However, this study did not assess changes over time by means of sequential UAV flights and multi-temporal aerial surveys similar to, for example, Eltner et al. (2015) and Ferrer et al. (2017). Another methodological difference is that several studies utilised multicopter UAVs to capture stereographic images of gullies (e.g. Koci et al., 2020; Pérez and García, 2017), whereas this study used a fixed-wing UAV (Trimble UX-5HP) to collect airborne photographs. Fixed-wing UAVs are more suitable than multicopters for capturing stereographic images of large areas (Anders et al., 2013; Ferrer et al., 2017; Peter et al., 2014). The fixed-wing flew pre-determined flight paths (totalling 1611 images captured over 6 flights in September 2018) at a height of 120 m above the ground with 80% image overlap in flight direction and 70% side overlap. According to Wells et al. (2017), imagery overlapping the same area assists in shadow avoidance while normalizing spatial resolution. A 36 MP Sony camera (Model ILCE-7R) with a 35 mm custom lens was used to capture RAW aerial photographs at 7.5 cm resolution. Ground control points (GCPs) were included similar to Wells et al. (2017) to optimise three-dimensional registration between datasets and improve accuracy of the generated information of gully morphology. The selection of GCPs (n = 30) considered the high and low elevations, as well as the long and short axes within the gully network (see Figure 2(a)). GCPs were surveyed, including distinctive landmarks such as anthills and fence posts, using a Geomax Zenith 20 differential GPS survey system. (a) Orthomosaic including the location of GCPs, the extent of the gully network boundary separated by eight segments for individual volume calculations (yellow lines), the extent of the Extension zone, Expansion zone, and Deposition and transfer zone (yellow lines); and (b) DSM of the gully network including where cross-sections were profiled (red lines).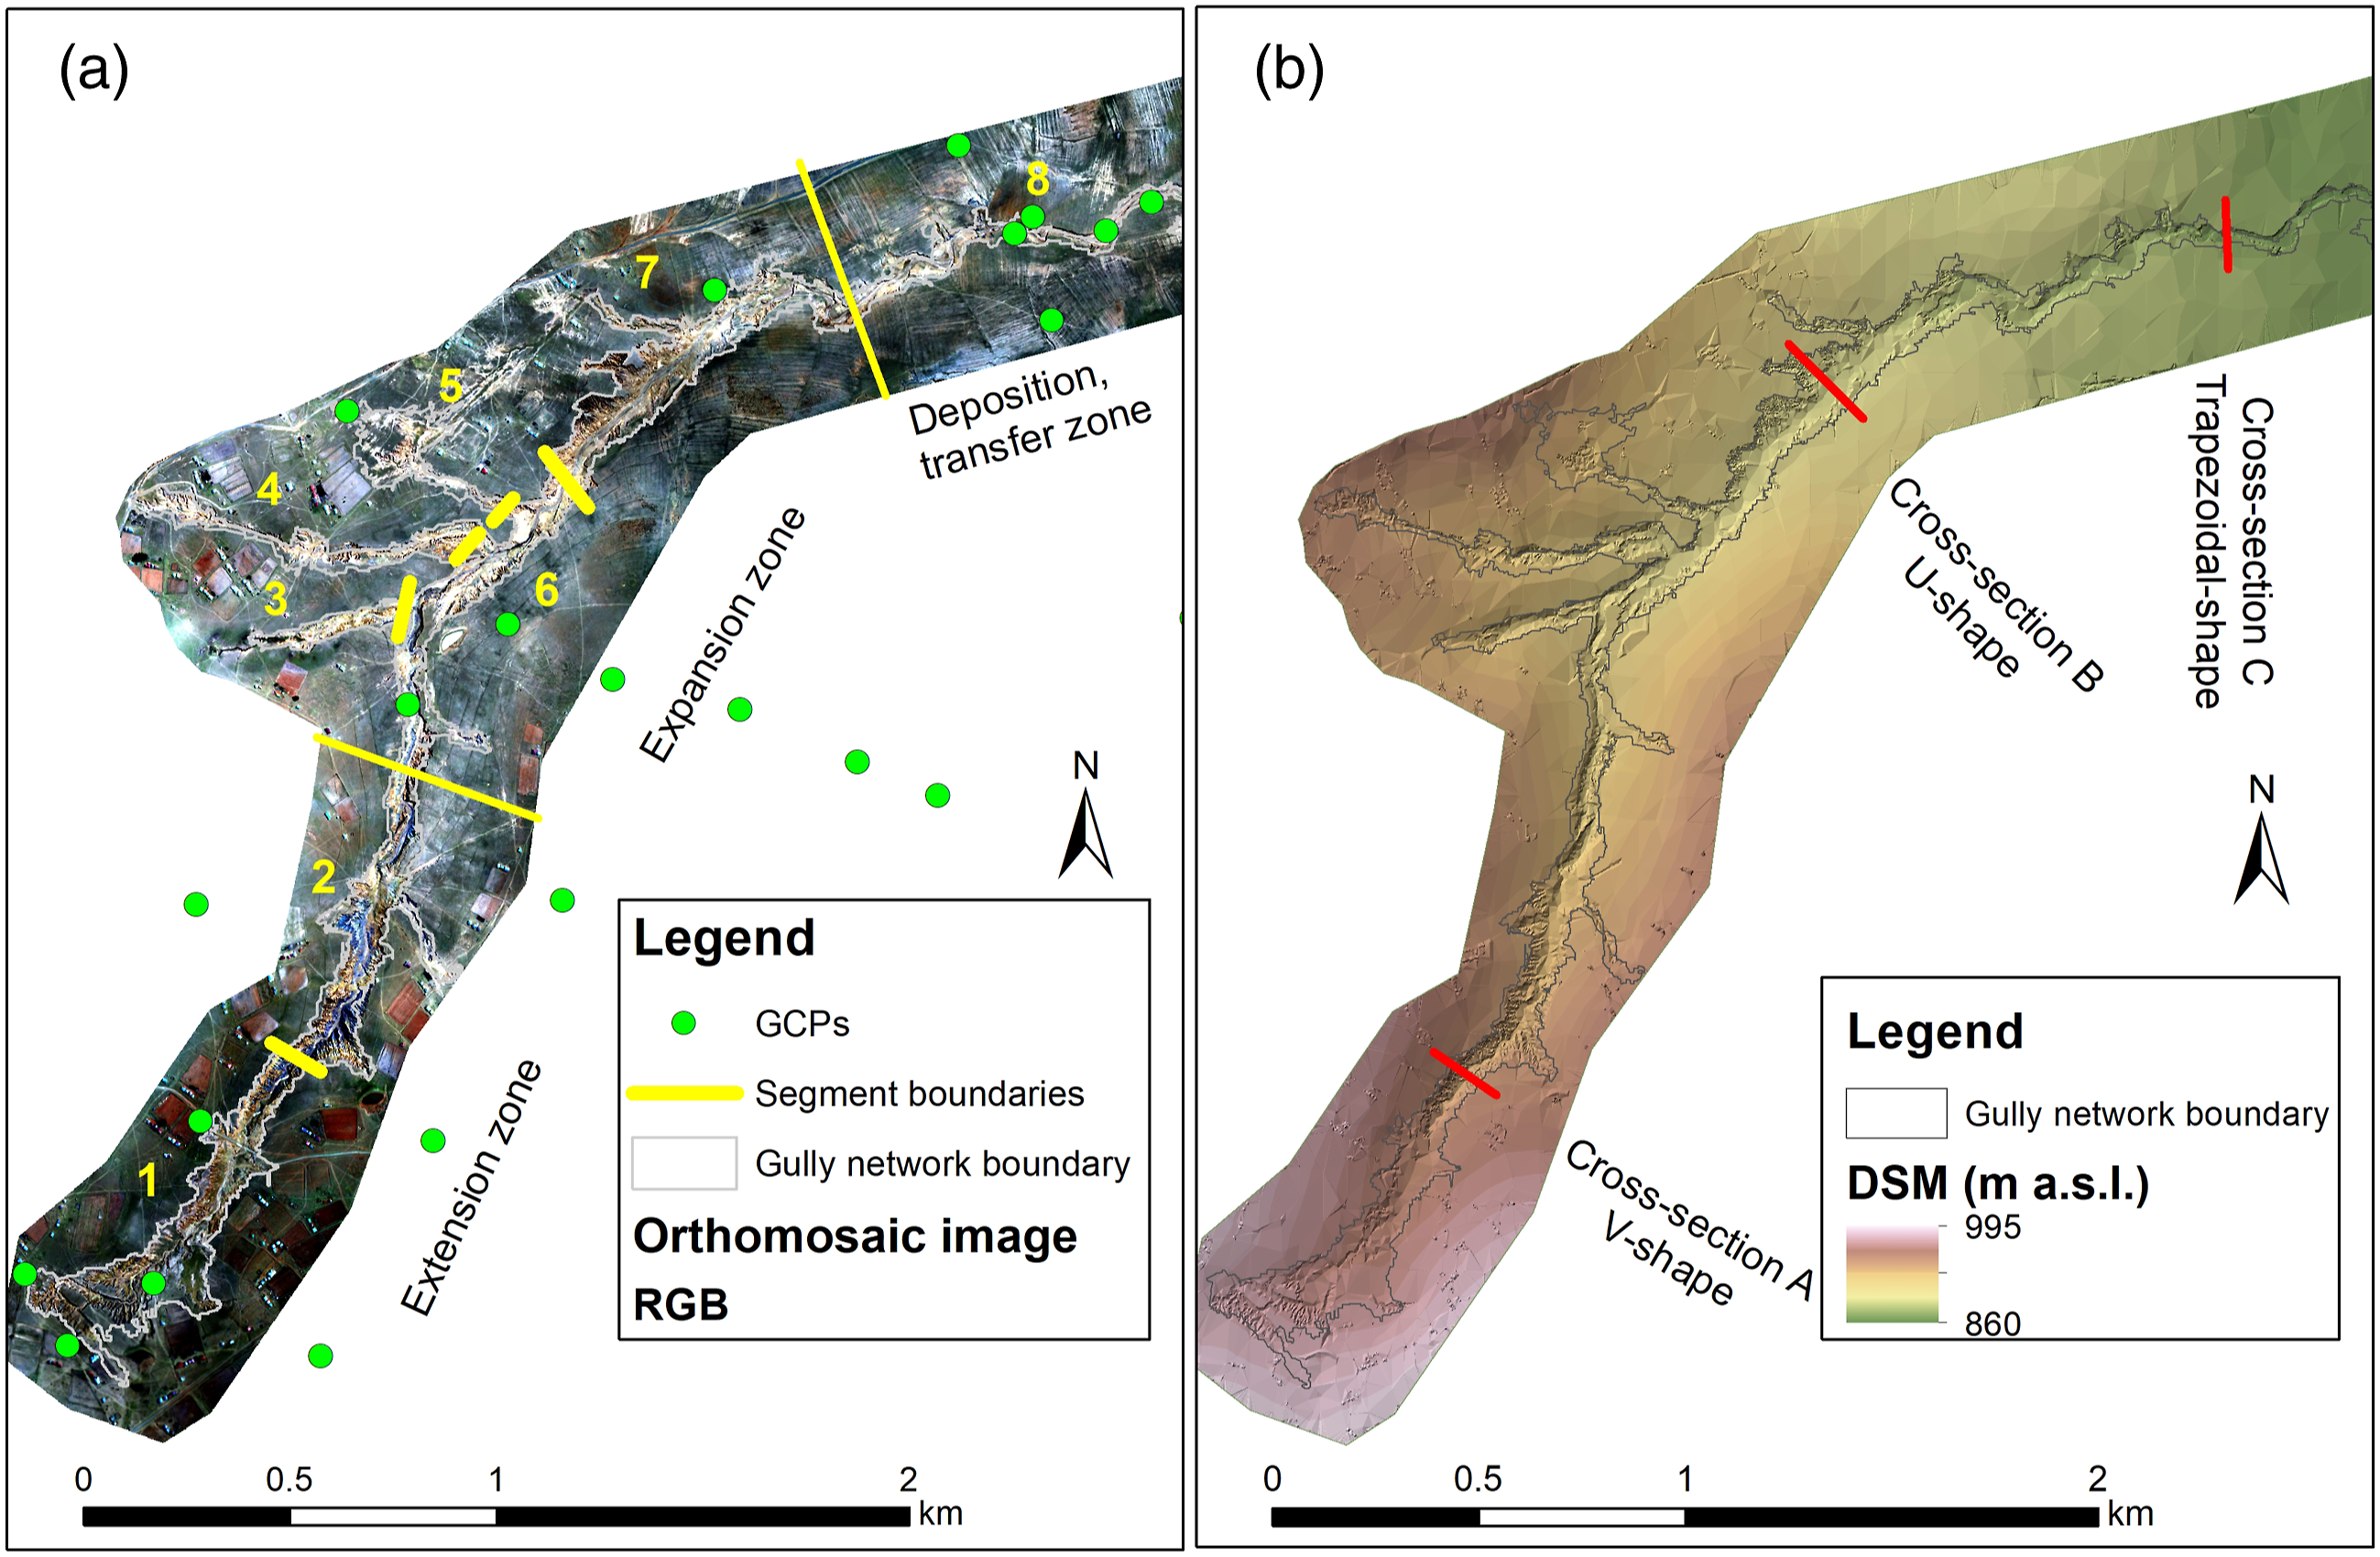
Still photographs captured by the UAV were used to build a single orthomosaic and DSM of the gully network at 10 cm resolution. A smaller spatial resolution would have generated impractical amounts of data for such a large area (Castillo et al., 2014). The DSM was created by means of Structure from Motion (SfM) photogrammetric software (Agisoft Metashape 1.6.1). Similar to other studies (e.g. Anders et al., 2013), the workflow consisted of (a) image matching and automated calculation of tie points to create a sparse point cloud using SfM, (b) positioning of GCPs in the images to georeference and fine-tune the initial point cloud, (c) calculating geometry from the initial tie points using Agisoft Metashape 1.6.1 to create a dense point cloud and DSM and (d) texture rendering for creating orthophotos. Similar to Glendell et al. (2017), the overall volume of the gully network was calculated from the difference between the DSM and a pre-erosion surface model. Due to the large extent of the gully system, the gully was separated in to eight segments for individual volume calculations (see Figure 2(a)). These segments improved volume calculation by considering gully structure and the drop in elevation from gully head to exit. For each gully segment, the Measure tool in Agisoft Metashape was used and run with best fit plane selected based on the gully boundary. The gully boundary was created manually by following the gully wall boundary using the orthomosaic. Segments were summed to calculate the total loss of the gully network. In addition, channel morphology was determined using the Profile Tool in ArcMap. A longitudinal profile was drawn from the head to toe of the main channel, as well as cross-sectional profiles at 100 m intervals (not shown here) to determine the shape of the main channel (V, U or trapezoidal). The next, more difficult task was to map the in-channel erosional and depositional features of the gully.
Definition of erosional and depositional features in the gully channel near Tsolo, South Africa.
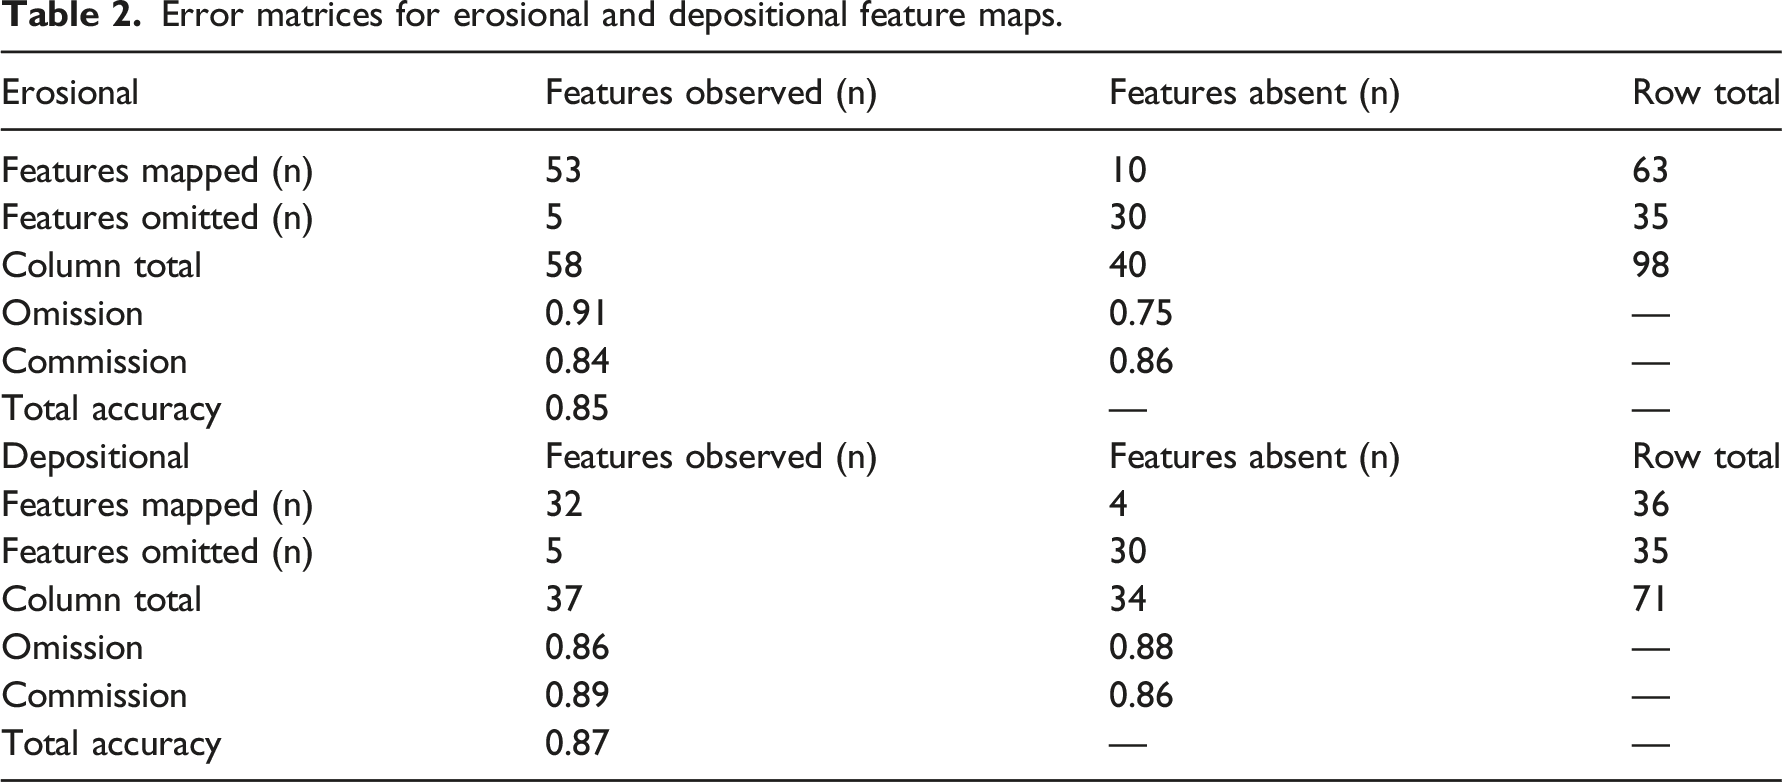
Error matrices for erosional and depositional feature maps.
Results
Results presented here include the generated orthomosaic, DSM, longitudinal and cross-sectional profiles to elucidate gully size and morphology, as well as the location of important erosional and depositional features within the gully network from head to toe.
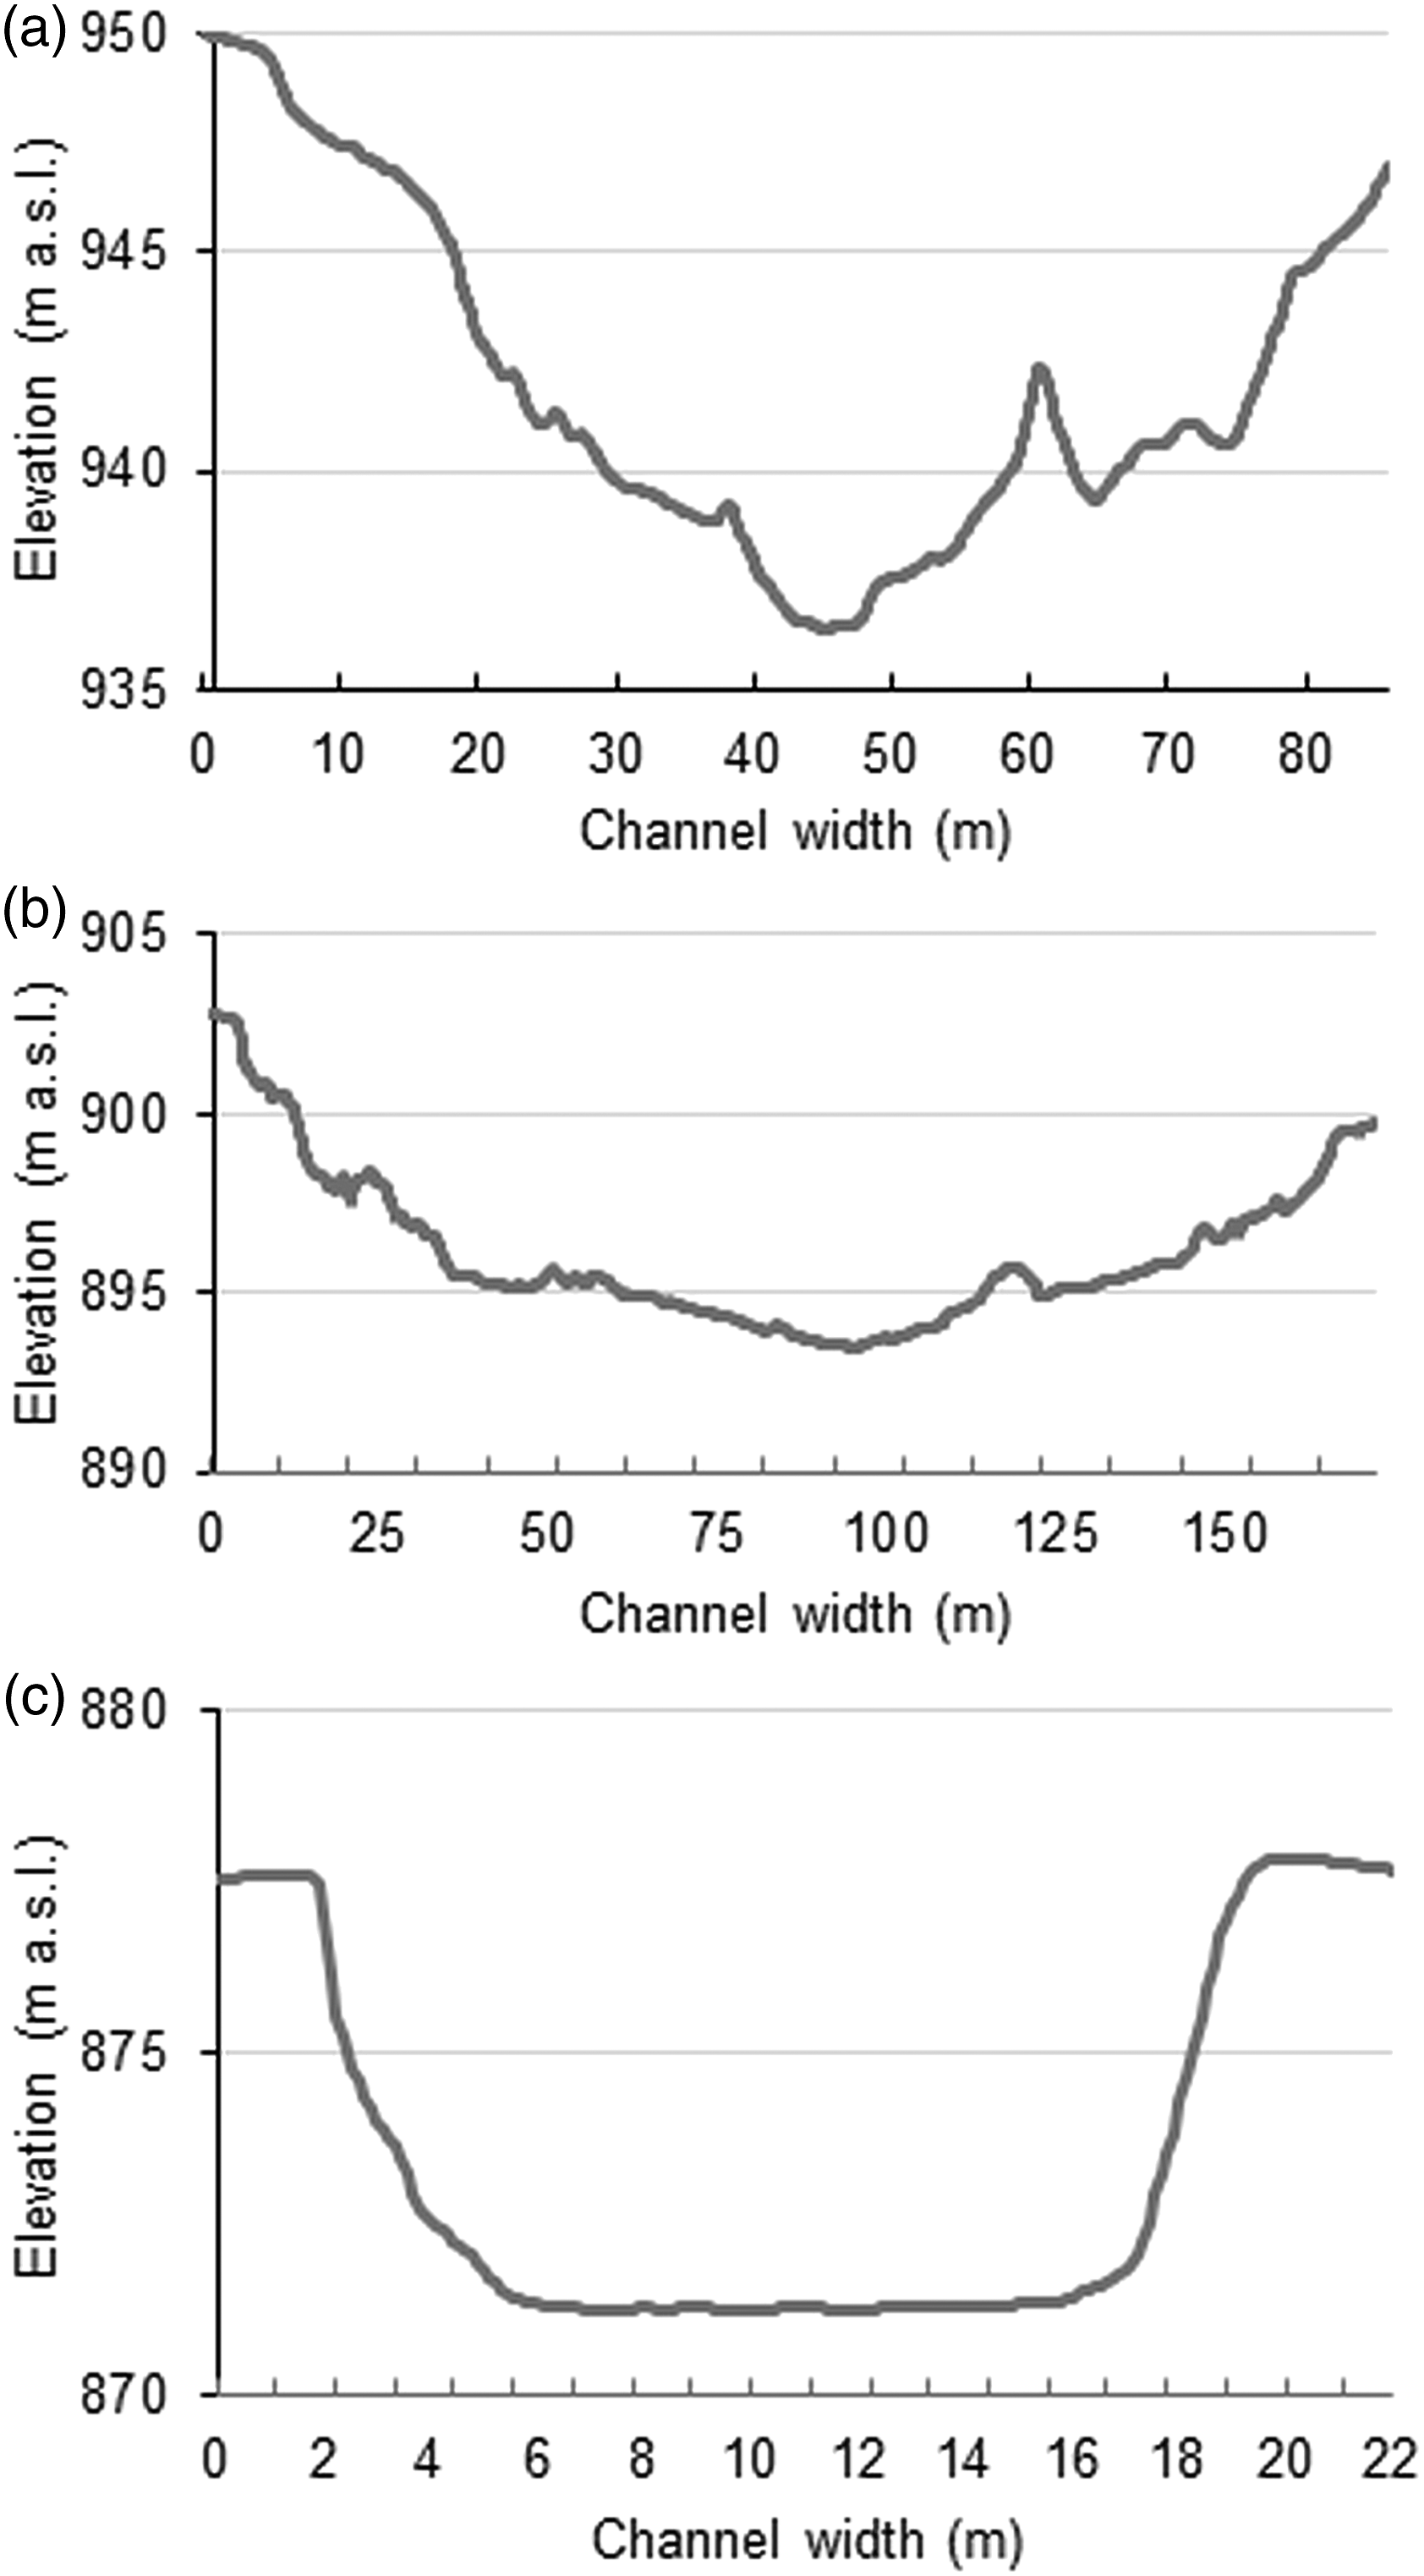
Gully volume and morphology
Figures 2(a) and (b) illustrate the orthomosaic and DSM, respectively, as well as the location of GCPs. The accuracy results of the GCPs were 9.77 cm (with longitudinal (X), latitudinal (Y) and elevation (Z) errors of 7.12 cm, 3.47 cm and 5.74 cm, respectively). As mentioned above, the gully network is extremely large at nearly 5 km long, up to 233 m wide and up to 15 m deep. Its surface area is approximately 534,128 m2, volume over 5 million m3 but nested in a relatively small catchment area of approximately 5.4 km2. The main channel is linear with an average slope of 2.3%, including several small but noticeable steps in the long profile coinciding with harder lithological layers (see Figure 3). In cross-section, the channel consists of three different shapes including V, U and trapezoidal (see three examples in Figure 4). The locations of the three cross-sectional examples are shown with red lines on the DSM (Figure 2(b)) and with red arrows on the longitudinal profile (Figure 3). Longitudinal profile of the main gully channel indicating the boundary of the different zones including (1) Extension zone near the top of the network; (2) Expansion zone in the middle; and (3) the Deposition and transfer zone at the lower end of the network. The locations of the three cross-sectional profiles are shown with red arrows. Cross-sectional profiles of the main gully channel including: (a) V-shape in the Extension zone; (b) U-shape in the Expansion zone; and (c) Trapezoidal-shape in the Deposition and transfer zone.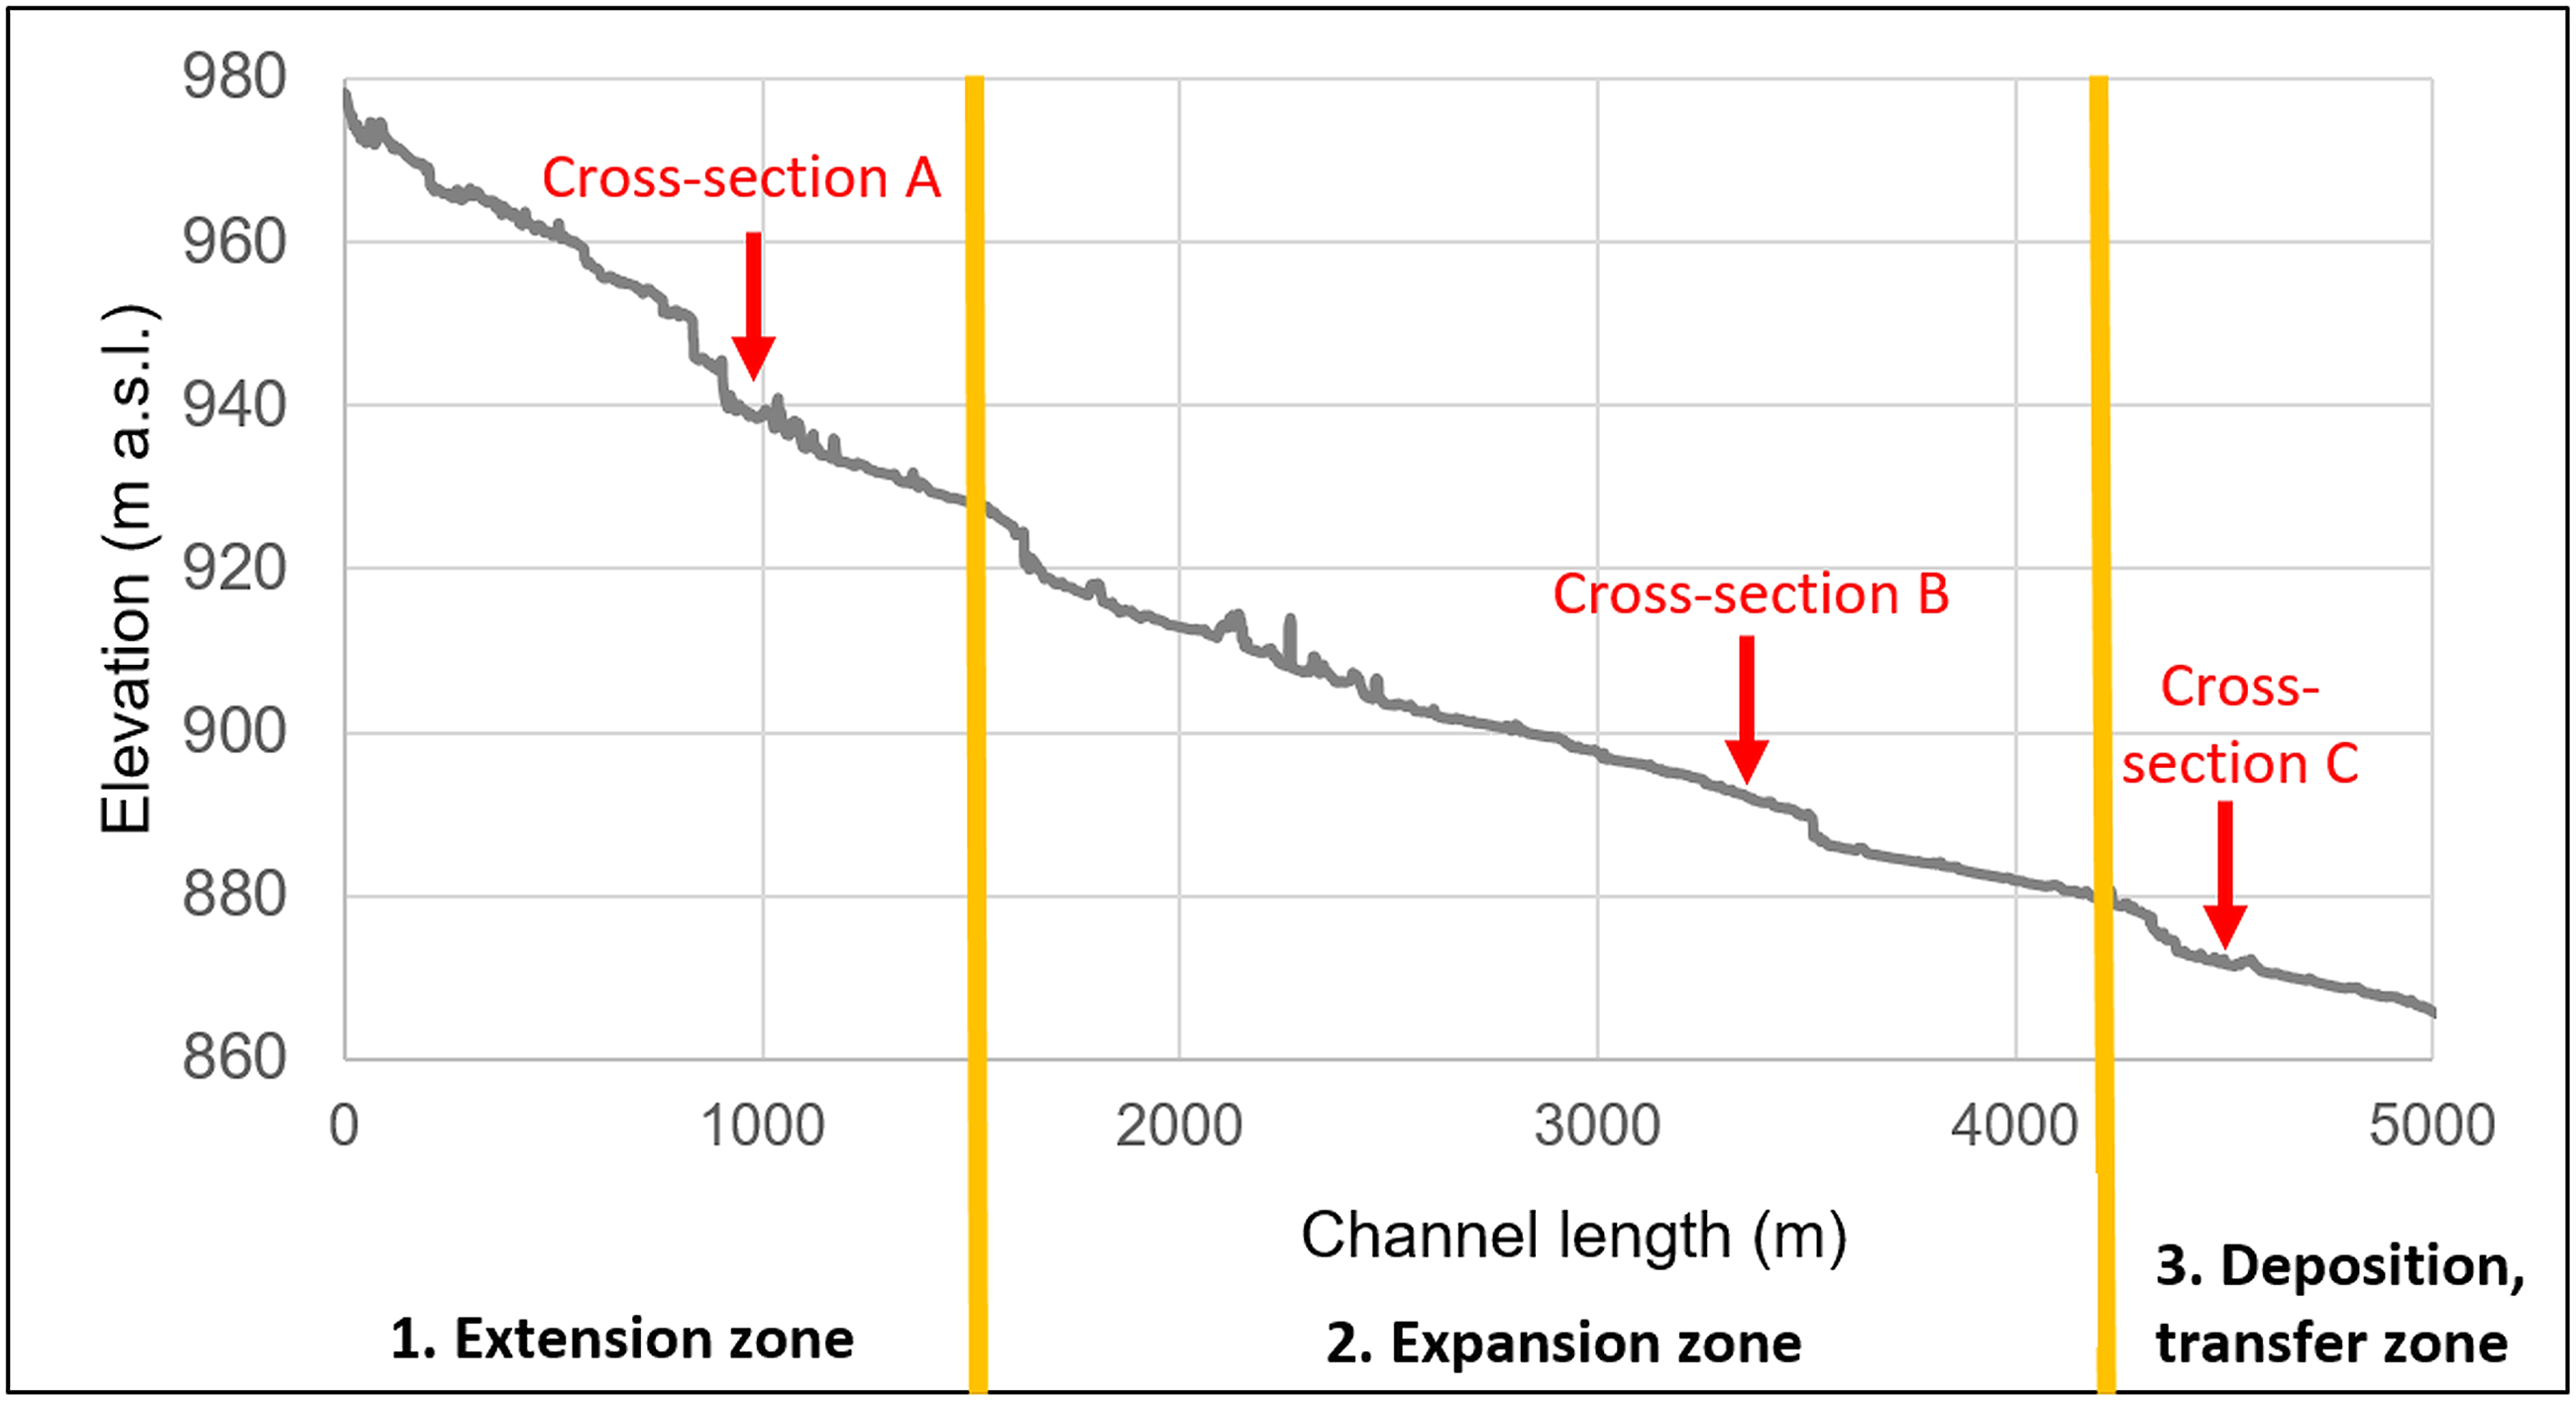
Channel shapes and dimensions, and major processes observed from head to toe in the main gully channel.
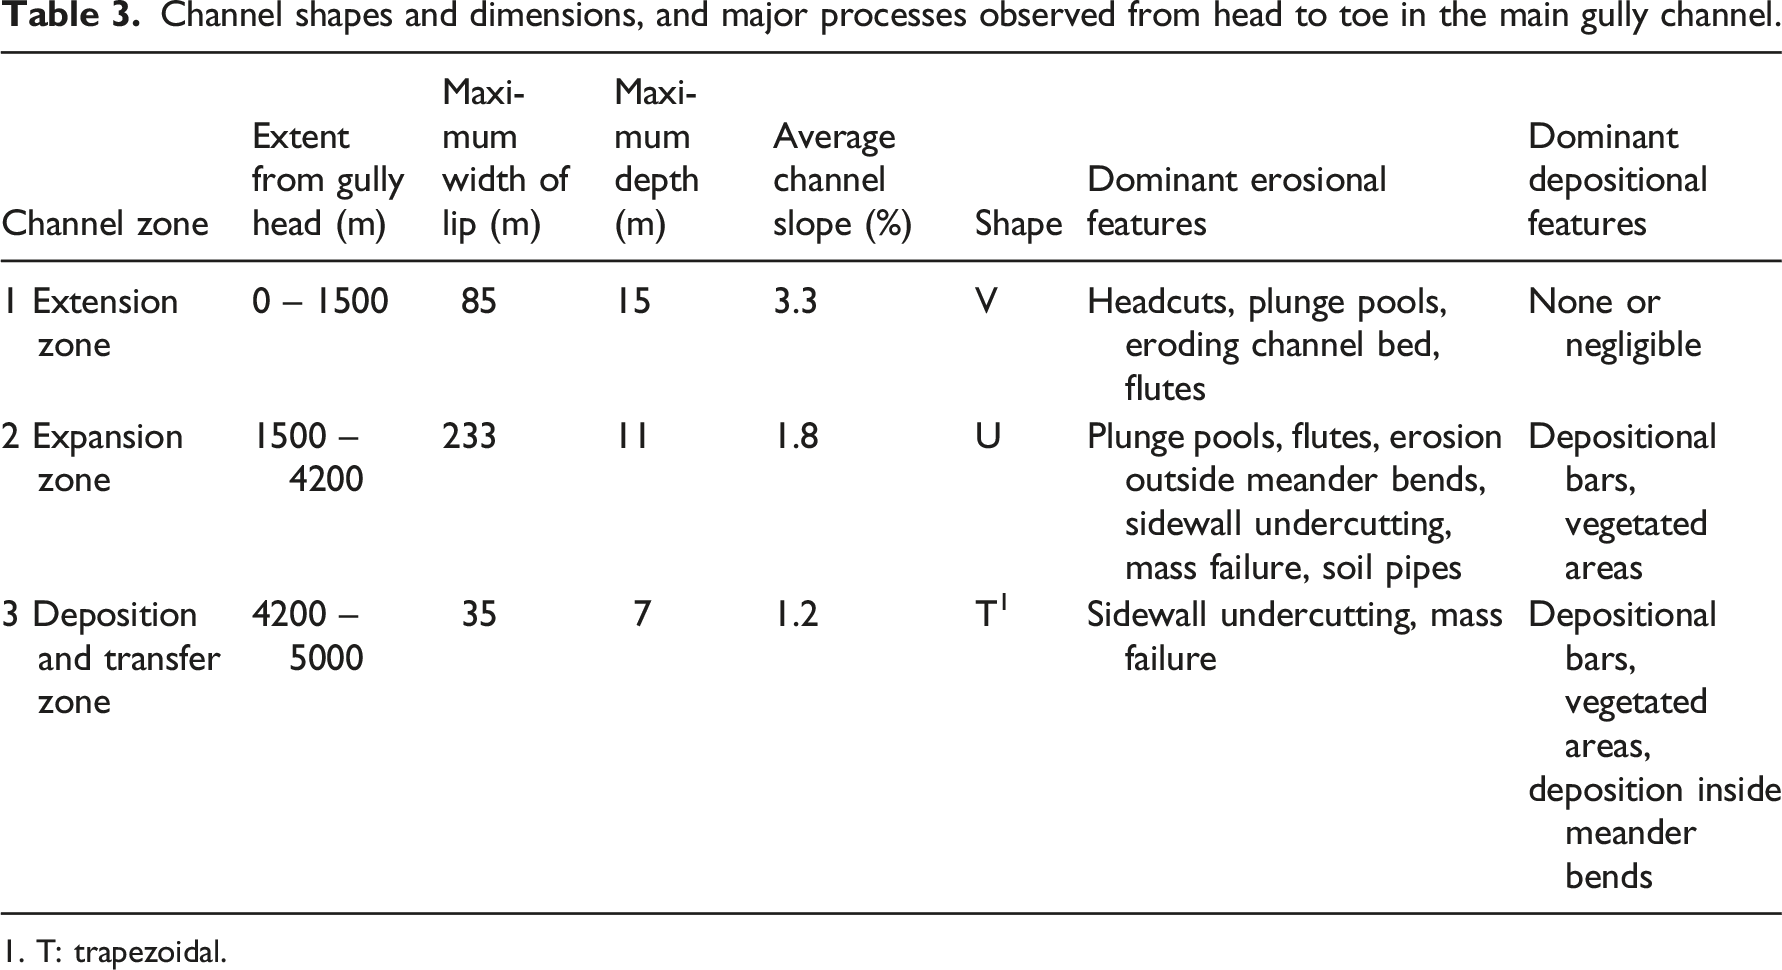
1. T: trapezoidal.
1. For approximately 1500 m from the main gully head (see Figure 2(a)), the Extension Zone has a V-shape with mainly erosional features present. The Extension Zone is relatively steep (3.3%) and reaches a maximum depth and width of 15 m and 85 m, respectively.
2. Further downslope (1500–4200 m; see Figure 2(a)), the Expansion Zone widens into a U-shape where multiple erosion features occur. However, this part of the channel also consists of depositional areas. Although the Expansion Zone is shallower (5–11 m) and less steep (1.8%) compared to the Extension Zone, it widens to a maximum of 233 m. The Expansion Zone also consists of three of the longest side-branches (325 m, 415 m and 890 m) on the southwest flank of the main channel.
3. Approximately 4200 m downslope (see Figure 2(a)) the channel obtains a trapezoidal-shape; it is referred to as the Depositional and Transfer Zone because it consists of mostly depositional features and serves as a link between the Expansion Zone and the gully outlet (the Ncolosi River). The Depositional and Transfer Zone is relatively flat (1.2%) and reaches a maximum depth and width of 7 m and 35 m, respectively.
Extent of erosional and depositional features
The extent of main erosional and depositional features is illustrated in Figure 5. Results indicate that 27.3% of the channel length is actively eroding and 9.6% is subject to some level of sediment deposition. As expected, most deposition occurs in the lower half of the gully channel, especially in the Depositional and Transfer Zone. The extent of erosional and depositional features in the gully network.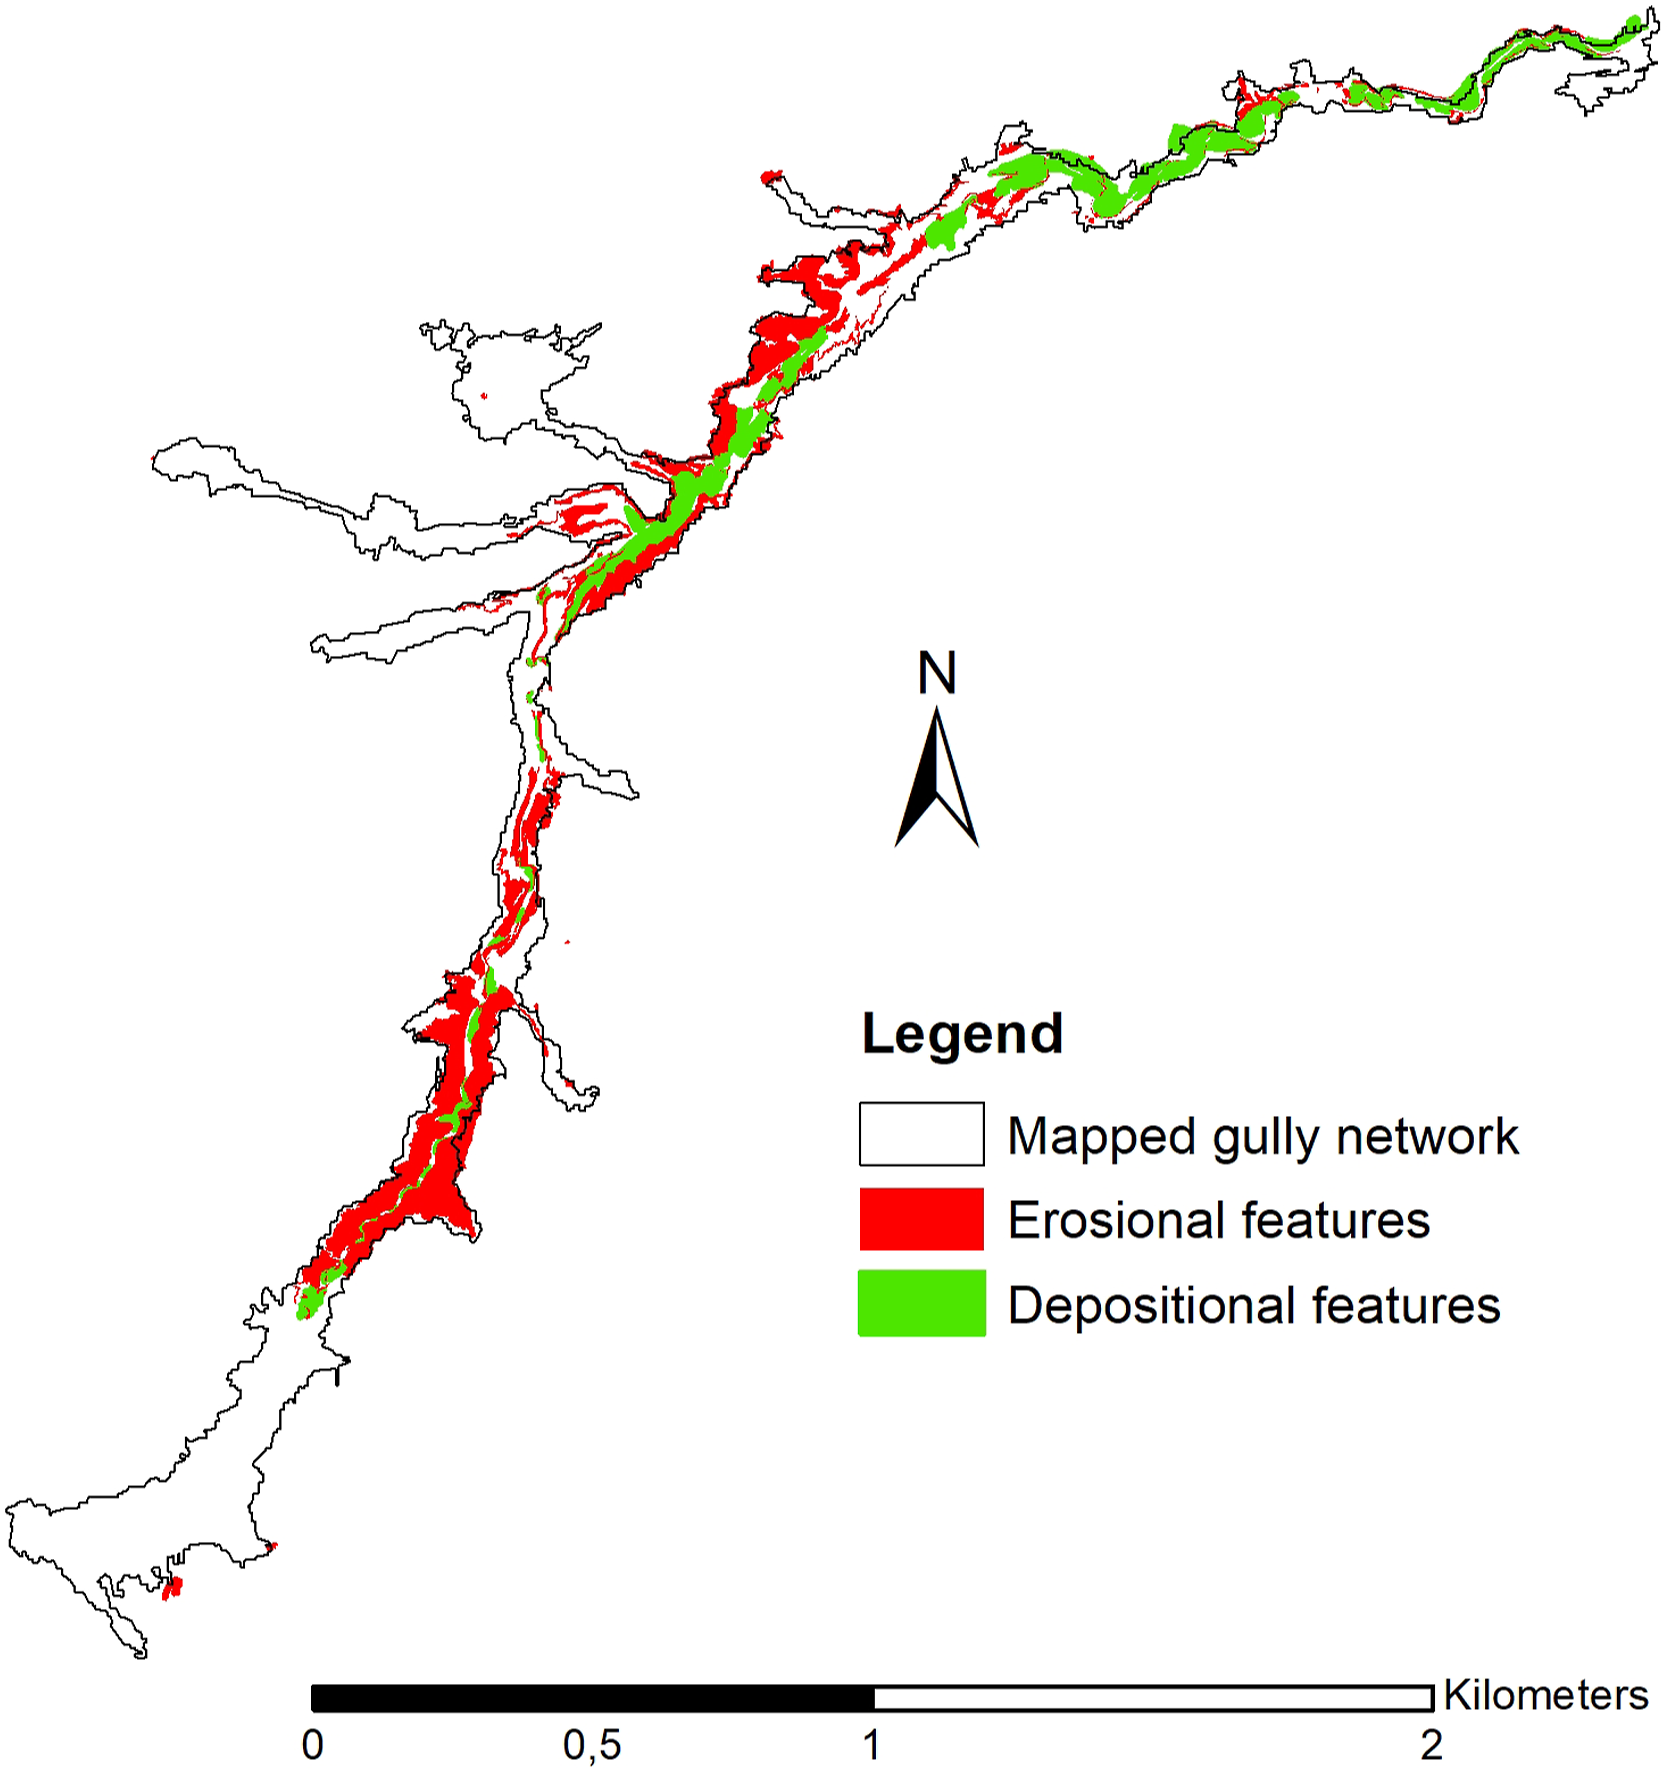
Figure 6 illustrates the locations and extent of different erosional features including (A) headcuts, (B) plunge pools, (C) flutes, (D) eroding channel bed, (E) erosion outside meander bends, (F) sidewall undercutting, (G) mass failure or sidewall collapse features and (H) soil pipes. From the erosional features mapped, the most prominent are flutes (126,185 m2) followed by headcuts (7290 m2), actively eroding channel beds (7195 m2), mass failures (2129 m2) and erosion outside meander bends (1720 m2). According to the Results, the gully network is less affected by sidewall undercutting (986 m2), plunge pools (371 m2) and soil pipes (53 m2). It is noteworthy that the extent of some features such as sidewall undercutting and soil pipes remain uncertain since they are not clearly visible on UAV imagery. Despite this uncertainty, the orthomosaic, DSM and field observations made it possible to identify certain patterns described in the Discussion Section. The locations and extent of different erosional features including (a) headcuts, (b) plunge pools, (c) flutes, (d) eroding channel bed, (e) erosion outside meander bends, (f) sidewall undercutting, (g) mass failure or sidewall collapse features and (h) soil pipes. Each map includes an orthomosaic subset.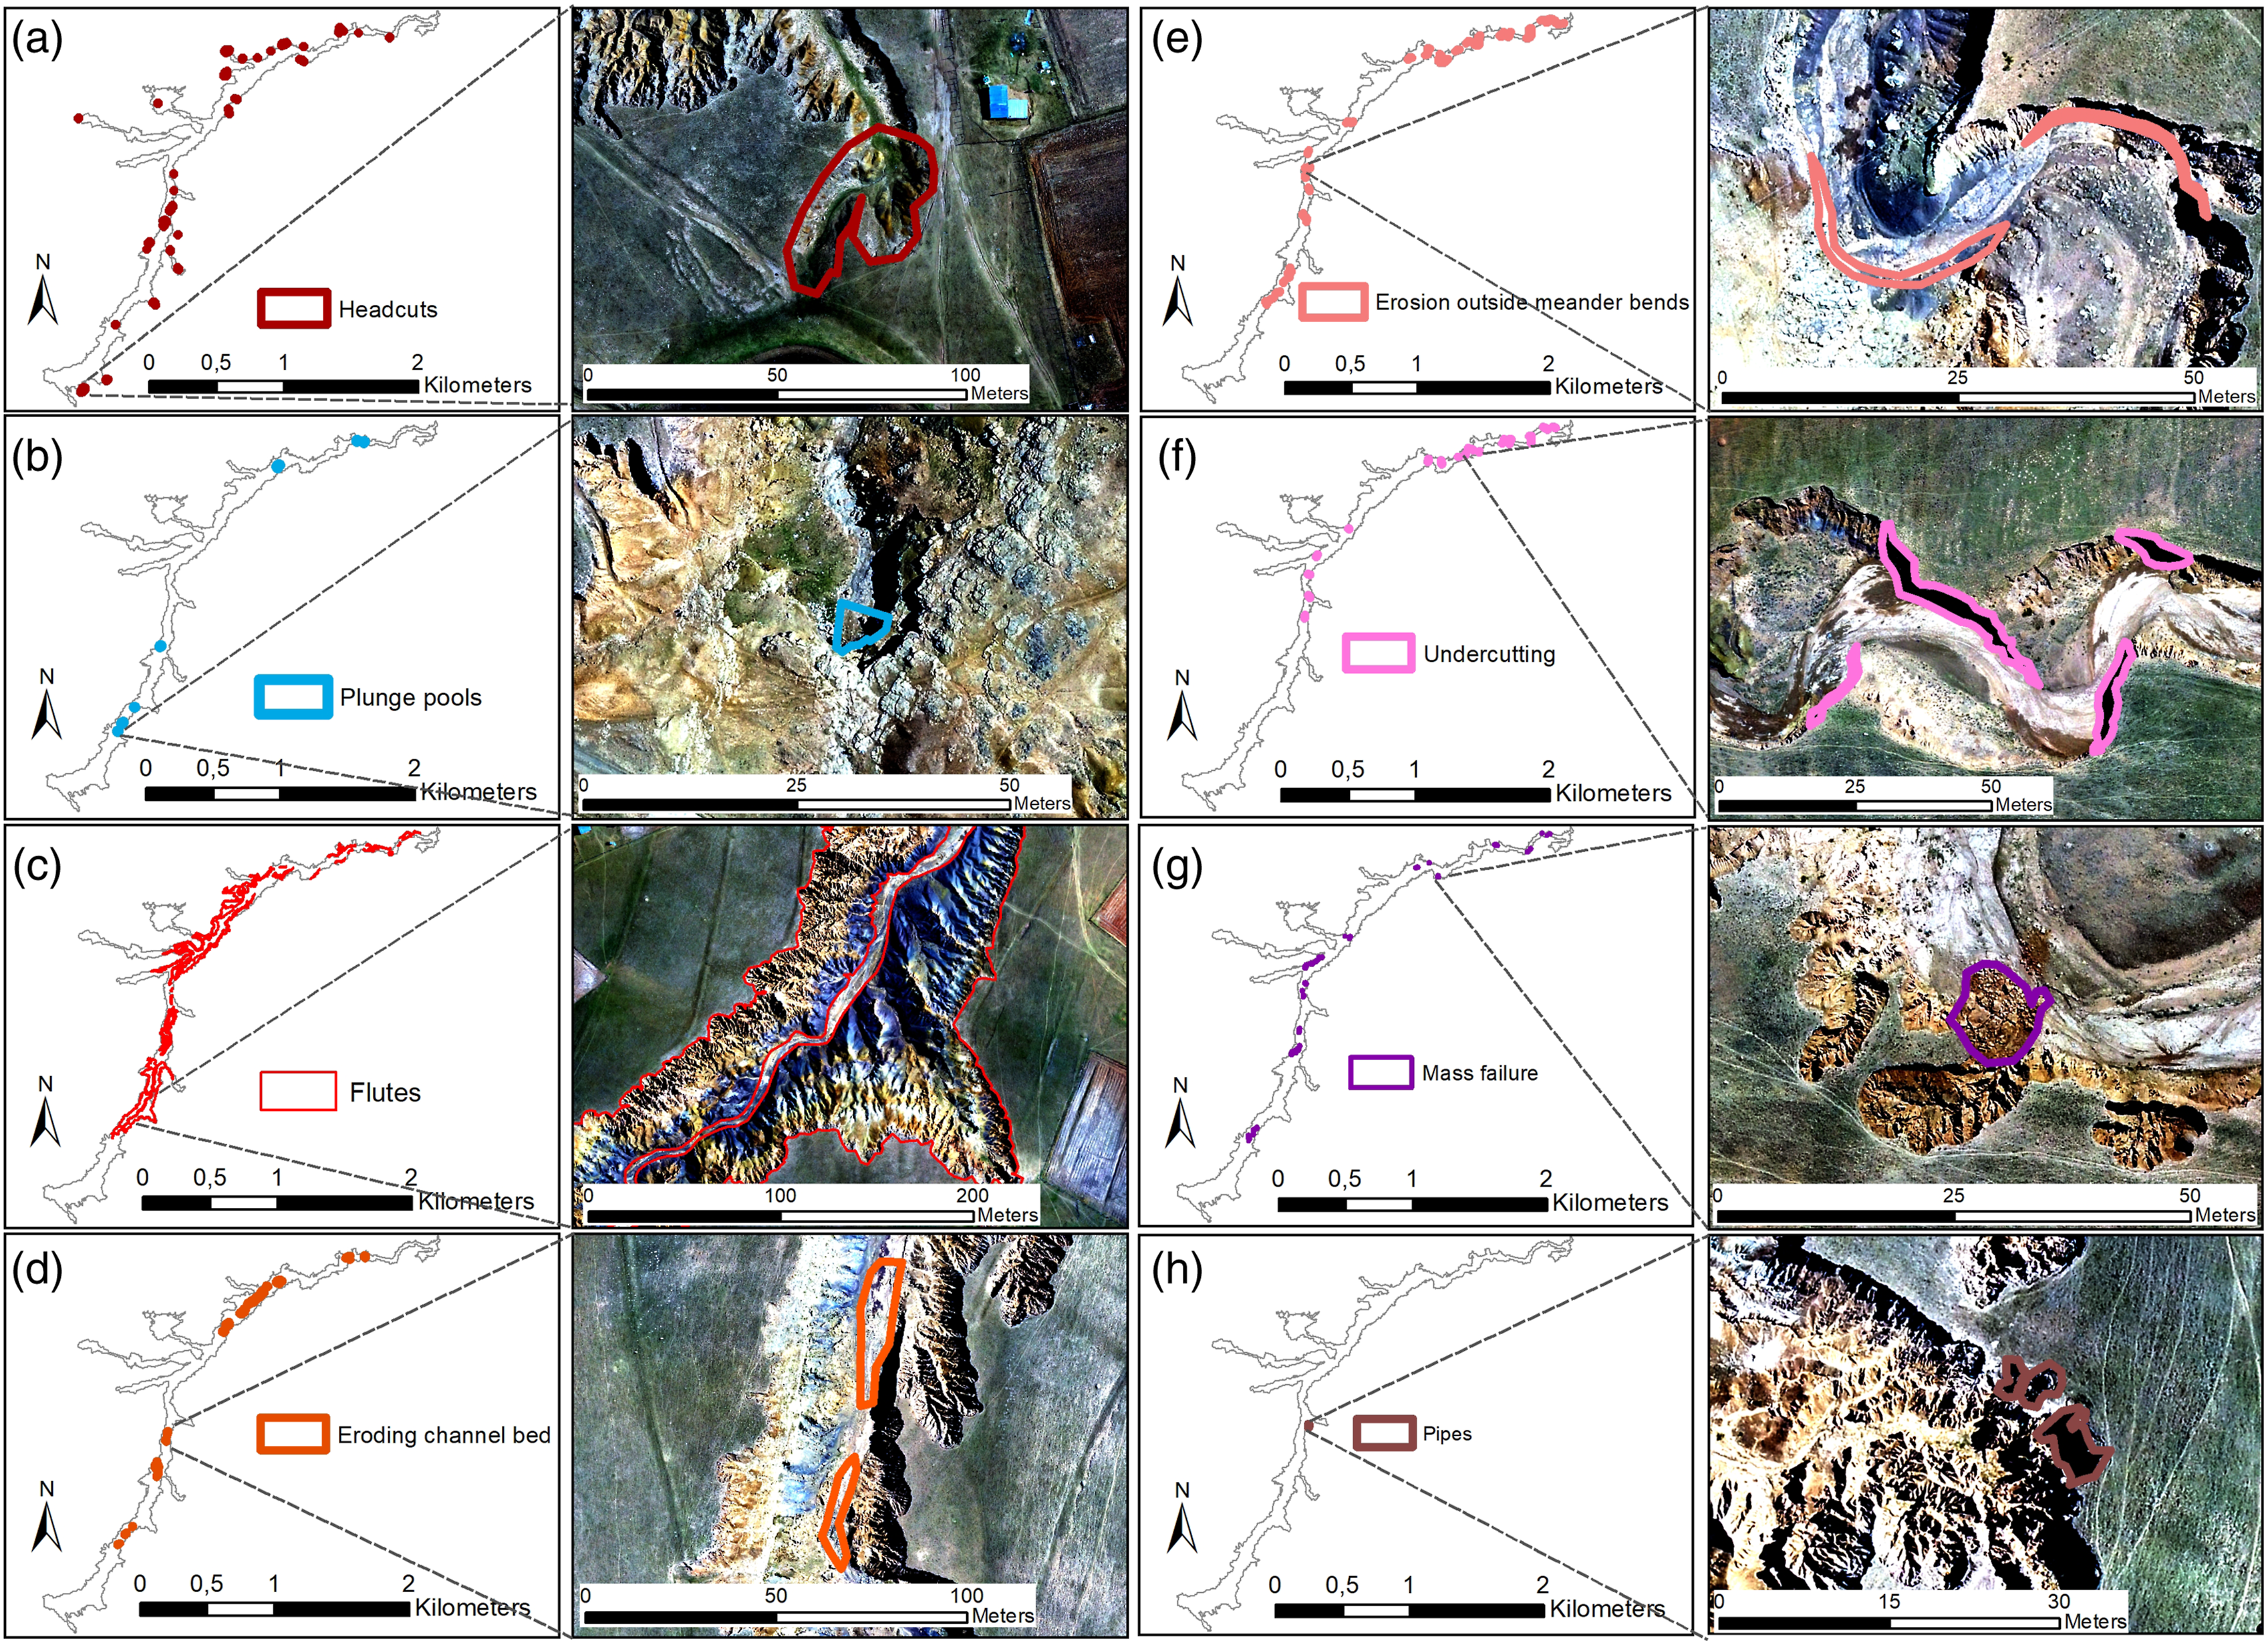
Figure 7 illustrates the locations and extent of different depositional features including (A) depositional bars, (B) vegetated areas and (C) deposition inside meander bends. From the depositional features mapped, the most prominent are vegetated areas (29,755 m2), followed by depositional bars without vegetation in the channel bed (19,811 m2). Deposition inside meander bends are least abundant (1765 m2). Although the gully network is complex, the orthomosaic, DSM, channel profiles and field observations made it possible to identify certain depositional patterns from head to toe, further described in the Discussion Section. The locations and extent of different depositional features including: (a) depositional bars, (b) vegetated areas and (c) deposition inside meander bends. Each map includes an orthomosaic subset.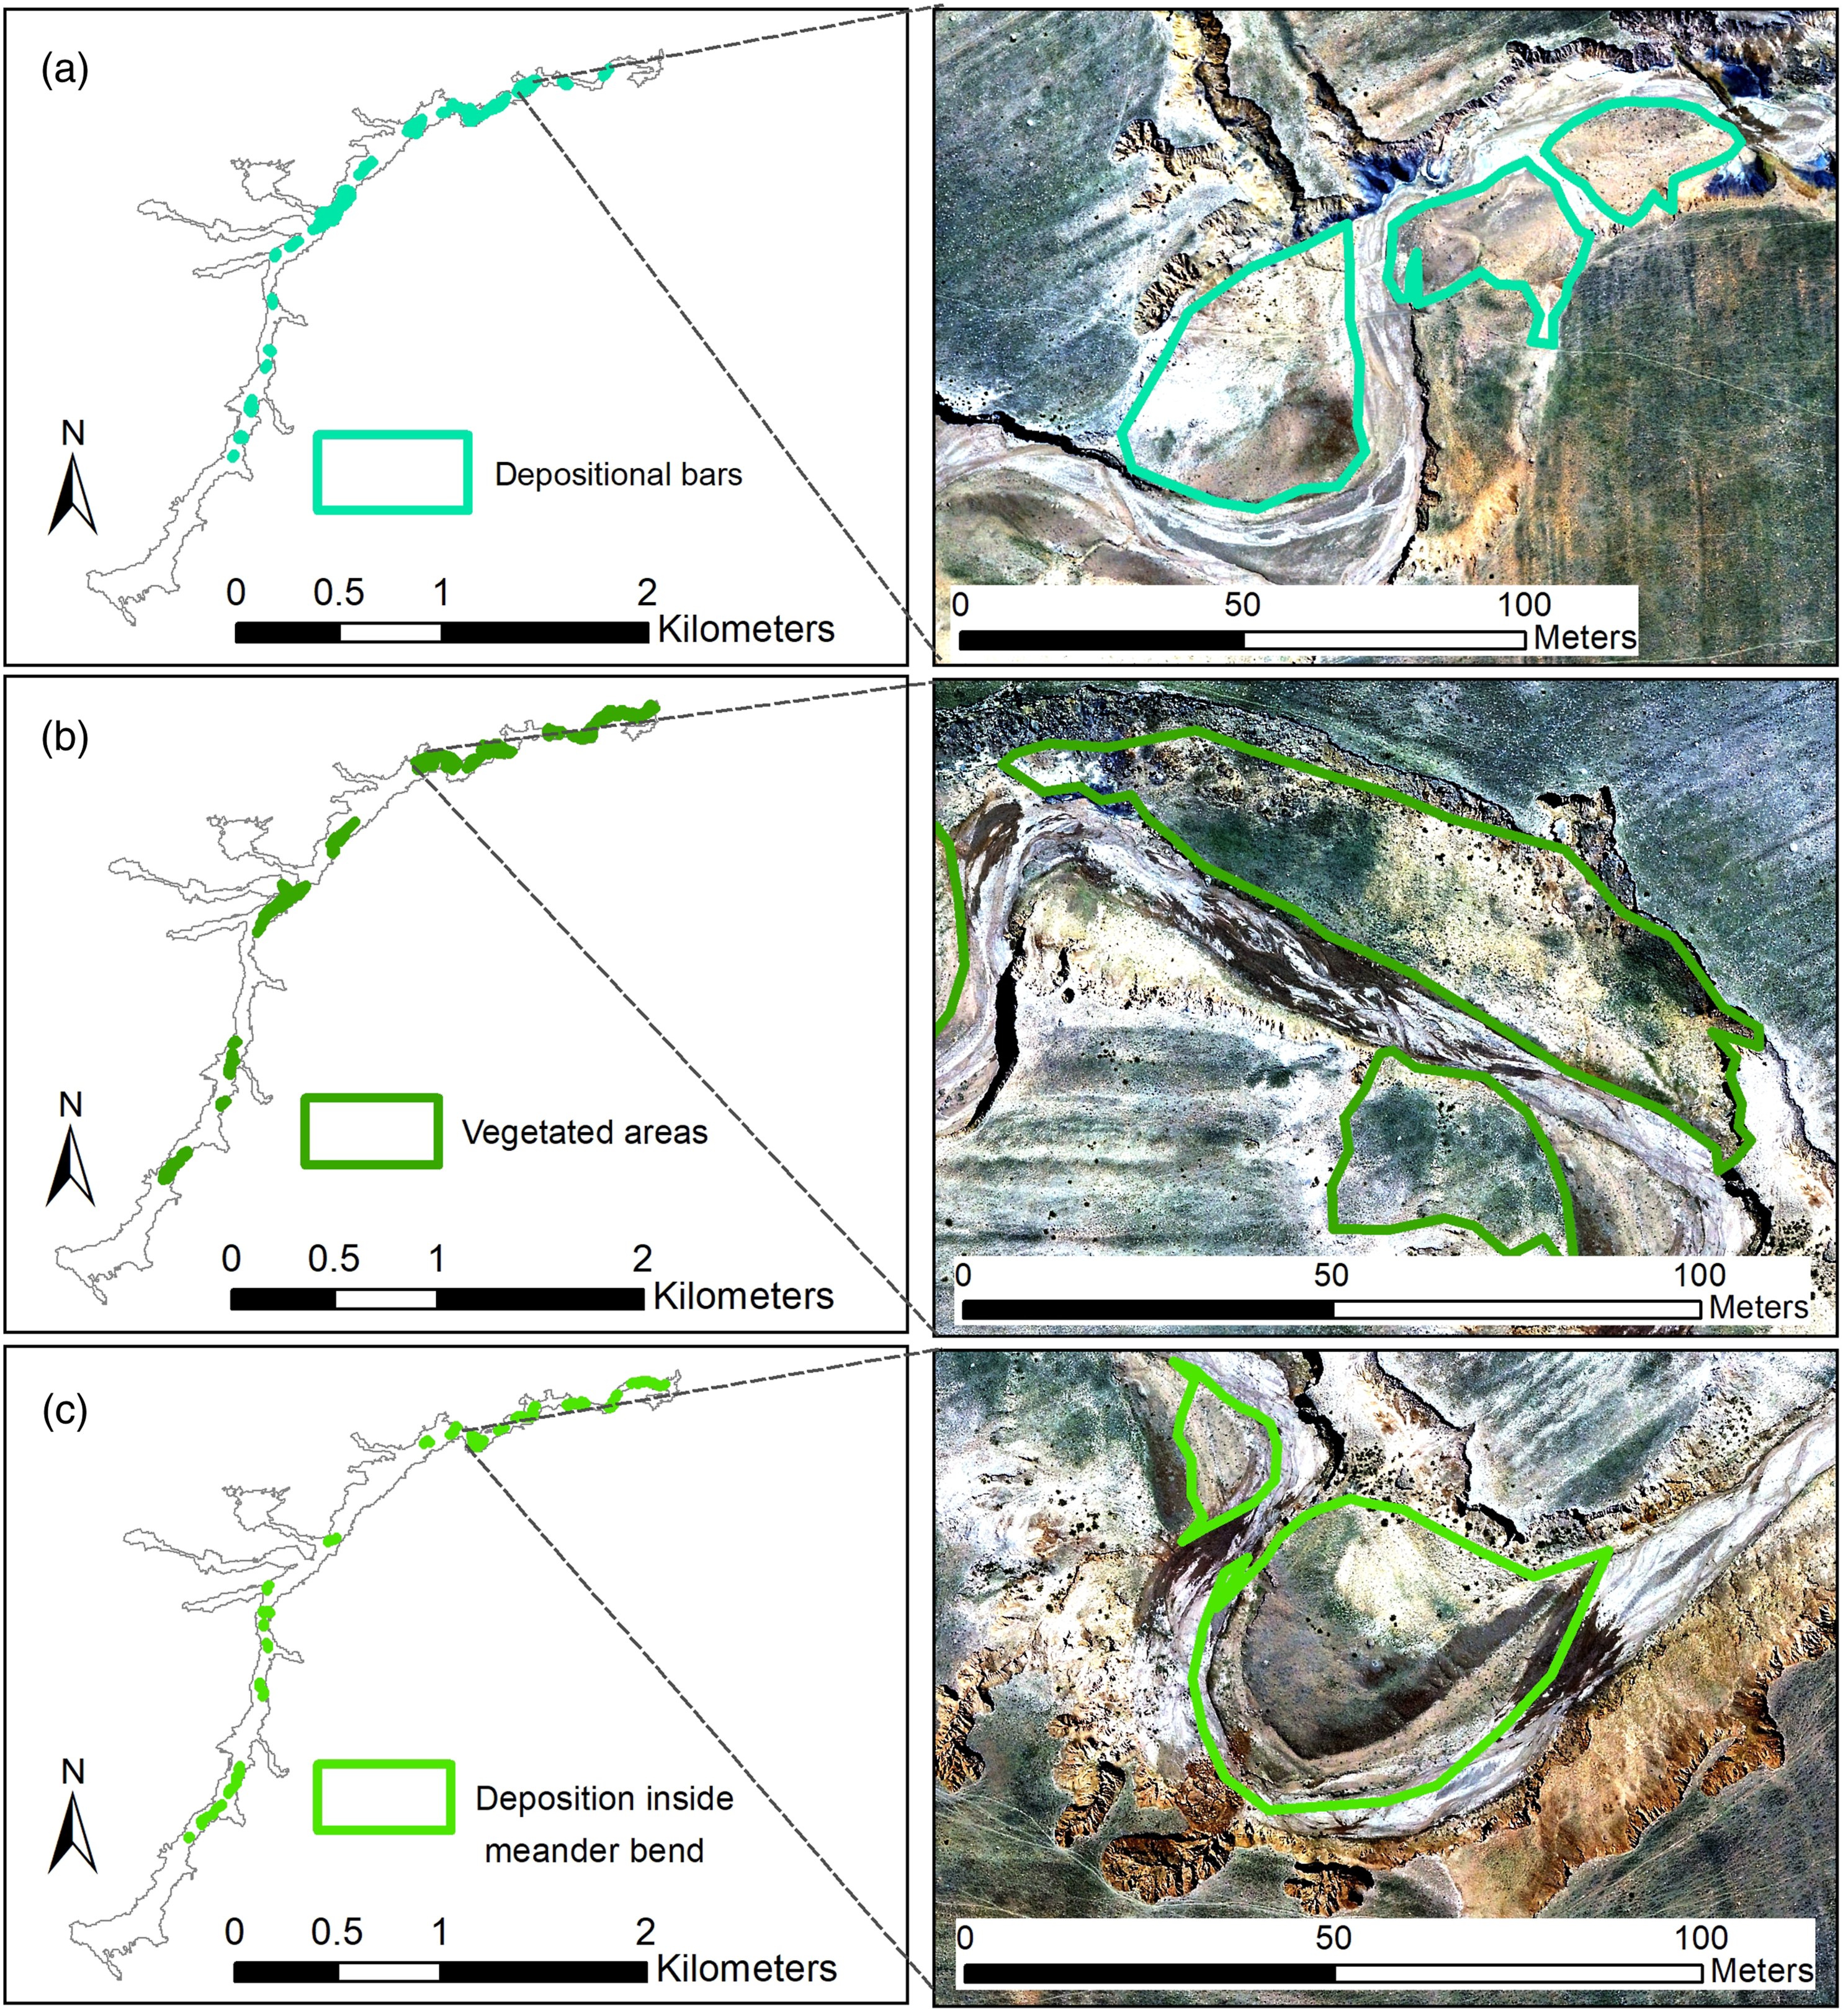
Discussion
Erosional and depositional patterns
Geomorphological interpretation was challenging since the morphology of the gully network is complex. Field observations and orthomosaic imagery both suggest that channel morphology and the spatial distribution of different erosional and depositional features are determined by runoff variations. It is postulated that the top section and side-branches of (1) the Extension Zone are mostly influenced by relatively shallow runoff that carve flutes on sidewalls, as well as headcuts with plunge pools where new side-branches develop and extend perpendicular to the main channel. Runoff along the gully thalweg is relatively low in volume in the upper section and side-branches of the Extension Zone until reaching the main channel where runoff reaches higher volumes. The steep narrow bed of the V-shaped channel drives further incision along a straight channel and largely prevents deposition. Channel bed incision intensifies at locally steepened knickpoints within the main channel where renewed channel bed incision occurs into the soft mudstones directly downslope the more resistant strata (see Figure 8(a)). Resistant bedrock strata such as a dolerite dyke or sandstone bench provide more resistance to erosion compared to mudstones, resulting in slope lowering along sections of mudstone. Abrupt channel bed incision at these knickpoints creates plunge pools due to vertical hydraulic erosion. Plunge pools within the main channel therefore exhibit structural control. Similar to most gully networks in this region, the channel deepens until resistant bedrock is reached and thereafter continues to expand sideways (Le Roux, 2018). Example of: (a) knickpoint where renewed channel bed incision occurs into soft mudstones directly downslope of more resistant dolerite dyke; (b) undercutting on the outside of meander bend; (c) mass failure of sidewall (following undercutting); (d) soil pipe that partially collapsed; (e) sediment deposition with vegetation on the inside of a meander bend.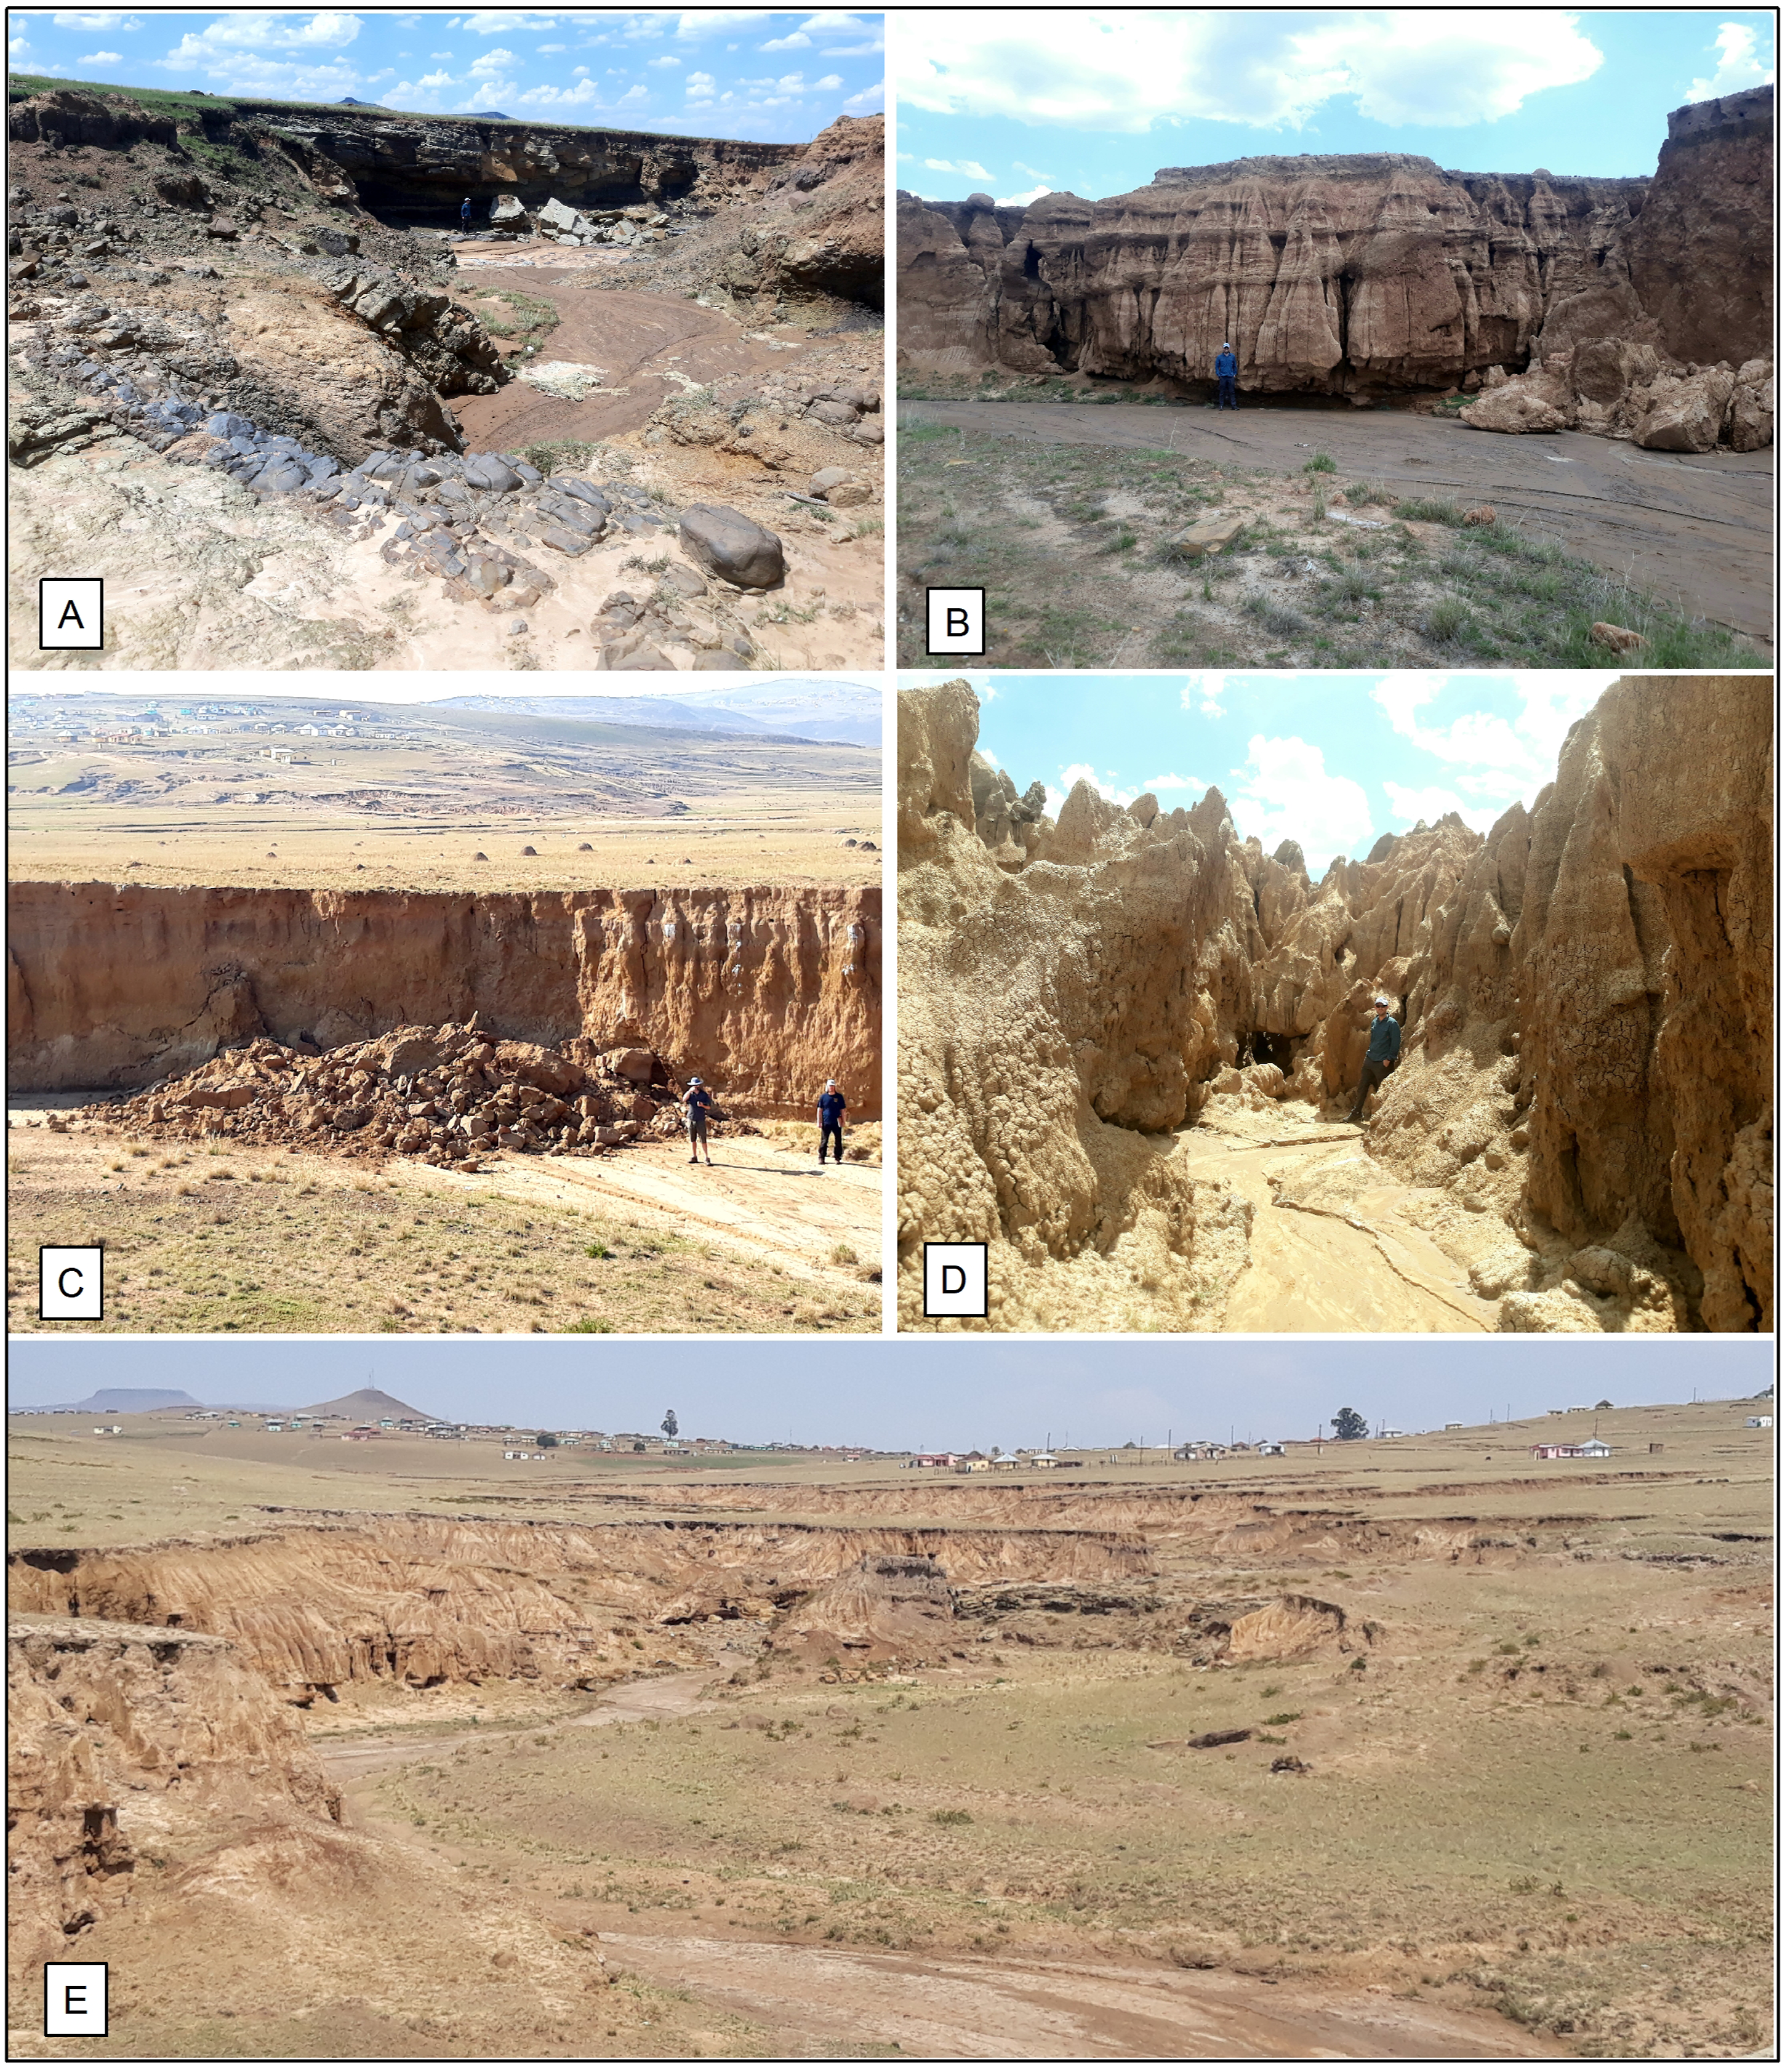
Further downslope in the (2) Expansion Zone, it is postulated that the main channel is influenced by larger runoff volumes and a lower gradient channel that cause the channel to erode laterally (up to 233 m) resulting in a U-shape. Regenerative channel bed erosion occurs at the knickpoints mentioned above, where barriers or walls of resistant dolerite intrude the soft mudstones. High velocity runoff also causes significant undercutting on the outside of meander bends (see Figure 8(b)) and mass failure of sidewalls (see Figure 8(c)). Mass failure features are of relatively minor importance in the Extension Zone but become increasingly important in the Expansion Zone where the channel starts to meander. Mass failure also occurs due to soil pipes when the roof of the pipe collapses (Bernatek-Jakiel and Poesen, 2018) (see Figure 8(d)). Field observations suggest that soil pipes perpendicular to the main channel cause new headcuts to develop along the main channel. These headcuts retreat perpendicular to the main channel causing side-branches to develop. Soils from mudstone formations are typically associated with duplex soils that are prone to piping (Beckedahl and De Villiers, 2000; Parwada and Van Tol, 2017). Duplex soils have a marked increase in clay content from the topsoil to subsoil and have an abrupt transition with respect to texture, structure and consistence (Van Zijl et al., 2014). These soils limit intrinsic permeability since water does not move readily into the subsurface matrix, which leads to increased subsurface flow causing soil pipes (Beckedahl and De Villiers, 2000). In addition, the subsurface matrix of duplex soils is dispersive as a result of high sodium absorption (Du Plessis et al., 2020). Due to the dispersive nature of these soils, they easily lose aggregation and are transported mainly as fine suspended load that is generally not deposited along the channel (Le Roux, 2018). However, the U-shape part of the channel also consists of depositional features, including depositional bars and vegetated areas. Deposition occurs primarily inside meander bends (see Figure 8(e)) where the channel is wide and has a low gradient. However, it is postulated that most depositional features are only temporary depositional areas that are remobilised during high rainfall/runoff events.
The main channel starts to meander more significantly in the (3) Deposition and Transfer Zone where the channel obtains a trapezoidal shape. Although runoff causes undercutting on the outside of meander bends and mass failure of sidewalls, more deposition occurs in this zone than in zones 1 and 2. Deposition occurs because the channel gradient is low and the channel bed is wide (flows with low shear stress) causing it to be overwhelmed by sediment being delivered from erosional features. Although it is postulated that depositional areas are temporary stores of newly generated sediment that pulse through the channel during rainfall/runoff events, some aggradational zones are relatively stable with fairly well established vegetation that accumulates sediment, especially inside meander bends. According to Betts et al. (2003), large gully networks in which mass movement processes are important, contain aggradational zones in their channels that continually accumulates excess sediment and stabilises due to pioneering vegetation.
Comparison with other studies
According to our knowledge the studied gully network is the largest researched in South Africa and potentially the world, to date. Vanmaercke et al. (2016) reviewed 933 gully dimensions in over 70 regions worldwide. Vanmaercke et al. (2016) reports a large variability: gully surface areas range between 0.11 and 816 m2 (mean: 20.8 m2), widths range between 0.4 and 104 m (mean: 9 m) and depths vary between 0.2 and 35 m (mean: 2.1 m). Although the studied gully’s maximum depth is less than half the maximum depth mentioned above, its maximum width is more than double the maximum reported by Vanmaercke et al. (2016). In terms of surface area, it is more than 650 times larger than the largest gully (816 m2) documented by Vanmaercke et al. (2016). Notably, this gully network is more than 400 times larger compared to the largest gully (1238 m2) listed in a survey across England and Wales (Glendell et al., 2017) and is approximately 2.5 times larger than the largest gullies (∼200,000 m2) on the North Island of New Zealand, referred to as ‘badass’ fluvio-mass-movement gully systems (Fuller et al., 2020; Marden et al., 2018). The volume of the studied gully network is more than 3 times greater than the largest or voluminous (1,469,805 m3) mega-gully assessed by Imwangana et al. (2015) in Kinshasa, Congo.
Another important comparison is the topographical conditions of the network, expressed by local slope gradient and drainage area (Poesen, 2018). Several studies have indicated that slope and drainage area control the initiation and position of gully heads in a landscape (e.g. Bergonse and Reis, 2016; Gudino-Elizondo et al., 2018; Hayas et al., 2019). Gully development largely depends on large drainage areas since gullies are favoured along drainage paths where runoff accumulates (Torri and Poesen, 2014). Poesen et al. (2003) states that the critical drainage area needed for gully initiation usually increases as slope decreases and vice versa. Development of our large gully network on a level slope (average gradient of less than 2%) and small drainage area (approximately 5.4 km2) is therefore quite surprising. The area currently draining into the main gully headcut is approximately 200 m2. This value is 5 orders of magnitude smaller than the maximum (100 km2) reported by Vanmaercke et al. (2016). However, it is postulated that our initial gully headcut originated further downslope and advanced upslope to its present location near the top of the catchment divide. Nachtergaele and Poesen (2002) state that advancing headcuts gradually reduce the drainage area. Nevertheless, even if the headcut originated at the lower end of its drainage area, the drainage area would still be 20 times smaller than the maximum (100 km2) reported by Vanmaercke et al. (2016). The reason is related to other factors described below.
Actual discharges draining a gully depend on factors such as land use, soil properties and rainfall characteristics (e.g. Gudino-Elizondo et al., 2018; Hayas et al., 2019; Moeyersons et al., 2015). Torri and Poesen (2014) analysed 63 slope-drainage area relationships for headcuts in various parts of the world, and found clear land use effects, for example, land use types such as natural forests provide resistance to gully development whereas croplands less. Castillo and Gómez (2016) reviewed the impact of key factors on the complexity of gully erosion responses, confirming that gully erosion occurs where unsustainable human practices operate in erosion-prone conditions such as erodible soils. Given the small drainage area of the studied gully network, a combination of overgrazing and erodible soils are key factors in its development (Le Roux and Sumner, 2012). As mentioned above, soils derived from mudstones in the catchment are associated with duplex and dispersive soils that are susceptible to soil pipe development (Beckedahl and De Villiers, 2000; Parwada and Van Tol, 2017). In the studied gully network, soil pipe collapse causes new headcuts to develop along the main gully channel, followed by headcut retreat and side-branch development perpendicular to the main channel.
Limitations and implications of the results
Although soil pipes are one of the main causes of gully development in the area (Beckedahl and De Villiers, 2000), the extent of these features remains uncertain due to being unnoticeable on UAV imagery (unless the pipe roof collapsed) (Ferrer et al., 2017). Another limitation is the orthomosaic and DSM only provide a single snapshot of the gully network in time. Despite these limitations, it was possible to determine the dimensions of the gully network and map the extent of current erosional features (where sediment is generated) and depositional features (where sediment is deposited).
Restoring these large gullies to pre-erosion conditions is unrealistic, but the rate of expansion and sediment transfer can be reduced. Remediation of large gully networks relies on an understanding of the extent of both the erosional and depositional features within channels (Poesen, 2018). Actively eroding features are synonymous with areas of high runoff connectivity, whereas depositional features have the potential to reduce connectivity and retain water and sediment along gully channels (Taylor et al., 2018). Gully expansion could, therefore, be minimised with site-specific construction of structures at actively eroding areas such as headcuts in the (1) Extension and (2) Expansion zones. Another suggestion is to limit headcuts from retreating upslope, especially to prevent the (perpendicular) retreat of side-branches in zones 1 and 2. These findings indicate that conventional mitigation strategies such as check dams should be avoided in this case since they are not only costly, but could silt up rapidly, rendering them inefficient as sediment traps in the long-term (Le Roux and Van der Waal, 2020). Furthermore, due to the dispersive nature of the soils, structures that would enhance subsurface accumulation of water may cause erosion around constructed walls (Parwada and Van Tol, 2016). Planting deep rooted vegetation along the edge of the gully can help to absorb the excess soil water and limit subsurface erosion.
Focusing on depositional features could have a higher recovery potential than erosional features. More specifically, in the (3) Deposition and Transfer Zone, the depositional features could be (further) stabilised with deep-rooted vegetation to enhance sediment accumulation. As sediment is deposited on the inside of a meander bend, the slope of the sidewall declines and stabilises with establishment of vegetation (Vanmaercke et al., 2016). As the gully sidewalls lower and become stabilised by vegetation, the gully eventually becomes completely decoupled (Fuller and Marden, 2008). Betts et al. (2003) advises that it is not prudent to revegetate within or near erosional features that experience high energy runoff and aggressive erosion (e.g. mass failure). Owing to the vast size and extreme conditions (high runoff and dispersive soils) of the network and thousands of other gully networks in the catchment, restoration strategies should target catchment scale revegetation and grazing management to reduce runoff accumulation that contributes to gully erosion processes (Frankl et al., 2021; Sandercock and Hooke, 2011).
Conclusion and recommendations
Restoration of large gully networks relies on an understanding of the extent of in-channel erosional and depositional features, which exerts a primary control on the erosion rate and transport of sediment (Grieve et al., 2016). However, few studies consider in-channel patterns of erosion and deposition within large systems (Imwangana et al., 2015; Marden et al., 2018). This study utilises a fixed-wing UAV and SfM photogrammetry to create a high resolution orthomosaic and DSM to determine the dimensions and extent of erosional and depositional features of a gully network in the Tsitsa River Catchment, South Africa. According to our knowledge, the gully network is the largest in the world (its surface area is approximately 0.5 million m2 and volume 5 million m3), more than twice as large compared to the largest gullies previously described in peer-reviewed literature (see Fuller et al., 2020). Formation of such a large gully in relation to the relatively small drainage area and gentle slope is very unusual. Although, soils derived from mudstones in the catchment are associated with duplex and dispersive soils that are highly susceptible to gully development (Du Plessis et al., 2020; Le Roux and Van der Waal, 2020).
Field observations and orthomosaic imagery both suggest that gully extension and expansion occur predominantly by means of headcut erosion (including pipe formation and subsequent roof collapse), sidewall erosion including flutes, erosion of outer meander bends, undercutting and mass failure. Similar to other studies (e.g. Bergonse and Reis, 2016; Betts et al., 2003; Castillo and Gómez, 2016; Poesen, 2018; Vanmaercke et al., 2016), mass failures of sidewalls are key sediment source areas, especially in the Expansion Zone where runoff reaches peak volumes. Mass failures occur in response to undercutting at the base, but also due to soil pipes when the roof of a tunnel collapse. Soil pipes cause new headcuts to develop along the main drainage lines feeding into the gully, followed by headcut retreat and side-branch development perpendicular to the main channel. Large gully complexes in which mass failure is important also contain aggradational zones in their channels that continually accumulate excess sediment (Betts et al., 2003). Deposition occurs (especially inside meander bends with low flow velocities) when the channel is overwhelmed by sediment from mass failures (from the outside of meander bends). Although it is postulated that most depositional areas are temporary stores of newly generated sediment that pulse through the channel during high rainfall/runoff events, some aggradational zones in the studied gully network are relatively stable zones that accumulate excess sediment. Restoration strategies should be targeted at these more stable zones to enhance channel decoupling (Fuller and Marden, 2008).
Recommendations for future research include sequential aerial surveys of the gullies with UAVs to illustrate changes over time (e.g. Eltner et al., 2015; Ferrer et al., 2017), including assessment of the quantities of gully-derived sediment and sediment migration at a certain time-step, for example, seasonal or annual. According to Poesen (2018), the relative contribution from different gully processes such as headcut retreat, sidewall collapse and channel bed incision are required. Furthermore, Fuller and Marden (2008) demonstrates a need to investigate gully cut and fill processes to understand the complex behaviour within large gully systems. Poesen (2018) states that soil pipes deserve more research attention to improve predictions of the hydrological and erosional response of gully-affected areas; making the studied gully network a prime study site for further research. Features that are usually undetected from aerial surveys, such as undercutting and soil pipes, can be quantified more closely by means of image-based modelling from photographs taken in the field (Frankl et al., 2015; Gómez-Gutiérrez et al., 2014), or by means of LiDAR and SfM photogrammetry (Ferrer et al., 2017). Lastly, it is recommended to assess the effect of rainfall characteristics on gully development in the catchment (see e.g. Hayas et al., 2017; Moeyersons et al., 2015) since Vanmaercke et al. (2016) suggest that gully erosion worldwide will increase in the following decades due to climate change and associated increases in rainfall intensities.
Footnotes
Acknowledgments
Sincere thanks to Andreas Kaiser at the Regional Council for Climate Change, Energy and Sustainable Development, Siegen-Wittgenstein, as well as Michael Geissler at Friedrich Schiller University Jena for technical assistance with UAV technology. Special thanks to Ms Nosiseko Mtati at Rhodes University who liaised with the local authorities for permission to do fieldwork on their land.
Declaration of conflicting interests
The author(s) declared no potential conflicts of interest with respect to the research, authorship, and/or publication of this article.
Funding
The author(s) disclosed receipt of the following financial support for the research, authorship, and/or publication of this article: This study is supported by National Research Foundation South Africa (126382) and South African Department of Forestry, Fisheries and the Environment - Natural Resource Management.