
Abstract
Rivers exhibit a wide variety of channel patterns, and predicting changes in channel pattern is important in order to foresee river responses to climate change and river restoration. Many discriminators have been developed to define approximate boundary conditions for different channel patterns, based on channel-pattern-controlling parameters such as discharge and valley gradient. However, presently available discriminators have two main shortcomings. First, they perform poorly for rivers with cohesive, relatively erosion-resistant banks. For this subset, discriminators tend to indicate an actively meandering channel pattern, whereas the river morphology and dynamics show that many of these rivers should be classified as laterally stable. Second, channel pattern discriminators are often used to predict channel patterns, which is only valid when parameters are used that are independent of actual channel pattern. This condition is often not met, as many discriminators use the channel slope or width–depth ratio of the channel as input. To resolve both shortcomings, we first propose an additional class of rivers with scroll bars and tortuous channel patterns, which have an inhibited mobility due to their self-formed cohesive deposits. Second, we compare frequently used empirical and mechanistic channel pattern discriminators, taking into account the success in predicting channel pattern and the independence of causal factors used. Thirdly, we present a novel channel pattern discriminator and predictor that includes the effect of a cohesive floodplain, using the average silt-plus-clay fraction of the river banks as proxy. We show that this new predictor outperforms previously used empirical and mechanistic approaches, and successfully predicts channel pattern for 87% of the rivers from a dataset of 70. This new predictor is widely applicable, as it is relatively simple and based on easily obtainable, and mostly independent, parameters.
Keywords
I Introduction
1.1 River channel patterns
Rivers are principal geomorphic agents shaping the Earth’s surface (Black et al., 2017; Osborn and du Toit, 1991; Petts and Foster, 1985), and worldwide exhibit a wide range of channel patterns, such as braided and meandering (Church, 2002; Leopold and Wolman, 1957) (Figure 1). Channel patterns are defined and classified by their morphometric characteristics, such as the spatial arrangement of channels, bars and the floodplain within the landscape (Kleinhans, 2010; Makaske, 2001; Nanson and Croke, 1992; Twidale, 2004).
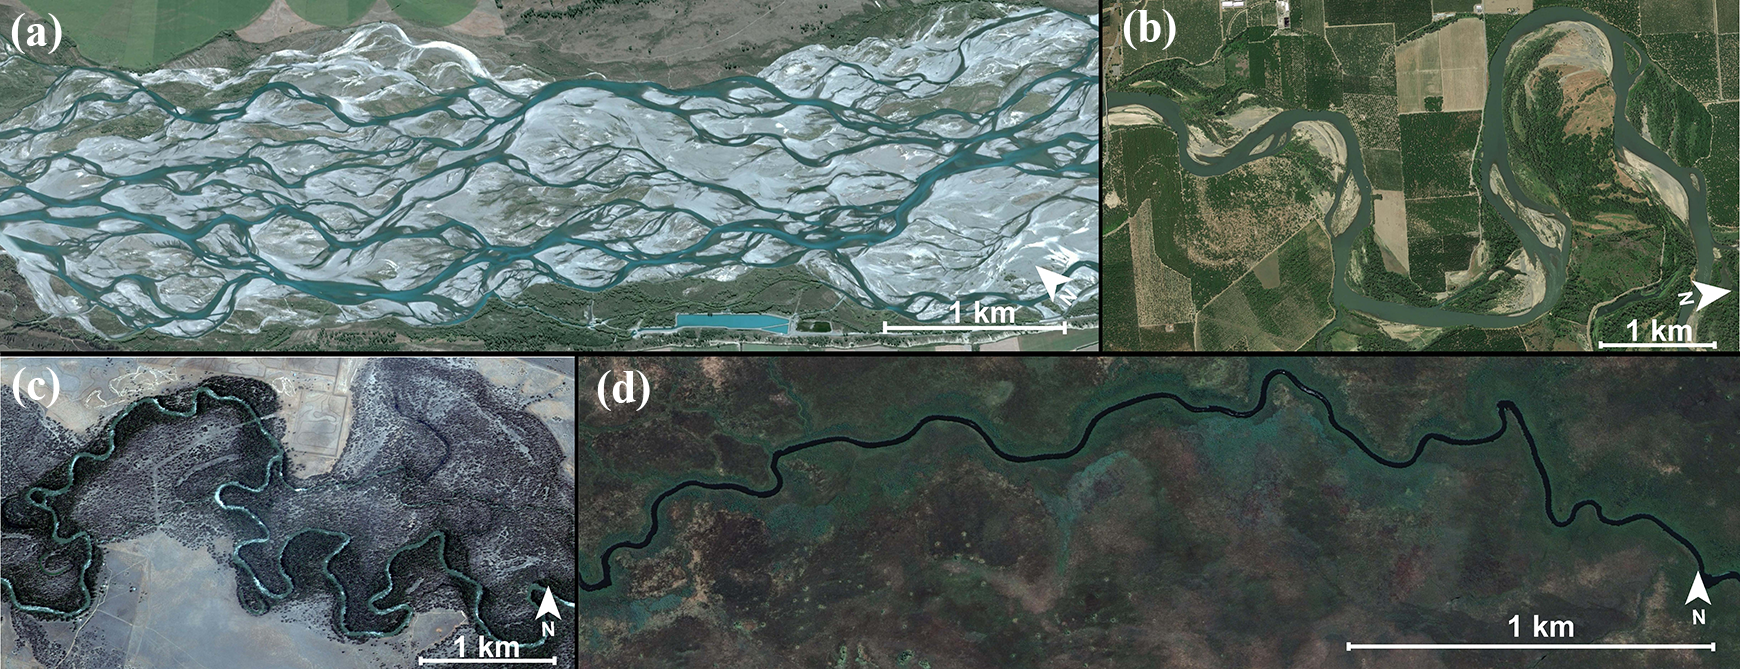
Typical examples of different river channel patterns. (a) A braided river pattern of the Rakaia River in New Zealand (43°39’13.73”S 171°51’29.32”E). (b) A meandering river pattern with chute bars of the Sacramento River in the USA (39°39’14.21”N 121°58’56.00”W). (c) A tortuous, self-constrained river pattern with scroll bars of the Murrumbidgee River in Australia (34°27’39.8”S 145°37’14.0”E). (d) A laterally stable river pattern of the Nqoga River in Botswana (19°05’11.8”S 22°39’58.9”E).
An improved understanding of channel patterns is vital for river restoration projects in which rivers are being restored from their channelized state to freely eroding rivers (Wohl et al., 2015). Often, rivers are restored into meandering rivers, even when the geomorphic conditions do not support this channel pattern (Kondolf, 2006). A better prediction of channel pattern is needed to align the river channel pattern with the geomorphic conditions, to enhance the sustainable management of rivers and to predict river response to allogenic forcing (Brierley and Fryirs, 2009). River channel patterns may change due to hydrological, sedimentological and vegetative changes associated with land use (e.g. urbanization or deforestation) and climate change, and associated changes of river mobility may have large consequences to surrounding habitation and infrastructure (Candel et al., 2018; Kondolf et al., 2002; Lewin and Macklin, 2010). Interpretation of the palaeo-environment from fluvial sedimentary archives also requires a thorough understanding of how channel patterns form (Lewin et al., 2005; Miall, 2014; Vandenberghe, 2002).
1.2 Channel pattern discriminators
Channel pattern discriminators discriminate channel patterns based on a variety of parameters (e.g. Chang, 1985; Eaton et al., 2010; Ferguson, 1987; Fredsøe, 1978; Kleinhans and Van den Berg, 2011; Lane, 1957; Leopold and Wolman, 1957; Parker, 1976; Van den Berg, 1995). Figures 2 and 3 show examples of these discriminators, while Section II provides further details for each. Here we define channel pattern discriminators as quantitative separators of zones in a diagram, where each zone represents the parameter space with the highest probability of existence of a particular channel pattern. The separators are based on one or more parameters. Discriminators may have a transitional character and do not form physical thresholds, meaning that channel patterns moving closer to the discriminator in the diagram (e.g. Figure 2) gradually change into the new channel pattern (Bledsoe and Watson, 2001; Ferguson, 1987; Kleinhans and Van den Berg, 2011; Van den Berg, 1995).
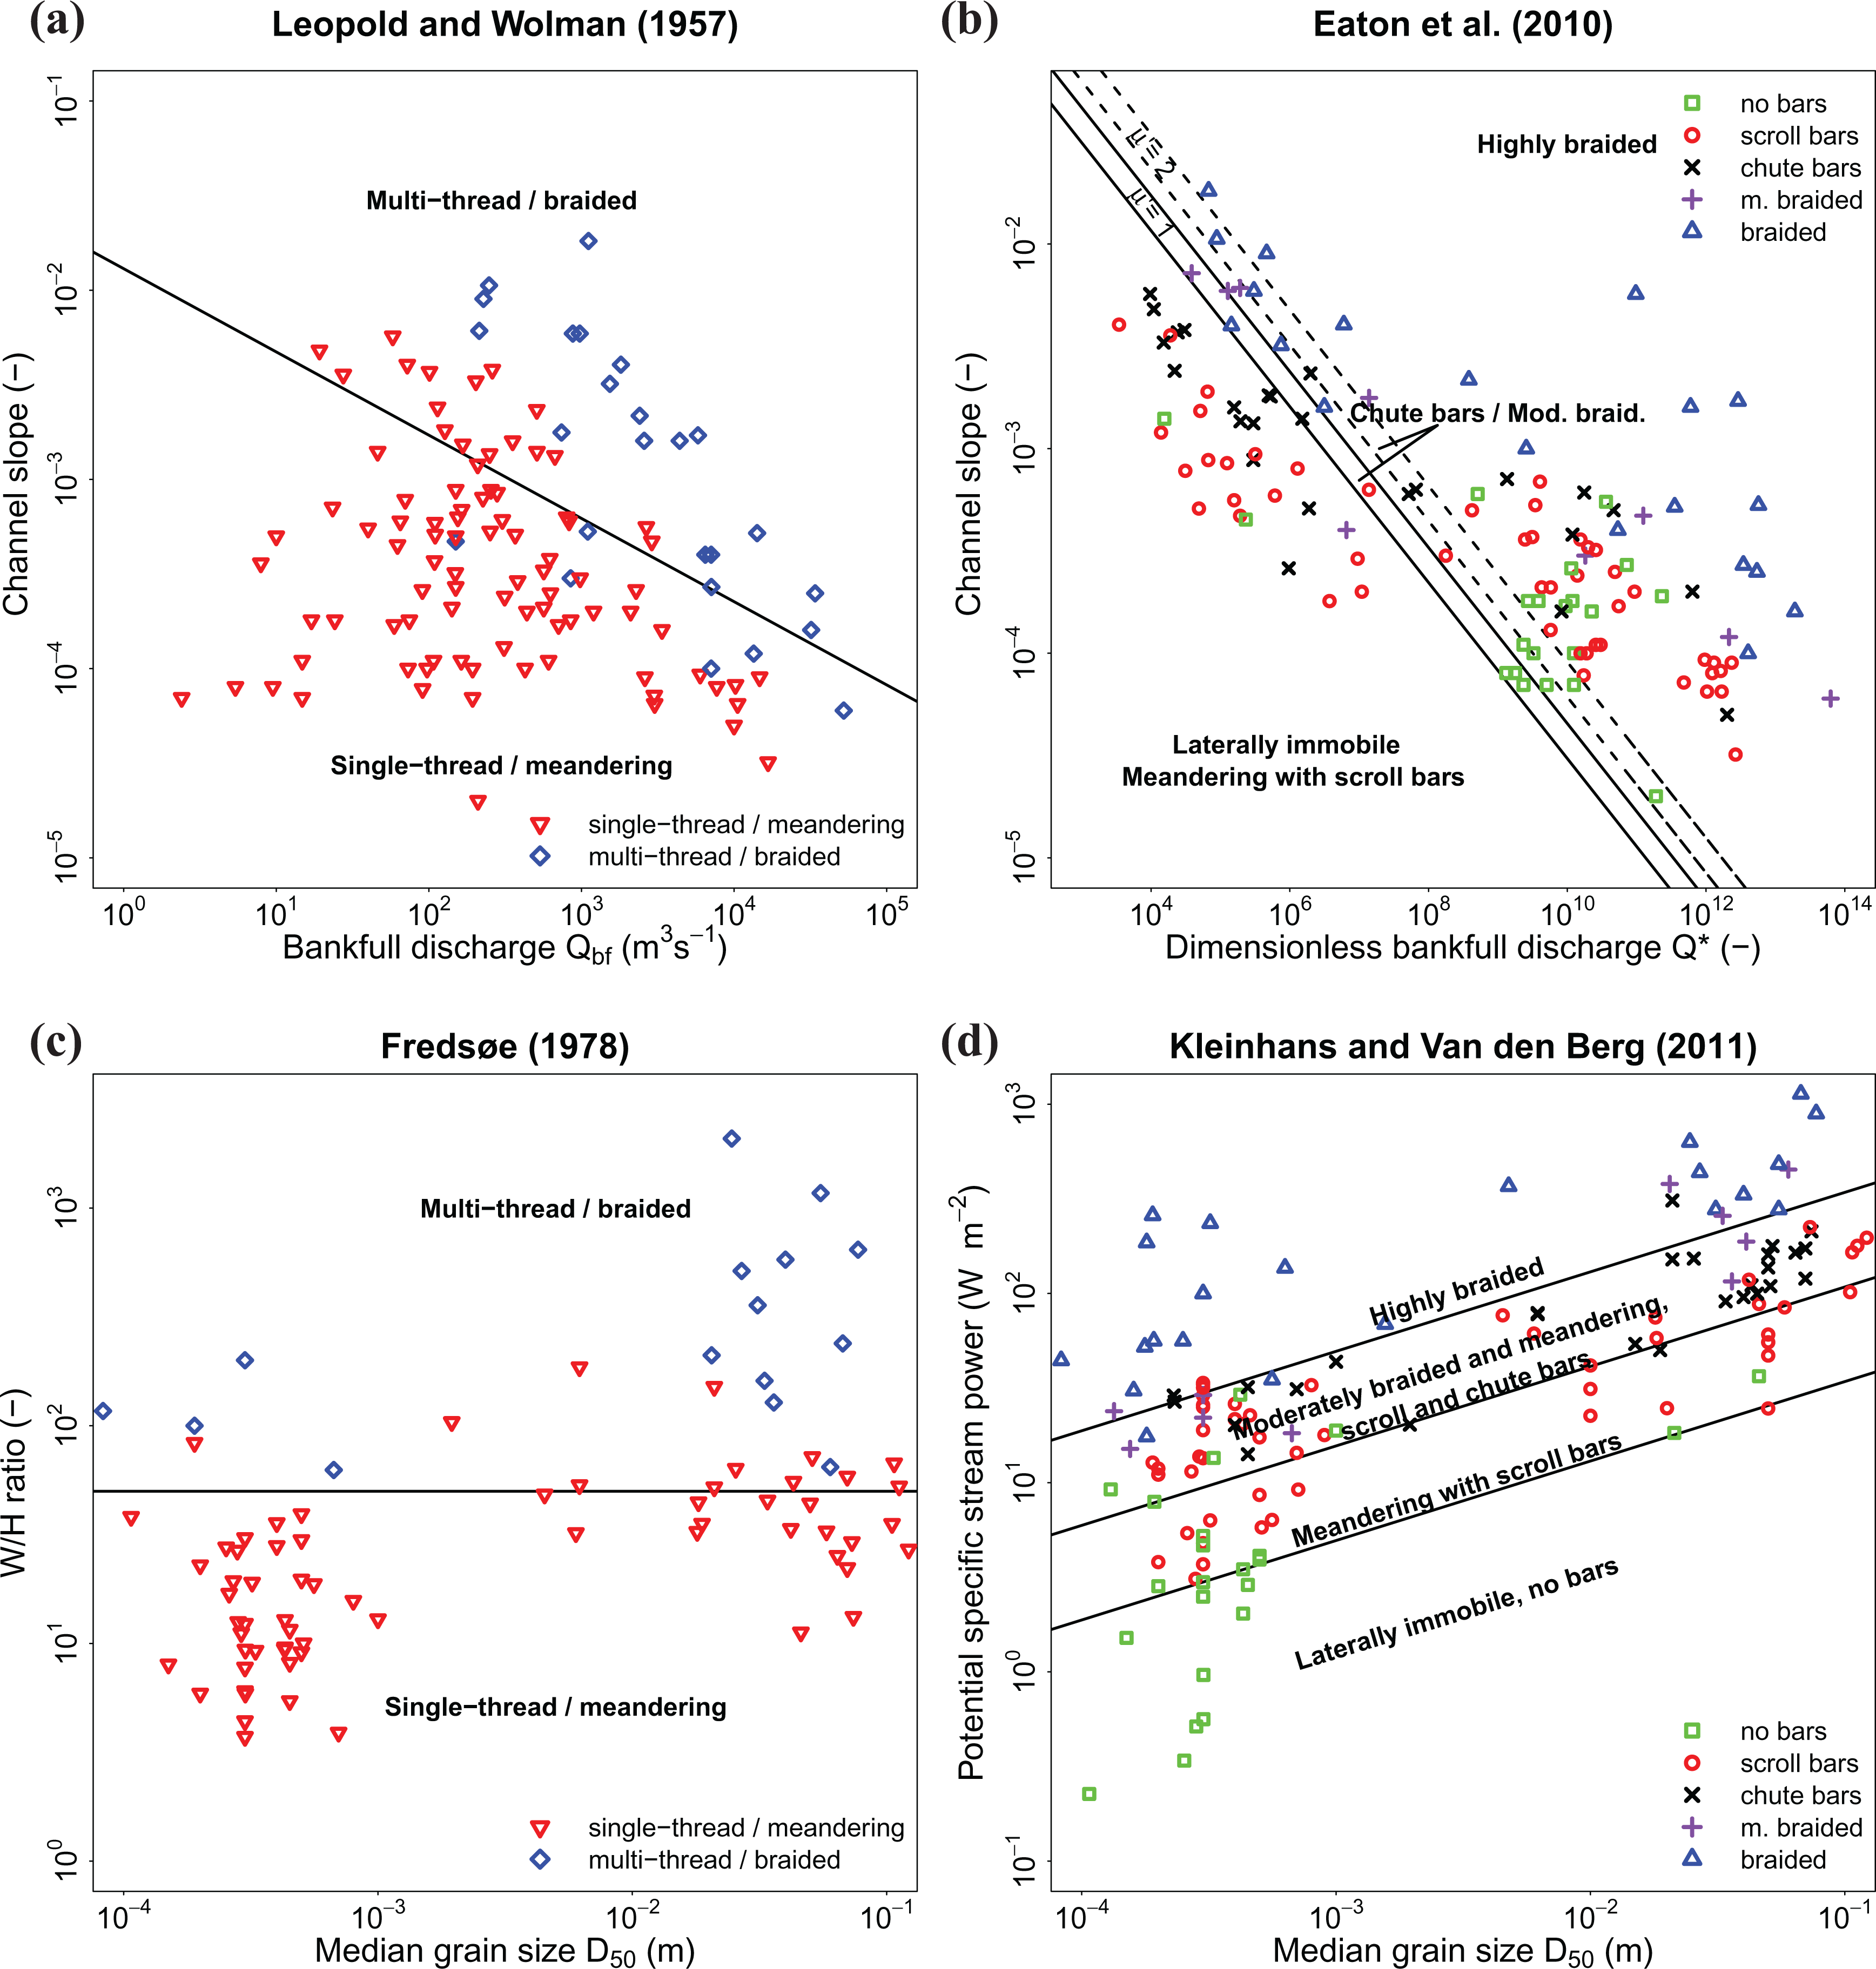
Empirical channel pattern discriminators (black lines) compared with the data of Kleinhans and Van den Berg (2011) (extended by Candel et al., 2020). Channel pattern prediction by (a) Leopold and Wolman (1957) (Equation (1)); (b) Eaton et al. (2010), the dashed lines indicate an example for when μ’ = 2, but we used μ’ = 1 (black lines) in relation to the data in Table 1 (Equation (2)); (c) Fredsøe (1978); (d) Kleinhans and Van den Berg (2011) (Equations (6)–(8)). Table 1 indicates the fraction of correctly classified rivers for each of the approaches.
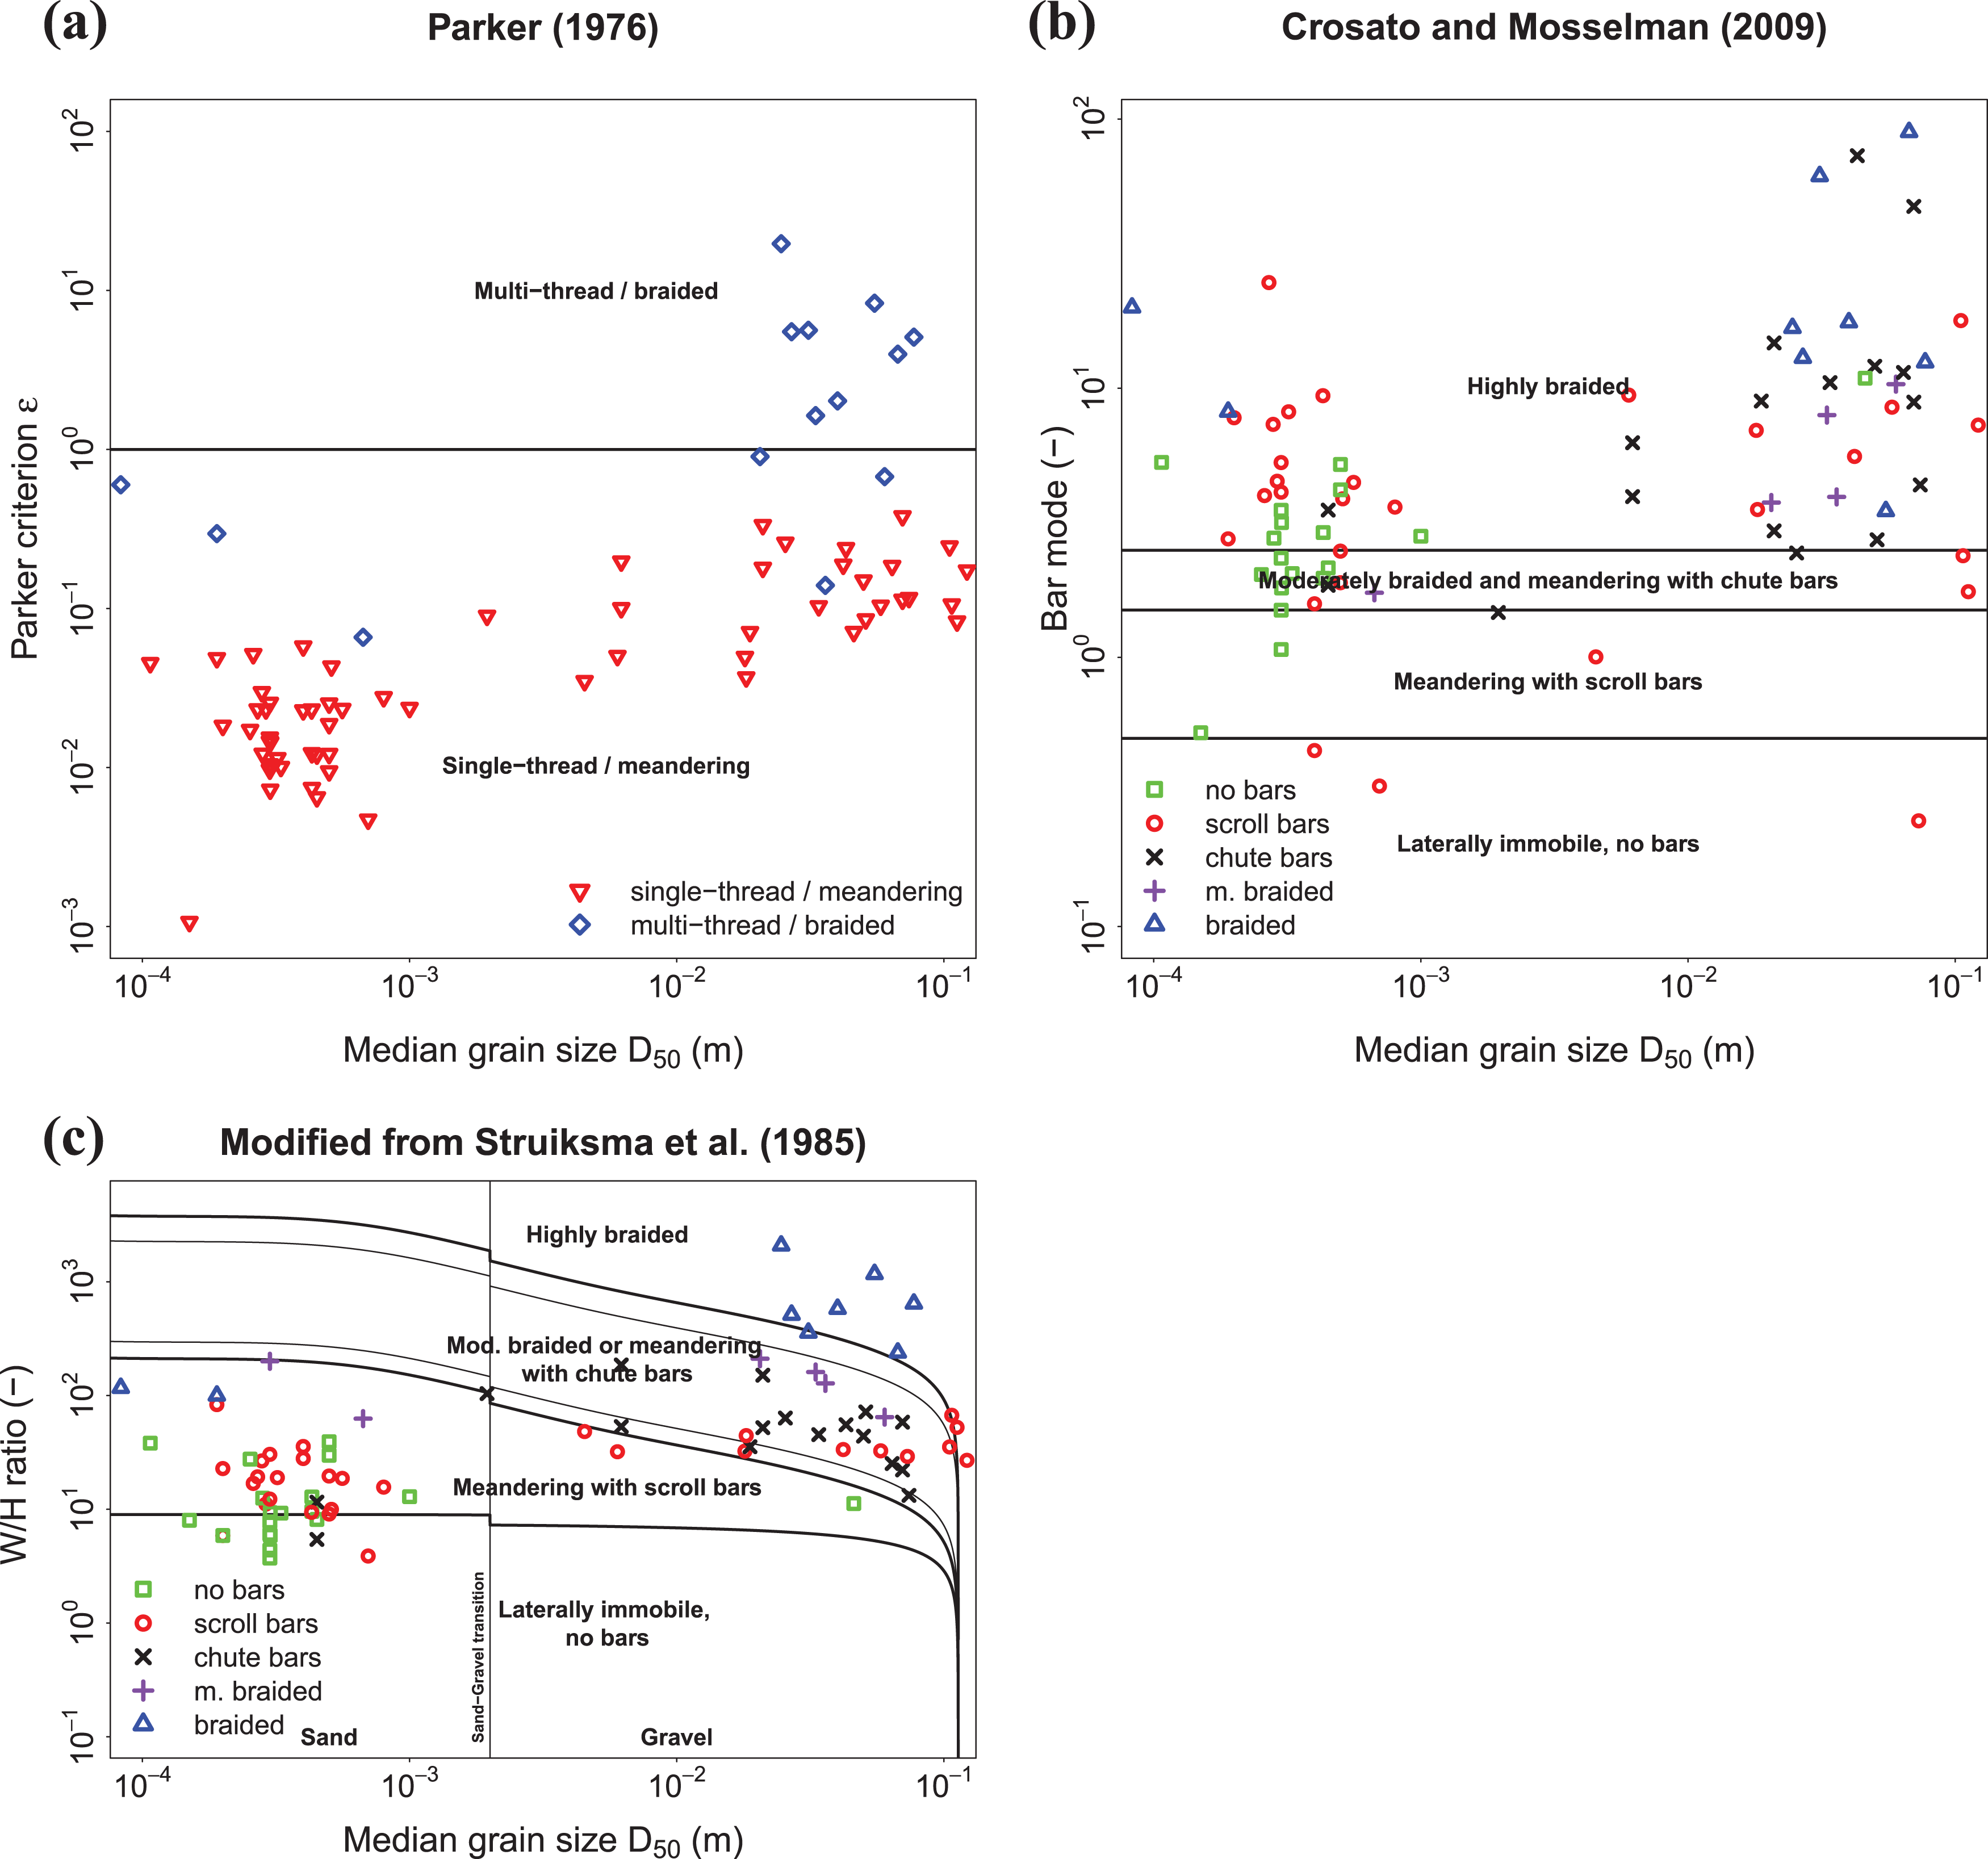
Mechanistic channel pattern discriminators (black lines) compared with the dataset of Kleinhans and Van den Berg (2011) (extended by Candel et al., 2020). Channel pattern prediction by (a) Parker (1976) (Equation (9)); (b) Crosato and Mosselman (2009) (Equation (10)); (c) our own derivation from the physical laws of Struiksma et al. (1985) (Equations (12) and (13)). The dashed line below the upper discriminator represents m = 3. The step at the gravel-sand transition is due to the different magnitude of the transverse slope effects assumed in Baar et al. (2018). The asymptote at the largest particle size is due to the threshold for motion. See Supplementary information for more details. Table 1 indicates the fraction of correctly classified rivers for all channel pattern discriminators shown here.
Most channel pattern discriminators are empirically based, but some mechanistic discriminators exist as well (e.g. Crosato and Mosselman, 2009; Kleinhans and Van den Berg, 2011; Parker, 1976; Seminara and Tubino, 1989). The advantage of such mechanistic discriminators is that they can give insight into the physical and biomorphological processes that determine river channel pattern, and they can be applied to any river. To be successful, they require sufficient quantitative understanding of key mechanisms that result in the different channel patterns. Although there is general consensus within the scientific community on which mechanisms affect the channel pattern, we are still far from quantitively incorporating these mechanisms into a mechanistic model (Baar et al., 2019; Kleinhans, 2010; Kleinhans et al., 2018; Parker et al., 2007; Tal and Paola, 2010). Hence, empirical discriminators are used more widely (e.g. Henshaw et al., 2020; Stecca et al., 2019), in spite of their black box nature (Kleinhans, 2010). Applicability of these empirical discriminators is also facilitated as they commonly require fewer parameters than mechanistic discriminators (Kleinhans and Van den Berg, 2011).
Although originally solely developed to better understand under which conditions different channel patterns occur (Leopold and Wolman, 1957), discriminators using channel-dependent and morphometric parameters are still being developed and used to predict river channel pattern (e.g. Akhtar et al., 2011; Beechie and Imaki, 2014; Beechie et al., 2006; Crosato and Mosselman, 2009; Dey, 2014; Eaton et al., 2010; Ganti et al., 2019). Similar to a channel pattern discriminator, a channel pattern predictor is a quantitative separator or set of separators of zones in a diagram that represent the highest probability of existence of channel patterns. However, to be used as a predictor, this separator or these separators should be based on one or more process-based parameters that are independent of channel pattern and provide the initial conditions for the channel pattern to develop.
Over time, realization has grown that using discriminators that are channel-dependent and morphometric-based hampers the predictive value (Carson, 1984; Knighton, 1984). Hence, the use of parameters like bankfull width, channel slope, width–depth ratio or sinuosity should be avoided. True prediction of channel pattern should be based on channel-independent parameters that relate to the initial conditions that result in meandering and braided rivers (Carson, 1984; Ferguson, 1987; Van den Berg, 1995). This implies that parameters should be included that could be measured without the presence of a river channel within the valley (e.g. valley slope, discharge characteristics, available sediment type).
1.3 Controlling parameters of channel pattern
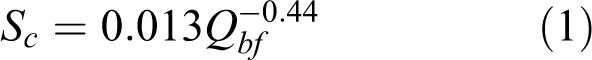
For this paper, we limit discussion to rivers where aggradation or incision plays no significant role, because such rivers have disequilibrium sediment feed. For rivers in dynamic equilibrium, the channel pattern results from the balance of floodplain erosion and floodplain formation (Kleinhans, 2010), which is determined by the shear stress (i.e. stream power), calibre and quantity of sediment load, and bank strength (Kleinhans, 2010; Nanson and Croke, 1992). Initially, Leopold and Wolman (1957) and Lane (1957) suggested empirically discriminating meandering and braided rivers with just two controlling parameters, bankfull discharge (Q bf , m3s−1) and channel slope (S c, -):
Later it was shown that the median bed grain size is an important discrimination parameter because it determines what shear stress is needed for transporting bed material (Carson, 1984; Ferguson, 1987). This insight was utilized in empirical channel pattern discriminators by Van den Berg (1995) and Eaton et al. (2010). Studies using both mechanistic and empirical channel pattern discriminators also showed that the width–depth ratio of the river channel is an important discriminating factor (e.g. Bridge, 1993; Crosato and Mosselman, 2009; Eaton and Millar, 2004; Fujita, 1989), which strongly depends on bank strength (Ferguson, 1987; Schumm, 1960). Fredsøe (1978) showed that the meandering–braided transition occurs approximately at a width–depth ratio of 50.
The floodplain properties strongly control the bed material grain size and bank strength, and are thus important for the discrimination of channel patterns (Carson, 1984; Eaton and Giles, 2009; Ferguson, 1987; Kleinhans, 2010; Nanson and Croke, 1992) but have hardly been included in discriminators. Eaton et al. (2010) described a conceptual channel pattern discriminator including the bank strength, but quantification based on data was beyond the scope of their research. Bank strength is a function of sediment cohesiveness (Julian and Torres, 2006), but also depends on vegetation (Gurnell, 2014; Millar, 2000) and factors such as groundwater seepage (Eekhout et al., 2013; Van Balen et al., 2008), grazing animals (Beschta and Ripple, 2012; Trimble and Mendel, 1995) and human activities (Gibling, 2018; Kondolf et al., 2002). This complexity hampers quantification of bank strength (Hickin and Nanson, 1984). Nevertheless, Nanson and Hickin (1986) showed that the grain size of the river banks was the most important factor explaining bank erosion rates, while other factors had limited effect.
The influence of bank cohesiveness was nicely illustrated by Simpson and Smith (2001), who showed that the Leopold and Wolman (1957) discriminator failed to discriminate the channel pattern difference between a meandering reach and braided reach of the sand-bed Milk River. They found that the silt-plus-clay fraction of the channel banks dropped strongly from 65% in the meandering reach to 18% in the moderately braided reach and increased again to 85% in the laterally stable reach. They stressed the importance of including the silt-plus-clay fraction of river banks in the channel pattern discriminator, especially for sand-bed rivers. Similarly, Labbe et al. (2011) showed that the channel form changed primarily due to a change in bank material along the Upper Tualatin River, USA. Finally, Candel et al. (2020) showed that the average silt-plus-clay fraction of river banks could be used to discriminate self-constrained rivers with complex channel patterns and low mobility from meandering rivers with classical sinuous channel patterns and greater mobility.
1.4 Research aim
Empirical and mechanistic channel pattern discriminators are often used as predictors of channel pattern. However, they commonly use channel-dependent and morphometric parameters and tend to ignore the floodplain properties, despite their large effect on channel pattern. In this research, we first aim to identify which existing channel pattern discriminator is most suitable for predicting channel pattern (Section II). We compare the parameters of empirical and mechanistic channel pattern discriminators and their discriminative power for a large dataset of rivers (n=134). Second, we develop a new channel pattern predictor that takes bank strength into account (Section III). We test its discriminative power relative to existing alternatives, and we discuss its limitations and applicability (Section IV).
II Comparison of channel pattern discriminators and their discriminative power
2.1 River dataset and channel pattern characterization
First, we will describe the river dataset and the method of channel pattern characterization (this section), after which we will test and compare seven channel pattern discriminators (Sections 2.2 to 2.4). To compare the different channel pattern discriminators we will use the dataset compiled by Kleinhans and Van den Berg (2011), which contains rivers from all over the world (see supplemental information). The dataset, extended by Candel et al. (2020), now consists of 134 natural rivers in alluvium that are in a dynamic equilibrium condition over a length scale of a few tens of meander lengths, all checked for channel pattern by using satellite and aerial imagery (Google Earth) by Kleinhans and Van den Berg (2011) and Candel et al. (2020) (see Supplementary information). Rivers were subdivided into single-thread and multi-thread rivers. Single-thread rivers were further subdivided into immobile rivers when bars were absent, meandering rivers with scroll bars and meandering rivers with chute bars (see Figure 1). Multi-thread rivers were subdivided based on their braiding index (Bi ) into moderately braided (Bi = 1.2–3) and highly braided (Bi >3) (Kleinhans and Van den Berg, 2011). The braiding index is defined as the average cross-sectional number of active braids; it was derived by visually counting the active braids, following Egozi and Ashmore (2008). Furthermore, the dataset contains information on valley slope (S v , -), channel slope (S c , -), sinuosity, mean annual flood discharge (Q ma , m3s–1), bankfull discharge (Q bf , m3s–1), and median bed grain size (D 50, m). The mean annual flood discharge represents the effective channel-forming discharge (Q ef , m3s–1), and when not available the bankfull discharge was taken (see foundations of choice given by Kleinhans and Van den Berg, 2011). For 81 rivers, additional information was available on the hydraulic geometry of the channel (bankfull width (W bf , m) and depth (H, m)). All rivers in the dataset have a perennial flow regime, no engineering works along the river and no signs of strong modification of the hydrological regime (e.g. no underfit river patterns).
Quantitative data on average silt-plus-clay fractions of the river banks in the reaches of interest are available in the literature for about half of the rivers of the dataset (70 out of 134). Candel et al. (2020) provided a part of this dataset for the single-thread rivers, and here we further extend this dataset by adding silt-plus-clay fractions for the braided rivers in the dataset, if available in literature (dataset in Supplementary information). Where ranges of silt-plus-clay fractions were reported, we used the middle of the range. In general, samples were taken from the exposed river banks at several depths, after which they were sieved in the laboratory. Sampling methods and texture analysis slightly varied between studies that reported silt-plus-clay fractions. More details on methods used is provided in the cited sources in the Supplementary information.
A critical review indicated that not all alluvial rivers with scroll bars are laterally active. Candel et al. (2020) showed that many low-energy alluvial rivers with scroll bars are in fact more or less laterally stable, because they have constrained their channel pattern within their self-formed cohesive deposits. The proportion of these cohesive deposits increases over time, because low-energy rivers predominantly erode the easily erodible, non-cohesive deposits, while they continuously form both easily erodible and relatively erosion-resistant deposits. Consequently, the lateral migration of the river decreases over time. Scroll bars in these rivers may be inherited from past meandering activity or may result from local lateral migration where the river is able to erode a non-cohesive bank. This self-constraining of meandering rivers results in a tortuous, complex channel pattern, i.e. channel patterns with unusually sharp bends with variable size and abrupt, irregular changes in channel direction, lacking the typical smoothness and regularity of conventional meander curves (Candel et al., 2020; Schumm, 1963) (e.g. Figure 1c). Candel et al. (2020) developed a metric to quantify the tortuosity of river channel pattern, by taking the fraction of sharp bends with a
2.2 Empirical channel pattern discriminators
The channel pattern discriminator of Leopold and Wolman (1957) (Figure 2a) discriminates only between meandering and braided rivers (Equation (1)). Eaton et al. (2010) proposed to combine the channel slope discriminator with the bankfull discharge and median bed grain size, and add bank strength (μ’, -) to the empirical equation (Figure 2b). They defined μ’ as the relative bank strength given by the ratio of the critical shear stress for entrainment of the channel banks to the critical shear stress for the channel bed. When bed and banks consist of the same material, μ’ = 1. Hence, the discriminator does not have a fixed position and shifts for each river reach depending on μ’. Unfortunately, data is not available to derive μ’. Their discriminator is defined by:

where Q* is the dimensionless bankfull discharge given by:
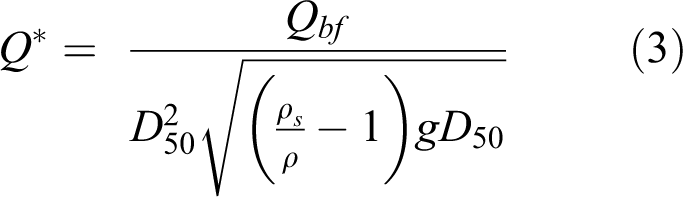
where ρ is the water density (kg m–3),
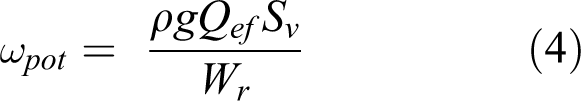
Van den Berg (1995) argued that many discriminators require some a priori knowledge of the channel geometry, while parameters should be independent of channel pattern to be useful as a predictor. Hence, he proposed the potential specific stream power as an independent measure of river energy needed to move sediment, which is defined by:
where
where
Van den Berg (1995) defined the discriminator between a braided and meandering pattern (Figure 2d):

where subscript bm refers to the braided–meandering pattern transition. Makaske et al. (2009) added an extra discriminator between laterally stable and meandering rivers, primarily based on the laterally stable reaches of the anastomosing upper Columbia River:

where subscript ia refers to the inactive–active pattern transition. The
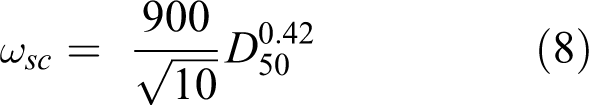
where subscript sc refers to the scroll-dominated and chute-dominated pattern transition. This discriminator is defined halfway between the ωia - and ωsc -discriminators on a log-scale (Figure 2d).
Makaske et al. (2009) and Kleinhans and Van den Berg (2011) have defined the slopes of the new ωia - and ωsc -discriminators parallel to the already existing ωbm -discriminator that was determined by discriminant analysis by Van den Berg (1995), and confirmed by logistic regression analysis by Bledsoe and Watson (2001). To confirm the slope of the discriminators as shown in Figure 2d, we derived an independent relation between ωbf and D 50 for a large river dataset that combines the river data by Kleinhans and Van den Berg (2011) and Li et al. (2015). This analysis can be found in the Supplementary information, and confirmed the slope of the discriminators as defined by Kleinhans and Van den Berg (2011) in Equations (6) –(8).
2.3 Mechanistic channel pattern discriminators
As discussed in Section 1.2, we are not yet able to quantitatively describe all physical and biomorphological mechanisms that affect channel pattern. Existing mechanistic channel pattern discriminators are mostly physics-based. Parker (1976) showed that river patterns are determined by the occurrence of instability of the flow and the bed. He developed the first theoretical stability criterion (∊) to discriminate meandering from braided rivers, which represents the ratio of sediment transport to water transport (Figure 3a):
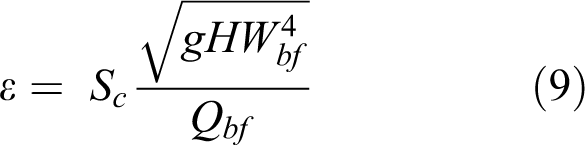
The river channel pattern is meandering when ∊ < 1, and braided when ∊ ≥ 1.
More recently, Crosato and Mosselman (2009) developed a physics-based channel pattern discriminator to predict the bar mode in rivers (Figure 3b):
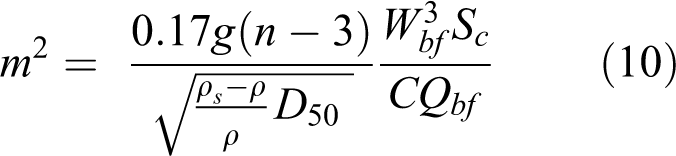
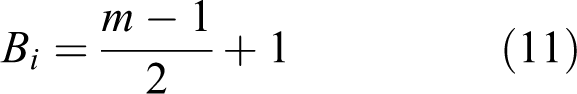
where n is the degree of nonlinearity of sediment transport versus depth-averaged flow velocity (–), which is assumed to be 4 and 10 for sand-bed and gravel-bed rivers, respectively (Crosato and Mosselman, 2009), C is the Chézy coefficient (m 0.5 s –1) and m is the bar mode (–). The bar mode refers to the number of bars that form in a river channel cross-section (Seminara and Tubino, 1989), with a bar mode of 1 meaning bars only form along the river channel sides. Higher bar modes refer to bars forming in the middle of the channel, and divide the river in multiple channels such as during braided conditions. The bar mode can be translated to the braiding index by (Crosato and Mosselman, 2009; Egozi and Ashmore, 2008):
The physics-based bar theory by Struiksma et al. (1985) and Seminara and Tubino (1989) shows that the width–depth ratio determines bar formation and braiding index, which relates to the differences in the direction of sediment transport compared to depth-averaged flow as a result of gravitational effects on transverse and longitudinal slopes. Kleinhans and Van den Berg (2011) further developed this bar theory and applied it to predict river channel pattern. In the Supplementary information we further elaborate on the underlying formulas of these physics-based discriminators and derive two new equations (Equations (12) and (13)) to discriminate channel pattern based on width–depth ratio as a function of median bed grain size (building on Struiksma et al., 1985).
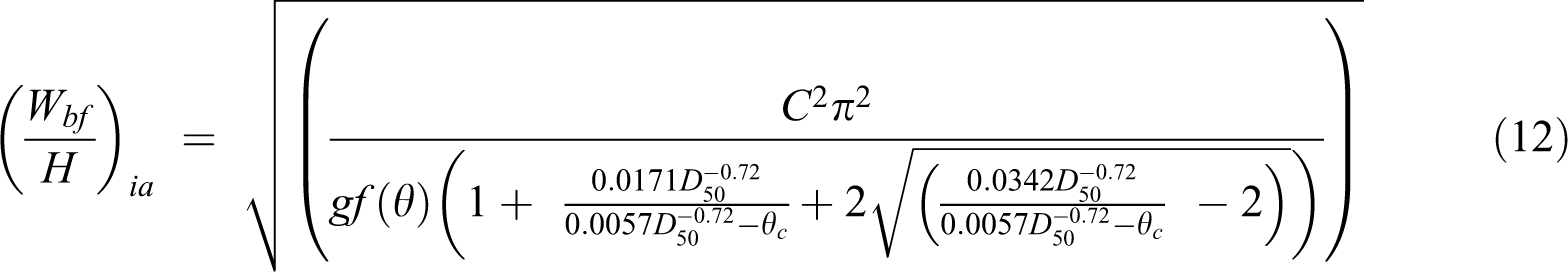
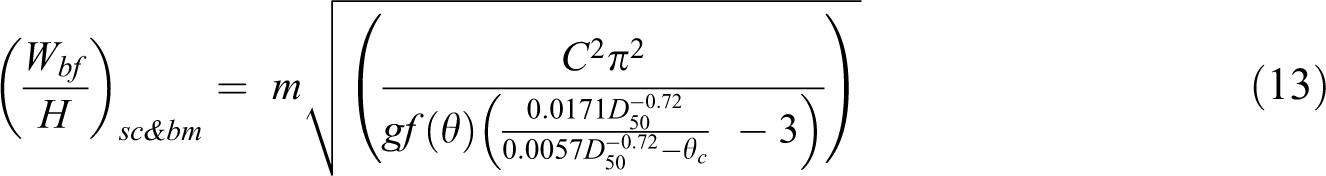
where f(θ) is the magnitude of the transverse slope effect (–) and
From Figure 3c it can be derived that the number of bars is higher in rivers with a high width–depth ratio (W/H) than in rivers with a low width–depth ratio. Moreover, braided river channel patterns and rivers with chute bars are more numerous in gravel-bed rivers compared to sand-bed rivers, because bars form much more easily with increasing width–depth ratio in gravel-bed rivers than in sand-bed rivers (Kleinhans and Van den Berg, 2011). Meandering rivers with scroll bars (i.e. rivers with an underdamped regime, see explanation in Supplementary information) are less likely to exist with increasing median grain size because the lower discriminators converge (Figure 3c).
2.4 Comparison of discriminators and evaluation of discriminators as predictors
We applied each of the discriminators to the river dataset to determine the percentage of correctly classified channel patterns (Table 1). Additionally, we used the kappa statistic (κ) to test interrater reliability, with κ < 0 indicating no agreement, 0–0.2 slight, 0.21–0.40 fair, 0.41–0.60 moderate, 0.61–0.80 substantial and 0.81–1 almost perfect agreement (see calculation of kappa in Landis and Koch, 1977). The κ statistic accounts for the number of channel patterns categorized, and thus allows comparison between the different discriminators.
Percentages of correctly plotted channel patterns and κ coefficient (Landis and Koch, 1977) by using different discriminatory criteria as shown in Figures 2 and 3 using the dataset of Kleinhans and Van den Berg (2011) (extended by Candel et al., 2020).
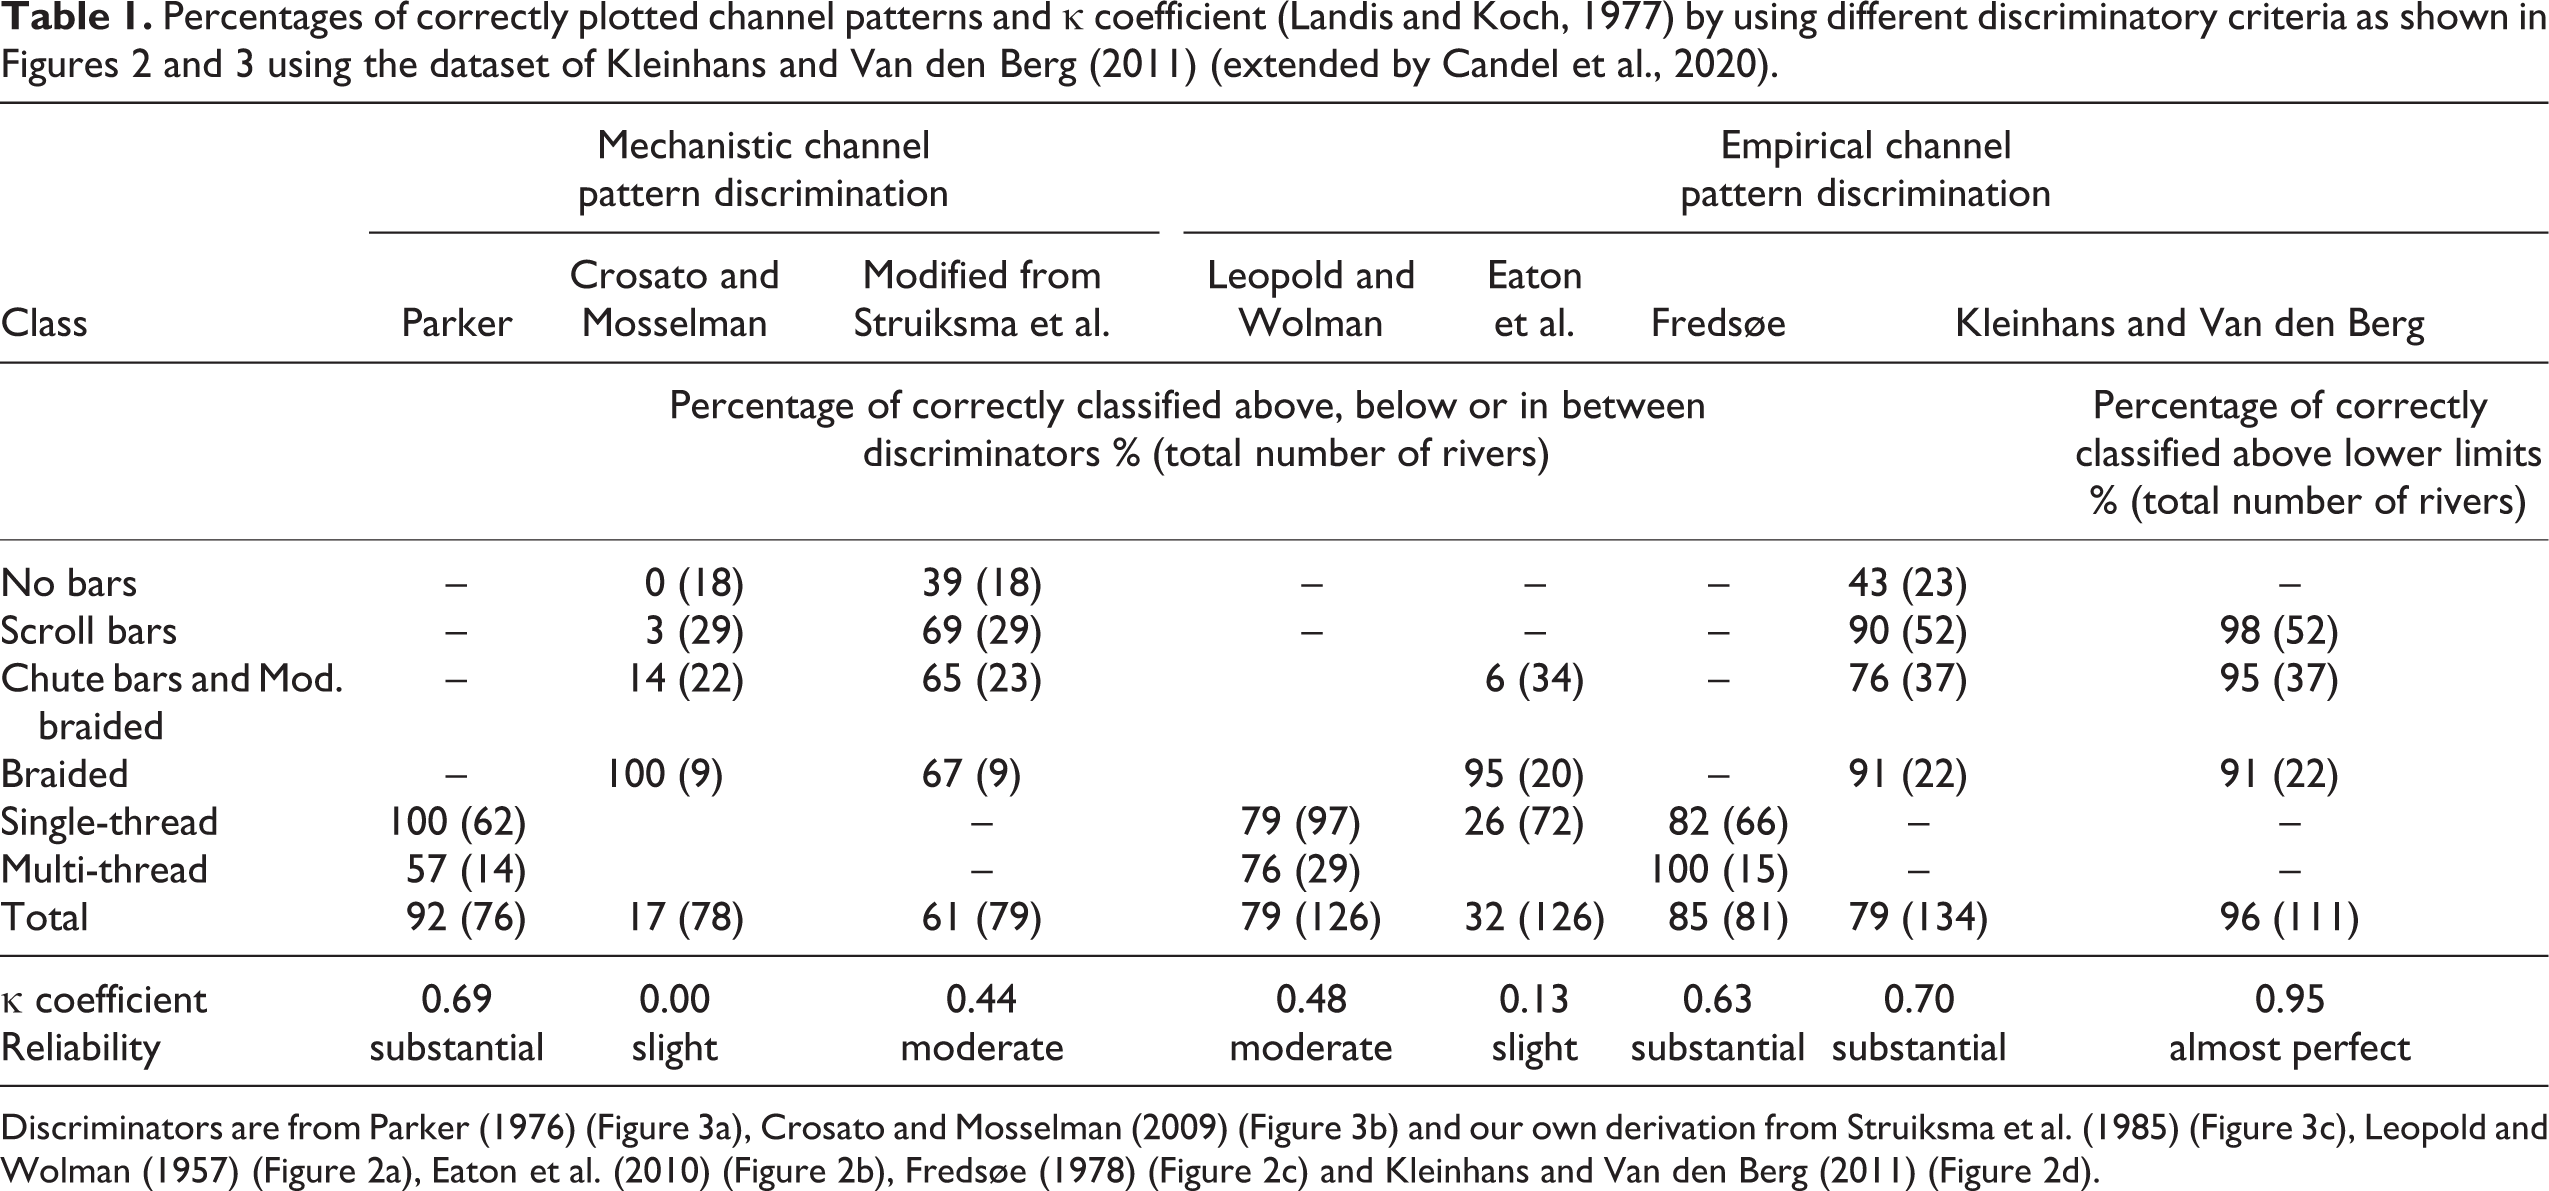
Discriminators are from Parker (1976) (Figure 3a), Crosato and Mosselman (2009) (Figure 3b) and our own derivation from Struiksma et al. (1985) (Figure 3c), Leopold and Wolman (1957) (Figure 2a), Eaton et al. (2010) (Figure 2b), Fredsøe (1978) (Figure 2c) and Kleinhans and Van den Berg (2011) (Figure 2d).
The mechanistic discriminator by Parker (1976) works well for meandering rivers (100% correct), but performs less for braided rivers (57% correct). Overall, it shows substantial agreement (κ = 0.69, Table 1) between the observation and discrimination of channel patterns (Table 1, Figure 3a). The advantage of the mechanistic discriminators by Crosato and Mosselman (2009) and the semi-physical discriminators that we developed here (Supplementary information and Equations (12) and (13)) is that they can be used to discriminate more types of channel patterns than most other channel pattern discriminators (Figure 3b–c). Using the Crosato and Mosselman (2009) discriminator, only 17% of all channel patterns were discriminated correctly, which indicates a slight agreement between the observed and discriminated channel patterns (κ = 0.00, Table 1). Their model correctly classified the braided rivers but did not perform well for other channel pattern types (Figure 3b, Table 1).
Our own derivation of Struiksma et al. (1985) shows better agreement, as 61% of all channel patterns were discriminated correctly, resulting in a moderate agreement (κ = 0.44, Table 1). Within the group of sand-bed rivers on the left side of the graph (Figure 3c), the high-energy river patterns (i.e. braided and chute bars) are relatively poorly discriminated, and rivers with scroll bars cannot be discriminated from laterally stable rivers. Within the group of gravel-bed rivers on the right side of the graph, the mechanistic discriminators perform better, especially for the high-energy river patterns. Here the critical motion of bed sediments forms the limit of the channel pattern discrimination, explaining the asymptote at the largest particle size (Figure 3c). The difference in discrimination success between sand-bed and gravel-bed rivers is likely explained by the effect of bank strength, because rivers with cohesive banks are not able to form wide channels (Millar, 2000; Schumm, 1960; Soar and Thorne, 2001). Eaton and Giles (2009) and Candel et al. (2020) showed that bank strength has its strongest effect on inhibiting bank erosion in sand-bed rivers because gravel-bed rivers require sufficiently high energy for the critical motion of their coarse bed sediment and are thus always able to erode cohesive banks.
Both mechanistic and empirical channel pattern discriminators showed that the width–depth ratio is an important discriminator factor, although it is not independent of actual channel pattern. This ratio is indirectly controlled by floodplain properties such as bank strength (Ferguson, 1987; Kleinhans, 2010; Schumm, 1960). The relatively simple empirical channel pattern discriminator by Fredsøe (1978) (Figure 2c), using the width–depth ratio of 50 as discriminator, shows substantial agreement between the observed and discriminated channel patterns (κ = 0.63, Table 1). This discriminator is relatively successful compared to the other empirical channel pattern discriminators, such as the original discriminator by Leopold and Wolman (1957) (Figure 2a), which shows moderate agreement (κ = 0.48, Table 1). However, both discriminators discriminate just two channel pattern types.
The channel pattern discriminator by Eaton et al. (2010) (Figure 2b) functions relatively well for braided rivers (95% correct), but relatively poorly for lower-energy channel patterns. Overall, it shows only slight agreement (κ = 0.13, Table 1). In their discriminator they introduced bank strength. Although we favour this addition of bank strength, we find the addition relatively impractical because it was not included on the axes. Hence their discriminators do not have fixed positions and shift for each river reach depending on μ’.
Kleinhans and Van den Berg (2011) stated that their discriminators are defined as lower limits rather than true separation lines. This means that channels patterns can only exist above the associated lower limit, but channel patterns above that limit can also be of lower energetic regime (Figure 2d). For example, laterally stable rivers can exist in the field of meandering rivers with scroll bars, but not vice versa (Figure 2d). When including this aspect in our analysis, we find that the empirical channel pattern discriminator by Kleinhans and Van den Berg (2011) yields almost perfect agreement (κ = 0.95, Table 1), and outperforms the other channel pattern discriminators (Table 1) . When the discriminators by Kleinhans and Van den Berg (2011) are interpreted as true separation lines (rather than lower boundaries), the channel pattern discrimination still performs relatively well for rivers with scroll bars (90% correct), rivers with chutes and moderately braided rivers (76% correct), and braided rivers (91% correct). However, the channel pattern discrimination for rivers without bars, which are mostly sand-bed rivers (D 50: 0.1 to 1 mm), is relatively poorly (43% correct). Overall, the discriminated patterns show substantial agreement with observations (κ = 0.70, Table 1).
This poor discrimination of rivers without bars suggests that these rivers have the energetic potential for meandering and development of scroll bars, while they are in fact laterally stable. The poor discrimination success of low-energy sand-bed rivers, in both empirical and mechanistic approaches, is likely due to the effect of bank strength. Likewise, we expect that the discriminative power of rivers with chute bars and moderately braided rivers will improve when the effect of bank strength is included, because rivers with a high silt-plus-clay fraction of the inner bank will not develop chutes (Kleinhans et al., 2018).
All discussed discriminators, except the latter of Kleinhans and Van den Berg (2011), have the disadvantage that they use morphometric parameters that are channel pattern dependent, such as the channel geometry or channel slope, while parameters are preferably independent of channel pattern to be effective as a predictor. The empirical discriminator of Kleinhans and Van den Berg (2011) is relatively simple, requires a minimum number of channel pattern-independent parameters, discriminates more types of channel patterns than other existing empirical channel pattern discriminators, and yields results that are not inferior to existing mechanistic and empirical discriminators of channel pattern. Hence, this channel pattern discriminator would be most suited to further develop as a channel pattern predictor. As discussed, the bank strength needs to be incorporated to further improve the channel pattern prediction, which will be discussed in the next section.
III Including bank strength for improved channel pattern prediction
3.1 Empirical relations between stream power and bank strength
We use the average silt-plus-clay fraction of the river banks as a proxy for bank strength. In Figure 4 we plotted the channel patterns from our dataset in the parameter space of potential specific stream power and silt-plus-clay fraction of the river banks. Following earlier work by Candel et al. (2020), we added rivers with scroll bars and a tortuous channel pattern as an additional channel pattern, as discussed in Section 2.1. These rivers are more or less laterally stable due to self-constraining, although the scroll bars are evidence of minor, local lateral migration because the rivers are able to erode locally where bank strength is below average (Candel et al., 2020).
Most laterally stable rivers have a relatively high silt-plus-clay fraction and a low potential specific stream power (see Figure 4). Candel et al. (2020) used the empirical relation by Julian and Torres (2006) to discriminate self-constraining rivers from actively meandering rivers:
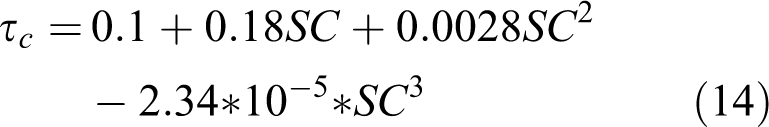
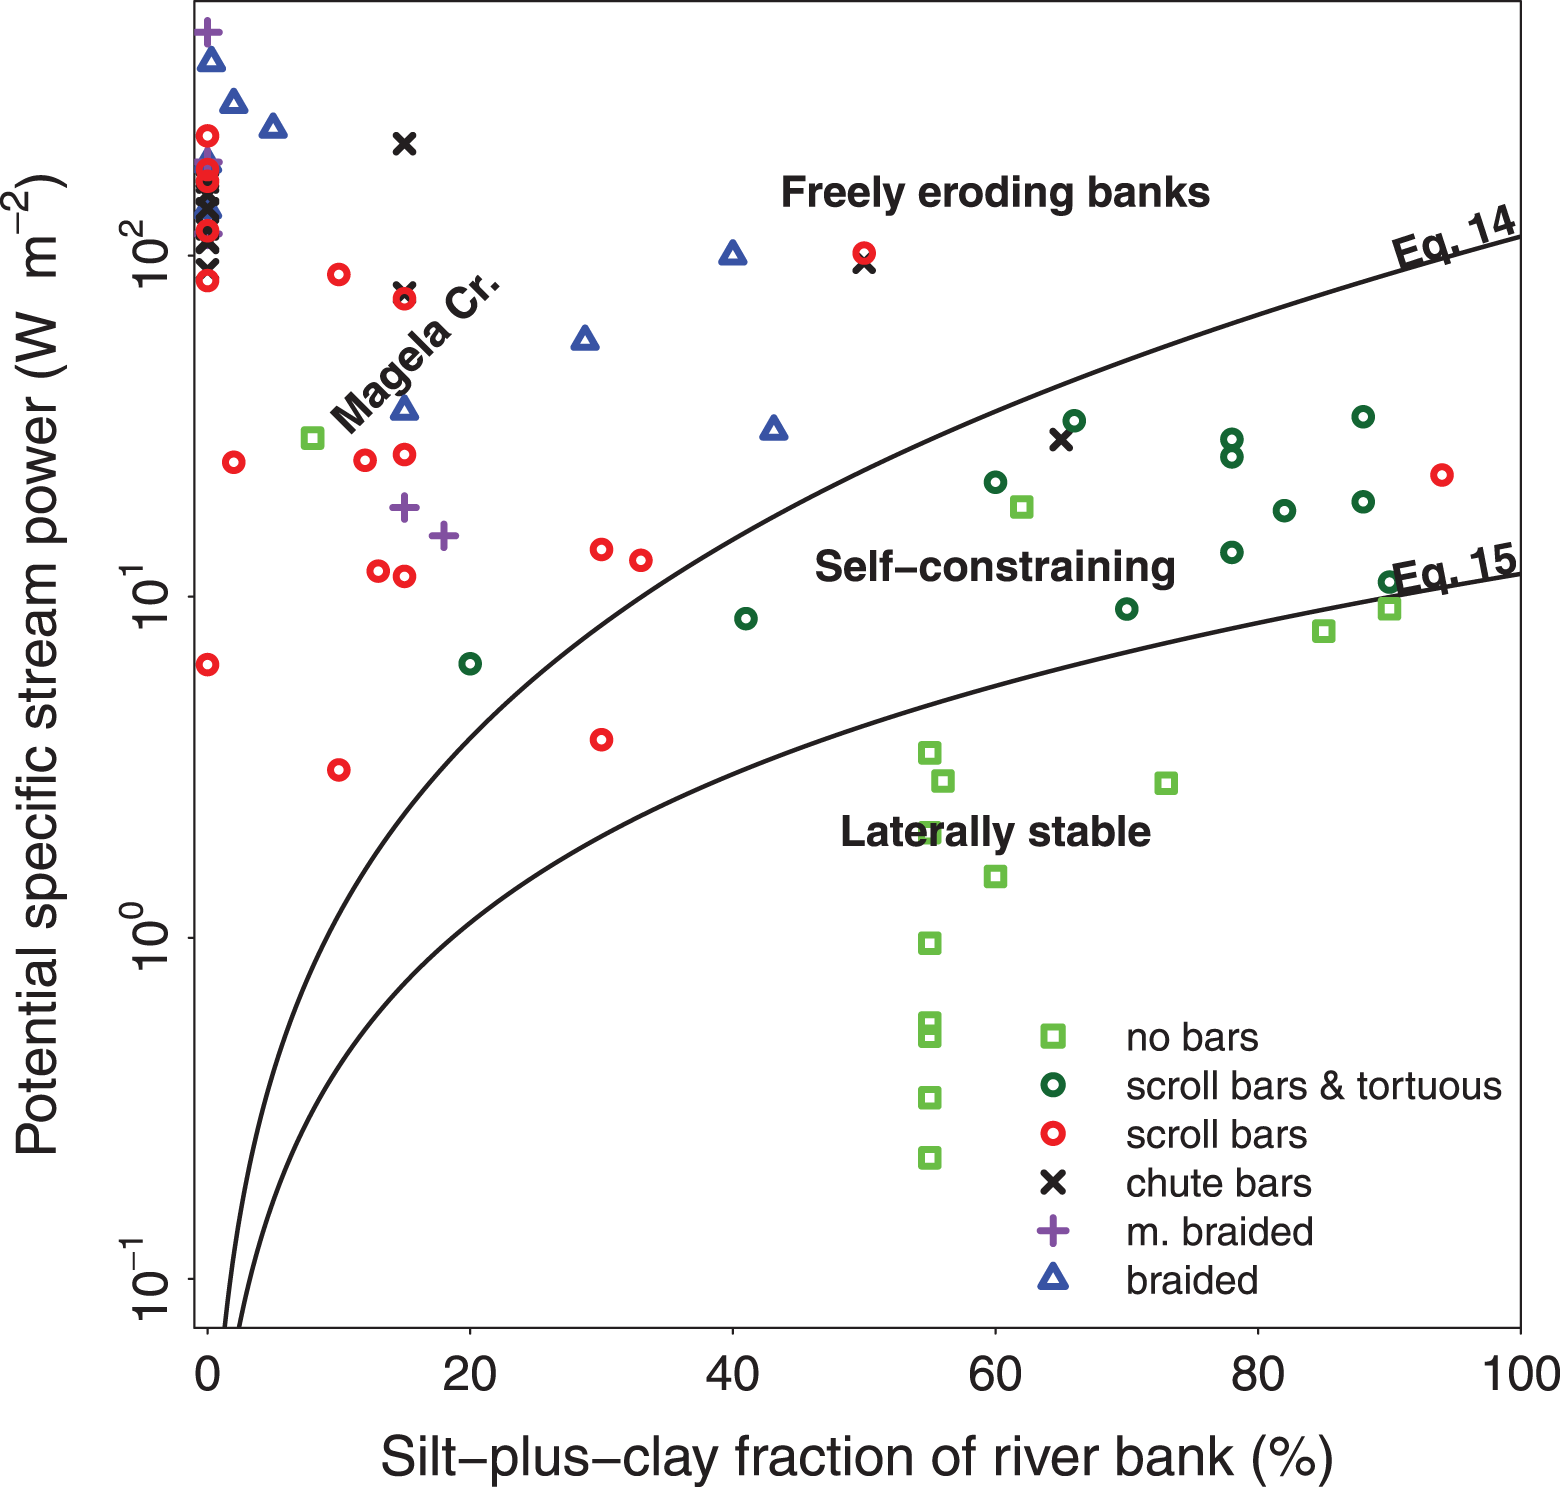
River patterns are plotted in the parameter space of potential specific stream power and silt-plus-clay fraction of river banks. Lines indicate the critical potential specific stream power for bank erosion based on Julian and Torres (2006) (Equation (14)) and fitted from our own dataset (Equation (15)). Based on Candel et al. (2020), rivers with scroll bars were divided into two groups: self-constraining leading to a tortuous channel pattern, and freely eroding banks leading to a normal meandering channel pattern (see Section 2.1).
where

This equation was transformed to potential specific stream power (by Equation (S16) from the Supplementary information) and plotted in Figure 4. We refer to the transformed version of Equations (14) and (15) as the ωtm -discriminator and ωit -discriminator, respectively, where subscript tm refers to the tortuous–meandering pattern transition and subscript it to the inactive–tortuous pattern transition.
3.2 New channel pattern predictor
The original Kleinhans and Van den Berg (2011) discriminators were defined as lower limits above which the related channel pattern could exist. We previously argued that it should be possible to define true discriminators by including bank strength, and that the average silt-plus-clay fraction of river banks may provide a suitable parameter. Based on the described relations between the potential specific stream power and silt-plus-clay fraction of river banks (Section 3.1), we now propose a three-dimensional channel pattern predictor that includes bank strength on a third axis.
The original Kleinhans and Van den Berg discriminators (Equations (6)
–(8); Figure 2d) are shown in a 3D space (Figure 5), combined with the ωtm
-discriminator and ωit
-discriminator (Figure 4). Figures 6 and 7 include the river dataset and give a view of this 3D graph in a 2D plane, for the potential specific stream power versus the D
50 (Figure 6), and the potential specific stream power versus the silt-plus-clay fraction (Figure 7). Laterally stable rivers commonly plot below the original
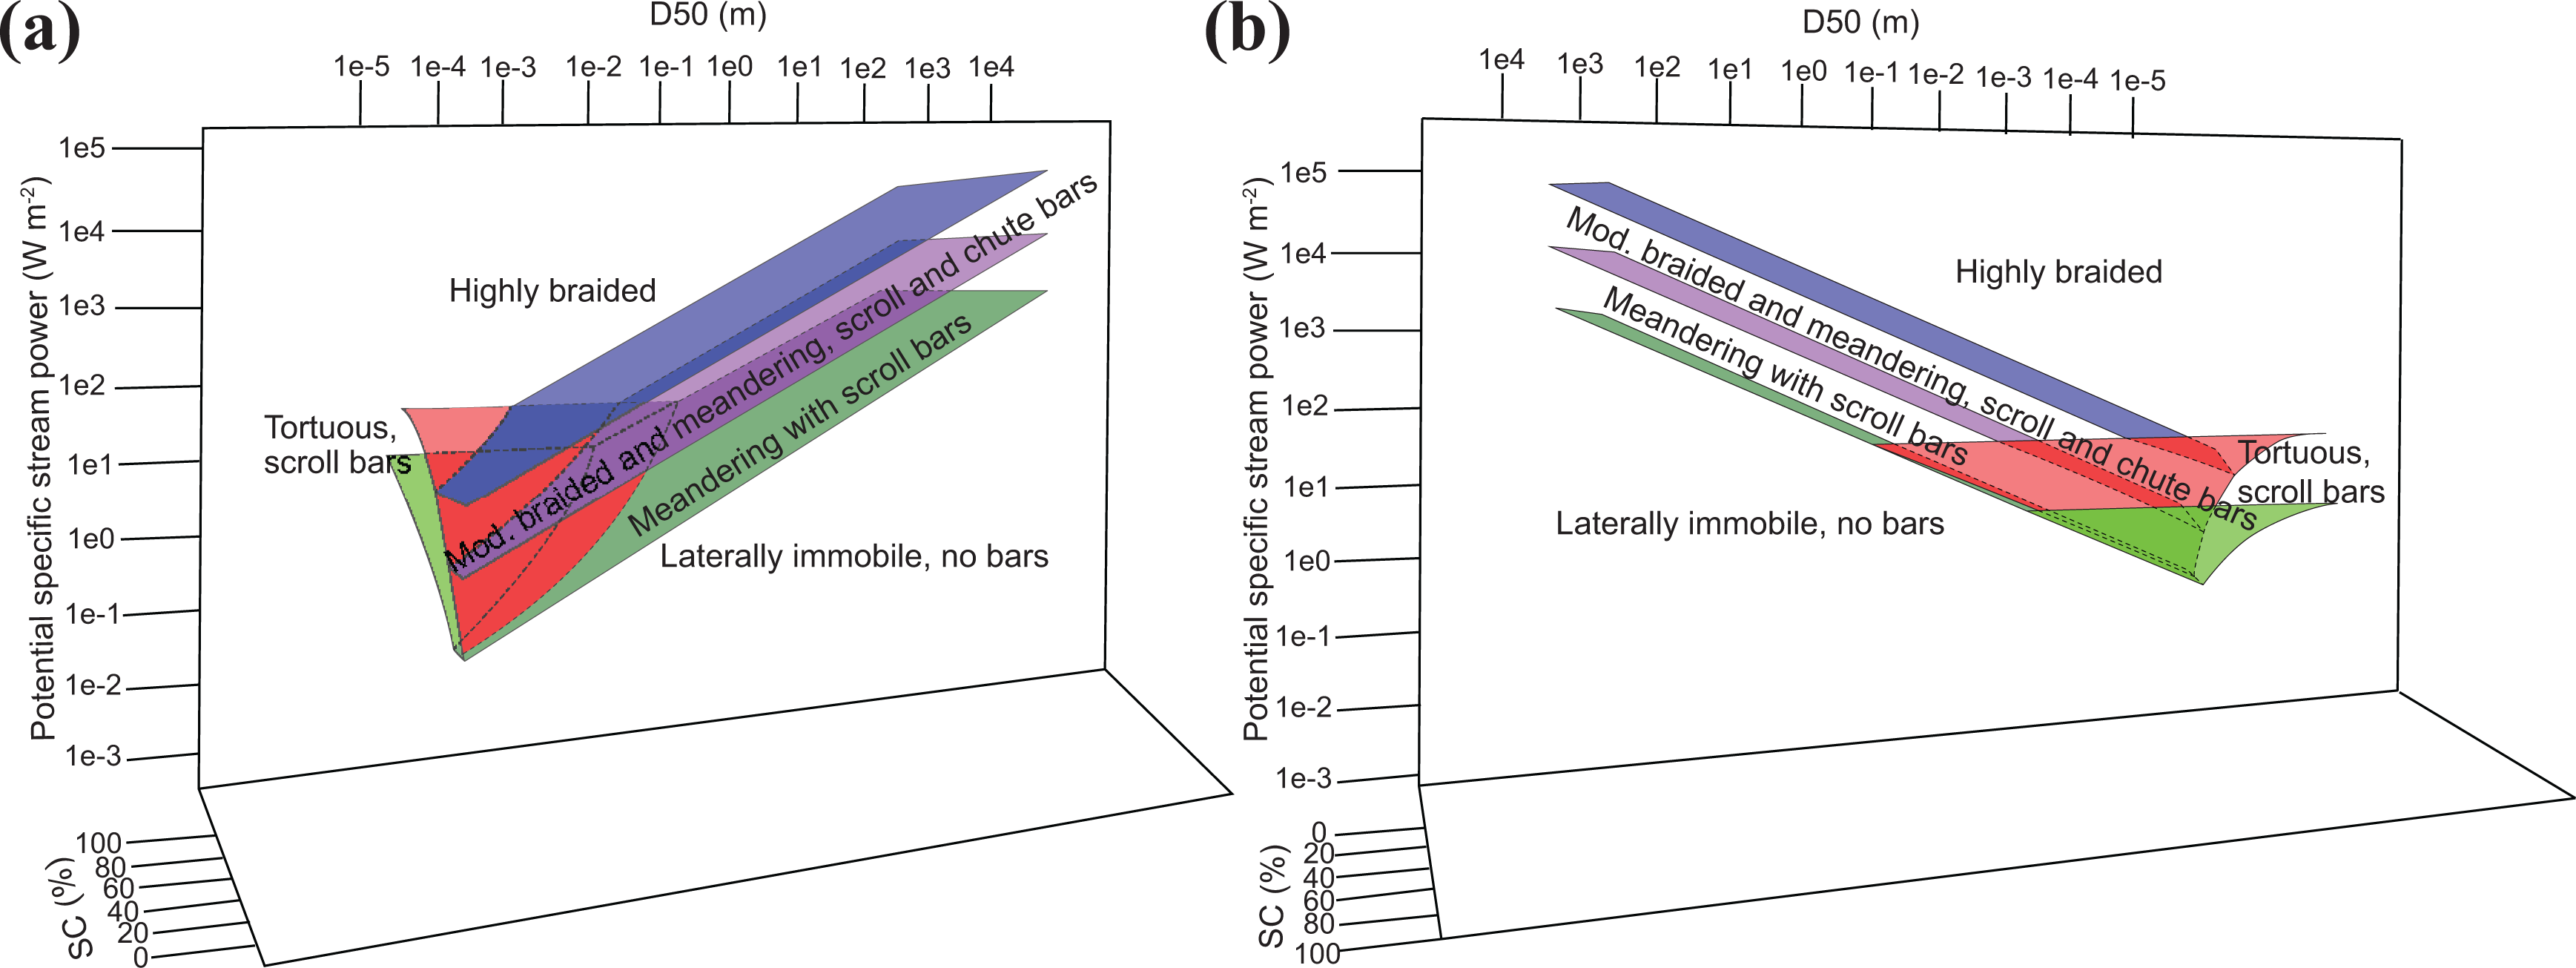
Empirical channel prediction as in Figure 2d, now including the bank strength on the third axis expressed as the silt-plus-clay fraction of the river banks (SC). Rivers with scroll bars and a tortuous channel pattern were added as an extra group (cf. Candel et al., 2020). The graph is shown from two angles (a, b) from which the discriminators can best be distinguished.
Rivers with scroll bars and tortuous channel patterns (e.g. Figure 1c) were defined as an additional group of channel patterns in Section 2.1, plotting in between the
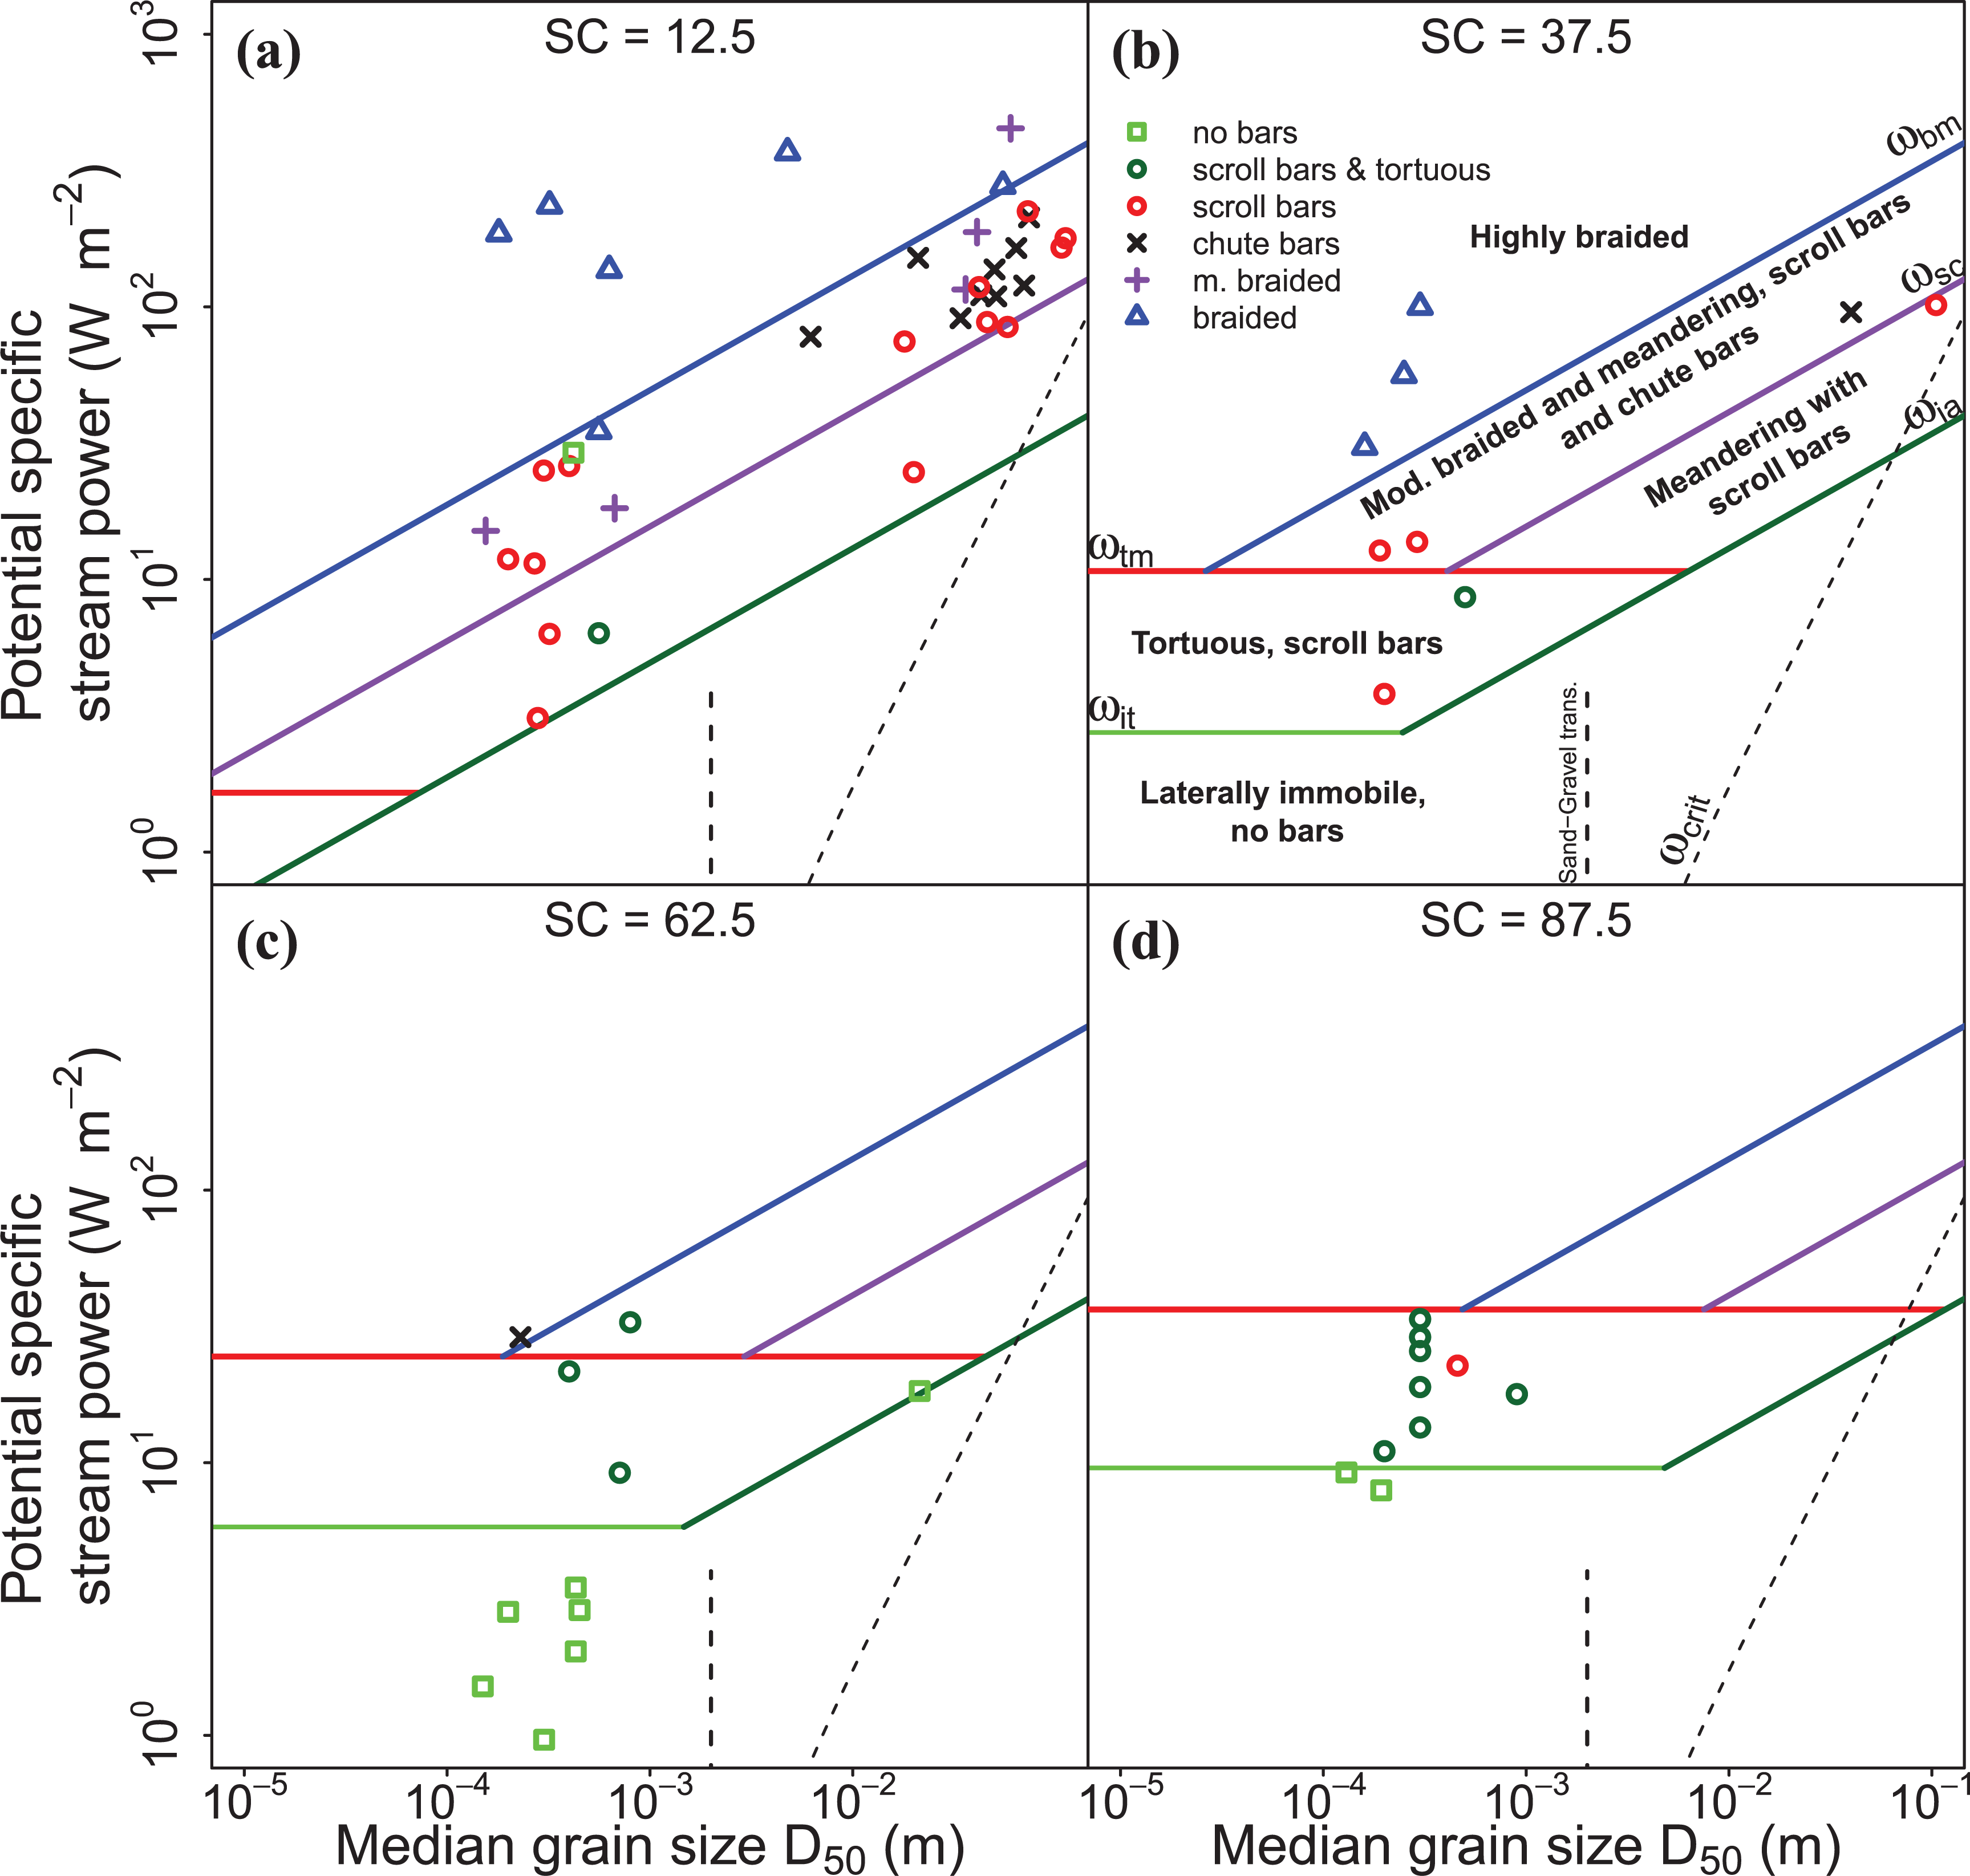
A 2D view of the 3D channel pattern predictor (Figure 5), showing the potential specific stream power versus the median bed grain size. The discriminators are plotted for silt-plus-clay percentages of river banks (SC) of 12.5% (a), 37.5% (b), 62.5% (c) and 87.5% (d). Data points are shown for rivers with silt-plus-clay fractions within 12.5% from this value (e.g. 25–50% for panel b). The legend, and description of the stability fields, discriminators and dashed lines are given in panel b. ω crit is the critical stream power for motion of the bed sediment.
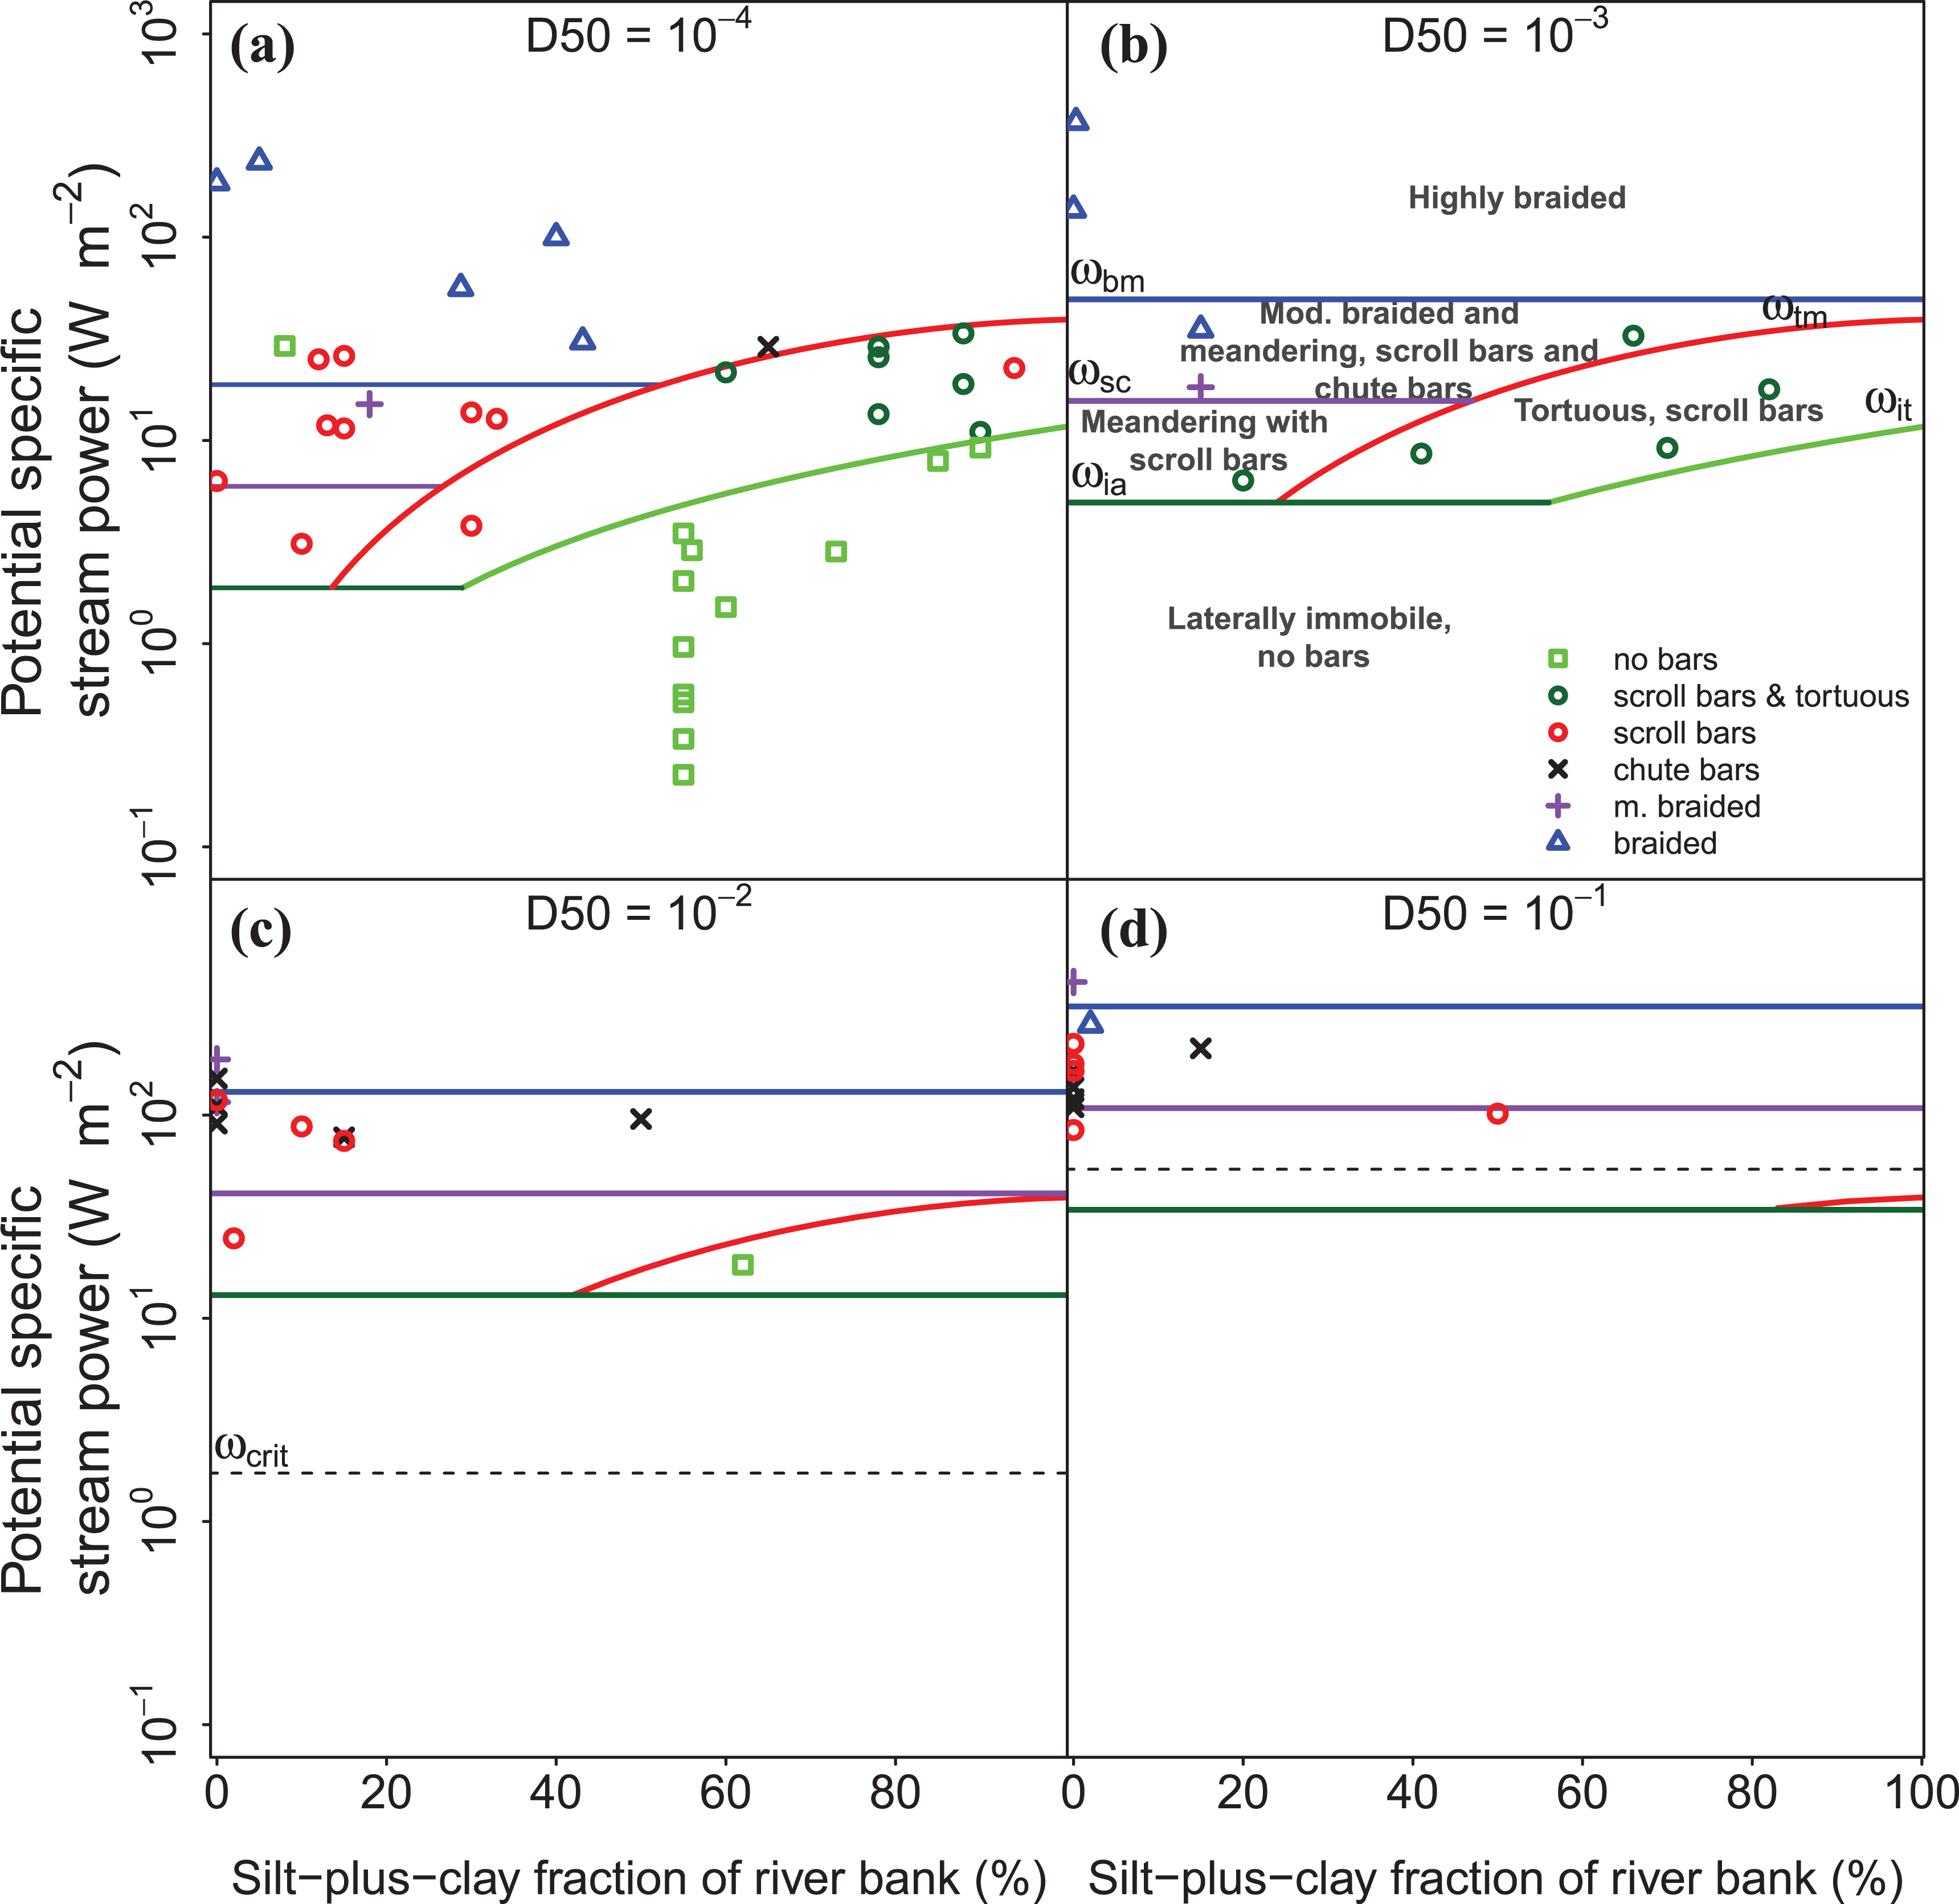
A 2D view of the 3D channel pattern predictor (Figure 5), showing the potential specific stream power versus the silt-plus-clay fraction of the river banks. The discriminators are plotted for a median bed grain size of 10–4 m (a), 10–3 m (b), 10–2 m (c), and 10–1 m (d). Data points are shown for rivers with bed material grain sizes within a factor 0.2 and 2 from this value (e.g. 5*10–4 m and 5*10–3 m for panel b). The legend, and description of the stability fields and discriminators, are given in panel b. The dashed line indicates the critical stream power for motion of the bed sediment (ω crit , see panel c).
Meandering rivers with scroll bars originally plotted above the
IV Discussion
4.1 Discriminative power of the new channel pattern predictor
In Table 2 the discrimination success percentages can be seen for the sub-dataset of 70 rivers for which the silt-plus-clay fraction of the banks is known. Overall, the new channel pattern predictor performs similarly to the original Kleinhans and Van den Berg (2011) discriminator (with the discriminators used as true separation lines instead of lower limits): 61 out of 70 rivers were correctly plotted using Figure 5, compared to 59 out of 70 using Figure 2d. However, all river patterns now show a similar prediction success of 83–89%, whereas before the meandering rivers with scroll bars could be well predicted (94%), but the performance of laterally stable rivers was poor (57%). The improvement of the channel pattern prediction is largest for laterally stable rivers, because bank strength is the most important parameter that can be related to the lateral activity of rivers (Candel et al., 2020; Nanson and Croke, 1992; Schumm, 1963). Additionally, we introduced the extra class of river patterns, meandering rivers with scroll bars and a tortuous pattern, further specifying river channel patterns. The κ-coefficient increased from 0.77 to 0.84, hence showing almost perfect agreement between the observed and predicted channel pattern. While pursuing perfect prediction is futile in view of a lack of data and natural variability, we conclude that the 3D diagram provides an improvement of the original channel pattern discriminator that was developed by Kleinhans and Van den Berg (2011) because of a relatively high prediction success for all channel pattern types (reflected by increased κ).
Percentages of correctly plotted channel patterns and κ coefficient (Landis and Koch, 1977) for 70 rivers in the Candel et al. (2020) dataset for which the silt-plus-clay fraction of the river banks is known.
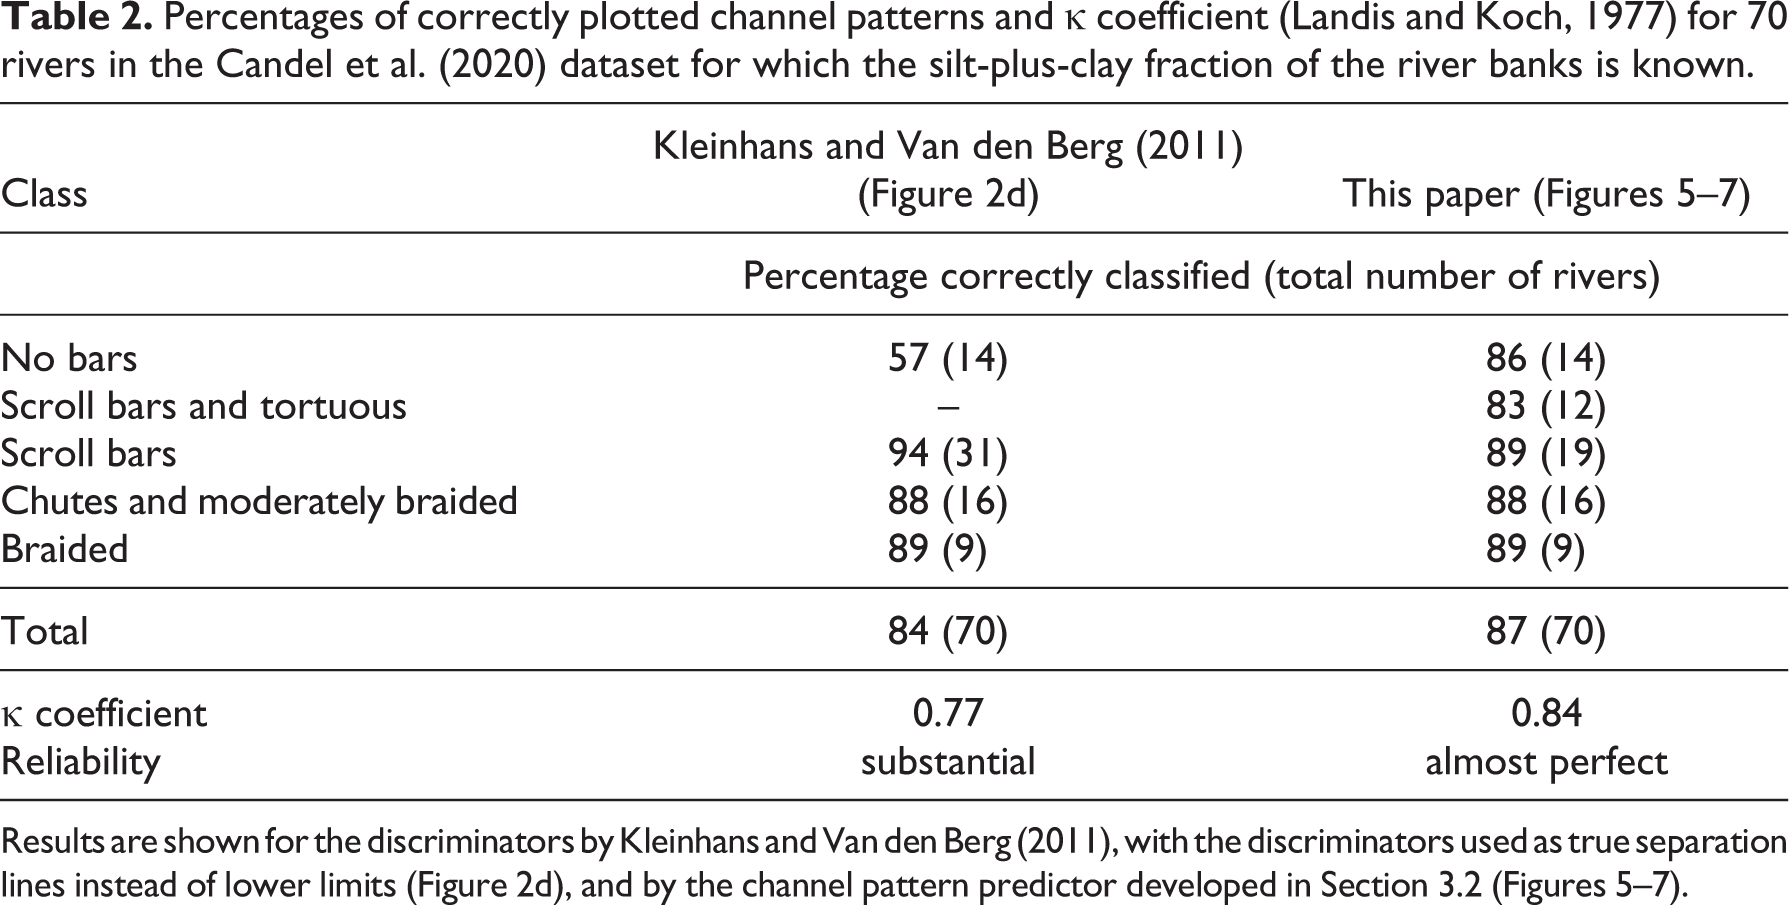
Results are shown for the discriminators by Kleinhans and Van den Berg (2011), with the discriminators used as true separation lines instead of lower limits (Figure 2d), and by the channel pattern predictor developed in Section 3.2 (Figures 5 –7).
The limitations of both empirical and mechanistic channel pattern discriminators can be derived from the newly developed empirical channel pattern predictor in Figures 5 –7. Based on the empirical and mechanistic channel pattern discriminators in Figures 2d and 3c, respectively, it was shown that prediction of channel pattern for sand-bed rivers was poor because the effect of bank strength was not included. Hence, the applicability of existing channel pattern discriminators for channel pattern prediction was limited to fully alluvial rivers with erodible banks, excluding a subset of sand-bed rivers that form cohesive, barely erodible banks. Bank strength has a strong control on the channel pattern for rivers with a low median bed grain size, and is thus the main limiting factor for the channel pattern discrimination (see Figure 7a). The discrimination of gravel-bed rivers was more successful compared to the sand-bed rivers (Figures 2d and 3c) when using existing empirical and mechanistic approaches. For these rivers, the critical stream power for motion of bed sediment forms the limiting factor instead of the silt-plus-clay fraction of the river banks (Figures 3c and 7d).
4.2 Limitations
4.2.1 Causal factors of channel pattern
In this research it was not our aim to identify the causal factors of channel pattern, but to propose a set of easily measurable and applicable parameters to predict channel pattern. Nevertheless, it may be worthwhile to shortly reflect on potential causal factors based on the new channel pattern predictor. The relatively poor performance of mechanistic channel pattern predictors indicates that our ability to quantitatively grasp the causal factors of channel pattern is still limited. The ability of our empirical discriminators to predict channel pattern warrants the exercise to see what we can deduce from the observed relations.
The new predictor would suggest that a gradual increase of stream power relative to bank strength results in river widening, gradually leading to a higher bar mode and hence a new channel pattern (Kleinhans, 2010; Nanson and Croke, 1992). For example, braided rivers form because of high valley gradients and bankfull discharges, hence the river has sufficient stream power to erode its floodplain and widen its river channel. Higher cohesivity of the floodplain requires higher gradients and discharges to form braided rivers (Figure 5) (Kleinhans, 2010; Nanson and Croke, 1992). The observed trends and success of the predictor suggest that these changes may occur irrespective of sediment supply.
Another explanation is given by Parker et al. (2007) and Pfeiffer et al. (2017), who argued that the sediment supply controls the width–depth ratio, and thus the channel pattern. High bedload sediment supply would cause rivers to widen to accommodate the sediments. For very high sediment supply, braided rivers form (Métivier et al., 2017). In this reasoning, the valley gradient, discharge and bank erodibility are believed to control the sediment supply, suggesting an indirect rather than direct effect on channel pattern (Church, 2006; Métivier and Barrier, 2012; Métivier et al., 2017).
Although clearly more research is needed to identify in what way floodplain sediments affect channel pattern, we note that the latter theory contrasts with empirical findings in anastomosing rivers. These tend to be overfed by excessive bedload but tend to have low width/depth ratios and are completely laterally stable (Makaske et al., 2017). Moreover, classical flume experiments showed that river gradient controls channel pattern (Schumm and Khan, 1971). Regardless of the causality, floodplain cohesivity is an important factor of channel pattern, as shown by the developed predictor.
4.2.2 Parameters
We stressed that using channel-dependent and morphometric parameters, such as the width–depth ratio of river channels, should be avoided when aiming to predict channel pattern. However, others have shown that the width–depth ratio could be derived from bedload sediment supply data combined with discharge data, which are parameters that may be measured independently of channel pattern (Eaton and Church, 2009; Eaton et al., 2004; Métivier and Barrier, 2012; Mueller and Pitlick, 2014; Parker et al., 2007; Pfeiffer et al., 2017). This advancement would be very promising for the development of mechanistic channel pattern discriminators that are independent of channel pattern. Nonetheless, these relations mostly applied to gravel-bed rivers that are dominated by bedload sediment transport and in which the effect of floodplain cohesivity is of less importance than in sand-bed rivers. Moreover, the relations between bedload sediment supply and width–depth ratio are mostly theoretical because data on bedload supply in rivers is very scarce (Métivier and Barrier, 2012). Recent work by Francalanci et al. (2020) showed a promising general physics-based approach to determine the width–depth ratio, which can be used for both sand-bed and gravel-bed rivers in cohesive floodplains, although they still use channel slope.
The parameters used in the new channel pattern predictor presented here are neither entirely independent on a long-term timescale (ca. 103 to 104 years). This limitation of the approach was already acknowledged by Van den Berg (1995) when proposing the original version our predictor is based on. It would be expected that low stream power usually provides conditions in which fine sediments deposit on the floodplain, while high stream power creates conditions in which coarser sediments deposit (Hjulstrom, 1935), hence the median bed grainsize and floodplain sediment composition are related to the potential specific stream power. This relation explains why Nanson and Croke (1992) did not define low-energy rivers with non-cohesive floodplains in their classification (Van den Berg, 1995). Channel geometry, and thus channel pattern, is also affected by the floodplain cohesivity because cohesive river banks result in narrow and deep channels (Ferguson, 1987; Kleinhans et al., 2009). In turn, such river narrowing also affects the floodplain sediment composition as coarse sediments are less likely to escape the deep channel, and hence floodplains are built predominantly by fine sediments (e.g. Makaske, 2001). Yet given typical floodplain aggradation rates (Hobo, 2015; Hobo et al., 2010), considerable time is needed before the floodplain composition will adapt to a changing channel pattern. Hence, in the short-term, floodplain composition can be regarded independent of channel pattern, because the floodplain sediment composition changes much slower than channel geometry and stream power (Candel et al., 2020).
4.2.3 Including vegetation in the channel pattern prediction
In this contribution, we have focussed on the role of bank strength resulting from cohesive sediments, ignoring the potential role of vegetation. However, vegetation on the floodplain also affects river morphology and can even lead to different types of channel patterns than predicted (Corenblit et al., 2015; Gibling and Davies, 2012; Gurnell, 2014; Hickin, 1984). The presence of vegetation as patches on the floodplain stimulates the tendency to braid or develop a chute cut-off (Coulthard, 2005; Kleinhans et al., 2018; Tal and Paola, 2010), while dense vegetation cover will concentrate flow into a single meandering channel (Kleinhans et al., 2018; Van Oorschot et al., 2016) and could even result in a laterally stable channel with non-cohesive banks as illustrated by the example of the Magela Creek in Australia (Tooth et al., 2008). Tooth et al. (2008) argued that this river would be expected to be laterally active given the very low silt-plus-clay fraction of the river banks, but found that riparian vegetation plays a dominant role in this river system, creating an anabranching river system with laterally stable channels. In our assessment, the Magela Creek is predicted to be a meandering system, plotting relatively far from the zone of laterally stable rivers (Figure 4). This false prediction corroborates the conclusion of Tooth et al. (2008), that stability is caused by floodplain vegetation.
The cohesiveness of bank sediments and floodplain vegetation are not entirely independent. On the one hand, the establishment of vegetation may be more difficult in cohesive sediments due to the higher penetration resistance. On the other hand, tall vegetation may be uprooted more when growing on non-cohesive sediments (Edmaier et al., 2011). Vegetation can also capture fine sediments during overbank flooding and enhance the cohesivity of the inner-bend bank, which strongly reduces the chute cut-off frequency (Kleinhans et al., 2018; Murray and Paola, 2003; Polvi et al., 2014). Distinct patterns in the morphology of meandering rivers were found to relate to vegetation colonization, density and survival (Eekhout et al., 2014; Van Oorschot et al., 2016).
Including the complex relations between vegetation and river morphology is vital for our understanding of river morphodynamics, but out of the scope of developing a relatively simple channel pattern predictor as was one of the aims of this paper. The most important effect of vegetation on channel pattern is the effect on bank stability (Corenblit et al., 2009; Hickin, 1984; Van Oorschot et al., 2016). The way forward to further improve the channel pattern prediction is by incorporating this effect of vegetation in the bank erosion equations. Millar (2000) and Eaton and Giles (2009) showed with an analytical model that the minimum discharge needed to erode a river bank can considerably increase with the riparian vegetation rooting depth. They showed that incorporating the effect of vegetation on bank strength could be used to improve the discrimination between braided and meandering rivers. However, they used channel-dependent parameters in their discrimination, such as channel slope, making the discriminator unsuitable for the channel pattern prediction developed here.
Vegetation plays a large role in peatland rivers, where the floodplain predominantly consists of plant remains (i.e. peat). Hitherto, rivers in peatlands have not been included in any channel pattern discriminator, although these rivers can also be considered as alluvial rivers (see reasoning by Nanson, 2009). These rivers may be included when the bedload consists of clastic sediments instead of solely organic matter, and thus the median bed grain size can be determined. Rivers in peatlands are often laterally stable because peat banks are relatively erosion resistant (Candel et al., 2017; Gradziński et al., 2003; Nanson, 2010; Watters and Stanley, 2007). For future work, it would be valuable to include the cohesive nature of peat in the representation of bank strength, which is now solely based on silt-plus-clay fraction.
4.3 Implications
The strength of the channel pattern prediction we propose in this paper is its relative simplicity. To be suitable for the prediction of channel patterns in practice, for example in river restoration projects, it is important to keep the channel pattern prediction relatively time- and cost-efficient (Makaske and Maas, 2015). The proposed method has a relatively high prediction success rate (Table 2) and uses relatively easily measurable parameters that are abundantly available for rivers. Moreover, the parameters are largely independent of the actual channel pattern and morphology and can thus also be used to predict channel pattern following (marked) changes in hydrology.
As described in Section 1.1, an improved prediction of channel patterns is vital for river restoration projects, to predict channel pattern changes as a result of climate and land use change and to reconstruct environmental conditions based on channel patterns inferred from fluvial sedimentary archives. The developed channel pattern predictor can be found in an online dataverse (Candel, 2020), which is developed as a user-friendly tool that can easily be applied to all alluvial river systems. We also included the option to add uncertainty to the input parameters: effective channel-forming discharge, valley slope, median bed grain size and the silt-plus-clay fraction of river banks. More details on these calculations can be found in the dataverse of Candel (2020).
V Conclusions
In this study we elaborated upon existing channel pattern discriminators and their potential to be used as predictors, and we propose a new channel pattern predictor that takes the effect of bank strength into account. Our main conclusions are: Most frequently used mechanistic and empirical channel pattern discriminators do not have high success rates in discriminating channel patterns for sand-bed rivers because floodplain properties are not included. River channel pattern discriminators have been used to predict channel pattern, even though they often use parameters dependent of channel pattern and morphology. The success rate of the channel pattern prediction improved by adding an additional channel pattern class of rivers with scroll bars and tortuous channel patterns. These rivers are self-constraining and have inhibited river mobility due to relatively erosion-resistant deposits in the floodplain, and therefore differ from meandering rivers with scroll bars and a regular meandering channel pattern (Candel et al., 2020). The success rate of the channel pattern prediction was improved by adding bank strength, using the average silt-plus-clay fraction as a proxy, to the set of process-based parameters, which are mostly independent of channel pattern (i.e. potential specific stream power and median bed grain size). The improvement was largest for sand-bed rivers.
Supplemental material
Supplements_Physics_revision2-jw-jc - Predicting river channel pattern based on stream power, bed material and bank strength
Supplements_Physics_revision2-jw-jc for Predicting river channel pattern based on stream power, bed material and bank strength by Jasper Candel, Maarten Kleinhans, Bart Makaske and Jakob Wallinga in Progress in Physical Geography: Earth and Environment
Footnotes
Author contributions
The authors contributed in the following proportions to the concept and design, data collection and analysis, and conclusions and paper preparation: JHJC (40%, 95%, 45%), MGK (35%, 5%, 10%), BM (15%, 0%, 25%), JW (10%, 0%, 20%).
Data availability
Acknowledgements
This manuscript has benefited greatly from reviews by Chris Paola and one anonymous reviewer. We would like to thank Gerard Heuvelink for his help with the statistical methods.
Declaration of conflicting interests
The author(s) declared no potential conflicts of interest with respect to the research, authorship and/or publication of this article.
Funding
The author(s) disclosed receipt of the following financial support for the research, authorship and/or publication of this article: This research is part of the research programme RiverCare, supported by the Netherlands Organization for Scientific Research (NWO) and the Dutch Foundation of Applied Water Research (STOWA), and is partly funded by the Ministry of Economic Affairs under grant number P12-14 (Perspective Programme). M.G. Kleinhans was also supported by NWO (grant Vici 016.140.316/13710).
Supplemental material
Supplemental material for this article is available online.
References
Supplementary Material
Please find the following supplemental material available below.
For Open Access articles published under a Creative Commons License, all supplemental material carries the same license as the article it is associated with.
For non-Open Access articles published, all supplemental material carries a non-exclusive license, and permission requests for re-use of supplemental material or any part of supplemental material shall be sent directly to the copyright owner as specified in the copyright notice associated with the article.