
Abstract
Change in river water temperature has important consequences for the environment and people. This review provides a new perspective on the topic by evaluating changes in river water temperature for the UK over the 20th century and possible changes over the 21st century. There is limited knowledge of space-time variability in, and controls on, river temperature at the region scale and beyond over the 20th century. There is historical evidence that UK river temperature has increased in the latter part of the 20th century, but low agreement on the attribution of changes to climatic warming because river temperature is a complex, dynamic response to climate and hydrological patterns moderated by basin properties and anthropogenic impacts. Literature is scarce to evaluate changes to UK river temperature in the 21st century, but it appears as likely as not that UK river temperature will increase in the future. However, there are a number of interlinked sources of uncertainty (related to observations, scenarios, process interactions and feedback) that make estimating direction and rate of temperature change for rivers across the UK with confidence very challenging. Priority knowledge gaps are identified that must be addressed to improve understanding of past, contemporary and future river temperature change.
Keywords
I Introduction
Water temperature is recognized increasingly by scientists, environment managers and regulators as an important and highly sensitive ‘master’ variable of water quality (Hannah et al., 2008b). Temperature directly influences: distribution (e.g. Boisneau et al., 2008), predator-prey interactions (e.g. Boscarino et al., 2007), survival (e.g. Wehrly et al., 2007), growth rates (e.g. Imholt et al., 2010, 2011; Jensen, 2003), timing of life history events (e.g. Harper and Peckarsky, 2006) and metabolism (e.g. Alvarez and Nicieza, 2005) of aquatic organisms in river systems. Indirectly, temperature controls in-stream processes such as rates of production, nutrient consumption and thus food availability, decomposition (e.g. Ormerod, 2009) and dissolved oxygen concentration (e.g. Sand-Jensen and Pedersen, 2005), which influence ecological processes further. In addition, water temperature is of economic importance for electric power (e.g. Foerster and Lillestam, 2010; van Vliet et al., 2013b), drinking water production (e.g. Ramaker et al., 2005) and fisheries (e.g. Bartholow, 1991; Ficke et al., 2007). Hence, there are clear ecological and socio-economic benefits (Poole and Berman, 2001) to be accrued from: (1) understanding the sensitivity of river temperature to climate and other drivers of change using observations for the 20th century; and (2) assessing possible future river temperature changes in the 21st century to inform management and adaptation strategies (Wilby et al., 2010). As a consequence of the increasingly recognized importance of river temperature, there has been an upsurge in research on this water quality variable (Hannah et al., 2008b).
There are four comprehensive reviews of the river temperature literature. In chronological order, Smith (1972) considers the physical processes driving river temperature variability in near-natural systems and also evaluates human impacts that include thermal pollution. Ward (1985) focuses on the Southern Hemisphere to consider controls on the thermal regime and anthropogenic factors. Caissie (2006) overviews water temperature modelling, natural and human influences on thermal conditions and implications for aquatic ecology. Most recently, Webb et al. (2008) capture renewed interest by evaluating significant advances in river and stream temperature research since 1990. Notably, Webb et al. (2008) identify improving understanding of: (1) thermal heterogeneity at different spatial and temporal scales; and (2) past and future trends as major issues for contemporary river temperature research. Such understanding is required urgently by environment regulators as a first step in assessing how climate changes will alter river systems and interact with other pressures affecting ecological status and societal use of flowing waters.
This article offers a different perspective from other reviews. It aims to evaluate changes in river water temperature for the United Kingdom (UK) over the 20th century and possible changes over the 21st century by synthesizing the peer-reviewed literature. Although the emphasis is on the UK, pertinent research is reviewed to contextualize UK-based information. Throughout, the term ‘river temperature’ refers to the temperature of the water column in the river channel. Riverbed temperature is not considered in detail.
The remainder of this article is structured as follows: state-of the-art understanding of processes, controls and dynamics and drivers of change are reviewed to provide a clear scientific basis for evaluating changes (section II); changes in UK river temperature over the 20th century are evaluated with reference to the wider international literature to assess what has happened (section III); what may happen in the future is speculated based on the very limited number of predictive modelling studies of possible UK temperature over the 21st century with findings contextualized by international research (section IV); and conclusions and emergent priority knowledge gaps are outlined to provide guidance on how to improve understanding of past, contemporary and future projections of river temperature change in the UK (section V).
II Understanding processes, controls, dynamics and drivers of change
1 Processes
River water temperature is controlled by dynamic energy (heat) and hydrological fluxes at the air-water and water-riverbed interfaces (Figure 1; Hannah et al., 2008a). Land and water management impact on these drivers and, thus, modify river thermal characteristics (Webb et al., 2008). Rivers are hierarchical systems (Montgomery, 1999) and therefore for a specific point on a river, water column temperature is determined initially by the mix of water source contributions (surface/shallow subsurface flows, groundwater, snow melt, etc.) and subsequently the energy gained or lost across the water surface and riverbed interfaces as the river flows downstream. Thus, spatial and temporal variability in heat flux and hydrological processes create heterogeneity in river temperature at a range of scales.
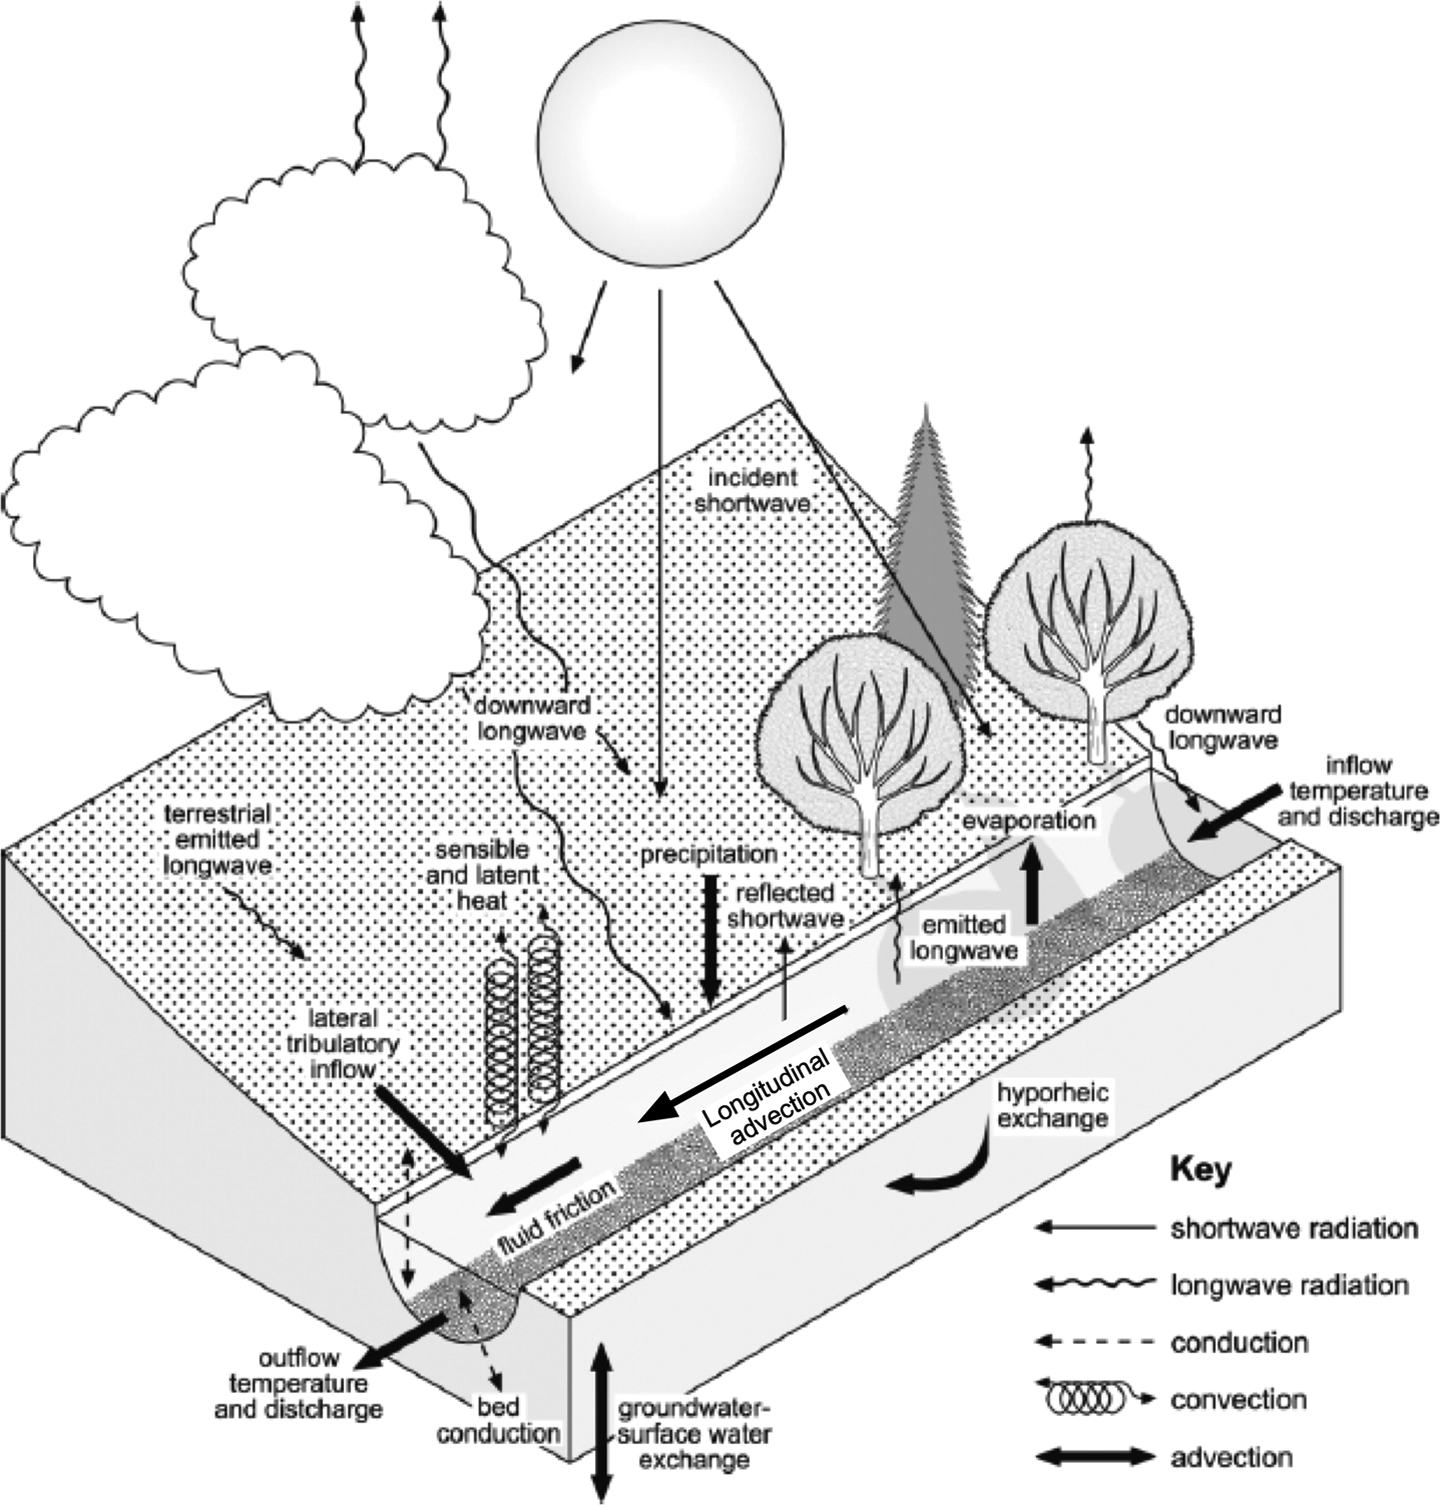
A schematic representation of the energy and hydrological fluxes controlling river water temperature.
Heat transfer within river systems is complex, occurring through a combination of radiation, conduction, convection and advection (Webb and Zhang, 1997). These energy exchanges add and remove heat to and from the river. Inputs may occur by incident short-wave (solar) and longwave (downward atmospheric) radiation, condensation, friction at the channel bed and banks, and chemical and biological processes. Losses may include reflection of solar radiation, emission of longwave (back) radiation and evaporation. Sensible heat and water column-bed energy transfers may cause gains or losses. In addition to these exchanges, energy may be advected by: in/out-flowing channel discharge, hyporheic exchange, groundwater up/down-welling, tributary inflows and precipitation. These heat fluxes may be related together using a heat budget (or energy balance) to give the total energy available to heat or cool river water (Qn
) at a given point:

where Qa is advected heat due to groundwater discharge, hyporheic exchange, precipitation, and the longitudinal advective heat flux, Q* is net radiation, Qe is latent heat, Qh is sensible heat, Qbhf is bed heat exchange and Qf is friction at the bed and banks.
Changes in water temperature (dTw) may be calculated within either an Eularian (e.g. Caissie et al., 2007; Hebert et al., 2011) or a Lagrangian framework (e.g. Gooseff et al., 2005; Leach and Moore, 2011; MacDonald et al., 2014; Rutherford et al., 2004). Within the Eularian framework, dTw is calculated as a function of time (t) (equation 2) using a reference system (i) that is fixed in space and through which water flows:
where

where W is width of the stream surface and F is river discharge.
The energy balance is a useful tool for analysis of river temperature processes (e.g. Hannah et al., 2008b; Leach and Moore, 2010; Garner et al., 2014; MacDonald et al., 2014) and for river temperature prediction (e.g. Gooseff et al., 2005; Westhoff et al., 2007; Leach and Moore, 2011; MacDonald et al., 2014). For the UK, river energy balance studies have been conducted in the chalk streams (Webb and Zhang, 1997, 1999, 2004) and regulated rivers (e.g. Evans et al., 1998) of central and southern England, and the Scottish Cairngorm mountains (Hannah et al., 2004, 2008a; Garner et al., 2014).
2 Controls and dynamics
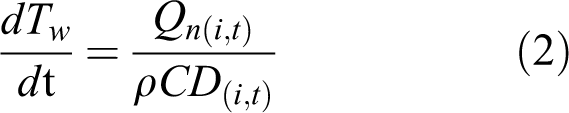
River temperature controls are multivariate and nested at macro-, meso- and micro-scales (Figure 2) (Webb, 1996). Climate drives the thermal regime in rivers and is thus the first-order control on regional patterns in the magnitude and timing of seasonal dynamics (Ward, 1985; Garner et al., 2013). Basin-wide characteristics are second-order controls; water sources, basin aspect and precipitation regime may moderate the influence of climate and thus modify the timing and magnitude of subseasonal water temperature dynamics. Reach-specific controls, which interact with the water column as it moves through the catchment, such as topographic and riparian shading, hyporheic exchanges and localized groundwater contributions, may further moderate the influence of climate on water temperature dynamics. Thus, the cumulative effect of controls at each scale produces river temperature dynamics at a given site and determines its sensitivity to climate (Figure 2).
Conceptual model of multivariate, nested controls on river temperature that interact to produce site-specific dynamics. Green text indicates controls that moderate dynamics and sensitivity to climate. Red text indicates controls that enhance dynamics and sensitivity to climate.
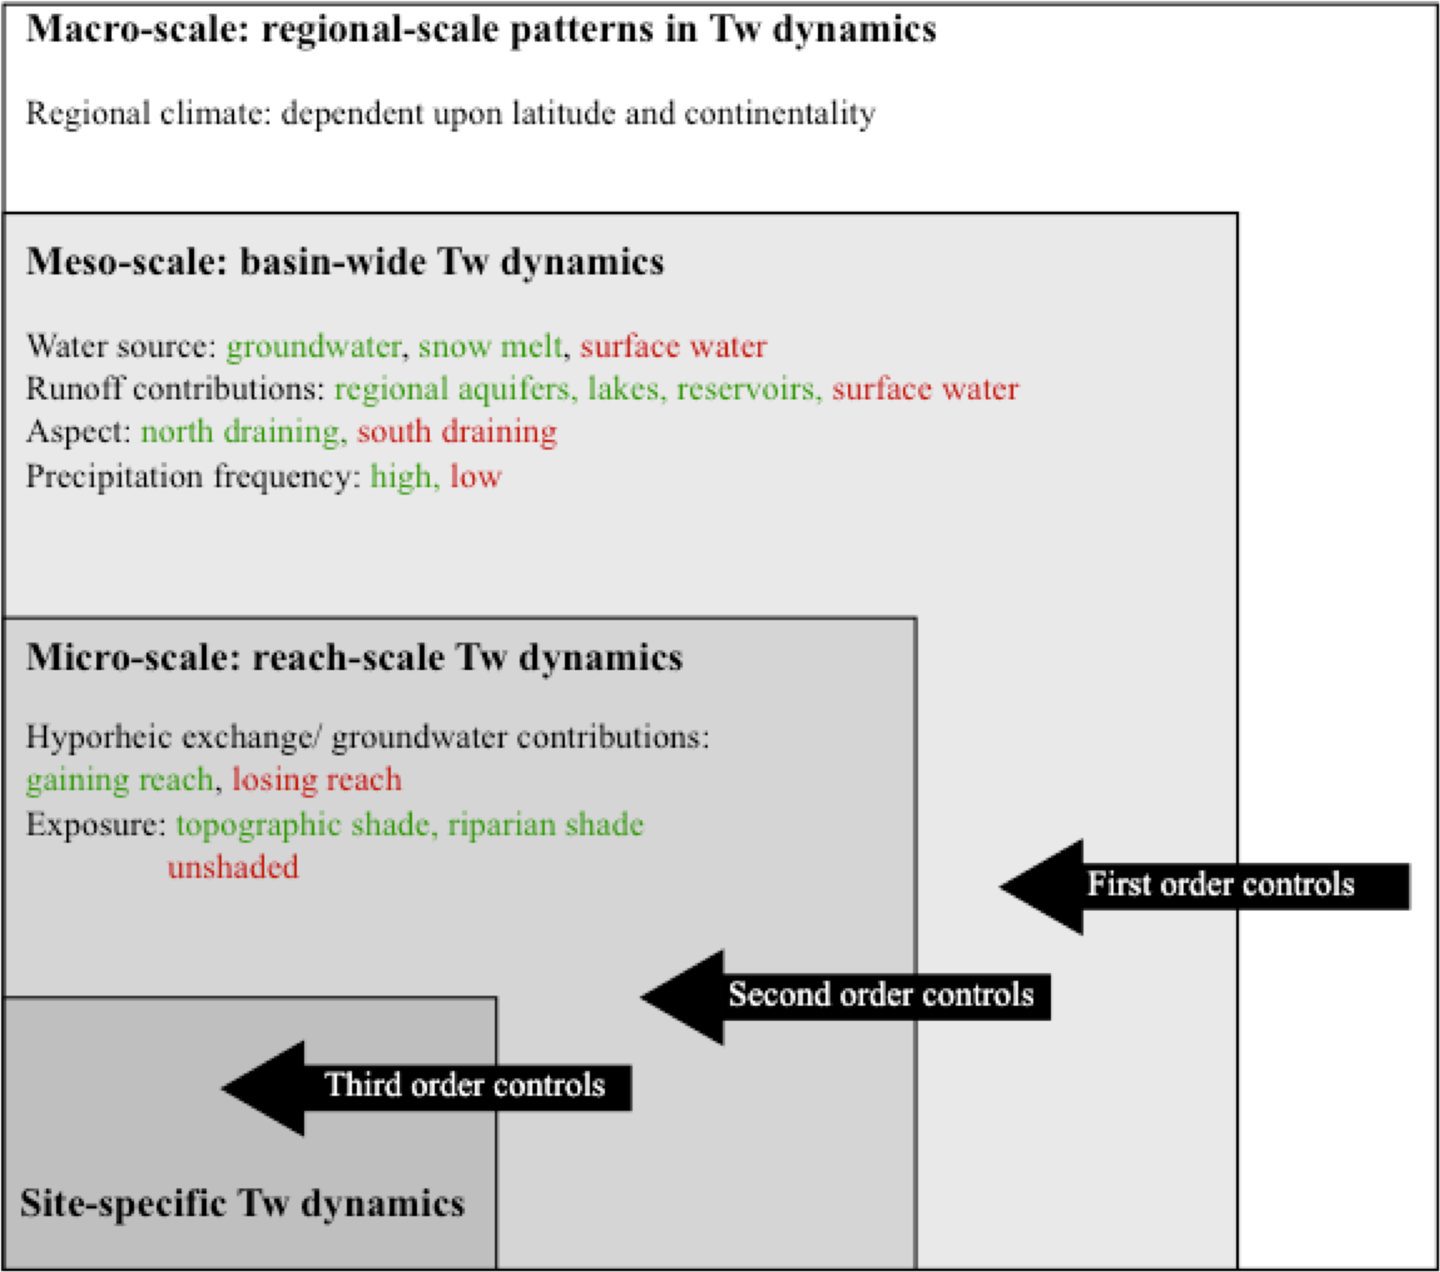
The large number of potential controls on river temperature means that it is difficult to disentangle their multivariate influence on energy exchange, hydrological processes and, ultimately, water temperature (Figure 2). However, water is typically cooler and less variable at subseasonal scales where runoff is sourced predominantly from groundwater (Figure 3) (Erickson and Stefan, 2000; Kelleher et al., 2012; O’Driscoll and DeWalle, 2006; Tague et al., 2007; Webb and Nobilis, 2007; Webb et al., 2008; Garner et al., 2013), or snow melt (Blaen et al., 2013), or where frequent precipitation maintains thermal capacity (Webb and Nobilis, 1997). At smaller scales, solar (shortwave) radiation input is reduced by channel orientation, and shading effects of topography (e.g. incised channels; Webb and Zhang, 1997) and riparian vegetation (e.g. forest cover, as reviewed by Moore, 2005). Finally, streamflow contributions from hyporheic exchange and/or localized groundwater contributions moderate minimum and maximum temperatures (Malcolm et al., 2005; Garner et al., 2014).
River water temperature at Trowbridge on Biss (BFI = 0.17) and Amesbury on Avon (BFI = 0.97). (a) Diurnal regimes for hottest seven days in 2007. (b) Diurnal regimes for coldest seven days in 2007. (c) Annual regimes for 2007. (d) Location of river temperature gauging stations within the UK. BFI denotes the Base Flow Index, which is a measure of the proportion of runoff derived from stored sources. Higher BFI values represent the more permeable catchment, i.e. higher water storage in bedrock, superficial deposits and soils.
3 Drivers of change
There are a number of drivers of change that influence controls on the energy balance and water fluxes and so river temperature. The impacts of forestry practice are the best documented and the highly variable findings are synthesized and evaluated by Moore et al. (2005), with a UK focus provided by Hannah et al. (2008a). Land-use change from riparian forest to grassland for agriculture may elevate river temperature in summer (e.g. Isaak and Hubert, 2001; Li et al., 1994). Urbanization is associated with increased river temperature compared with rural environments due to runoff of water across warmed paved surfaces (e.g. Herb et al., 2008; Kaushal et al., 2010; Hester and Bauman, 2013; Xin and Kinouchi, 2013) and channel widening/vegetation removal (i.e. exposure) to increase flow conveyance (Klein, 1979). Direct flow augmentation and abstraction change river thermal capacity, hence river temperature (Poole and Berman, 2001). Heated effluent from power plants and other point sources may have a profound warming impact (e.g. Maderich et al., 2008). The thermal effects of reservoirs are well documented for the UK, the USA and elsewhere (e.g. Webb and Walling, 1997; Olden and Naiman, 2010; and more recently Casado et al., 2013, who report increases in temperature minima and decreases in temperature maxima at a range of spatial scales).
In addition to these drivers of change, it may be anticipated that climate change will have direct and indirect impacts on river temperature. Direct effects may occur due to shifts in the energy exchange and hydrological processes that determine river temperature. For example, longwave radiation from the atmosphere, sensible heat (e.g. Ramanathan, 1981; Wild et al., 1997; Andrews et al., 2009) and groundwater temperature are anticipated to increase (e.g. Taylor and Stefan, 2009; Kurylyk et al., 2013, 2014), while groundwater contributions to streamflow (e.g. Kurylyk et al., 2014) and summer streamflow are anticipated to decrease (e.g. Cappel et al., 2013). Indirectly, river temperature may be affected by climate-induced alteration of riparian land use (Hrachowitz et al., 2010).
III What has happened?
This section reviews changes in UK water temperature over the 20th century and draws on the international literature to set this information in a wider context.
Research on river temperature in the UK has investigated (Table 1): point-scale heat fluxes that fundamentally control water temperature; reach-scale variability in the water column and riverbed; effects of forestry; spatial and temporal dynamics across river networks.
Research on river water temperature in the UK: scales, controls and processes.
This research has yielded significant knowledge about UK river temperature patterns, controlling factors and driving mechanisms. However, most previous UK studies have been: (1) restricted to the sub-basin scale; (2) short-term or seasonally constrained to summer with very few long-term year-round and multi-year studies; and (3) focused primarily on unravelling the role of site-specific factors and conditions. Consequently, there is a lack of research on spatial and temporal variability and controls on river temperature at the inter-basin to region scale and beyond over long time periods during the 20th century (notwithstanding exceptions below).
1 International studies
Internationally, long-term and wide spatial coverage river temperature studies are extremely rare because of a lack of reliable unbroken records. Most river temperature time series span only a few years (Caissie, 2006). Webb et al. (2008) reviewed the few long-term studies and comment that, despite most studies indicating warming, ‘considerable variation in the magnitude of river temperature rise is apparent between and within river systems’ (p. 910). For the USA, Webb (1996) reported trends for 90 out of 364 rivers studied from 1974 to 1981. However, when temperature data are flow-adjusted, only 29 rivers exhibit significant trends with 22 rivers warming as flows declined and 7 rivers cooling with increased flows. Interestingly, clear regional patterns related to hydroclimatological regimes did not emerge due to local effects of forestry, land use, flow regulation and heated effluent discharge (Webb, 1996). More recently, Kaushal et al. (2010) analysed data for 40 major US rivers and showed significant, long-term warming trends for 20 rivers that were significantly correlated with air temperature. Rates of warming were most rapid in urban areas, although no further detailed interpretation is provided of controls.
Webb and Nobilis (2007) conducted a landmark study of changes in the thermal regime of Austrian rivers between 1901 and 2001. Annual mean river temperatures were found to rise by up to +1.5°C over the 20th century and to track patterns in the North Atlantic Oscillation index (NAOI, i.e. a large-scale climate diagnostic based on the atmospheric pressure differential between the Icelandic Low and Azores High that is associated with heat and moisture advection across Europe; e.g. Jones et al., 1997). Similarly, Hari et al. (2006) analysed data for 25 Swiss alpine rivers to find substantial warming over the last quarter of the 20th century, with a step change in 1987 linked to the shift in the NAOI to a highly positive phase. For the East Creek in British Columbia, Canada, Kiffney et al. (2002) found the highest winter temperature to occur in El Niño years.
Attribution of warming trends to climate patterns and change is difficult. For example, Kinouchi et al. (2007) suggest that warming of spring and winter temperature for central Tokyo from 1978 to 1998 is related to increases in discharge of heated wastewater, not climate. Petersen and Kitchell (2001) demonstrate that July temperature for the Columbia and Snake rivers in the Pacific Northwest, USA, have not responded to climate shifts but rather increasing dam construction since 1930. Impoundment has been shown also to decrease mid open-water season temperature for the Lena River, Siberia (Yang et al., 2005).
Kelleher et al. (2012) investigated controls on the thermal sensitivity of Pennsylvania rivers using linear and non-linear regression and found Strahler stream order and baseflow contribution to be the primary controls. For small streams, baseflow contribution was the primary determinant of sensitivity, with greater contributions from baseflow resulting in decreased sensitivity; whereas, for large rivers, thermal sensitivity increased with stream size, explained by accumulated heat through the stream network. These findings resonate with other studies reporting the importance of groundwater in buffering climatic sensitivity of river temperature (Mohseni et al., 1999; Erickson and Stefan, 2000; O’Driscoll and DeWalle, 2006). However, small headwater streams are often forested and/or drain frozen water stores (snowpacks and glaciers) both of which factors also reduce direct climate sensitivity (Caissie, 2006). In contrast to Kelleher et al. (2012), other studies have demonstrated weaker air-water temperature associations due to increased thermal capacity and response lag times for larger downstream river reaches (e.g. Webb et al., 2003). Hence there is some, but no definitive, consensus on moderation by basin properties of river temperature sensitivity to climate-related change/variability, which suggests scale of investigation and environmental context are important.
Thus, it is evident from the international literature that variability in river temperature over the 20th century is a complex, dynamic response to climate patterns and hydrological change moderated by basin properties and anthropogenic impacts. It should be noted also that, although the majority of studies illustrate a warming trend over recent decades, some studies show river cooling (Langford, unpublished data cited by Webb et al., 2008; Smith, 1995; Arismendi et al., 2012; Isaak et al., 2012).
2 UK studies
For the UK, there are only a handful of long-term water temperature studies that mainly provide very sparse national coverage. Water temperature trends in the River Exe basin, Devon, were analysed by Webb and Walling (1992) over a 14-year study period (1977–1990) and revealed rising water temperature to match patterns in air temperature and land use (i.e. removal of riparian shade). The 1975–1976 drought distorts analyses of water temperature trends at the end of the 20th century for many UK rivers (Webb, 1996) as the low flows (reduced thermal capacity) and high energy inputs cause river temperature to peak. Such inter-annual variability raises questions about the search to detect linear trends without attribution of causes. Langan et al. (2001) analysed a 30-year record for a Cairngorm river and found no significant trend in annual water temperature, but an increase in spring and winter maxima and spring mean water temperature. These increases were attributed to a reduction in spring snow melt contributions to flow. For mid-Wales, Durance and Ormerod (2007) suggest that forest and moorland river temperature have warmed by +1.5°C and +1.7°C from 1981 to 2005, respectively, when variation in the NAOI is factored out.
To date, only two published studies (Garner et al., 2013; Orr et al., 2014) have explored long-term river temperature across the UK. Both use data from the Environment Agency Surface Water Temperature Archive (Orr et al., 2010) that spans England and Wales for the latter part of the 20th century. There is no national-scale river temperature database for Scotland or Northern Ireland. The Archive contains over 28,000 records but <50% are >10 years long (Figure 4). Most data were collected opportunistically during hydrographic or water quality sampling campaigns (Orr et al., 2014). Sensitivity analysis identifies 18 years (1989–2006) as the optimum timespan to maximize spatial network extent (Figure 5). Sampling intervals are fortnightly to monthly predominantly (Figure 6). Figure 7 displays spatial patterns in summary statistics for mean, minimum, maximum and range of water temperature at 2832 sites with >250 temperature samples between 1990 and 2007 (Cooper, 2010).
Length of records (years) for sites in the Environment Agency of England and Wales’ Freshwater Temperature Archive.
Spatial distribution of records of varying lengths in the Environment Agency of England and Wales’ Freshwater Temperature Archive.
Environment Agency of England and Wales’ Freshwater Temperature Archive mean monthly sampling frequency (1989–2006) by Environment Agency region.
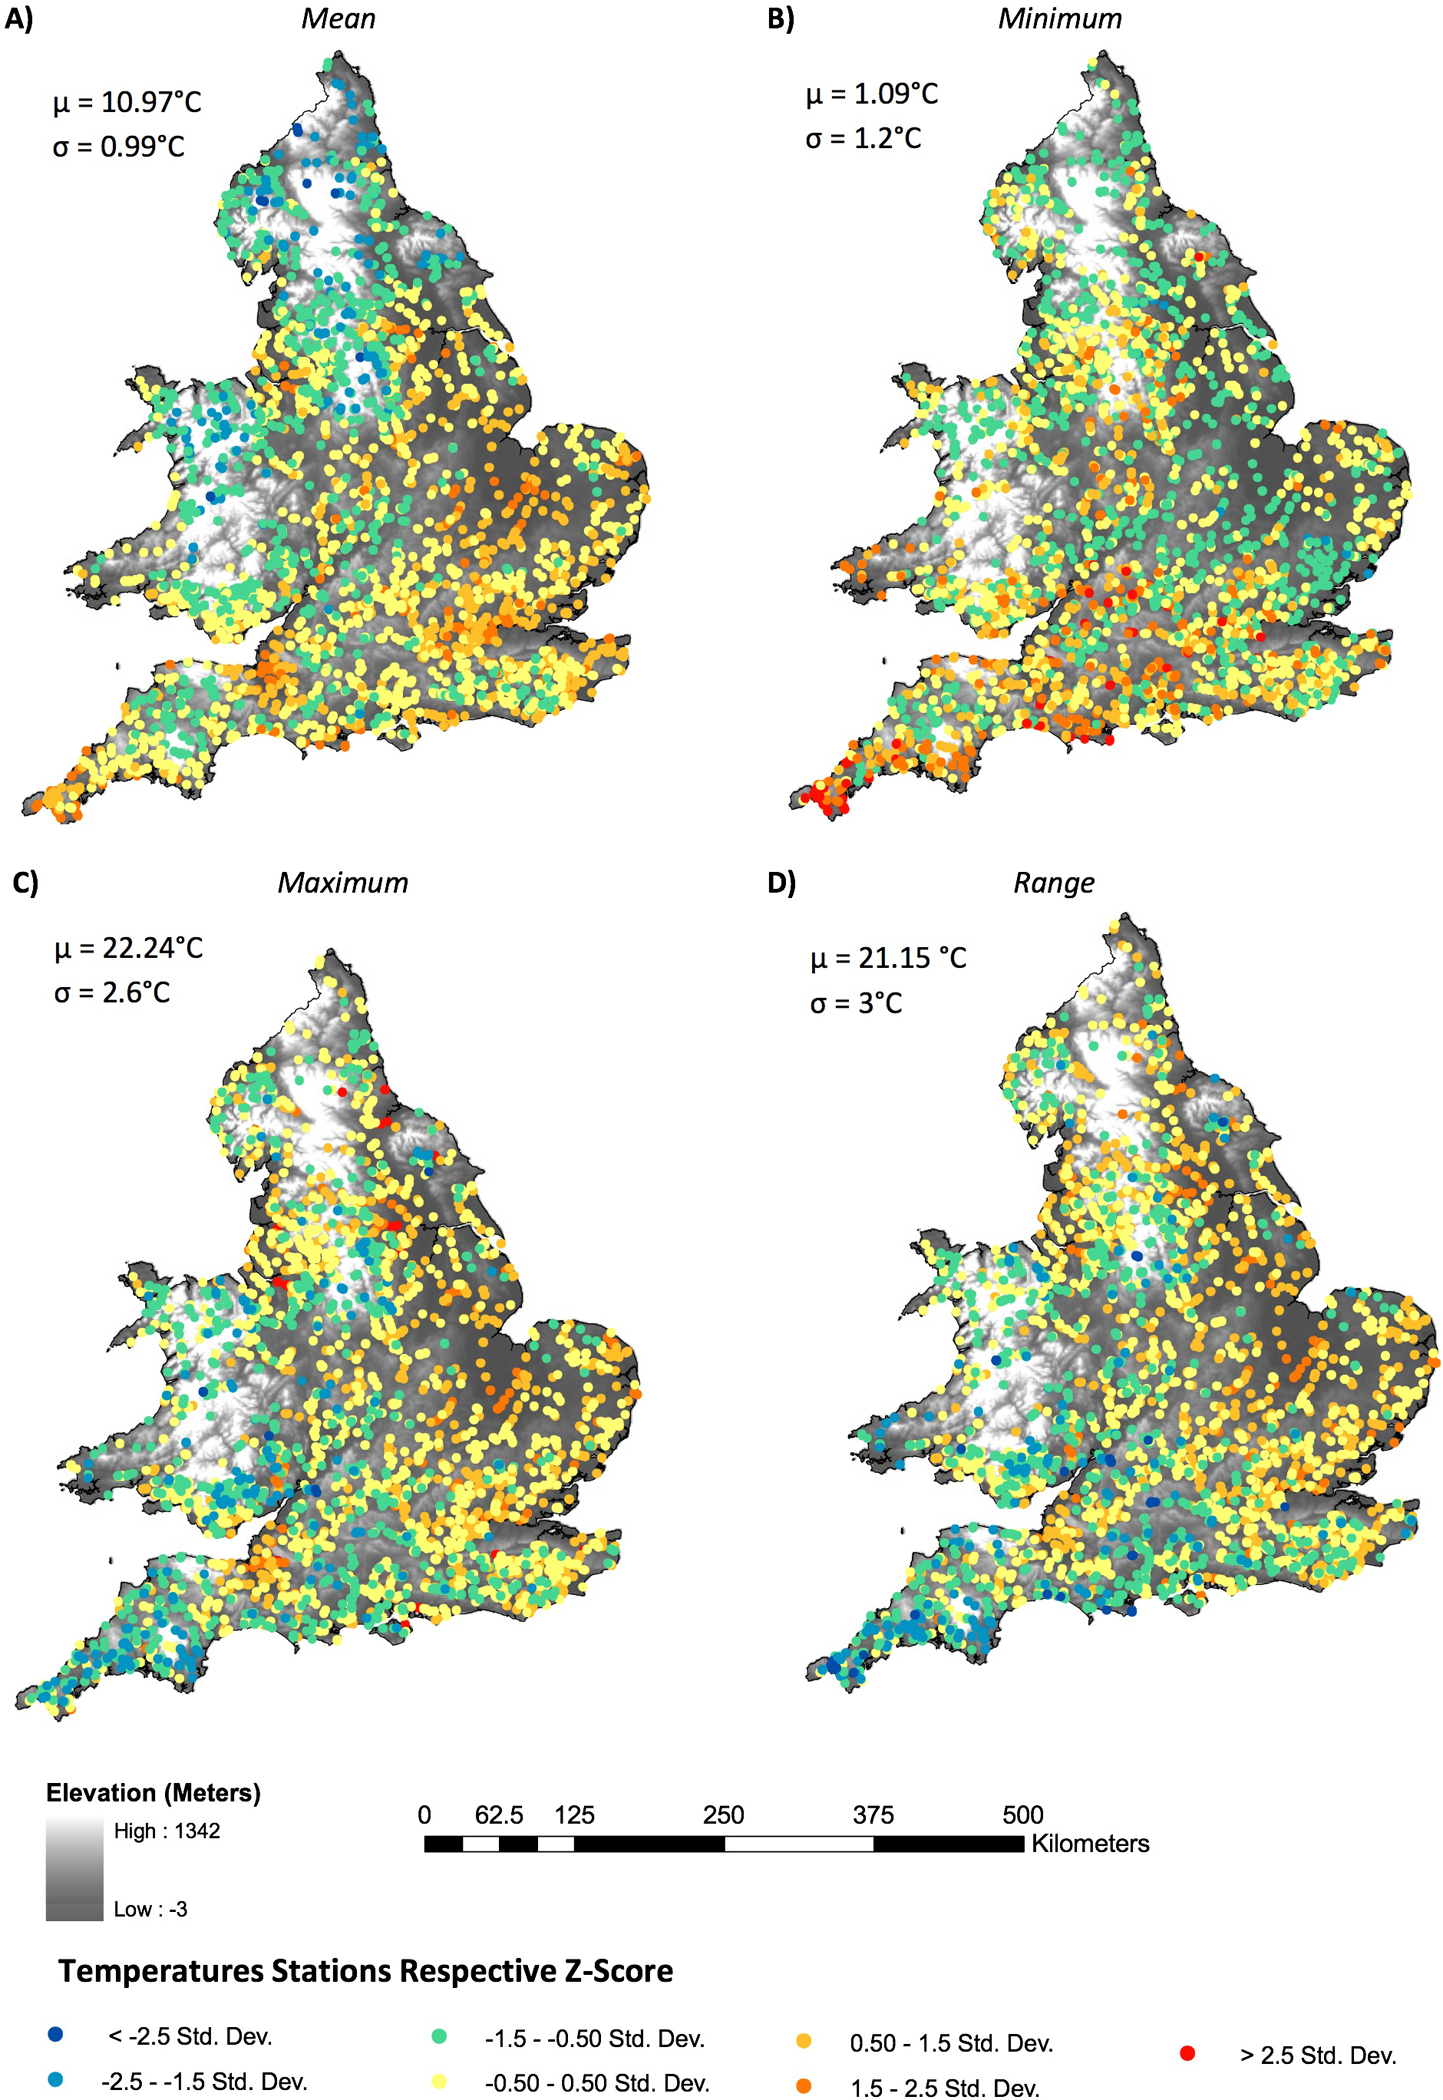
Maps of (A) mean, (B) minimum, (C) maximum and (D) range in river water temperature for 2832 sites with >250 samples between 1990 and 2007 from Environment Agency of England and Wales’ Freshwater Temperature Archive. For each variable, the England and Wales mean (μ) and standard deviation (σ) are provided as text; and each site is colour-coded by z-scores (blue for negative site z-values, below the England and Wales average; red for positive site z-values, above the average).
Orr et al. (2014) assessed temporal trends using 2773 sites from the Archive and reported significant spatial variation. However, mean annual water temperatures increased between 1990 and 2006 at an average rate of 0.03°C year-1 (Figure 8), comparable to changes in UK air temperature over the same period (as reported by Jenkins et al., 2009). Garner et al. (2013) investigated spatiotemporal variability in the shape (timing) and magnitude (size) of long-term annual river temperature regimes at 88 sites across England and Wales, and also quantified sensitivity of inter-annual water to air temperature regimes at 39 sites to infer the influence of basin properties. Four river temperature magnitude regimes were identified (Figure 9) with cooler regimes in the north and warmer regimes in the south. Central southern river temperature regimes, overlying Chalk aquifers, had reduced seasonality. River basin properties appeared to modify inter-annual air-water temperature links with climatic sensitivity the most where (1) groundwater contributions to runoff (characterized by basin permeability) were smallest and (2) water exposure times to the atmosphere (estimated by basin area) were greatest (Figure 10).
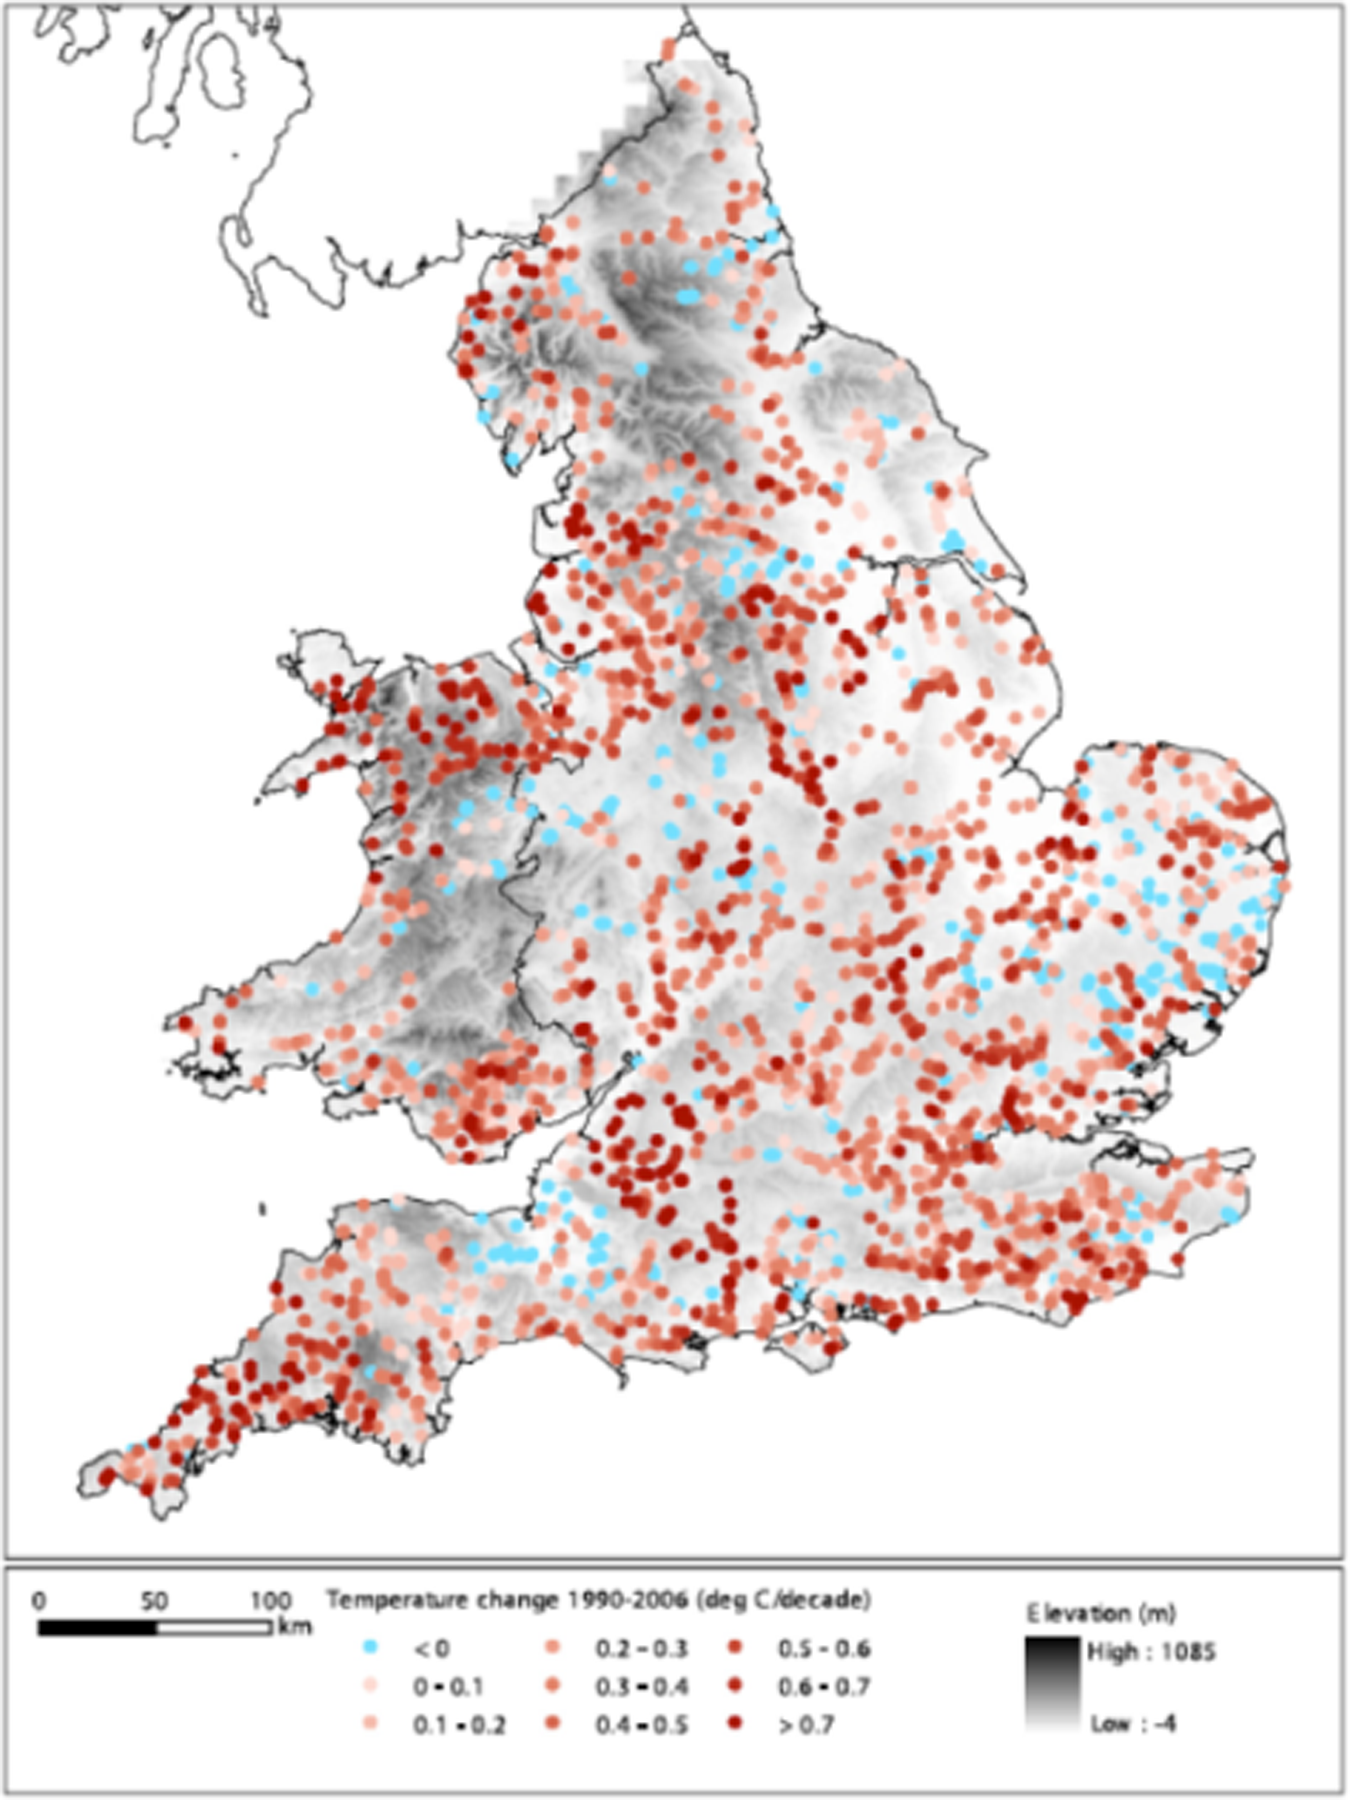
Estimated mean annual river temperature change (°C/decade) between 1 January 1990 and 31 December 2006. Environment Agency regions: NW = North West; NE = North East; MD = Midlands; WA = Wales; TH = Thames; SO = Southern; SW = South West; AN = Anglian.
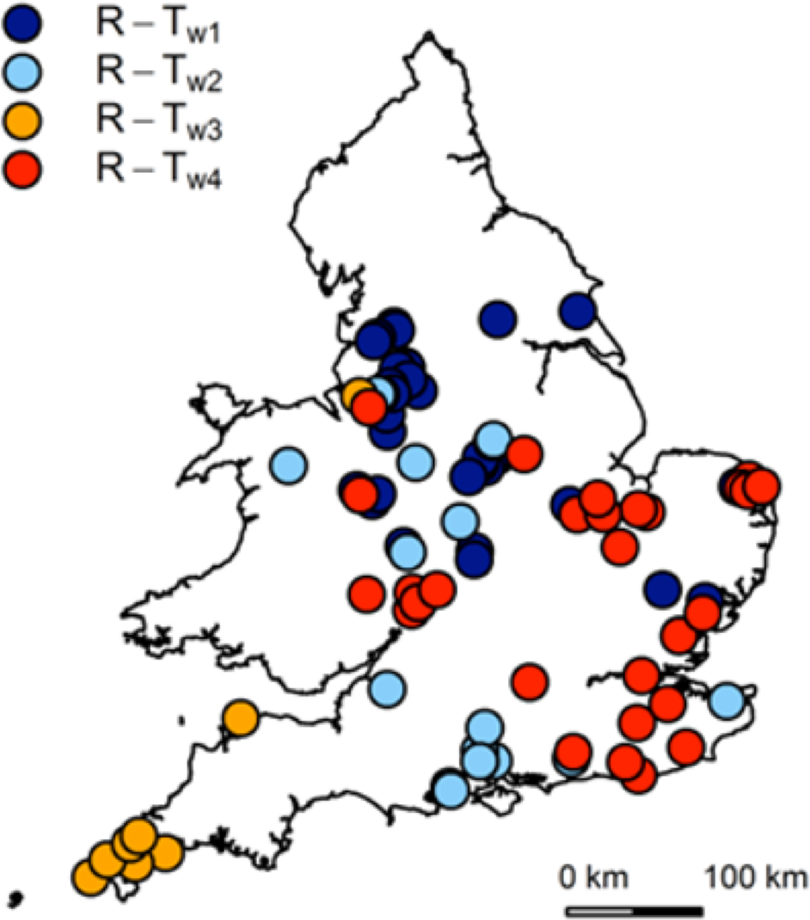
Map of England and Wales showing long-term average river water temperature magnitude regime classes.
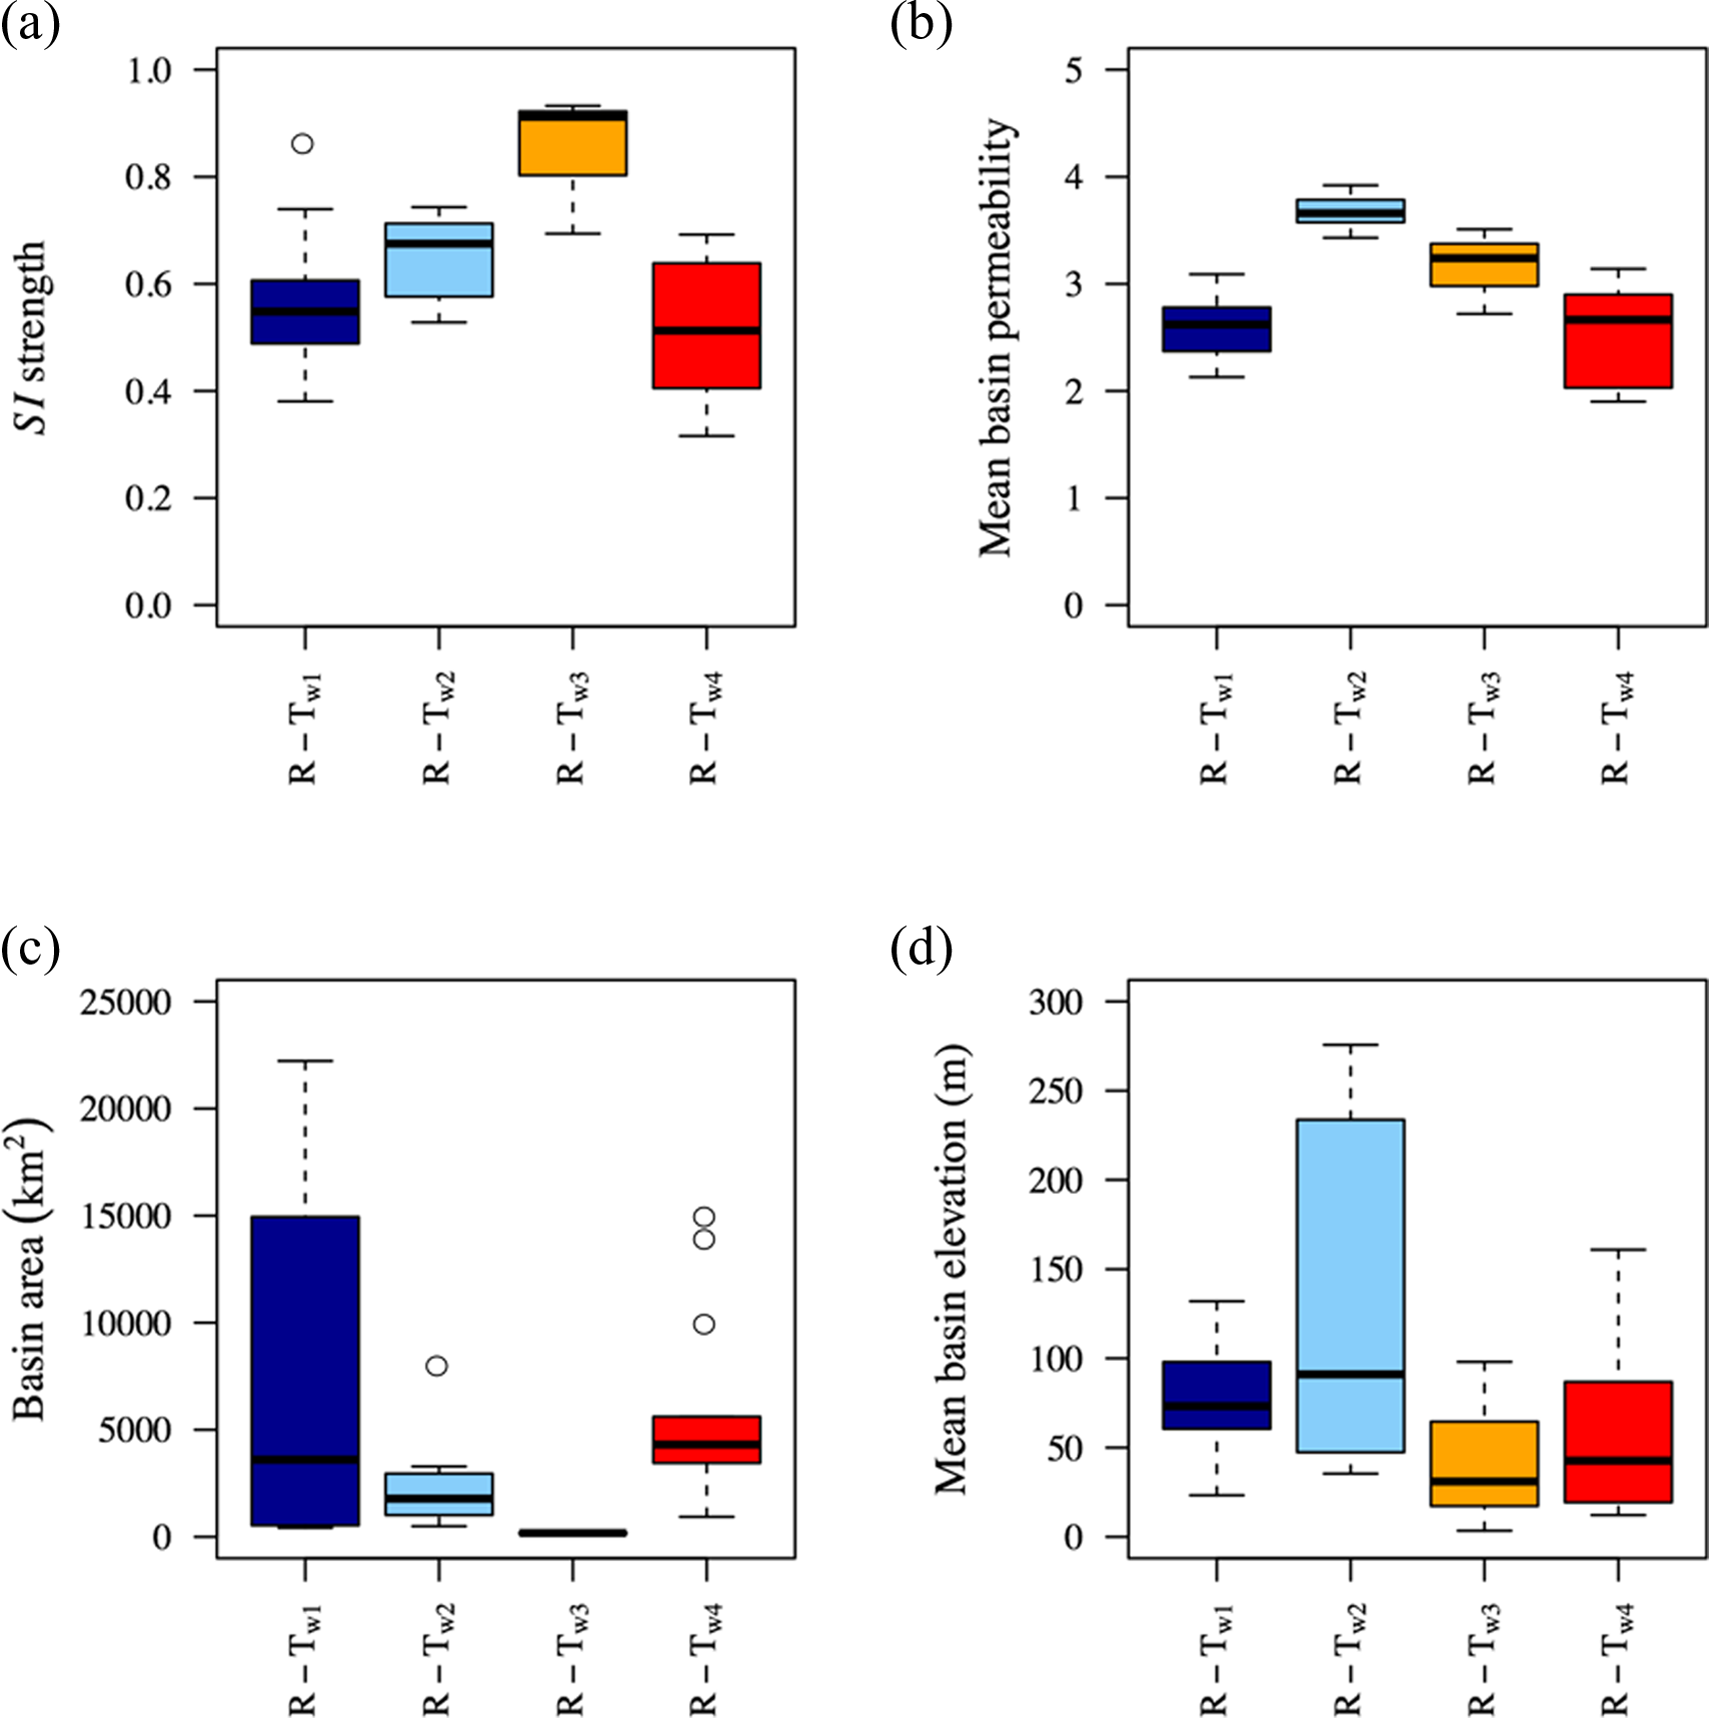
Box plots of (a) air-water temperature sensitivity index (SI) strength, (b) mean basin permeability, (c) basin area and (d) mean basin elevation for river temperature stations in each region. See Figure 7 for spatial distribution of stations by regions. SI values close to 0 indicated greater river temperature sensitivity to air temperature than those closer to 1.
IV What may happen in the future?
Climate change is expected to alter future river thermal regimes (Huguet et al., 2008); however, this is a much under-researched topic (Webb et al., 2008). Modellers of river temperature under climate change use mainly statistical associations between air and water temperature (e.g. Morrill et al., 2005; Mantua et al., 2010; studies reviewed below), although deterministic heat transport studies are emerging (e.g. Gooseff et al., 2005; Meisner, 1990; Sinokrot et al., 1995; Stefan and Sinokrot, 1993; van Vliet et al., 2013a; MacDonald et al., 2014). However, the most comprehensive work on climate-change impacts on river temperature has been conducted in North America and at coarse spatial scales.
1 International studies of future change
a Statistical models
Analyses of historical records indicate that the strength of air-water temperature relationships increase from subdaily to monthly resolution, but weaken for annual data (Webb et al., 2008) because water temperature shows less year-to-year variability than air temperature (Pilgrim et al., 1998; Erickson and Stefan, 2000; Webb et al., 2003). Thus, most predictive modelling studies concern weekly or monthly averages. For example, Mohseni et al. (2003) projected changes in river temperature for 803 locations across the contiguous USA using a non-linear air-water temperature relationship. Projections were based on air temperature from the Canadian Centre of Climate GCM for a doubling of atmospheric CO2 concentration. Mean annual stream temperature increased significantly by +3.1 ± 1.7°C on average for 764 stations, maximum weekly temperature increased significantly by +2.2 ± 1.9°C, on average, at 399 stations, and minimum weekly stream temperature increased significantly by +2.3 ± 1.1°C, on average, at 455 stations. In terms of geographical patterns, greater maximum weekly river temperature increases were observed in the southern than the northern USA. In a continental European study (Danube at Linz, Austria), Webb and Nobilis (1994) predicted an increase in monthly mean river temperature of +1.2–2.1°C for an air temperature increase of +2.3–3.4°C and a 15% reduction in flow between June and September by 2030.
At the global scale, van Vliet et al. (2011) tested the performance of a non-linear water temperature model (modified from Mohseni et al., 1998, by using daily air temperature and river flow as predictors) for 157 river stations from 1980 to 1999. Using river discharge as an input variable improved predictive power at >87% of stations (cf. air temperature alone), particularly during heat wave and low flow conditions, at stations with high winter discharges and low summer discharges, and for large rivers. Inclusion of discharge yielded modest increase in model performance for stations influenced by reservoirs or snow melt. Sensitivity analysis indicated increases in annual mean temperature of +1.3°C, +2.8°C and +3.6°C under air temperature increases of +2.0°C, +4.0°C and +6.0°C, respectively. Discharge decreases of –20% and –40% increased annual mean water temperatures by +0.3°C and +0.8°C on average, respectively; while a discharge increase of +20% reduced annual mean water temperatures by –0.2°C on average. Importantly, an increase in air temperature of +4°C combined with a decrease in discharge of –40% resulted in a greater increase in river temperature than an increase in air temperature of +6°C alone, which emphasizes the importance of considering hydrological as well as climate change.
Climate change will alter hydrology (surface water and groundwater flows) and basin/site characteristics (e.g. riparian vegetation), and so moderate river temperature (Morrison et al., 2002; Kurylyk et al., 2014). Simple air-water temperature associations, especially when air temperature is taken from sites distant from the river basin of interest, may lead to poor future predictions due to failure to capture local controls. As well as spatial differences, river temperature responses may vary seasonally with research in the north-central USA suggesting spring-summer warming may be less marked than autumn cooling (Stefan and Sinokrot, 1993). These seasonal shifts may reflect future change in influential climatic variables (see section II) and/or seasonal contrasts in the sensitivity of rivers to the effects of climate change (Webb, 1996).
b Deterministic models
Deterministic models offer great potential to incorporate local climatological, hydrological and land-use controls, and their anticipated future conditions, and model at finer spatial and temporal resolution. Gooseff et al. (2005) assessed the effects of anticipated future air temperature and solar radiation magnitude, and observed increases in the duration that water temperatures exceeded ecologically important thresholds in the lower Madison River, Montana. For a headwater tributary of the Canadian Rockies, MacDonald et al. (2014) used a coupled process-based hydrometeorological and stream temperature model forced by projected air and groundwater temperatures to investigate seasonal response of summer water temperature for the 2050s and 2080s. Projected changes in water temperature were driven by changes in riverflow as opposed to air temperature; winter and early-spring water temperature decreased by up to –1.5°C whereas late-spring and summer temperature increased by up to +1.3°C. At 0.5×0.5° resolution globally, van Vliet et al. (2013a) coupled a physically based hydrological model with a one-dimensional water temperature model to predict changes to 2071–2100 water temperature relative to 1971–2000. Mean and maximum (defined as 95th percentile) water temperatures were projected to increase by up to 1.2 and 2.2°C, respectively.
2 UK studies of future change
For the UK, there are very few predictive modelling studies of river temperature under climate change. Hence, there is scant evidence to evaluate what may happen to UK river temperature in the 21st century. At 36 UK river sites, Webb and Walling (1992) modelled a rise of +1–3.6°C in monthly mean water temperature by 2050, given a scenario of monthly mean air temperature increase of +2–3°C. The magnitude of increase was dependent on geographical location and river basin characteristics, with greater groundwater contributions and forest cover modulating responsiveness to climate change. Subsequently, Webb and Walsh (2004) modelled 27 UK river monitoring sites by incrementing present conditions (defined by applying air-water temperature relationships to a baseline annual cycle of weekly mean air temperature averaged over >5 years of record) for air temperature increases predicted by low and high warming UKCIP02 scenarios for 2020, 2050 and 2080. Results indicate that warming will be modest to very significant depending on the scenario applied; and warming will be moderated by site and basin characteristics. A comparison of four UK rivers revealed the importance of groundwater in moderating river temperature response to climate change, with surface water-fed rivers on non-calcareous lithology more responsive (+1.8–3.6C) than spring-fed, chalk rivers (+1.1–2.2 C) to an increase of +2–4 in monthly mean air temperature (Mackey and Berrie, 1991).
Van Vliet et al. (2013a) (see section IV,1,b) performed the only process-based assessment of future water temperature that includes the UK to date. Maximum warming of between 1.2 and 1.4°C was predicted for mean water temperature between 2071 and 2100. However, increases in maximum temperature, spatial and seasonal variation throughout the UK were not reported. Furthermore, the 0.5×0.5° resolution of the model did not represent the effects of finer-scale hydrological and land-use controls; consequently, the spatial patterns in future river temperature may differ from those projected for driving climate variables (e.g. Webb and Walsh, 2004).
V Conclusions and knowledge gaps
In addition to existing drivers of change, it may be anticipated that climate change will have direct (i.e. shifts in the energy exchange and hydrological processes; see section II) and indirect impacts on river temperature (e.g. riparian land use, human response to reduced water security). Therefore, improved understanding of (1) sensitivity of river temperature to climate and other drivers of change (based on 20th-century records), and (2) possible future river temperature change (based on projections for the 21st century) is critical to inform management and adaptation strategies in the UK and elsewhere.
Most UK river temperature investigations have been restricted to the (sub-)basin scale and by relatively short observational records. Consequently, there is limited knowledge of spatial and temporal variability of, and the controls on, river temperature at the inter-basin to regional scale and beyond over long time periods during the 20th century. There is a medium level of agreement (and as likely as not) that UK river temperature increased in the latter part of the 20th century, but low agreement on the attribution of these river temperature changes to climatic warming because river temperature is a complex, dynamic response to climate and hydrological patterns moderated by basin properties and anthropogenic impacts (see section III). Uncertainties exist over past changes related to historical river temperature data (e.g. irregularity of sampling, differences in instrumentation, variable measurement bias), different timespans of different authors’ analyses, and patchy spatial coverage of the UK.
Literature is scarce to evaluate what may happen to UK river temperature in the 21st century. Based on a meagre UK evidence base and research conducted elsewhere, there appears a good level of agreement (and as likely as not) that UK river temperature will increase in the 21st century (see section IV). That being said, there are a number of interlinked sources of uncertainty that mean estimating rates of temperature change for rivers across the UK with confidence is beyond current knowledge. As well as scenario uncertainties, there are uncertainties about future interactions and feedbacks between climate, hydrology and basin/site properties (e.g. riparian land use, management human response) that may cause river temperature patterns to diverge from those projected for climate drivers.
From this review, a number of priority knowledge gaps are emergent that include: establishing a UK-wide monitoring network to collect long-term records with nested spatial coverage and including benchmark near-natural river basins; gathering metadata to provide information on site-, reach- and catchment-scale specific conditions that influence river temperature; robust analysis of existing UK data (including collation of data from sources not currently in the Environment Agency Surface Water Temperature Archive) to detect river temperature change and account for confounding effects and inconsistencies in sampling resolution, length of time series, and spatial bias in site locations; better understanding of space and time scales of river thermal heterogeneity; systematic attribution of river temperature patterns to drivers of change; quantification of river temperature sensitivity to drivers of change, including comprehensive assessment of climatic sensitivity; improved future projection of river temperature change accounting of sources of uncertainty.
Addressing these research needs will improve understanding of past, contemporary and future river temperature change in the UK and internationally.
Footnotes
Acknowledgements
We are grateful for the comments of an anonymous reviewer, which improved the manuscript.
Funding
This work was funded by the UK Department for Environment, Food and Rural Affairs (DEFRA) (project WC1052) and supported by the Natural Environment Research Council and the Environment Agency.