
Abstract
I review research strategies, designs, methods and data in financial geography, by focussing on 449 articles published in 2001–2020. The analysis shows considerable methodological diversity and originality, contributing to geography and studies of finance. Over time, qualitative strategies, case study design and interviews as a method and data source are growing, while quantitative strategy, longitudinal design, regression methods and the use of government data are declining. The analysis helps identify gaps, opportunities and challenges, including the need for more methodological transparency, more in-depth qualitative and quantitative approaches supporting causal analysis, and a more ambitious historical and geographical scope.
I Introduction
Many of us can confess to skipping methods sections when reading papers, and when writing papers, keeping these sections as short as possible in order to save the wordcount. At the same time, deep down we know that methods are fundamental for the quality of research, just as what happens in the kitchen is crucial for what can be enjoyed in the dining room. This realisation is reflected in many articles and progress reports devoted to methods in human geography, whether quantitative (Johnston et al., 2019) or qualitative (Hitchings and Latham, 2020). Out of 14 reports on financial geography published thus far, however, only one mentions methods (Leyshon, 1998).
The goal of this last of my three reports is to review patterns and trends concerning research strategies, designs, methods and data in financial geography. To define these terms, I follow Bryman, 2015 who distinguishes between three strategies (quantitative, qualitative and mixed) and five designs (case study, comparative, cross-sectional, longitudinal and experimental) as fundamental frameworks for collecting and analysing data in social research. Methods represent a longer and growing list of techniques, which can fall into various strategies and designs. Interviews, for example, can be part of a qualitative or mixed research strategy. Statistics – quantitative or mixed. Both interviews and statistics can serve any of the five research designs. This approach is important since the use of the terms related to research strategy, design and methods can vary. Clifford et al. (2016), for example, refer to case study as a research strategy, and hardly mention research design.
To conduct my review, I used Web of Science to identify all articles (other than editorials) that contain terms finance or money (and their variations like financial or monetary) in keywords, published between 2001 and 2020 in geography, urban studies, and regional and urban planning. Management or sociology are not included in order to stay as close as possible to financial geography. The resulting list of 984 articles, was reduced to 449, to only include those cited at least 10 times as of the end of May 2021. Cited almost 17,000 times in total, the selected papers account for approximately 90% of all citations of the full sample. The sample articles were published in 35 different journals, with Geoforum, Journal of Economic Geography, Housing Studies and Regional Studies accounting for 30 or more each. The review is limited to publications in English. All these works focus on finance and space, and thus fit a broad definition of financial geography, although the authors themselves may not label them as such. I reviewed all papers and coded them as belonging to one of the three strategies and one of the five designs. In addition, for each paper, I have recorded the use of up to three methods and up to three types of data. Given the brevity of the report, I will focus on broad patterns and trends, with examples of best practices and methodologically exceptional works, rather than a detailed quantitative analysis of the sample. To frame the analysis, references will also be made to work from outside the sample. The report will start with general remarks on the approach to methods in financial geography, followed by an analysis of diversity and gaps. Next, I will discuss trends and data, before concluding. Though Progress reports are supposed to focus on the latest research, here I take the liberty of adopting a longer view of methodological development in geographical research about finance.
II Methodological shyness
Financial geography appears methodologically shy. While 55 papers (more than 12% of the sample) do not contain any empirical analysis, only one of them pays significant attention to methods, as applied to the financialisation of nature (Ouma et al., 2018), with all the rest focused on theory. In the whole sample of 449 the word method never features in the title, appears once in keywords (Desforges, 2001), and 27 times in the abstract. There is no standard of reporting on research strategy, design, methods and data. These are mentioned in the introduction, in a separate section, in a footnote or not at all. While different conventions regarding methodological disclosures are understandable, leaving the readers to identify or guess methods entirely by themselves is definitely bad practice.
An important example of methodological issues concerns case studies. While some articles are devoted to one in-depth example without using the term ‘case study’, others refer to brief examples as case studies. A case is often mentioned without the term ‘study’. The specific type of case study (including critical, extreme, revelatory and exemplifying) is hardly ever explained, though it can be inferred that most are of exemplifying nature. There are positive exceptions. Rolffs et al. (2015) offer a detailed 3-page long methods section explaining a mix-method case study of payment plans and strategies for solar energy in Kenya. Guironnet et al. (2016) justify the case study selection and method applied to financialisation of property markets in the Paris city-region, while Cocola-Gant and Gago (2019) explain the use of surveys, interviews and participant observation in a mixed-method case study of Airbnb buy-to-let investments and tourism-driven displacement in Lisbon. Bracking (2015) elaborate on the use of participant observation in Green Climate Fund board meetings as a ‘keyhole case study’.
Methodological opacity is most common in qualitative, less so in mixed, and least in quantitative studies. Articles using regression or network analysis, in particular, all present data and methods in more or less detail. One of the dangers of this pattern is that it may (unjustly in my view) give an impression that qualitative studies are somewhat less systematic, with less work involved and less robust evidence.
III Diversity and gaps
The matrix of research strategies and designs, 2001–2020.
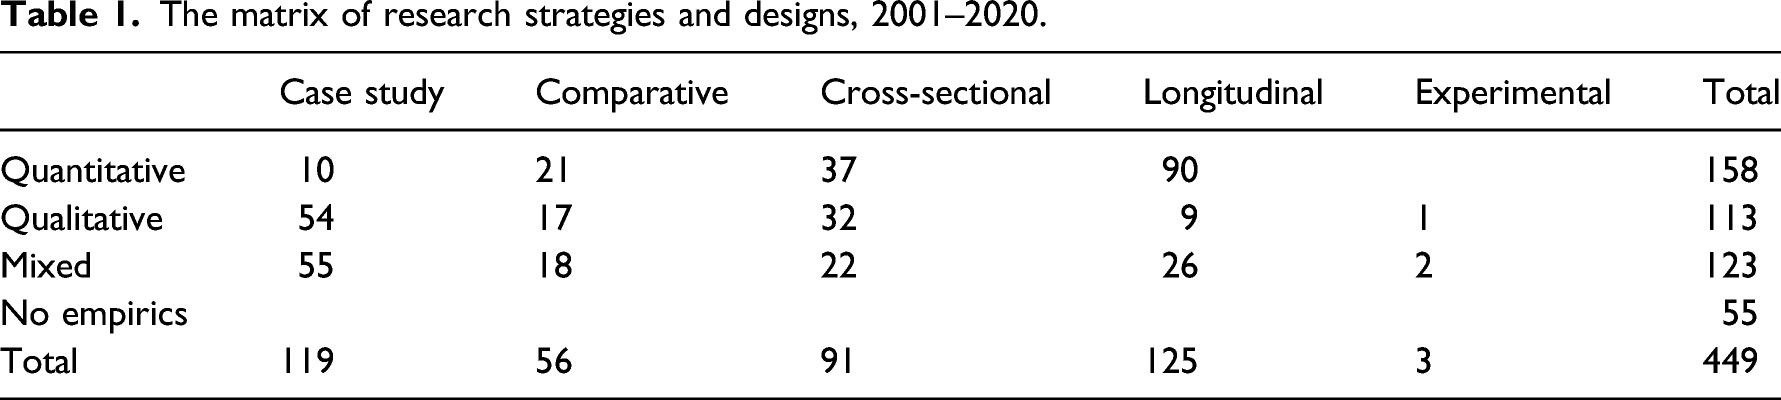
Nearly 60% of quantitative studies are longitudinal, focussing on the evolution of finance-related phenomena over time. However, contrary to what might be expected, only a third of quantitative studies use any form of regression analysis. Journals most often publishing papers with regressions are Regional Studies and Journal of Economic Geography (see e.g. Valverde et al., 2007 and Fingleton et al., 2015 for examples). Only two articles in the whole sample develop mathematical models, both published in Regional Science and Urban Economics (Buettner, 2001; Coates and Humphreys, 2003). Of course, this paucity is influenced by the fact that the sample does not cover the broad field of economics. The majority of quantitative studies focus on descriptive statistics, reflecting their exploratory nature. When using creative combinations of data these studies can be highly cited. Consider, for example, Martin’s (2011) work on local geographies of the financial crisis, showing patterns and correlations concerning mortgages, housing and employment or Aalbers (2009) on European housing, mortgages and securitisation.
Network analysis is found in only nine papers, using data on office networks (Bassens et al., 2010; Taylor et al., 2002), individuals (Bassens et al., 2011; Carroll et al., 2010; Heemskerk et al., 2016), projects (Siematycki, 2011) and transactions (van Meeteren and Bassens, 2016). Quantitative surveys are extremely rare (Ali et al., 2017; Zhao et al., 2004). The use of methods from financial economics is also extremely rare, though we should remember that when geographers use such methods, they can also publish in economics journals, not covered here (see e.g. Ioannou et al., 2021). One interesting example of such analysis in geography journals is Mathur (2013) on the net present value of land use projects.
The use of maps that serves analytical purposes rather than just illustration is rare, but with important exceptions. Leyshon et al. (2008) use GIS and primary data on bank branches to map financial exclusion in Britain. Morrison and O’Brien (2001) map the effects of bank branch closures in New Zealand; Romainville (2017) the financialisation of housing in Brussels; Davis et al. (2017) the residential land values in Washington DC based on proprietary data. Interestingly, the map of the world is hardly ever used, reflecting the paucity of empirical studies with global scope (see Haberly and Wójcik, 2015 for one of few exceptions).
Moving on to qualitative studies, about half of them use interviews as the main method. The second most popular main method, used in a third of these studies, is document analysis, referring to content analysis of documents other than academic papers or interview transcripts. With few exceptions (e.g. Langley, 2016) the term discourse analysis is not used. Participant observation is rare, used only in 10 articles as the main method, and another 10 as a secondary method. In a rare example of participatory and action research, Hodkinson (2011) became a community advisor to a tenants’ association in Leeds investigating the impact of private finance initiatives. In a less intensive application, Langley (2016) participated in and observed crowdfunding industry events in London. In a rich design, including interviews and a questionnaire, Feliciantonio (2017) participated in squatting initiatives in Rome.
Qualitative methods other than interviews, document analysis or participant observation can be found in fewer than 10 papers in total. Fields et al. (2010) use focus groups of home-owners facing foreclosure; Kim and Warner (2018) use focus groups of local government officials at national conferences. Coppock (2013) uses household diaries. Datta (2009) surveyed migrants in London on how they cope with financial exclusion and manage financial risks. Borch et al. (2015) apply rythmanalysis to open-outcry and high-frequency trading. In rare examples of visual analysis, Simpson (2014) uses photos of Macau to analyse the Chinese imaginary of the city, while Engelen and Glasmacher (2013) analyse websites of promotional agencies of financial centres. Simon et al. (2012) use meta-analysis to review the results of empirical literature on cookstoves and carbon finance. Perhaps financial geography has not reached the critical mass to justify more meta-analyses, but there is clearly scope for financial geography to use a wider array of qualitative methods.
Although the word triangulation does not feature in any title, keyword or abstract, the popularity of mixed methods reflects the spirit of triangulation in financial geography. Most studies in this group combine interviews with descriptive statistics, and sometimes with document analysis. 29 papers actually use at least three major methods. In a study of the minerals-energy complex in South Africa, Baker (2015) uses 80 semi-structured interviews, analysis of policy and legal documents, media articles, and speeches, site visits, attendance at conferences, as well as quantitative data from industry and corporate reports. August and Walks (2018) studying gentrification and financialisation of rental housing in Toronto draw maps using a dataset on housing, which they compiled themselves from private and public sector sources; content analysis of corporate annual reports, media reports and websites; and interviews with stakeholders. Triangulation can also be found within qualitative studies. For example, Gillespie (2018) in a study of collective self-help housing in Accra draws on interviews, participant observation and analysis of public and private sector documents. Triangulation can also happen across papers. For example, a longitudinal regression-analysis study on the role of proximity in the supply of venture capital in Germany by Fritsch and Schilder (2015) draws on their earlier interview-based study, while Clark and Monk (2017) draw on participant observation, interviews and analysis of legal documents and financial data in the institutional investment arena.
The rarity of experimental design is underscored by the fact that two of the three examples of these studies come from the Global Environmental Change journal. Patt et al. (2010) use role-playing games with farmers in Ethiopia and Malawi to analyse and improve their understanding of insurance. Gampfer et al. (2014) use a survey-based conjoint experiment in the US and Germany to identify design characteristics of North-South climate funding more likely to garner public support. (Thomas et al., 2018) use gaming simulations, alongside meta-analysis, interviews and document analysis, to examine the transferability of transit-oriented development in the Netherlands. The paucity of experimental studies may be related to little theoretical and empirical focus on behavioural geography and the topic of risk. Combined with a lack of modelling, it also leads to the lack of predictive analysis. Brexit, as a quasi-experiment, with major influence on financial centre development and other financial geographical topics, should create incentives for such research.
IV Trends
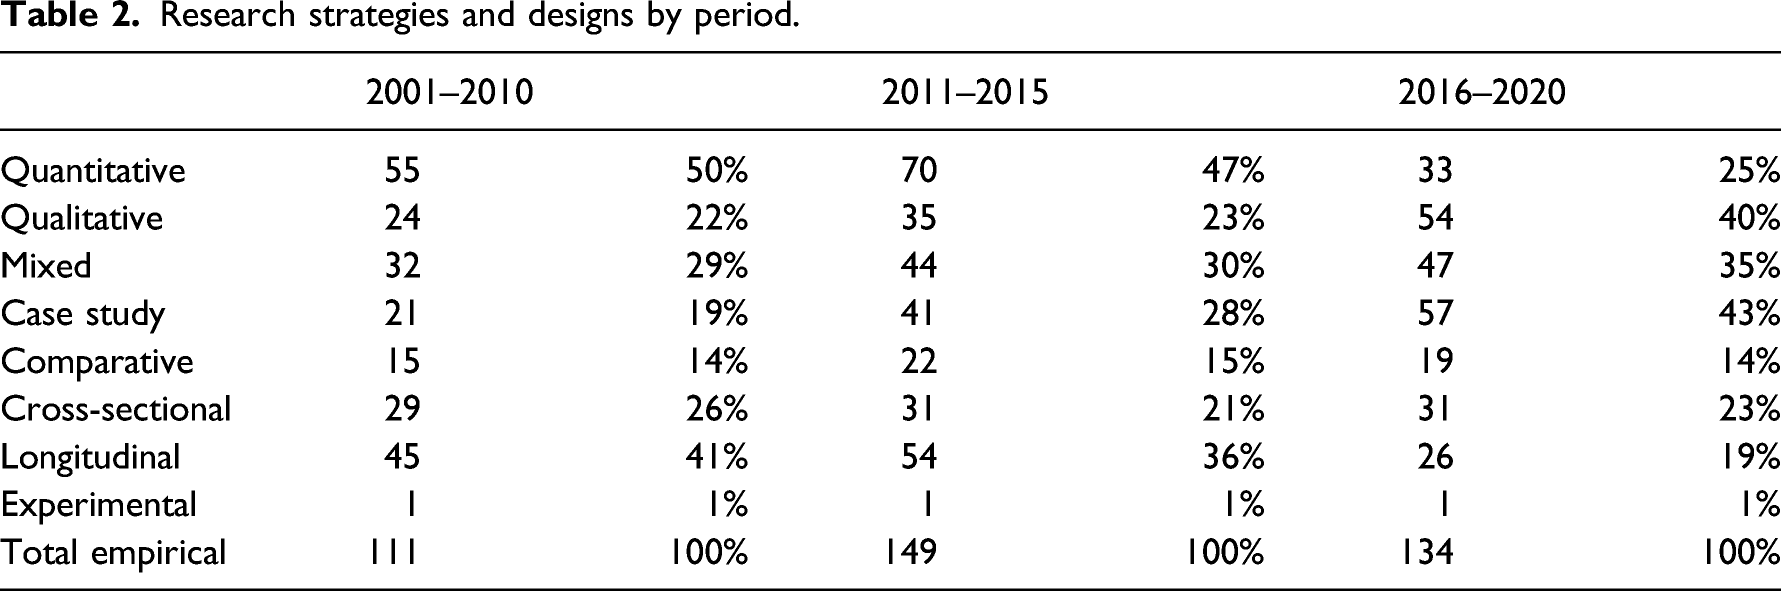
Research strategies and designs by period.
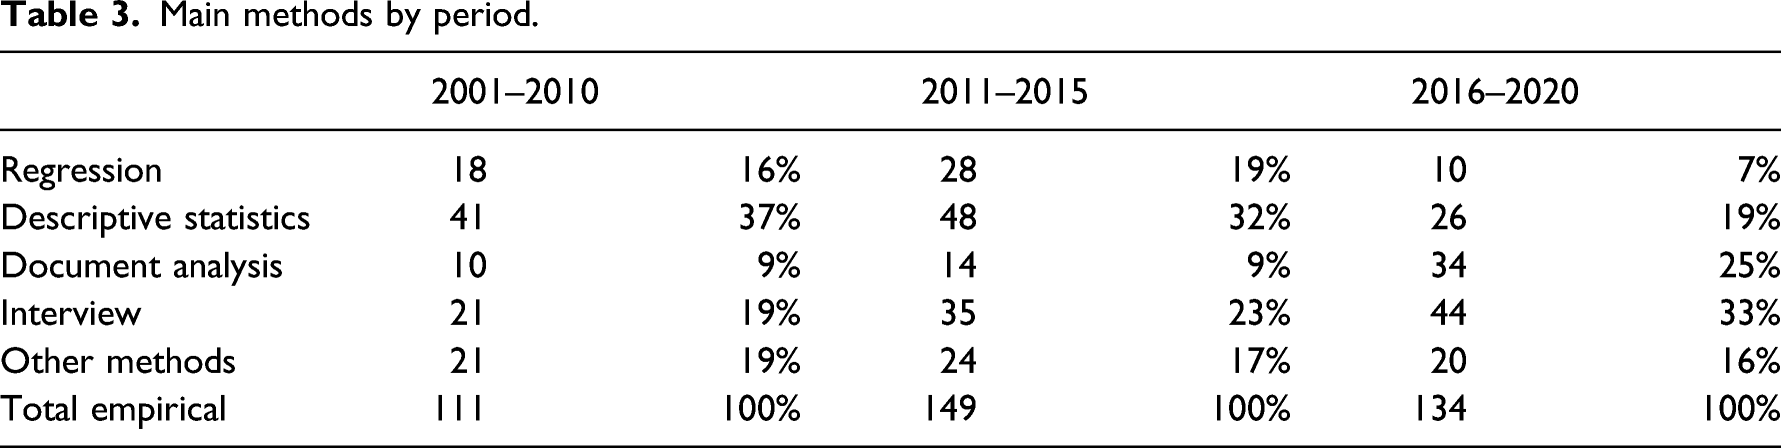
Main methods by period.
These trends can be explained partly by the rise of studies concerned with financialisation, identified here broadly as papers mentioning the term in the title, keywords or abstract. Their share in the total number of articles rose from 10% in 2001–2010 to 20% in 2011–2015; and over 50% in 2016–2020, when they contributed two-thirds of all mixed studies and case studies in the sample, and a third of quantitative and longitudinal studies. This shows that while mixed-methods case study is the most popular approach within financialisation studies in financial geography (e.g. Savini and Aalbers, 2016), quantitative and longitudinal studies on financialisation are also common (e.g. Wijburg and Aalbers, 2017), and include regression analysis (Dewilde, 2018).
The rise of qualitative research can be seen as positive contribution of financial geography to studies of finance as a whole, given that the latter are dominated by quantitative research. Bemoaning this state of affairs in finance, Kaczynski et al. (2014: 127) say ‘imagine the benefits to finance if we expand our empirical sources of data to include what people have to say, which then allows us to explore the complex reasoning behind these conversations’. Financial geography certainly helps address this deficit.
On the other hand, the trends raise some concerns. One is the declining empirical scope of research. Fewer than 5% of articles in the sample venture empirically beyond one continent. Even fewer studies are global in scope. Exceptions include Taylor et al. (2002) on world city network, Heemskerk et al. (2016) on interlocking directorates, Derudder et al. (2011) on banking centres and Lizieri and Pain (2014) on office investment. My research on offshore finance (Haberly and Wójcik, 2015), investment banking and financial centre development (Wójcik et al., 2018) and corporate control (Haberly and Wójcik, 2017) makes me biased towards research with global scale. However, I would argue that with so little of it we miss global patterns and trends, and opportunities for addressing the global nature of many problems, like the environmental crisis.
On a note related to the empirically inward-looking research, hardly any papers on China ever compare China with other countries or put it in a global context. A few exceptions include Lim, 2010 on China’s growing geo-economic influence, Dunford and Yeung (2011) on global income convergence; and Wójcik and Camilleri (2015) on China in global financial networks. In contrast to many cross-European studies, cross-national studies for Africa, Latin America or Asia are almost non-existent. In this context, efforts to improve the comparability of case studies are welcome. See Fernandez and Aalbers (2020) on financialisation in the Global South as an example.
V Data
The patterns and trends described above are reflected in the types of data used and their change over time. Interviews have become the main source of data in financial geography, with 100 papers using them as the main approach, and 43 as a secondary method, accounting for about a third of all empirical papers. 82% of papers using interviews as the main method rely on expert/elite interviews only, often referring to Clark’s influential work on ‘close dialogue’ (1998). The experts work in the private or public sector in big cities, and are predominantly male.
Few papers used non-elite interviews only. Coppock (2013) interviews households in rural England; Wainwright and Kibler (2014) prospective retirees in London; Smith (2015) homebuyers in the UK; Hall (2016) families affected by recession in North-East England; Fields (2017) tenants in Bronx; Lai (2017) investors attending financial literacy events in Singapore. Five out of these six papers are by female authors. A dozen more papers include non-experts/non-elites in their interviews. Examples include Rankin (2008) interviewing participants in microfinance organisations in Nepal and Vietnam; Appleyard (2011) clients of community development finance institutions in the UK; Zapata (2013) labour migrants from Colombia in London and their remittances; Harker (2017) families in Ramallah, Palestine; Ash et al. (2018) the users of high-cost short-term credit websites in the UK; and Asiyanbi (2018) forest communities in Nigeria affected by REDD+.
With one exception, all papers using non-elite interviews were published after 2010, which is a welcome trend. There is nothing wrong with talking to experts. Finance is technical, and identifying patterns in its complexities requires a lot of insight (Christophers, 2009). However, the degree of focus on elites and experts reflects a bias towards studying financial production and intermediation and against consumption. As an epistemic community, financial geography has to tune in more to experiences and narratives of others than elites and experts.
Government data, of national and sub-national varieties, comes as a close second after interviews, used in 120 papers, but with the share of papers using it falling from 40% in 2001–2010 and 2011–2015 to 20% in 2016–2020, reflecting the decline of quantitative studies. Policy documents come third, used in three papers in total, and have been on the rise, as a popular data source for case studies. Industry and media reports follow, used in 25 and 24 papers, respectively, with a steady use of the former, and the rise of the latter. Next in popularity are data from inter-governmental organisations with the IMF, World Bank and OECD in the lead. The total of only 17 papers using such data is surprisingly low, and related to the dearth of studies with international or global coverage.
All other types of data sources are used by fewer than 10 papers. Corporate datasets are rarely found, with exceptions including the use of Amadeus (Romainville, 2017), Bloomberg (Bassens et al., 2013), Bankscope (Karreman, 2009), Dealogic (Wójcik et al., 2018), Thomson (Dupuy et al., 2010), Orbis (Galaz et al., 2018) and Preqin (Knight and Sharma, 2016; O’Neill, 2019). Access, while expensive, cannot be a sufficient excuse, given that dozens, if not hundreds of universities globally subscribe to such sources. Publicly available central bank data is also rarely used (see French et al., 2009; and Lapavitsas and Powell, 2013 for exceptions), not to mention data from the Bank for International Settlements. Archival analysis of financial centres in the mid-18th century is the only paper in the sample focussing on data prior to 1950 (Flandreau et al., 2009). On the other end of the historical spectrum, financial geography needs more engagement with digital geographies and big data. One exception here is Zook and Blankenship (2018) analysing public postings by the creator of Bitcoin. Other examples of creative data sourcing include Hall and Appleyard (2009) using financial business course handbooks, Crosby and Henneberry (2015) using tribunal and court cases on property valuation, and Muellerleile (2013) analysing US congressional hearings on derivatives markets.
VI Conclusion
What do the above patterns and trends tell us about the evolving quality of financial geographies? A wide range of strategies, designs, methods and data applied certainly paint a picture of considerable diversity and creativity. In a manner characteristic of geography more broadly, we seem to be willing to hit the nail with whatever hammer is available and appropriate. There are, however, significant holes in our toolkit and challenges ahead. Shortcomings in methodological disclosures undermines the reliability and replicability of our research, and should be addressed as a priority. Interviews need to be spread more widely, paying more attention to individuals and businesses using financial services (Pollard, 2003). More in-depth ethnographic methods need encouragement and resources – a big challenge in the pandemic context. At the same time, rising qualitative and mixed-methods research, with case studies in the lead, need to improve transferability, to support financial geography as a collective project with an ambitious scope. On the quantitative side, advanced methods going beyond descriptive statistics need to be encouraged (again), to stem the threat of numerical illiteracy. Financial geography needs to use maps more and take advantage of big data. While analysing the authors was not the subject of this report, improving our methods must also go hand in hand with improving the diversity of our interdisciplinary community across gender, race, class, location and other axes of difference.
Footnotes
Acknowledgments
I am grateful for suggestions and comments from William Bratton, Noel Castree, Gordon L Clark, and Alex Hughes.
Declaration of conflicting interests
The author(s) declared no potential conflicts of interest with respect to the research, authorship, and/or publication of this article.
Funding
The author(s) disclosed receipt of the following financial support for the research, authorship, and/or publication of this article: I have received funding from the European Research Council (ERC) under the European Union’s Horizon 2020 research and innovation programme (grant agreement number 681337). The article reflects only my views and the ERC is not responsible for any use that may be made of the information it contains.